Introduction
Prostaglandins, including prostaglandin E2 (PGE2),
are functionally active lipids generated from arachidonic acid by
the enzymatic activity of the cyclooxygenase (COX) isoforms, COX1
and COX2 (1). It has been reported
that blocking COX activity with non-steroidal anti-inflammatory
drugs (NSAIDs) may reduce the risk of colorectal cancer development
(1) and may even prolong the
survival of patients with systemic progressive cancer (2). Thus, it is well-recognized that
prostaglandins, and particularly PGE2, play a crucial role in tumor
growth and progression (1,3). PGE2 exerts its effects through the
interaction with E-prostanoid receptors, EP1-4. Therefore, the
effects of PGE2 on tumor growth and progression may depend on the
arrangement of EP receptor expression on the cell surface, since
each receptor exerts distinct downstream signaling effects
(1). In our previous studies on
colorectal tumors, it was demonstrated that EP1 and EP2 subtype
receptor proteins were highly expressed in tumor epithelial cells,
with more limited expression in the tumor stroma. EP3 occurred
occasionally in tumor cells, while EP4 was not detected at all
(4). Additionally, tumor tissue
EP2 and COX2 expression have been previously reported to predict a
poor survival of patients with colorectal cancer (4,5).
The importance of EP2 receptor for tumor growth has
also been previously confirmed in several mouse tumor models
(6–10). Thus, our previous experiments
revealed reduced tumor growth, as well as reduced systemic
inflammation and altered immune responses in EP2 knockout mice
(9,10). Such findings suggested that host
derived factors related to the tumor microenvironment, may support
reduced tumor growth, due to the fact that implanted tumor cells
were wild-type in both EP2 knockout and control mice (10). Furthermore, gene expression in
tumors has been mapped in order to understand signaling activities
behind reduced tumor growth, linked to the expression alterations
of hundreds of genes in tumors grown on EP2 knockout (10). However, such experiments were
performed on tumor tissue containing mixed cell types; tumor-,
stroma- and inflammatory cells (10). Therefore, the present study aimed
to further extend our previous studies, by evaluating gene pathway
expressions in separate tissue compartments, such as tumor tissue-
and tumor stroma compartment, respectively.
Materials and methods
Animals
Adult, age-matched, male and female EP 2 knockout
(EP2−/−) and EP 2 wild-type
(EP2+/+) mice of strain
B6.129-Ptger2tm1brey/Jackson Laboratories (11), bred on a C57BL/6 genetic
background, were used in the present study (EP2−/− n=16,
EP2+/+ n=17). Heterozygous, in-house breeding produced
EP2−/− and EP2+/+ mice.
The study was performed at a certified animal testing laboratory
(Experimental Biomedicine at University of Gothenburg), and the
study protocol was approved by the Gothenburg Regional Animal
Ethics Committee (54–2013). All animal care and experiments were
performed in accordance with national and institutional guidelines.
The animals were kept under controlled ambient conditions as
follows: Lights on from 7:00 a.m. to 7:00 p.m.; temperature,
21±1°C; relative humidity, 45–55%, and housed in plastic cages
containing wood chip bedding material and nesting pads. The animals
were provided with free access to tap water and standard laboratory
rodent chow for breeding and maintenance, respectively. The animals
were examined daily for signs of illness. Animal weights were
recorded two to three times per week as part of the ethical
protocol. No animals exhibited weight losses greater than specified
in the ethical approval (−10%).
MCG 101 tumor growth and tissue
dissection
The MCG 101 tumor is known to produce high
concentrations of PGE2 in the systemic circulation (12). This tumor model has been used for a
number of years at the Department of Surgery, University of
Gothenburg (Gothenburg, Sweden) (13). The tumor originates from a
chemically induced tumor on C57/BL6 mice (14), with a current appearance of an
epithelial-like poorly-differentiated tumor. MCG 101 tumor growth
elicits several physiological alterations similar to those observed
in clinical tumor disease, such as increased inflammation (15), anorexia with reduced food intake
(9), increased whole body
metabolism with subsequent wasting (16) and hormone alterations (17). In the present study, MCG 101 tumor
cells were cultured as previously described (14), collected by trypsin treatment
(Biochrom L2143, VWR International, LLC.), centrifuged (300 × g, 10
min, room temperature) and diluted in physiological saline solution
to a concentration of 100,000 cells/0.1 ml. The MCG 101 cells were
then injected in the thighs of the right leg [EP2+/+
n=17 (nine females and eight males), EP2−/− n=16 (eight
females and eight males)] of mice under general anesthesia
(isoflurane; inhaled concentration, 2.7%). The injected tumor cells
were not genetically modified to lack EP2 receptors. We have
previously published that tumor growth was reduced in
EP2−/− mice (10). In
order to avoid additional procedures and secure RNA quality at
tissue harvest, tumor growth was monitored by performing tumor size
estimation using Vernier caliper readings across two dimensions (mm
× mm) on day 13, the day before the end of experiment. Tumor growth
was assumed to be spherical and tumor volume was calculated using
the following formula: V=4/3 × π × r3. Calculated tumor
volumes in EP2−/− mice were 65% compared to calculated
tumor volumes in EP2+/+ mice [EP2+/+,
1103±164 mm3 (n=17); EP2−/−, 713±85
mm3 (n=16), P<0.05, Table SI]. Thus, previous observations of
reduced tumor growth in EP2−/− mice (10) were consistently also observed in
the present study. All mice were sacrificed on day 14 after the
injection of tumor cells. The mice were anesthetized with a mixture
of xylazine (5 mg/kg) and ketamine (100 mg/kg) i.p. in a volume of
0.1 ml/mouse. EDTA-blood samples were collected by cardiac
puncture, tumor and tumor-stroma tissue were thereafter dissected
under magnification (×4) into separate fractions for their
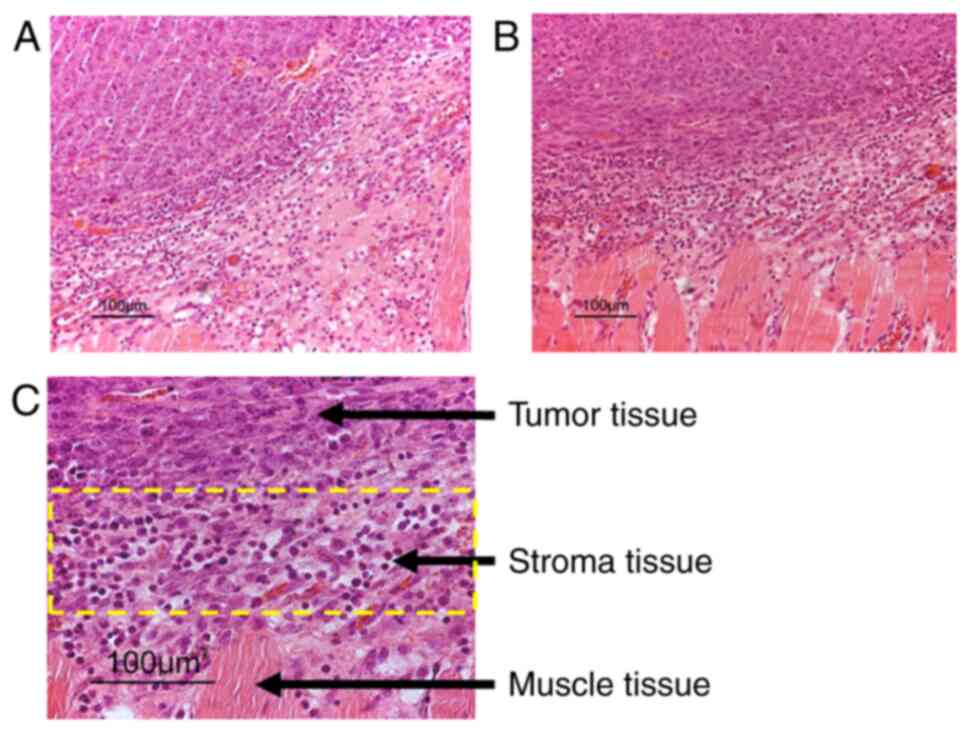
subsequent use in microarray analysis. Tumor-stroma tissue was
dissected from the tumors edge while tumor cell fractions were
dissected from middle tumor area, in order to create defined tissue
compartments (Fig. 1), as
confirmed by immunohistochemistry on random tissue sections. Tissue
samples for microarray and immunohistochemical analyses were
immediately placed in RNAlater™ solution (Thermo
Fisher Scientific, Inc.) and 4% neutral buffered paraformaldehyde,
respectively. Tissues for microarray analysis were dissected prior
to immunohistochemistry tissue sample collection. Animal death was
verified by a lack of heartbeat following blood and tissue
collection.
RNA extraction and microarray
analyses
Tumor tissue and tumor-stroma tissue from eight
wild-type (EP2+/+) and eight EP2 knockout
mice (EP2−/−), with four females and four
males included in each group, were randomly selected from available
tissues. Total RNA from each tissue was extracted using the RNeasy
Fibrous Tissue kit according to the manufacturer's protocols
(Qiagen GmbH). The quality of RNA was examined on an Agilent 2100
Bioanalyzer using an RNA 6000 Nano assay kit (Agilent Technologies,
Inc.). RNA Integrity number was >7 in all samples. The
concentrations of RNA were measured on a NanoDrop ND-1000A
spectrophotometer (NanoDrop Technologies; Thermo Fisher Scientific,
Inc.).
Cyanine-3 (Cy3)-labeled cRNA was prepared from 200
ng total RNA using the LowInput QuickAmp Labeling kit One-Color
(Agilent Technologies, Inc.) according to the manufacturer's
instructions, followed by RNeasy column purification (Qiagen,
Inc.). Dye incorporation and cRNA yields were also examined using
the NanoDrop ND-1000 Spectrophotometer. A total of 600 ng
Cy3-labeled cRNA was fragmented at 60°C for 30 min in a reaction
volume of 25 µl containing 1X Agilent fragmentation buffer and 2X
Agilent blocking agent following the manufacturer's instructions.
Upon completion of the fragmentation reaction, 25 µl 2X Agilent
hybridization buffer were added to the fragmentation mixture and
hybridized to Agilent SurePrint G3 Mouse Gene Exp v2 Array (design
ID 074809) for 17 h in a rotating Agilent G2545A hybridization oven
at 65°C. Following hybridization, microarrays were washed 1 min at
room temperature with GE Wash Buffer 1 (Agilent Technologies, Inc.)
and 1 min with 37°C GE Wash buffer 2 (Agilent Technologies, Inc.).
The slides were scanned immediately after washing on an Agilent DNA
Microarray Scanner (G2505C) using one color scan setting for 8×60 K
array slides (scan area, 61×21.6 mm; scan resolution, 3 µm; dye
channel set to green; PMT set to 100%). The scanned images were
analyzed using Feature Extraction Software 10.7.3.1 (Agilent
Technologies, Inc.), using default parameters to obtain background
subtracted and spatially detrended processed signal intensities.
The BEA Core Facility at the Karolinska Institute (Stockholm,
Sweden) performed microarray hybridization and delivered Feature
Extraction pre-processed data files for further evaluation. The
processed signal intensity values were further analyzed using
GeneSpring GX 14.9.1 software (Agilent Technologies, Inc.). The
quality control of scanned data-files was performed according to
standard procedures using Feature Extraction software and
Genespring GX QC metrics workflow.
Data workflow in Genespring GX
software
Statistical analyses and filtering options were used
to generate final datasets for downstream pathway analyses. The
options were: ‘filter on flags’ (present), moderated t-test
(P<0.1) and fold change (FC) analyses (FC ≥2.0 and ≥5.0). The
total number of entities (transcripts) present on the Agilent
SurePrint G3 Mouse Gene Exp v2 Array (Agilent Technologies, Inc.;
design ID: 074809) was 56,745. The number of entities remaining at
each level of testing was, in the stroma tissue: Filter on flags
present (31,280), moderated
t-test P<0.1 (13,762), FC2
(5,669) and FC5 (388). The number
of remaining entities in the tumor tissue were: Filter on flags
present (29,365), moderated
t-test P<0.1 (1,670), FC2 (303)
and at FC5 (1). Pathway analysis
was performed on the gene lists obtained after ‘fold change
analysis with 2.0’. The option, in GeneSpring GX 14.9.1 software
(Agilent Technologies, Inc.), of comparing gene lists with existing
pathway maps at WikiPathways (https://www.wikipathways.org/) were used in pathway
analyses, which were regarded statistically significant at the
P<0.05 significance level. Altered entities of prostaglandin
synthesis genes were searched for in gene lists created after
filtering options, filter on flags-present, moderated t-test
P<0.1 and FC>1.2 (Table
I).
 | Table I.Genes involved in prostaglandin
metabolism with significantly altered gene expression in the tumor-
and tumor stroma compartment in EP2−/− mice, as compared
with wild-type EP2+/+ mice (P<0.1, fold change
≥1.2). |
Table I.
Genes involved in prostaglandin
metabolism with significantly altered gene expression in the tumor-
and tumor stroma compartment in EP2−/− mice, as compared
with wild-type EP2+/+ mice (P<0.1, fold change
≥1.2).
|
|
| Regulation fold
change |
|---|
|
|
|
|
|---|
| Gene name |
Enzyme/receptor | Tumor | Stroma |
|---|
| PG metabolism |
|
|
|
|
Ptgs1 | COX1 | - | ↑ 1.8 |
|
Ptgs2 | COX2 | - | ↓ 4.1 |
| PG synthases |
|
|
|
|
Ptges | mPGES | - | ↓ 2.4 |
|
Ptges3 | cPGES | ↓ 1.3 | ↓ 1.3 |
| PGE2 |
|
|
|
|
Ptger2 | EP2 | ↑ 1.8 | ↑ 2.0 |
| PGF2α |
|
|
|
|
Ptgfr | FP | - | ↓ 2.8 |
|
PGI2 |
|
|
|
|
Ptgir | IP | ↓ 1.7 | ↑ 1.7 |
| Nuclear
receptors |
|
|
|
|
Ppara | PPARα | - | ↑ 3.5 |
|
Pparg | PPARγ | - | ↑ 2.4 |
Immunohistochemistry
Tissues cut to include tumor, tumor-stroma and
muscle cells were fixed in 4% neutral buffered formaldehyde
solution and embedded in paraffin. Sections at a thickness of 4 µm
from eight wild-type (EP2+/+) and eight knockout
(EP2−/−) animals, four females and four males in each
group, were prepared. The sections were deparaffinized in
Histolab-Clear (Histolab Products AB), rehydrated in graded ethanol
washes, and microwave heated for antigen retrieval (350 W, 5 min
and 500 W, 5 min) in 10 mM sodium citrate buffer, pH 6 (COX2 and
Ki-67) or 10 mM Tris, 1 mM EDTA solution, pH9 (CD4 and CD8).
Immunohistochemistry was performed using the MACH 1 Universal
HRP-Polymer detection kit including peroxidase and protein block,
according to manufacturer's instructions (Biocare Medical, LLC,
cat. no. M1U539 G, L10). Primary antibodies were diluted in Da
Vinci Green antibody diluent (Biocare Medical, LLC) and incubated
at 4°C overnight. The primary antibodies used were as follows:
Rabbit monoclonal, anti-Ki-67 (1:200, cat. no. GTX16667, GeneTex,
Inc.), rabbit polyclonal anti-COX2 (1:250; cat. no. ab15191,
Abcam), rabbit monoclonal anti-CD8 alpha (1:500; cat. no. ab217344,
Abcam) or rabbit polyclonal anti-CD4 antibody (1:3,000; cat. no.
PA5-87425, (Invitrogen; Thermo Fisher Scientific, Inc.). Secondary
antibody [MACH 1 Universal HRP-Polymer (Biocare Medical, LLC)]
incubation was performed for 30 min at room temperature. Staining
was visualized by ~5 min of incubation at room temperature in
3,3′-diaminobenzidine (DAB) solution, followed by washing and
hematoxylin counterstaining for 1–5 min at room temperature in
undiluted Mayers HTX solution (cat. no. 01820, Histolab Products
AB). Negative controls, with the omission of primary antibody
incubation were included for each group, EP2+/+ and
EP2−/−.
Scoring of immunohistochemical
staining
For scoring, two independent evaluators manually
determined Ki-67+ and CD8+ cell numbers, and
three independent evaluators determined COX2+ staining
intensity from 16 immunohistochemical tissue sections. Scoring was
performed in a blinded manner, without having any information on
the tissue genotype. For Ki-67, a three-grade scale was used to
estimate the number of KI-67+ cells in the areas of
tumor and tumor stroma cells, summarized into an overall grade from
each evaluator. A section presenting with the lowest number of
Ki-67+ cells was ranked as grade 1, one with the highest
number of Ki-67+ cells was ranked as grade 3, while when
neither high nor low Ki-67+ cell levels were observed in
a selected section, it was ranked as grade 2.
For COX2, a three-grade scale was also used for the
overall COX2 staining intensity. In addition to the overall
evaluation of staining intensity, COX2 staining was evaluated in
three different areas, respectively: Areas consisting of mainly
tumor cells, tumor-stroma cells, or areas that seemingly had
presence of infiltrating immune cells, judged by morphological cell
appearance. Such areas were graded according to high or low COX2
protein expression.
CD8+ cells were evaluated with a
three-grade scoring in the tumor area. The CD4+ staining
results were not graded. Approximately 5–10 selected fields in each
section were evaluated for Ki-67, COX2 and CD8 staining,
respectively. For statistical evaluation, the results of all
evaluators were either combined into a mean score (Mann-Whitney U
tests, n=8 per group) or treated as independent results from each
evaluator (Fisher's exact test was applied, n=16 or n=24 per
group). Images were captured using a Nikon E400 light microscope
(Nikon Corporation) with magnifying power ranges between ×100 to
×400, equipped with a Nikon DS-Fi3 camera (Nikon Corporation) and
NIS elements BR software version 5.30.02 (Nikon Instruments,
Inc.).
Statistical analysis
The statistical evaluation of the microarray data
was performed using GeneSpring GX 14.9.1 software, as described in
the ‘Materials and methods’. A statistical significance level
cut-off value of P<0.1 was applied in filtering options to
select final datasets of altered transcripts in tumor and stroma
tissue, for subsequent pathway analysis, since remaining transcript
numbers in tumor tissue were below necessary items for pathway
analysis at lower significance level. Pathway analyses were
regarded statistically significant at P<0.05.
Immunohistochemical analysis results were evaluated using the
Mann-Whitney U-test and Fisher's exact test. Evaluator scores were
combined into a single mean score for each tissue section in
Mann-Whitney U test evaluations (n=8 per group); however, scores
were treated as independent results from each evaluator in Fisher's
exact test evaluation, giving n=16 or 24 per group (two or three
independent evaluators). Tumor volumes were compared using a
t-test. P<0.05 was considered to indicate a statistically
significant difference in two-tailed tests.
Results
Immunohistochemistry
Tissue sections used for immunohistochemistry
detection included regions of both the tumor and tumor-stroma,
which were evaluated for Ki-67, COX2, CD4 and CD8 protein
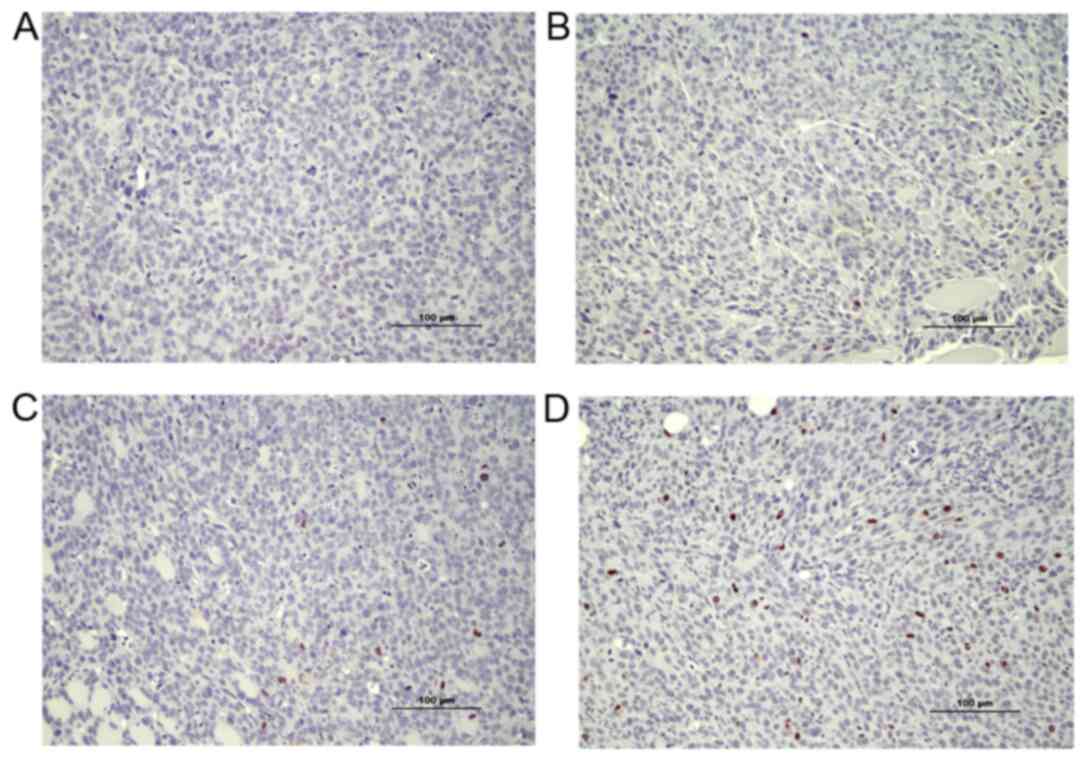
expression. Ki 67 protein was analyzed as a marker to estimate cell
proliferation. Overall, a lower number of Ki-67-positive cells was
observed in tissues from EP2−/− compared to
EP2+/+ mice [Mann-Whitney U-test, rank-sum 48.5 in
EP2−/−, and 87.5 in EP2+/+ mice, n=8/group,
P<0.05 (examples of scoring intensities are shown in Fig. 2)]. The estimation of cell cycle
activities by Ki-67 protein were in line with the microarray
analysis results, demonstrating downregulation in cell cycle
control (as shown below). Morphologically, Ki-67 staining appeared
in the nucleus of most cells as was expected; however, Ki-67
expression was also observed occasionally in the cytoplasm of cells
(Fig. 2).
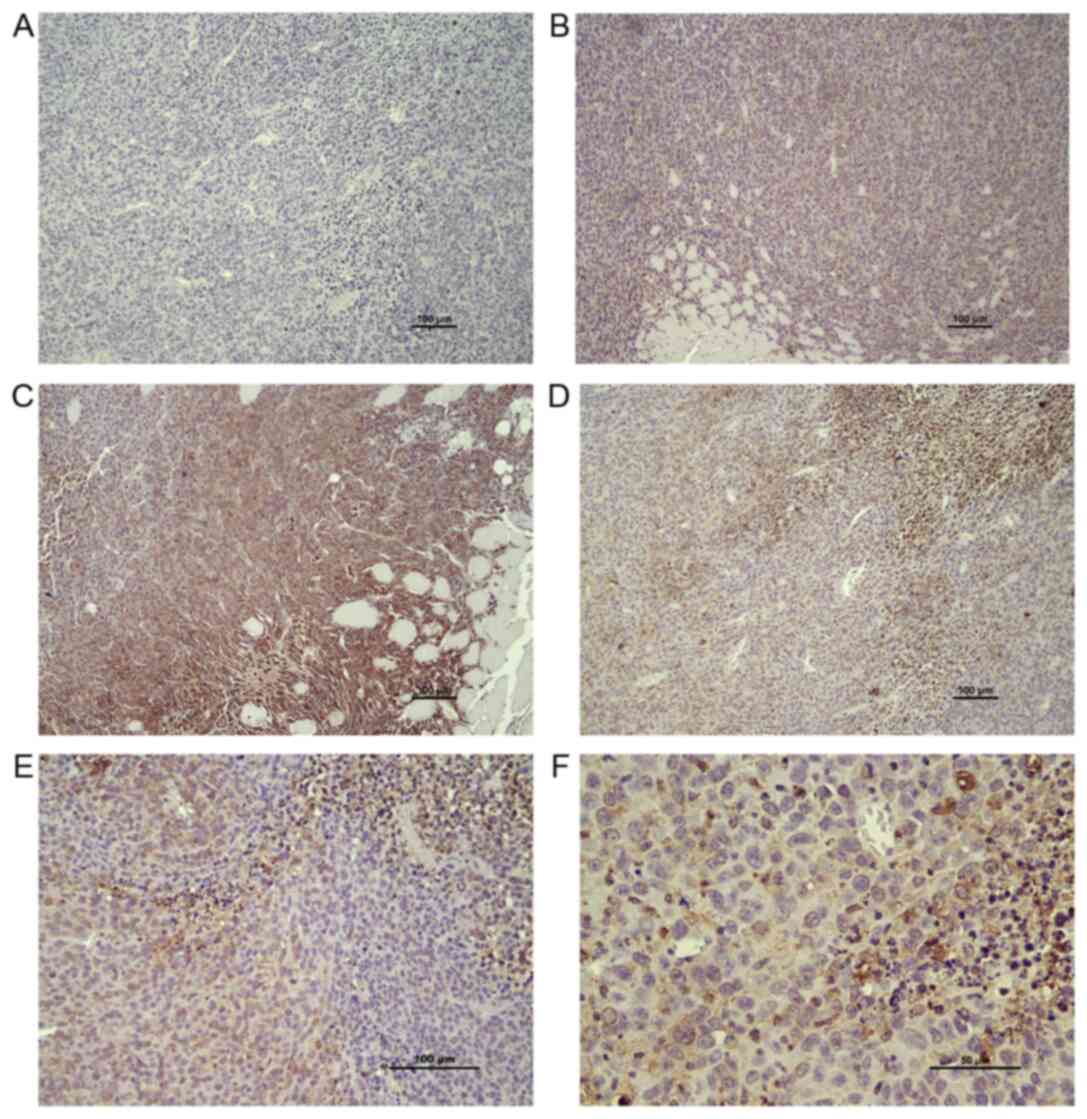
An irregular pattern of COX2 protein staining was
observed in both EP2−/− and EP2+/+ mice
(Fig. 3A-F). COX2 protein
expression was observed in both the tumor stroma and tumor
compartments, with a trend towards an increased COX2 protein
expression in stroma areas as compared with central areas of the
tumor according to microscopic inspection. No statistically
significant difference in COX2 protein expression was observed in
tumor and stroma compartments from EP2−/− and
EP2+/+ mice, according to their evaluation as a combined
mean overall score of staining intensity (graded low, median, high,
P>0.05 Mann-Whitney U test, n=8/group). However, significantly
more tissue sections from the EP2−/− group were graded
as low COX2 staining intensity (P<0.05, Fisher's exact test;
EP2−/− n=10, EP2+/+ n=2, n
total=24/group).
In addition to the overall evaluation of COX2
staining, we performed a separate evaluation of tissue areas
classified as: Areas mainly containing tumor cells, areas with
tumor-stroma interactions and areas with assumed immune cell
infiltration, as judged by morphological cell appearance (staining
intensity graded either low or high). A high intensity of COX2
protein expression was found in several tumor areas with
infiltration of immune cells (Fig.
3D). However, a statistically significant difference between
genotypes was not detected for any of the specific tissue areas
(P>0.05). Thus, the immunohistochemical analysis of COX2 protein
expression confirmed a lower overall COX2 protein expression in
tumors grown in EP2−/− mice; however, the reduced COX2
protein expression could not be related to specific cell types;
tumor cells, stroma, immune cells.
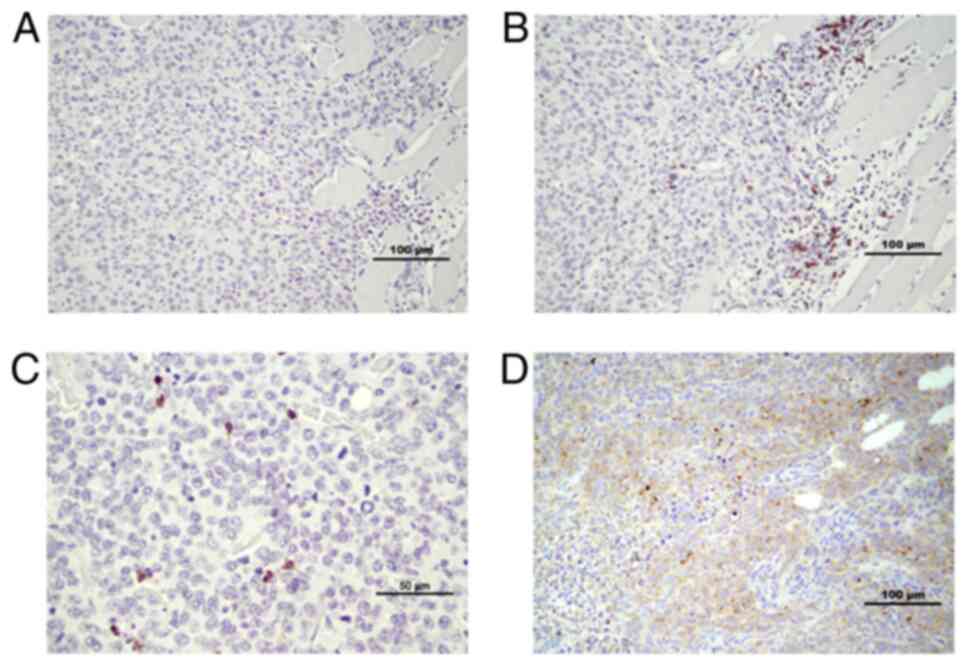
CD4 and CD8 staining was performed, in order to
evaluate immune cell presence in tumor tissue compartments. CD8 has
been reported to appear mainly on cytotoxic T-lymphocytes, and is
also found on natural killer cells (18). CD4 may occur on several types of
cells, including T-helper cells, antigen presenting cells and
macrophages (19). CD8+
cells appeared in clusters in the tumor-stroma compartment; in
contrast, they appeared as ‘single’ infiltrating cells in the tumor
compartment (Fig. 4B and C).
Tumors from EP2−/− mice appeared to have more
infiltrating CD8+ cells in the tumor compartment at
microscopic inspection. Accordingly, significantly more tissue
sections from the EP2−/− group were graded as having a
high infiltration of CD8+ cells (P<0.05,
EP2+/+ n=0, EP2−/− n=5; total, n=16/group,
Fisher's exact test). CD4+ cells appeared in stroma
areas, as well as infiltrating cells irregularly dispersed
throughout the tumor compartment in both EP2+/+ and
EP2−/− mice samples (Fig.
4D, IHC scoring not performed).
Microarray analyses
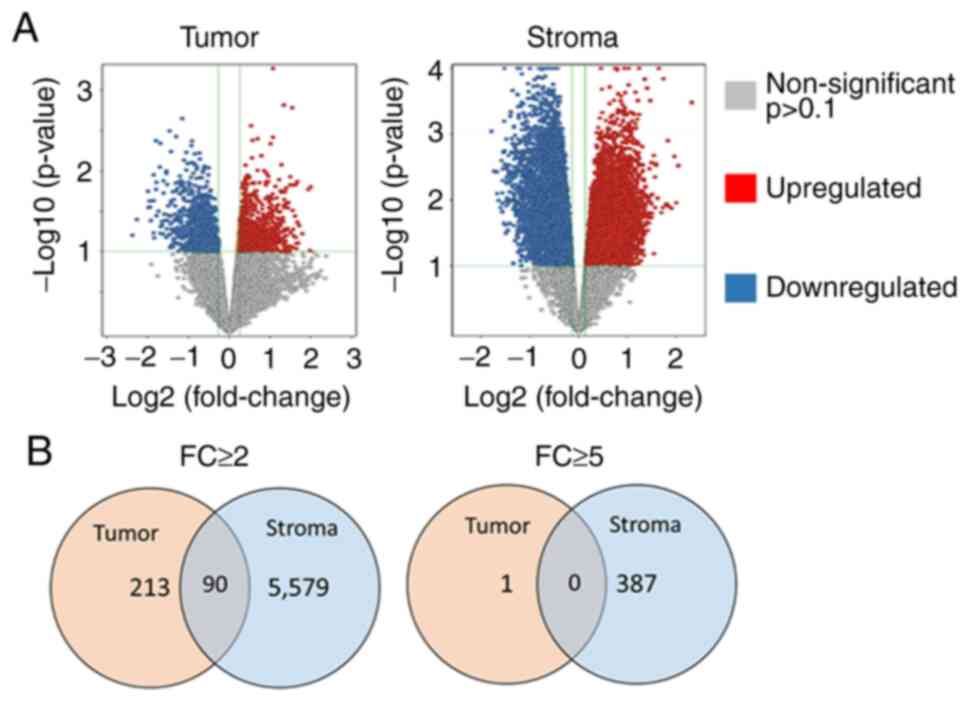
Overall, a significantly higher number of altered
entities (transcripts; upregulated or downregulated) were observed
in the stroma compartment compared to the tumor compartment in
EP2−/− compared to EP2+/+ mice (Fig. 5A). In the tumor-stroma, almost 10%
of all entities (transcripts) (5,669/56,745) exhibited an altered
gene expression (P<0.1, FC ≥2.0), whereas only 0.5% (303/56,745)
of entities from the tumor tissue displayed an altered expression
with an FC >2.0. A similar pattern was also consistent at an
increased FC difference (FC ≥5.0). A larger number of highly
altered entities, ~0.7% (388/56,745), were observed in the stroma
tissue, while only one entity from tumor tissue displayed such a
large alteration in gene expression between EP2 receptor-deficient
mice and wild-type mice (Fig.
5B).
In our previous study, gene expression was
determined in ‘whole-tumor tissue’ including both tumor cells, and
stroma, and also including inflammatory cells (10). In the present study, tumors were
dissected into tumor- and tumor stroma compartments, and the Venn
diagram illustrates that the tissue preparation technique was
successful in separating the tissue types, since few altered
transcripts occurred in both gene-sets. Thus, each tissue type,
tumor tissue and stroma, demonstrated specific alterations in gene
expression in response to host knockout of the EP2 receptor
(Fig. 5B).
Alterations of prostaglandin-related
genes
Transcripts of genes involved in prostaglandin
metabolism were altered in both tumor and stroma compartments. More
alterations, related to prostaglandin production and metabolism,
occurred in the stroma in comparison with tumor compartment
(Table I).
In the stroma, COX1 and COX2 transcripts displayed
an inverse appearance, with upregulation of COX1 and downregulation
of COX2 transcript levels in response to host knockout of EP2
receptors. However, COX1 and COX2 transcripts were not
significantly altered in tumor tissue. The prostaglandin-synthase
enzymes, prostaglandin E synthase 3 (cPGES; COX1-activity) and
prostaglandin E synthase (mPGES; COX2-activity) were downregulated
in both the stroma and tumor tissues. Among the prostaglandin
specific receptors, FP receptor (PGF2α) was downregulated in the
stroma, while prostaglandin I2 (PGI2) was
upregulated in stroma and downregulated in tumor tissue, suggesting
significance of specific transcript alterations involved in
prostaglandin metabolism. Nuclear receptors, Peroxisome
proliferator-activated receptor α (PPARα) and γ (PPARγ) were
upregulated in the stroma tissue only (Table I).
Pathway analysis
Analysis at an FC of 2.0 resulted in 112 matched
WikiPathways in stroma and 37 matching WikiPathways in tumor
compartment; at an FC of 5.0, 27 pathways matched in the stroma and
only one matched pathway was found in the tumor compartment
(P<0.05 for all pathways (data not shown). However, several
pathways represented similarities with overlapping biological
functions. Significantly matched pathways, including high numbers
of matched entities with known importance for tumor growth, were
grouped into tables, according to tissue type and its role in
cellular environment functions.
Statistically significant pathways in
both tumor- and stroma compartments
Several significant pathways were observed in both
stroma and tumor tissue (Table
II). Selected pathways associated with intracellular signaling
(PI3K, Wnt and TGFβ) and immune responses [T- and B-cell receptor
signaling, chemokine signaling, double-stranded RNA-specific
adenosine deaminase (Adar1)-editing] are presented in Table II. The majority of pathways
displayed both upregulation and downregulation of gene
transcription in response to the absence of EP2 receptor signaling.
Some pathways displayed a uniform regulation pattern in the absence
of EP2 receptor (Table II).
Pathways that display a consistent pattern of expression may be of
particular interest to find specific targets related to the reduced
tumor growth observed in EP2 receptor-deficient mice. The immune
response pathway ‘Adar1 editing deficiency response’, was uniformly
upregulated in both stroma and tumor compartment. This pathway
involved different types of interferon (IFN) activated genes and
2′-5′ oligoadenylate synthetases in the stroma, while in tumor
tissue, only a few genes were altered (all upregulated); among
these being chemokine (C-X-C motif) ligand 10 (Cxcl10;
Table III).
| Table II.Signaling pathways with statistical
significance in both the tumor- and tumor stroma compartments when
performed on transcripts (entities) with a fold change >2.0. |
Table II.
Signaling pathways with statistical
significance in both the tumor- and tumor stroma compartments when
performed on transcripts (entities) with a fold change >2.0.
|
| Tumor tissue | Stroma tissue |
|---|
|
|
|
|
|---|
| Significant
pathways | No. of
pathways | Matched
transcripts/total transcripts in pathway | Regulation | P-values | No. of
pathways | Matched
transcripts/total transcripts in pathway | Regulation | P-values |
|---|
| Intracellular
signaling |
|
|
|
|
|
|
|
|
| P13K
Akt | 1 | 6/330 | ↓55% | 0.0074 | 1 | 61/330 | ↓35% | 2.41E-06 |
| mTOR
signaling |
|
| ↑33% |
|
|
| ↑65% |
|
| Wnt
signaling | 1 | 2/60 | ↑100% | 0.040 | 4 | 18/60 | ↓65% | 2.67E-05 |
|
|
|
|
|
|
| 10/37 | ↑35% | 0.003818 |
|
|
|
|
|
|
| 27/109 |
| 1.62E-05 |
|
|
|
|
|
|
| 24/97 |
| 3.98E-05 |
| TGFβ
signaling | 1 | 3/52 | ↓33% | 0.00271 | 1 | 10/52 | ↓32% | 0.0411 |
|
|
|
| ↑66% |
|
|
| ↑69% |
|
| Immune
responses |
|
|
|
|
|
|
|
|
| T-cell
receptor | 1 | 7/133 | ↑100% | 7.49E-06 | 1 | 22/133 | ↓8.3% | 0.0189 |
|
signaling |
|
|
|
|
|
| ↑91.7% |
|
| B-cell
receptor | 2 | 4/156 | ↑100% | 0.00991 | 2 | 27/156 | ↓27% | 0.0061 |
|
signaling |
|
|
|
|
|
| ↑73% |
|
|
Chemokine | 1 | 11/191 | ↓8% | 5.01E-09 | 1 | 36/191 | ↓21% | 1.35E-04 |
|
signaling |
|
| ↑92% |
|
|
| ↑79% |
|
|
Adar1-editing | 1 | 3/78 | ↑100% | 0.0065 | 1 | 22/78 | ↑100% | 1.95E-06 |
|
deficiency response |
|
|
|
|
|
|
|
|
| Table III.Genes in WikiPathway Adar1-editing
deficiency response (WP3415_104961) with an altered expression in
either the stroma- or tumor tissue from EP2−/− compared
to EP2+/+ mice. |
Table III.
Genes in WikiPathway Adar1-editing
deficiency response (WP3415_104961) with an altered expression in
either the stroma- or tumor tissue from EP2−/− compared
to EP2+/+ mice.
| Tissue | Significant
genes | Gene ID | FC
valuea | Gene name |
|---|
| Stroma tissue |
|
|
|
|
|
| Ddx60 | 234311 | +2.5 | DEAD
(Asp-Glu-Ala-Asp) box polypeptide 60 |
|
| Dhx58 | 80861 | +2.2 | DEXH
(Asp-Glu-X-His) box polypeptide 58 |
|
|
F830016B08Rik | 240328 | +3.0 | RIKEN cDNA
F830016B08 gene |
|
| Gbp6 | 100702 | +2.7 | Guanylate binding
protein 6 |
|
| Gm12185 | 620913 | +2.7 | Predicted gene
12185 |
|
| Gm4951 | 240327 | +2.5 | Predicted gene
4951 |
|
| Ifi213 | 623121 | +3.5 | Interferon
activated gene 213 |
|
| Iigp1 | 60440 | +2.8 | Interferon
inducible GTPase 1 |
|
| Irf7 | 54123 | +2.6 | Interferon
regulatory factor 7 |
|
| Ly6a | 110454 | +2.0 | Lymphocyte antigen
6 complex, locus A |
|
| Ly6c1 | 17067 | +2.1 | Lymphocyte antigen
6 complex, locus C1 |
|
| Mx2 | 17858 | +2.3 | MX dynamin-like
GTPase 2 |
|
| Oas1a | 246730 | +2.1 | 2′-5′
Oligoadenylate synthetase 1A |
|
| Oas1g | 23960 | +2.3 | 2′-5′
Oligoadenylate synthetase 1G |
|
| Oas2 | 246728 | +3.8 | 2′-5′
Oligoadenylate synthetase 2 |
|
| Oas3 | 246727 | +2.6 | 2′-5′
Oligoadenylate synthetase 3 |
|
| Oasl1 | 231655 | +2.3 | 2′-5′
Oligoadenylate synthetase-like 1 |
|
| Oasl2 | 23962 | +2.4 | 2′-5′
Oligoadenylate synthetase-like 2 |
|
| Sp100 | 20684 | +2.1 | Nuclear antigen
Sp100 |
|
| Traf6 | 22034 | +2.0 | TNF
receptor-associated factor 6 |
|
| Xaf1 | 327959 | +2.0 | XIAP associated
factor 1 |
|
| Zbp1 | 58203 | +2.5 | Z-DNA binding
protein 1 |
| Tumor tissue |
|
|
|
|
|
| Iigp1 | 60440 | +2.6 | Interferon
inducible GTPase 1 |
|
| Cxcl10 | 15945 | +2.5 | Chemokine (C-X-C
motif) ligand 10 |
|
| Tgtp2 | 100039796 | +2.4 | T-cell specific
GTPase 2 |
Statistically significant pathways in
stroma compartment, only
Pathway maps related to Cell cycle control was among
the most statistically significant matches (P<0.001; Table IV). Almost every cell cycle
control-associated gene was downregulated with only few of those
genes upregulated. Cell-dependent kinases (Cdks) and
minichromosome maintenance complex components (Mcms) formed
the majority of decreased transcripts, while increased expression
was displayed for RB transcriptional corepressor 1 (RB1),
growth arrest and DNA-damage-inducible 45a (Gadd45a), and
cyclin-dependent kinase inhibitor 1C (P57) (Cdkn1c) in G1 to
S cell cycle pathway (Table V).
Thus, decreased cell division in stroma may be a major observation
related to reduced tumor growth in EP2-deficient hosts.
| Table IV.Statistically significant pathways in
either the tumor- or stroma tissue only. Pathway analysis were
performed on transcripts (entities) with a fold change >2. |
Table IV.
Statistically significant pathways in
either the tumor- or stroma tissue only. Pathway analysis were
performed on transcripts (entities) with a fold change >2.
| Tissue Pathway
function Pathway name | No. of
pathways | P-value range | Regulation | Matched
transcripts/total transcripts in pathway |
|---|
| Tumor |
|
|
|
|
| Intracellular
signaling |
|
|
|
|
|
Type II interferon
signaling (IFNG) | 1 | 5.59E-10 | ↑100% | 7/34 |
| Immune
response |
|
|
|
|
|
Cytokine and
inflammatory responses | 1 | 1.25E-05 | ↓50 % ↑50% | 4/30 |
|
Inflammatory
response pathway | 1 | 5.44E-04 | ↓25% ↑75% | 3/30 |
| Stroma |
|
|
|
|
| Intracellular
signaling |
|
|
|
|
|
MAPK
signaling | 2 | 4.37E-05 | ↓29% ↑71% | 35/167 |
|
|
| 4.37E-04 |
| 31/159 |
|
miR-193a and MVP
in colon cancer metastasis | 1 | 0.0179 | ↓100% | 3/7 |
| Metabolic
signaling |
|
|
|
|
|
Prostaglandin
synthesis | 1 | 3.56E-05 | ↓67% ↑33% | 12/31 |
| Cell cycle
control |
|
|
|
|
|
Cell cycle | 2 | 4.95E-22 | ↓83% ↑17% | 45/88 |
|
Cell cycle | 1 | 9.21E-22 |
| 45/88 |
|
G1 to S-cell cycle
control | 2 | 2.84E-20 | ↓91% ↑9% | 36/62 |
| Receptor
signaling |
|
|
|
|
|
TGFβ receptor
signaling | 2 | 7.08E-05 | ↓50% ↑50% | 32/150 |
|
EGFR1
signaling | 1 | 0.0013 | ↓30% ↑70% | 32/176 |
| Nuclear
receptors |
|
|
|
|
|
PPAR
signaling | 1 | 1.69E-04 | ↓18% ↑82% | 20/85 |
|
Nuclear receptors
signaling | 1 | 0.00133 | ↓5.5% ↑94.4% | 11/38 |
|
Nuclear receptor
in lipid metabolism and toxicity | 1 | 0.01015 | ↑100% | 8/30 |
| Table V.Genes in WikiPathway G1 to S cell
cycle (WP413_84705) with an altered expression in stroma tissue
from EP2−/− compared to EP2+/+ mice. |
Table V.
Genes in WikiPathway G1 to S cell
cycle (WP413_84705) with an altered expression in stroma tissue
from EP2−/− compared to EP2+/+ mice.
| Significant
genes | Gene ID | FCa | Known
function/name |
|---|
| Ccnd1 | 12443 | −3.1 | Cyclin D1 |
| Ccnd2 | 12444 | −2.0 | Cyclin D2 |
| Ccne1 | 12447 | −2.9 | Cyclin E1 |
| Cdc45 | 12544 | −2.8 | Cell division cycle
45 |
| Cdk1 | 12534 | −4.5 | Cyclin-dependent
kinase 1 |
| Cdk2 | 12566 | −2.3 | Cyclin-dependent
kinase 2 |
| Cdk4 | 12567 | −2.4 | Cyclin-dependent
kinase 4 |
| Cdk6 | 12571 | −2.5 | Cyclin-dependent
kinase 6 |
| Cdkn1c | 12577 | +2.6 | Cyclin-dependent
kinase inhibitor 1C (P57) |
| Cdkn2a | 12578 | −5.1 | Cyclin-dependent
kinase inhibitor 2A |
| E2f5 | 13559 | −2.3 | E2F transcription
factor 5 |
| Gadd45a | 13197 | +3.3 | Growth arrest and
DNA-damage-inducible 45 alpha |
| Mcm2 | 17216 | −2.4 | Minichromosome
maintenance complex component 2 |
| Mcm3 | 17215 | −3.0 | Minichromosome
maintenance complex component 3 |
| Mcm4 | 17217 | −2.5 | Minichromosome
maintenance complex component 4 |
| Mcm5 | 17218 | −3.4 | Minichromosome
maintenance complex component 5 |
| Mcm6 | 17219 | −3.1 | Minichromosome
maintenance complex component 6 |
| Mcm7 | 17220 | −2.4 | Minichromosome
maintenance complex component 7 |
| Myc | 17869 | −3.1 | Myelocytomatosis
oncogene |
| Orc1 | 18392 | −3.9 | Origin recognition
complex, subunit 1 |
| Orc2 | 18393 | −2.0 | Origin recognition
complex, subunit 2 |
| Orc5 | 26429 | −2.0 | Origin recognition
complex, subunit 5 |
| Orc6 | 56452 | −3.2 | Origin recognition
complex, subunit 6 |
| Pcna | 18538 | −2.1 | Proliferating cell
nuclear antigen |
| Pkmyt1 | 268930 | −2.8 | Protein kinase,
membrane associated tyrosine/threonine 1 |
| Pola2 | 18969 | −2.2 | Polymerase (DNA
directed), alpha 2 |
| Pole | 18973 | −3.0 | Polymerase (DNA
directed), epsilon |
| Pole2 | 18974 | −3.8 | Polymerase (DNA
directed), epsilon 2 (p59 subunit) |
| Prim1 | 19075 | −3.6 | DNA primase, p49
subunit |
| Prim2 | 19076 | −3.2 | DNA primase, p58
subunit |
| Rb1 | 19645 | +2.4 | RB transcriptional
corepressor 1 |
| Rbl1 | 19650 | −2.5 | Retinoblastoma-like
1 (p107) |
| Rpa3 | 68240 | −2.1 | Replication protein
A3 |
| Tfdp1 | 21781 | −2.2 | Transcription
factor Dp 1 |
| Trp53 | 22059 | −2.2 | Transformation
related protein 53 |
| Wee1 | 22390 | −2.2 | WEE 1 homolog 1 (S.
pombe) |
Statistically significant pathways in
tumor compartment, only
Fewer numbers of significant pathways were observed
in the tumor compartment; however, several pathways were associated
with immune activation (Table
IV). Gene transcripts in the type II IFN-γ signaling
pathway exhibited a uniform pattern of upregulation in
EP2-deficient mice (Table VI).
IFN-γ (Ifng; +3.8), IFN regulatory factor 8 (Irf8,
+2.1), Cxcl9 (+2.5) and CxclL10 (+2.5) demonstrated
increased expression in tumor tissue (Table VI), suggesting activation of type
II IFN immune response in tumors in the absence of host EP2
receptor signaling.
| Table VI.Genes in WikiPathway type II
interferon signalling (IFNG) (WP1253_71753) with altered expression
in tumor tissue from EP2−/− compared to
EP2+/+ mice. |
Table VI.
Genes in WikiPathway type II
interferon signalling (IFNG) (WP1253_71753) with altered expression
in tumor tissue from EP2−/− compared to
EP2+/+ mice.
| Significant
gene | Gene ID | FCa | Gene
name/function |
|---|
| Ciita | 12265 | +2.3 | Class II
transactivator |
| Cxcl10 | 15945 | +2.5 | Chemokine (C-X-C
motif) ligand 10 |
| Cxcl9 | 17329 | +2.5 | Chemokine (C-X-C
motif) ligand 9 |
| Cybb | 13058 | +2.3 | Cytochrome b-245,
beta polypeptide |
| Ifng | 15978 | +3.8 | Interferon
gamma |
| Irf8 | 15900 | +2.1 | Interferon
regulatory factor 8 |
| Tap1 | 21354 | +3.1 | Transporter 1,
ATP-binding cassette, sub-family B (MDR/TAP) |
Discussion
Inflammation with increased production of
prostaglandin E2 has been linked to tumor growth in different types
of cancer, and several experimental, as well as clinical studies
have demonstrated decreased carcinogenesis and cancer progression
following provision of NSAIDs (1).
Our previous research has also provided evidence of prolonged
survival of patients on anti-inflammatory treatment, despite the
occurrence of various types of metastatic tumor diseases (2). In addition, a brief 3-day
pre-operative NSAID treatment was shown to increase tumor immunity
in colorectal tumors, inducing increased antigen presenting cell
numbers, including B-cells and macrophages, in tumor epithelial
areas, while increased infiltration of cytotoxic CD8 positive
T-lymphocytes was observed in both tumor epithelium and stromal
tissues (20).
NSAIDs inhibit COX-enzymes, which are upstream
events in the production of prostanoids (1). Thus, COX inhibition suppresses
formation of PGE2 as well as other prostanoids [Prostaglandin D2
(PGD2), PGI2, PGF2α and thromboxane A2 (TXA2)]. However, the final
overall effects of PGE2 are dependent on the expression and
combination of receptors on cell surfaces, where PGE2 normally
activates four subtype receptors, EP1-4 (21). As previously reported, the absence
of host EP1 or EP2 subtype receptors decreased MCG 101 tumor
growth, while the absence of host EP3 receptors promoted tumor
growth, demonstrating that each receptor may contribute to the sum
of PGE2 effects on tumor growth (9,10,16,22).
The particular importance of EP2 receptor signaling in tumor growth
was further demonstrated in human colorectal tumors, with COX2 and
EP2 receptor expression predicting patient survival (4).
The present study expands our previously published
research concerning EP2 knockout mice, with the absence of host EP2
subtype receptor-signaling reducing tumor growth, altering tumor
gene expression and reducing systemic inflammation (9,10).
Traditionally, studies of tumor host-interaction have generally
focused on genetic alterations and signaling within tumor cells in
the tumor compartment. However, more recently the tumor
microenvironment has gained increased attention for its role in
tumor progression (23). In the
model used in the present study, only host tissues instead of tumor
cells, were genetically modified to lack EP2 receptors. Therefore,
alterations in tumor growth and intrinsic tumor gene expression
should be secondary to changes in the host response. It was thus
logical to extend previous findings by analyzing gene expression
levels separately in tumor stroma- and tumor compartments, in an
attempt to enhance the understanding of prostaglandin crosstalk
between stroma and tumor cells.
The downregulation of cell cycle control genes in
the tumor-stroma was among the most statistically significant
alterations in the present study, implicating reduced cell division
in stroma due to the lack of EP2 receptors (Tables IV and V), as confirmed by the reduced Ki-67
protein expression (Fig. 2). Mcm
and origin recognition complex genes, required for the initiation
of DNA synthesis, as well as cdk 4/6 and cyclin D transcripts were
among the decreased transcripts, while RB1 that can act as a brake
in the cell cycle, increased (Table
V). Type D cyclins are responsive to growth factors, therefore
the observed transcript alterations may indicate that lack of EP2
receptor-induced signaling reduced release of growth factors or
other mediators needed for ‘tissue remodeling’ of the tumor
microenvironment. IL-6 is probably a factor, with a 50% reduction
in plasma levels, in EP2 knockouts as demonstrated in our earlier
study (10). A similar
downregulation of cyclin D has also been found in tumors from
colorectal cancer patients receiving a 3-day pre-operative
treatment with NSAID (20).
Chemokine signaling through the CXCL9-10-11 and
C-X-C chemokine receptor type 3 (CXCR3) axis is involved in the
recruitment of immune cells, including NK and cytotoxic T-cells in
response to IFN-γ (24). It has
been reported that PGE2 may inhibit IFN-γ-induced CXCL9 and CXCL10
secretion from epithelial breast and ovarian cancer cells, and
conversely that unselective NSAIDs, including indomethacin, may
promote this release (25,26). Chemokines have also been reported
as predictors of survival in colorectal cancer (27) and advanced ovarian cancer (25) and are assumed to play a crucial
role in angiogenesis (28,29). Accordingly, the knockout of EP2
receptors upregulated transcripts of IFN related genes in the tumor
compartment, including CXCL9, CXCL10 and IFN-g (Table VI), in spite of continuous PGE2
production in tumor tissue and increased PGE2 levels in blood, in
both EP2 knockouts and wild type controls (9). Thus, the mechanisms involved in
prostaglandin regulation of chemokines, appear to not be dependent
on reduced PGE2 levels only, supported by previously published
findings that selective COX2 inhibitors and unselective NSAIDS had
opposite effects on chemokine secretion in breast and ovarian
cancer cells (25,26). Nevertheless, an improved immune
response may be a significant factor behind reduced tumor growth in
EP2 knockouts, further supported by the findings in the present
study demonstrating increased infiltration of CD8+ cells
in the tumor compartment (Fig. 4).
This may have been induced by the altered prostaglandin synthesis
in stroma (Table I) or by
alternative EP receptor-induced signaling in the absence of host
EP2 receptors. EP2 receptors and EP receptors of subtype 3 and 4
have been reported to be expressed on fibroblasts and several types
of immune cells, including macrophages, dendritic cells, NK cells
and T-cells (23).
CXCL10 has also been reported as a target in the
‘Adar1 editing deficiency response pathway’. Adar1 is an RNA
editing enzyme, deaminating adenosine bases to inosine in cellular
RNA, adding further complexity in genomic regulation by exerting
direct effects on RNA transcripts (30). Therefore, the finding of a
consistent upregulation of transcripts in the ‘ADAR 1 editing
deficiency response pathway’ is interesting (Table III). This pathway was associated
with upregulation of IFN-related gene expression in the stroma,
including IFN regulatory factor 7 (Irf7) and IFN activated gene 213
(Ifi213), known to operate as a significant barrier to tumor
formation and progression (30).
The 2′,5′-oligoadenylate synthases (Oas1, Oas2, Oas3 and Oasl)
group of enzymes are mainly known as immune regulators by IFN;
however, they have also been reported to control apoptosis and
tumorigenesis (31,32).
The expression of PPARα and PPARγ were also observed
increased in the EP2 knockout tumor stroma. In previous studies, it
has been reported that PPARγ is involved in COX-regulated cell
differentiation, apoptosis, inflammation and carcinoma development
(33,34), and that ligands for PPARγ may
inhibit the induction of the apoptosis of several carcinoma cell
types (35,36). Previous experiments evaluating the
interactions of EP2 receptor and nuclear receptors have revealed
that reduced EP2 expression by PPARγ ligands may be related to
inhibition of cellular proliferation (37).
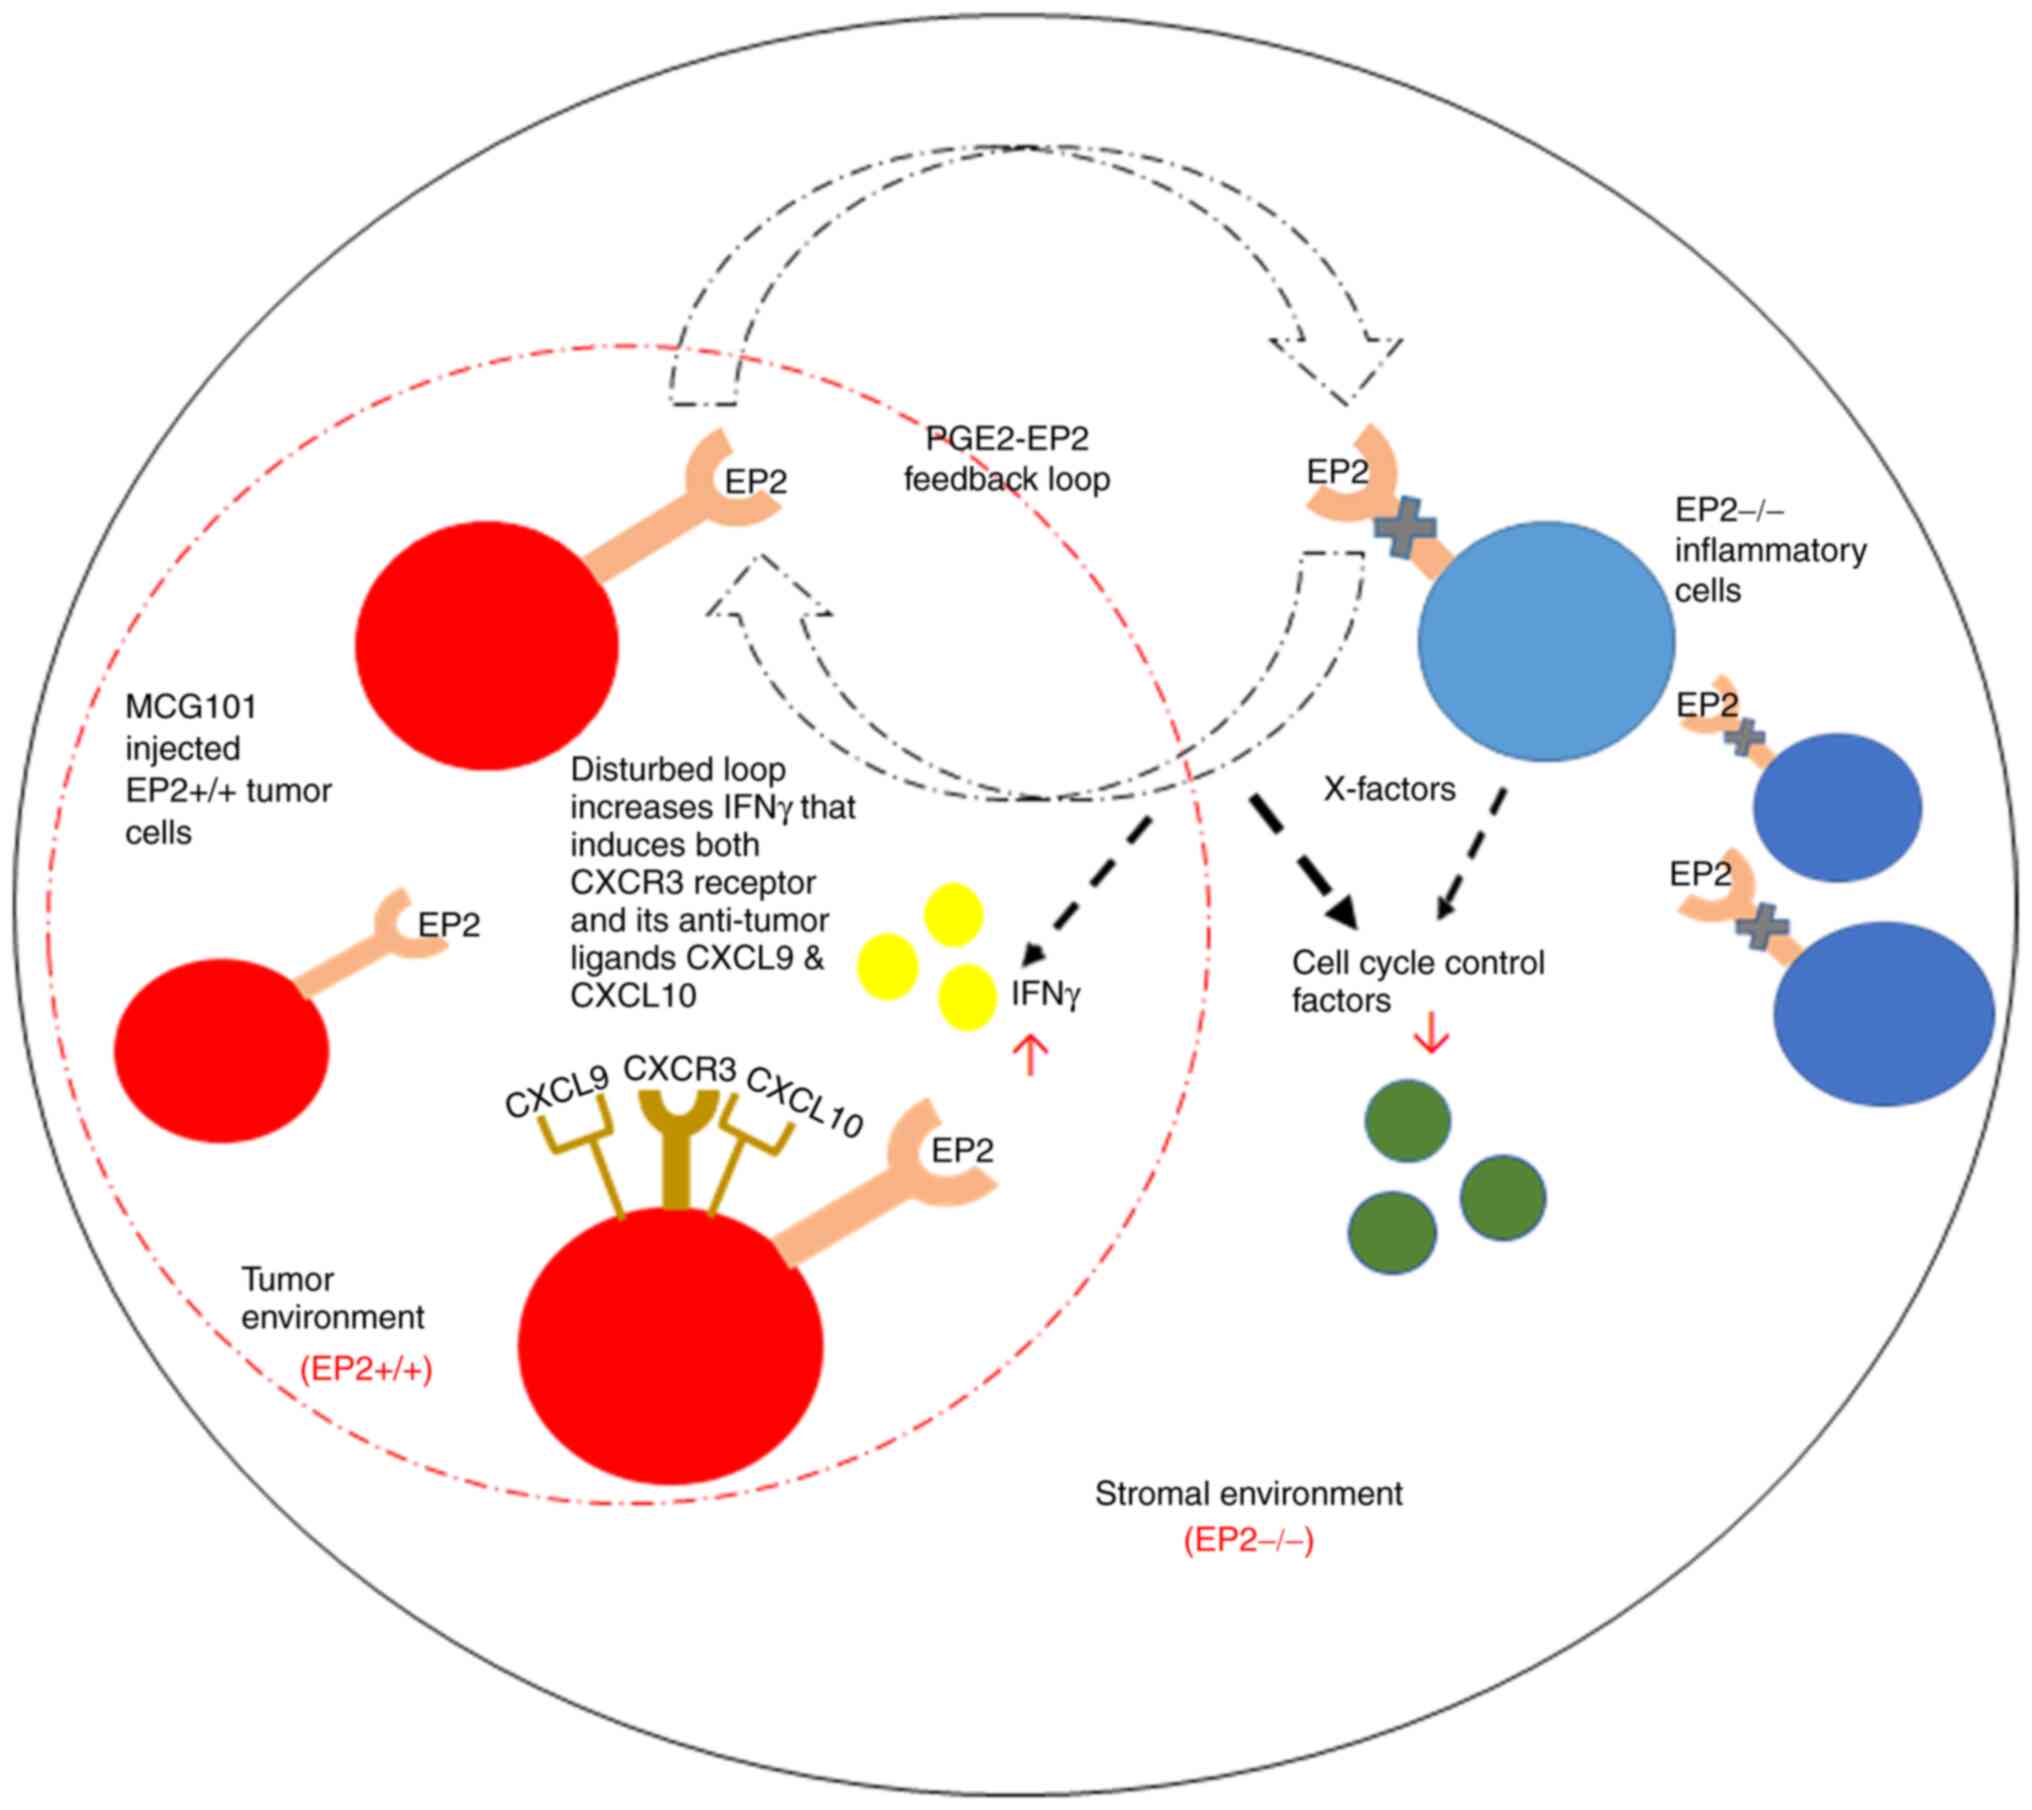
In conclusion, the results of the present study
confirmed our previous findings that the absence of host EP2
receptor signaling reduces tumor growth, probably through major
alterations in gene expressions (10). However, it was demonstrated that
cells in the tumor stroma compartment exhibited quantitatively
more, and larger (increased fold change) alterations in gene
expression, compared to the tumor tissue compartment. The overall
findings, related to processes of crosstalk between cells in stroma
and tumor compartments, suggested that both immune cells and
conventional stroma cells (macrophages and fibroblasts) may affect
tumor growth by PGE2 signaling on EP2 receptors, including
dependency of both immune- and growth-related factors (Fig. 6). The observed pathway alterations
in the tumor stroma may thus reflect physiological alterations in
normal wound healing. It would be important to discover cellular
interactions of this type for treatment and control of tumor
progression in patients without indications for surgery.
Supplementary Material
Supporting Data
Acknowledgements
The authors would like to acknowledge the expert
technical skills of research engineer Susann Fält (Dr) at NEO, BEA
(Bioinformatics and Expression Analysis core facility) at
Karolinska Institute who performed microarray hybridization.
Funding
The present study was supported by grants from the Swedish
Cancer Society (CAN 2015/400 and 200776 PjF).
Availability of data and materials
The datasets generated and analyzed during the
current study are available in the Gene Expression Omnibus (GEO)
under accession no. GSE193098.
Authors' contributions
BMI and KL contributed to the conception and design
of the experiments. MK, CE, JBF, US and BMI contributed to the
acquisition and analysis of the data. CE, US and BMI performed the
animal experiments. MK and BMI evaluated the microarrays. MK and
BMI performed the immunohistochemical analysis, and MK, JBF and BMI
evaluated the results of the immunohistochemical analysis. MK
drafted the study, which was revised by BMI and KL. MK and BMI
confirm the authenticity of all raw data. All authors critically
reviewed, and have read and approved the final version of the
manuscript. KL provided funding.
Ethics approval and consent to
participate
The Regional Animal Ethics Committee at University
of Gothenburg approved the protocol (54–2013).
Patient consent for publication
Not applicable.
Competing interests
The authors declare that they have no competing
interests.
References
|
1
|
Wang D and DuBois RN: Role of prostanoids
in gastrointestinal cancer. J Clin Invest. 128:2732–2742. 2018.
View Article : Google Scholar
|
|
2
|
Lundholm K, Gelin J, Hyltander A, Lönnroth
C, Sandström R, Svaninger G, Körner U, Gülich M, Kärrefors I, Norli
B, et al: Anti-inflammatory treatment may prolong survival in
undernourished patients with metastatic solid tumors. Cancer Res.
54:5602–5606. 1994.PubMed/NCBI
|
|
3
|
Aoki T and Narumiya S: Prostaglandin
E2-EP2 signaling as a node of chronic inflammation in
the colon tumor microenvironment. Inflamm Regen. 37:42017.
View Article : Google Scholar : PubMed/NCBI
|
|
4
|
Gustafsson A, Hansson E, Kressner U,
Nordgren S, Andersson M, Wang W, Lönnroth C and Lundholm K: EP1-4
subtype, COX and PPAR gamma receptor expression in colorectal
cancer in prediction of disease-specific mortality. Int J Cancer.
121:232–240. 2007. View Article : Google Scholar : PubMed/NCBI
|
|
5
|
Gustafsson A, Hansson E, Kressner U,
Nordgren S, Andersson M, Lönnroth C and Lundholm K: Prostanoid
receptor expression in colorectal cancer related to tumor stage,
differentiation and progression. Acta Oncol. 46:1107–1112. 2007.
View Article : Google Scholar
|
|
6
|
Sonoshita M, Takaku K, Sasaki N, Sugimoto
Y, Ushikubi F, Narumiya S, Oshima M and Taketo MM: Acceleration of
intestinal polyposis through prostaglandin receptor EP2 in
Apc(Delta 716) knockout mice. Nat Med. 7:1048–1051. 2001.
View Article : Google Scholar : PubMed/NCBI
|
|
7
|
Qiu J, Li Q, Bell KA, Yao X, Du Y, Zhang
E, Yu JJ, Yu Y, Shi Z and Jiang J: Small-molecule inhibition of
prostaglandin E receptor 2 impairs cyclooxygenase-associated
malignant glioma growth. Br J Pharmacol. 176:1680–1699. 2019.
View Article : Google Scholar
|
|
8
|
Yang L, Yamagata N, Yadav R, Brandon S,
Courtney RL, Morrow JD, Shyr Y, Boothby M, Joyce S, Carbone DP and
Breyer RM: Cancer-associated immunodeficiency and dendritic cell
abnormalities mediated by the prostaglandin EP2 receptor. J Clin
Invest. 111:727–735. 2003. View Article : Google Scholar
|
|
9
|
Iresjö BM, Wang W, Nilsberth C, Andersson
M, Lönnroth C and Smedh U: Food intake, tumor growth, and weight
loss in EP2 receptor subtype knockout mice bearing PGE2-producing
tumors. Physiol Rep. 3:e124412015. View Article : Google Scholar
|
|
10
|
Asting AG, Iresjö BM, Nilsberth C, Smedh U
and Lundholm K: Host knockout of E-prostanoid 2 receptors reduces
tumor growth and causes major alterations of gene expression in
prostaglandin E2-producing tumors. Oncol Lett.
13:476–482. 2017. View Article : Google Scholar
|
|
11
|
Kennedy CR, Zhang Y, Brandon S, Guan Y,
Coffee K, Funk CD, Magnuson MA, Oates JA, Breyer MD and Breyer RM:
Salt-sensitive hypertension and reduced fertility in mice lacking
the prostaglandin EP2 receptor. Nat Med. 5:217–220. 1999.
View Article : Google Scholar : PubMed/NCBI
|
|
12
|
Lonnroth C, Svaninger G, Gelin J, Cahlin
C, Iresjo B, Cvetkovska E, Edstrom S, Andersson M, Svanberg E and
Lundholm K: Effects related to indomethacin prolonged survival and
decreased tumor-growth in a mouse-tumor model with cytokine
dependent cancer cachexia. Int J Oncol. 7:1405–1413. 1995.
|
|
13
|
Lundholm K, Edström S, Karlberg I, Ekman L
and Scherstén T: Relationship of food intake, body composition, and
tumor growth to host metabolism in nongrowing mice with sarcoma.
Cancer Res. 40:2516–2522. 1980.PubMed/NCBI
|
|
14
|
Axelsson H, Lönnroth C, Andersson M and
Lundholm K: Mechanisms behind COX-1 and COX-2 inhibition of tumor
growth in vivo. Int J Oncol. 37:1143–1152. 2010.
|
|
15
|
Andersson C, Gelin J, Iresjö BM and
Lundholm K: Acute-phase proteins in response to tumor growth. J
Surg Res. 55:607–614. 1993. View Article : Google Scholar : PubMed/NCBI
|
|
16
|
Wang W, Andersson M, Lönnroth C, Svanberg
E and Lundholm K: Anorexia and cachexia in prostaglandin EP1 and
EP3 subtype receptor knockout mice bearing a tumor with high
intrinsic PGE2 production and prostaglandin related cachexia. J Exp
Clin Cancer Res. 24:99–107. 2005.PubMed/NCBI
|
|
17
|
Svaninger G, Lundberg PA and Lundholm K:
Thyroid hormones and experimental cancer cachexia. J Natl Cancer
Inst. 77:555–561. 1986.
|
|
18
|
McKinney EF, Cuthbertson I, Harris KM,
Smilek DE, Connor C, Manferrari G, Carr EJ, Zamvil SS and Smith
KGC: A CD8+ NK cell transcriptomic signature associated
with clinical outcome in relapsing remitting multiple sclerosis.
Nat Commun. 12:6352021. View Article : Google Scholar : PubMed/NCBI
|
|
19
|
Hansen T: Inhibition of T-cell responses
by CD4 on an antigen-presenting cell. APMIS. 114:32–38. 2006.
View Article : Google Scholar : PubMed/NCBI
|
|
20
|
Lönnroth C, Andersson M, Arvidsson A,
Nordgren S, Brevinge H, Lagerstedt K and Lundholm K: Preoperative
treatment with a non-steroidal anti-inflammatory drug (NSAID)
increases tumor tissue infiltration of seemingly activated immune
cells in colorectal cancer. Cancer Immun. 8:52008.
|
|
21
|
Woodward DF, Jones RL and Narumiya S:
International union of basic and clinical pharmacology. LXXXIII:
Classification of prostanoid receptors, updating 15 years of
progress. Pharmacol Rev. 63:471–538. 2011. View Article : Google Scholar : PubMed/NCBI
|
|
22
|
Axelsson H, Lönnroth C, Wang W, Svanberg E
and Lundholm K: Cyclooxygenase inhibition in early onset of tumor
growth and related angiogenesis evaluated in EP1 and EP3 knockout
tumor-bearing mice. Angiogenesis. 8:339–348. 2005. View Article : Google Scholar : PubMed/NCBI
|
|
23
|
Mizuno R, Kawada K and Sakai Y:
Prostaglandin E2/EP signaling in the tumor microenvironment of
colorectal cancer. Int J Mol Sci. 20:62542019. View Article : Google Scholar
|
|
24
|
Tokunaga R, Zhang W, Naseem M, Puccini A,
Berger MD, Soni S, McSkane M, Baba H and Lenz HJ: CXCL9, CXCL10,
CXCL11/CXCR3 axis for immune activation-a target for novel cancer
therapy. Cancer Treat Rev. 63:40–47. 2018. View Article : Google Scholar : PubMed/NCBI
|
|
25
|
Bronger H, Singer J, Windmüller C, Reuning
U, Zech D, Delbridge C, Dorn J, Kiechle M, Schmalfeldt B, Schmitt M
and Avril S: CXCL9 and CXCL10 predict survival and are regulated by
cyclooxygenase inhibition in advanced serous ovarian cancer. Br J
Cancer. 115:553–563. 2016. View Article : Google Scholar : PubMed/NCBI
|
|
26
|
Bronger H, Kraeft S, Schwarz-Boeger U,
Cerny C, Stöckel A, Avril S, Kiechle M and Schmitt M: Modulation of
CXCR3 ligand secretion by prostaglandin E2 and cyclooxygenase
inhibitors in human breast cancer. Breast Cancer Res. 14:R302012.
View Article : Google Scholar : PubMed/NCBI
|
|
27
|
Kistner L, Doll D, Holtorf A, Nitsche U
and Janssen KP: Interferon-inducible CXC-chemokines are crucial
immune modulators and survival predictors in colorectal cancer.
Oncotarget. 8:89998–90012. 2017. View Article : Google Scholar
|
|
28
|
Dufour JH, Dziejman M, Liu MT, Leung JH,
Lane TE and Luster AD: IFN-gamma-inducible protein 10 (IP-10;
CXCL10)-deficient mice reveal a role for IP-10 in effector T cell
generation and trafficking. J Immunol. 168:3195–3204. 2002.
View Article : Google Scholar
|
|
29
|
Angiolillo AL, Sgadari C, Taub DD, Liao F,
Farber JM, Maheshwari S, Kleinman HK, Reaman GH and Tosato G: Human
interferon-inducible protein 10 is a potent inhibitor of
angiogenesis in vivo. J Exp Med. 182:155–162. 1995. View Article : Google Scholar : PubMed/NCBI
|
|
30
|
Hartner JC, Walkley CR, Lu J and Orkin SH:
ADAR1 is essential for the maintenance of hematopoiesis and
suppression of interferon signaling. Nat Immunol. 10:109–115. 2009.
View Article : Google Scholar
|
|
31
|
Domingo-Gil E and Esteban M: Role of
mitochondria in apoptosis induced by the 2-5A system and mechanisms
involved. Apoptosis. 11:725–738. 2006. View Article : Google Scholar : PubMed/NCBI
|
|
32
|
Castelli JC, Hassel BA, Maran A, Paranjape
J, Hewitt JA, Li XL, Hsu YT, Silverman RH and Youle RJ: The role of
2′-5′ oligoadenylate-activated ribonuclease L in apoptosis. Cell
Death Differ. 5:313–320. 1998. View Article : Google Scholar : PubMed/NCBI
|
|
33
|
Koeffler HP: Peroxisome
proliferator-activated receptor gamma and cancers. Clin Cancer Res.
9:1–9. 2003.PubMed/NCBI
|
|
34
|
Houseknecht KL, Cole BM and Steele PJ:
Peroxisome proliferator-activated receptor gamma (PPARgamma) and
its ligands: A review. Domest Anim Endocrinol. 22:1–23. 2002.
View Article : Google Scholar
|
|
35
|
Han S, Inoue H, Flowers LC and Sidell N:
Control of COX-2 gene expression through peroxisome
proliferator-activated receptor gamma in human cervical cancer
cells. Clin Cancer Res. 9:4627–4635. 2003.PubMed/NCBI
|
|
36
|
James SY, Lin F, Kolluri SK, Dawson MI and
Zhang XK: Regulation of retinoic acid receptor beta expression by
peroxisome proliferator-activated receptor gamma ligands in cancer
cells. Cancer Res. 63:3531–3538. 2003.PubMed/NCBI
|
|
37
|
Han S and Roman J: Suppression of
prostaglandin E2 receptor subtype EP2 by PPARgamma ligands inhibits
human lung carcinoma cell growth. Biochem Biophys Res Commun.
314:1093–1099. 2004. View Article : Google Scholar : PubMed/NCBI
|