Introduction
Small-cell lung cancer (SCLC) accounts for ~15% of
all lung cancers and is one of the most lethal diseases with a
5-year survival of 1–5% in extensive-stage (ES)-SCLC (1–3).
Most patients with SCLC are sensitive to platinum-based first-line
chemotherapy, although a number of patients develop drug resistance
and rapid relapse (4), which is
attributed to the presence of cell heterogeneity in SCLC and the
patients eventually succumb (5).
Intratumoral heterogeneity (ITH) is a characteristic of different
tumor cell clones from the same tumor tissue. ITH is also reflected
by genetic, functional and phenotypic differences. SCLC presents
with different growth patterns: The more common ‘classic’ subtype,
which grows predominantly as spherical aggregates of floating cells
and the ‘variant’ subtype, which grows as loosely adherent
aggregates or as a more tightly adherent monolayer in cell culture
(6). Expression profiling of these
distinct populations suggests that the floating phenotype has the
more typical epithelial neuroendocrine (NE) features, whereas the
adherent phenotype has a more non-neuroendocrine (non-NE)
expression profile (6,7). The paracrine signaling pathway
regulates the crosstalk between NE and non-NE that can change tumor
cell behavior (8,9). SCLC subtypes are defined by four
transcription regulators: Achaete-scute homologue 1 (ASCL1; also
known as ASH1) for SCLC-A, neurogenic differentiation factor 1
(NeuroD1) for SCLC-N, POU class 2 homeobox 3 (POU2F3) for SCLC-P
and YES-associated protein 1 (YAP1) for SCLC-Y (10). SCLC-A and SCLC-N are NE subtypes
and SCLC-Y and SCLC-P are non-NE subtypes (11). The phenotypic difference in SCLC is
the key factor that leads to the formation of ITH, but its
biological function and mechanism are unclear and require
clarification.
Phenotypic plasticity, which is the ability of cells
to change from one phenotype to another, is a mechanism responsible
for phenotypic differences. In the formation of ITH, phenotypic
plasticity is the source of ITH formation and the mechanism that
leads to differences in drug sensitivity and acquired drug
resistance (10).
Treatment-induced stress or hypoxia has an important role in NE
transformation (10,12,13),
which can promote breast cancer, pancreatic cancer and other tumor
cells to adapt to an environment that influences
epithelial-mesenchymal transition (EMT) (13,14).
In NE cells, MYC upregulates NOTCH2, Hes1, Hes6 and Jag2 expression
and activates Notch to dedifferentiate tumor cells, thereby
promoting a temporal shift in SCLC from SCLC-A to SCLC-N to SCLC-Y
(15). In this process, cells
change from ‘classic’ (i.e., NE) tight, round, spherical aggregates
to ‘variant’ (i.e., non-NE) chain-link amorphous cell colonies.
Regulating MYC expression may alter cell fate, morphology and drug
sensitivity (15).
Granulocyte-macrophage colony-stimulating factor
(GM-CSF), also called colony-stimulating factor 2 (CSF2), is
secreted by different types of cells (e.g., activated T cells, B
cells, macrophages, mast cells, vascular endothelial cells,
fibroblasts and a wide variety of cancer cell types) and is
primarily involved in immune activation and regulating the function
of inflammatory cytokines. Under appropriate stimulation, CSF2 is
also secreted by a number of nonimmune cells (16) and it regulates the growth, invasion
and migration of tumor cells such as human melanoma, skin cancer
and colorectal cancer in an autocrine or paracrine manner (11,17,18).
One report (19) demonstrates that
myeloid-derived suppressor cells (MDSC) can upregulate MYC
expression by inducing the CSF2/phosphorylated signal transducer
and activator of transcription 3 (p-STAT3) signaling pathway to
promote epithelial ovarian cancer cell stemness. The inhibition of
STAT3 can significantly reduce cell adherence ability (20) and the expression of EMT-related
proteins and the non-NE marker CD44 (21). However, whether CSF2, p-STAT3 and
MYC are involved in the phenotypic plasticity of SCLC is unclear.
The aim of the present study was to identify the biological
function and mechanism of CSF2 in regulating SCLC phenotypic
plasticity and to verify whether CSF2 regulated SCLC phenotypic
plasticity through p-STAT3/MYC signaling pathway to drive ITH and
cause relapse and drug resistance.
Materials and methods
Cell culture
The human SCLC cell line NCI-H69 was purchased from
Cell Resource Center at the Institute of Basic Medical Sciences of
the Chinese Academy of Medical Sciences/Peking Union Medical
College (Beijing, China). NCI-H69 exhibited adherent (H69A) and
suspensive (H69S) phenotypes. H69S cells in the supernatant were
separated by centrifugation (200 × g for 5 min at 22–24°C) for cell
passaging. H69A cells had to be detached by treatment with 0.02%
ethylenediaminetetraacetic acid (EDTA; MilliporeSigma) for
subcultivation. The two of them of them were cultured in RPMI 1640
medium, supplemented with 10% fetal bovine serum and 100 U/ml
penicillin and streptomycin (all from Gibco; Thermo Fisher
Scientific, Inc.) at 37°C in a 5% CO2 incubator.
Cell transfection
CSF2 shRNA short hairpin (sh) RNA and negative
control were synthesized by Genechem, Inc. The CSF2 shRNA sequence
was: 5′-CCCAGATTATCACCTTTGAAA-3′. The negative control sequence was
non-targeting sequence: 5′-TTCTCCGAACGTGTCACGT-3′. Briefly,
1×10⁶ cells (H69A) per well were seeded in 6-well plates
the day before transfection. After 24 h, the cells were resuspended
in 100 µl of Buffer R, then gently mix with 5 µg of negative
control or CSF2 shRNA; 100 µl of the cells mixed with negative
control or CSF2 shRNA complexes were pipetted into the 3 ml Buffer
E2. The Neon System (Thermo Fisher Scientific, Inc.) was used for
electroporation; 1,300 V/20 ms/2 pulses were used for
electroporation at 22–24°C. After 48 h, the cells were used for the
subsequent experiments.
Ribonucleic acid extraction and
library preparation
Total RNA was extracted by using TRIzol®
reagent (Thermo Fisher Scientific, Inc.), following the
manufacturer's procedure. A total of 3 µg RNA per sample was used
as the input material for preparation of the RNA-Seq library. mRNA
was purified from total RNA by using poly-T oligo-attached magnetic
beads. Fragmentation was carried out using divalent cations at
22–24°C in NEB Next First Strand Synthesis Reaction Buffer (5X; New
England BioLabs, Inc.). First strand complementary deoxyribonucleic
acid (cDNA) was synthesized using a random hexamer primer and
M-MuLV and Solutions Reverse Transcriptase (RNase H). Second-strand
cDNA synthesis was subsequently conducted by using DNA polymerase I
and RNase H. The remaining overhangs were converted to blunt ends
via exonuclease/polymerase activities. After adenylation of the 3′
ends of the DNA fragments, NEBNext Adaptor (New England BioLabs,
Inc.) with hairpin loop structures were ligated to prepare for
hybridization. To select cDNA fragments of preferentially 250–300
bp in length, the library fragments were purified with the AMPure
XP system (Beckman Coulter, Inc.). Then 3 µl of USER Enzyme (New
England BioLabs, Inc.) were thereafter used to generate
size-selected, adaptor-ligated cDNA at 37°C for 15 min, followed by
5 min at 95°C before polymerase chain reaction (PCR). PCR was
conducted using Phusion High-Fidelity DNA polymerase, universal PCR
primers and an Index (X) primer. Finally, the PCR products were
purified (AMPure XP system; Beckman Coulter, Inc.) and the quality
of the library was evaluated on the Agilent Bioanalyzer 2100 system
(Agilent Technologies, Inc.).
Quality control and read mapping to
the reference genome
Quality score (Q)20, Q30 and the guanine-cytosine
(GC) content of the clean data were calculated. All downstream
analyses were based on clean data of high quality. The reference
genome and gene model annotation files were downloaded directly
from the genome website (https://www.gencodegenes.org/human/releases.html).
Paired-end clean reads were aligned to the reference genome using
STAR v20201 (https://github.com/alexdobin/STAR). STAR was selected
as the mapping tool because it can generate a more precise database
of uniquely mapped reads, compared to other mapping tools.
Quantification of gene expression
level
Cufflinks v2.2.1 (https://github.com/cole-trapnell-lab/cufflinks) was
used to count the number of reads assigned to each gene. The
fragments per kilobase of transcript sequence per millions (FPKM)
of each gene were then calculated, based on the length of the gene
and the read count mapped to this gene. The calculation of FPKM
took into account the effect of sequencing depth and gene lengths
for the reads count. This is the most used method for estimating
the level of gene expression.
Differential expression analysis
Differential gene expression analysis was conducted
using Cufflinks v2.2.1. The resulting P-values were adjusted by
using the Benjamini and Hochberg approach to control the false
discovery rate (22,23). A P-value of 0.05 and an absolute
fold change (FC) of 1.5 were set as the thresholds for a
significant differential expression. Gene Ontology (GO) and Kyoto
Encyclopedia of Genes and Genomes (KEGG) enrichment analyses of
differentially expressed genes (DEG) was implemented by the cluster
Profiler R package (https://mirrors.tuna.tsinghua.edu.cn/CRAN/bin/windows/base/old/4.0.3/)
in which gene length bias was corrected. GO terms with a corrected
P-value <0.05 were considered significantly enriched by DEG.
KEGG is a database resource for understanding high-level functions
and utilities of a biological system such as the cell, the organism
and the ecosystem, based on molecular-level information, especially
large-scale molecular datasets generated by genome sequencing and
other high throughput experimental technologies (http://www.genome.jp/kegg/). The cluster Profiler R
package was used to test the statistical enrichment of differential
expression genes in the KEGG pathways.
Reverse transcription-quantitative
(RT-q) PCR
Cells were seeded in a 6-well microplate at a
density of 5×10⁵ cells per well. Total RNA was extracted
using the RNA mini kit (Qiagen, Inc.) according to the
manufacturer's protocols and the optical density (OD) 260/280 nm
ratio was >1.95. Reverse transcription was conducted using a
reverse transcription kit (Takara Bio, Inc.). The samples were
analyzed by using RTqPCR on a LightCycler 480 system (Roche
Diagnostics) with the SYBR Green Master mix kit (Takara Bio, Inc.)
with the following conditions: 95°C for 3 min, followed by 40
cycles at 95°C for 30 sec, 57°C for 30 sec and 72°C for 30 sec.
Glyceraldehyde-3-phosphate dehydrogenase (GAPDH) mRNA was used to
normalize the relative amount of mRNA. The following primers were
used: vascular endothelial growth factor receptor (VEGFR): forward,
5′-ACCATACCTCCTGCGAAACC-3′ and reverse, 5′-CGGGGACACCATTAGCATGA-3′;
platelet-derived growth factor receptor (PDGFR): forward,
5′-GAGACTGTTGGGCGAAGGTT-3′ and reverse, 5′-TGGGTGGTCACTCCTCAGAA-3′;
fibroblast growth factor receptor (FGFR): forward,
5′-TCAGATGCTCTCCCCTCCTC-3′ and reverse, 5′-ACGGGGTTTGGTTTGGTGTT-3′;
stem cell factor receptor (c-Kit): forward,
5′-ACTTGGAGCCTGCACCATT-3′ and reverse, 5′-CTATCGCTGCAGGAAGACTC-3′;
Aurora B: forward, 5′-ACCTGCACCATCCCAACATC-3′ and reverse,
5′-ATGATCGTGGCTGTTCGCTG-3′; colony-stimulating factor 1 receptor
(CSF1R): forward, 5′-TATGTCAAAGACCCTGCCCG-3′ and reverse,
5′-AAGGAGTAGTTGGTGTGGCG-3′; and GAPDH: forward,
5′-ACCACAGTCCATGCCATCAC-3′ and reverse, 5′-TCCACCACCCTGTTGCTGTA-3′.
The relative quantification of the PCR product was calculated,
using the 2−ΔΔCq method (24).
Drug sensitivity assay
The drug sensitivity assay was assessed, by using
Alamar Blue reagent (cat. no. DAL1100; Invitrogen; Thermo Fisher
Scientific, Inc.). H69A and H69S cells were seeded in 96-well
plates at a density of 6,000 cells per well and incubated at 37°C
with 5% CO2 for 48 h in various concentrations of
cisplatin (range, 0–10 µg/ml; Selleck, Inc.), etoposide (range,
0–16 µg/ml, Selleck, Inc.), anlotinib (range, 0–6 µg/ml; Chia Tai
Tianqing Pharmaceutical Group Co., Ltd.), CS2164 (range, 0–10
µg/ml; Shenzhen Chipscreen Biosciences Co., Ltd.) and RAD001
(range, 0–20 µg/ml; Selleck, Inc.) to obtain the inhibitory
concentration values.
Cell proliferation and cell switch
assay
H69A and H69S cells were seeded in a 24-well
microplate at a density of 1×10⁴ cells per well. For the
cell proliferation assay, cells were cultured for 48 h and then
stained with 0.4% trypan blue for 1 min at 22–24°C. Countstar (ALIT
Biotech Co., Ltd.) was used to count cell numbers. For the cell
switch assay, adherent cells and cell suspensions were collected
from H69A cells and H69S cells, respectively, after being cultured
for 24 and 48 h, respectively. They were then stained with 0.4%
trypan blue for 1 min at 22–24°C. The number of cells was counted
using Countstar. The rate of adherent cells to suspensive cells is
the number of adherent cells/(number of adherent cells + number of
cells in the suspension). The ratio of cells in suspension to
adherent cells=number of cells in suspension/(number of adherent
cells + number of suspensive cells).
Western blotting
Cells were harvested and total proteins were
extracted using RIPA lysis buffer containing the protease inhibitor
phenylmethylsulfonyl fluoride and a cocktail (Roche Applied
Science). The supernatant was then transferred to another tube
after centrifugation at 15,000 × g at 4°C for 15 min. The
concentration of the protein samples was quantified using a BCA
protein assay kit (Takara Bio, Inc.). The lysate was mixed with 5X
sodium dodecyl sulfate (SDS) loading buffer (BioTeke, Inc.) and
heated to 95°C for 5 min. From the total protein, 50 µg was
separated using SDS-polyacrylamide gel electrophoresis (SDS-PAGE)
on 10% gels and transferred to a polyvinylidene fluoride membrane
and then blocked in 5% nonfat milk at 22–24°C for 1.5 h. It was
then incubated overnight at 4°C with the following primary
antibodies: Anti-synaptophysin (anti-SYP; 1:1,000 dilution; cat.
no. 4329; Cell Signaling Technology, Inc.), anti-CD44 (1:1,000
dilution; cat. no. 3578; Cell Signaling Technology, Inc.),
anti-ASCL1 (1:1,000 dilution; cat. no. ab211327; Abcam),
anti-NEUROD1 (1:1,000 dilution; cat. no. ab213725; Abcam),
anti-YAP1 (1:1,000 dilution; cat. no. 4912; Cell Signaling
Technology, Inc.), anti-POU2F3 (1:200 dilution; cat. no. sc-293402;
Santa Cruz Biotechnology, Inc.), anti-p-mammalian target of
rapamycin (mTOR; 1:500 dilution; cat. no. 2971; Cell Signaling
Technology, Inc.), anti-mTOR (1:500 dilution; cat. no. 2972; Cell
Signaling Technology, Inc.), anti-CSF2 (1:1,000 dilution; cat. no.
ab56712; Abcam), anti-p-STAT3 (1:1,000 dilution; cat. no. 9145;
Cell Signaling Technology, Inc.), anti-STAT3 (1:1,000 dilution;
cat. no. 9131; Cell Signaling Technology, Inc.) anti-MYC (1:1,000
dilution; cat. no. 9402; Cell Signaling Technology, Inc.) and
anti-GAPDH (1:1,000 dilution; cat. no. ab9485; Abcam). Membranes
were then washed and incubated with the corresponding secondary
antibodies: Goat antirabbit immunoglobulin G (IgG; 1:3,000
dilution; cat. no. ab6721; Abcam) and goat antimouse IgG (1:3,000
dilution; cat. no. ab6728; Abcam) for 1 h at 22–24°C. An enhanced
chemiluminescent (ECL) kit (MilliporeSigma) was used to detect the
proteins. Protein band intensities were quantified by using
Quantity One software (version 4.6.9, Bio-Rad Laboratories,
Inc.).
Statistical analysis
All data were analyzed by SPSS 17.0 (SPSS, Inc.) and
Origin 2021 (Origin Software, Inc.) statistical software.
Statistical data are presented as the mean ± standard deviation.
The Student's t-test was used to compare the means between two
groups, whereas one-way ANOVA was used to compare the means among
three or more groups. Dunnett's test for all comparisons are
against a single control and Tukey's test for all groups are
compared to one another. P-values were based on two-tailed
statistical analysis. P<0.05 was considered to indicate a
statistically significant difference.
Results
SCLC cell line NCI-H69 grows in two
distinct phenotypes
To explore the phenotypic plasticity of SCLC from
the same clone, the classic SCLC cell line NCI-H69 was cultured and
the adherent cells termed ‘H69A’ and the suspended cells termed
‘H69S.’ H69A cell growth presents as a monolayer with a mesenchymal
morphology that resembles variant non-NE human SCLC cells, whereas
H69S cells have an aggregated growth pattern (Fig. 1A). In general, tumor cells go
through anti-anchorage death. To address whether suspended cells
had the ability to survive, cell proliferation was tested at 48 h
and no differences found between the two types of cells (Fig. 1B). This finding indicated that the
suspended cells did not share the same mechanism of anoikis. To
elucidate the relationship between adherent and suspended
morphology, the cell switch assay was used to test whether the two
cell subtypes could switch back and forth. The results were that
H69A and H69S could transform into each other with a transformation
rate from H69A cells to H69S cells and from H69S cells to H69A
cells of 53.72% vs. 35.72% after 24 h incubation and 46.98% vs.
36.06% after 48 h incubation. This finding indicated that adherent
cells may possess a stronger ability to migrate than do suspended
cells (Fig. 1C). The detection of
NE characteristics and molecular subtypes of adherent and suspended
cells showed that the expression level of the non-NE marker CD44
was higher and the expression level of the NE marker SYP was lower
in adherent cells than in suspended cells (Fig. 1D and E). H69A and H69S cells
strongly expressed ASCL1, but ASCL1 expression was higher in H69S
cells than in H69A cells. YAP1 and NEUROD1 expression was lower
than that of ASCL1 in H69A and H69S cells. Furthermore, the
expression of POU2F3 was faint in the two cell phenotypes (Fig. 1F and G).
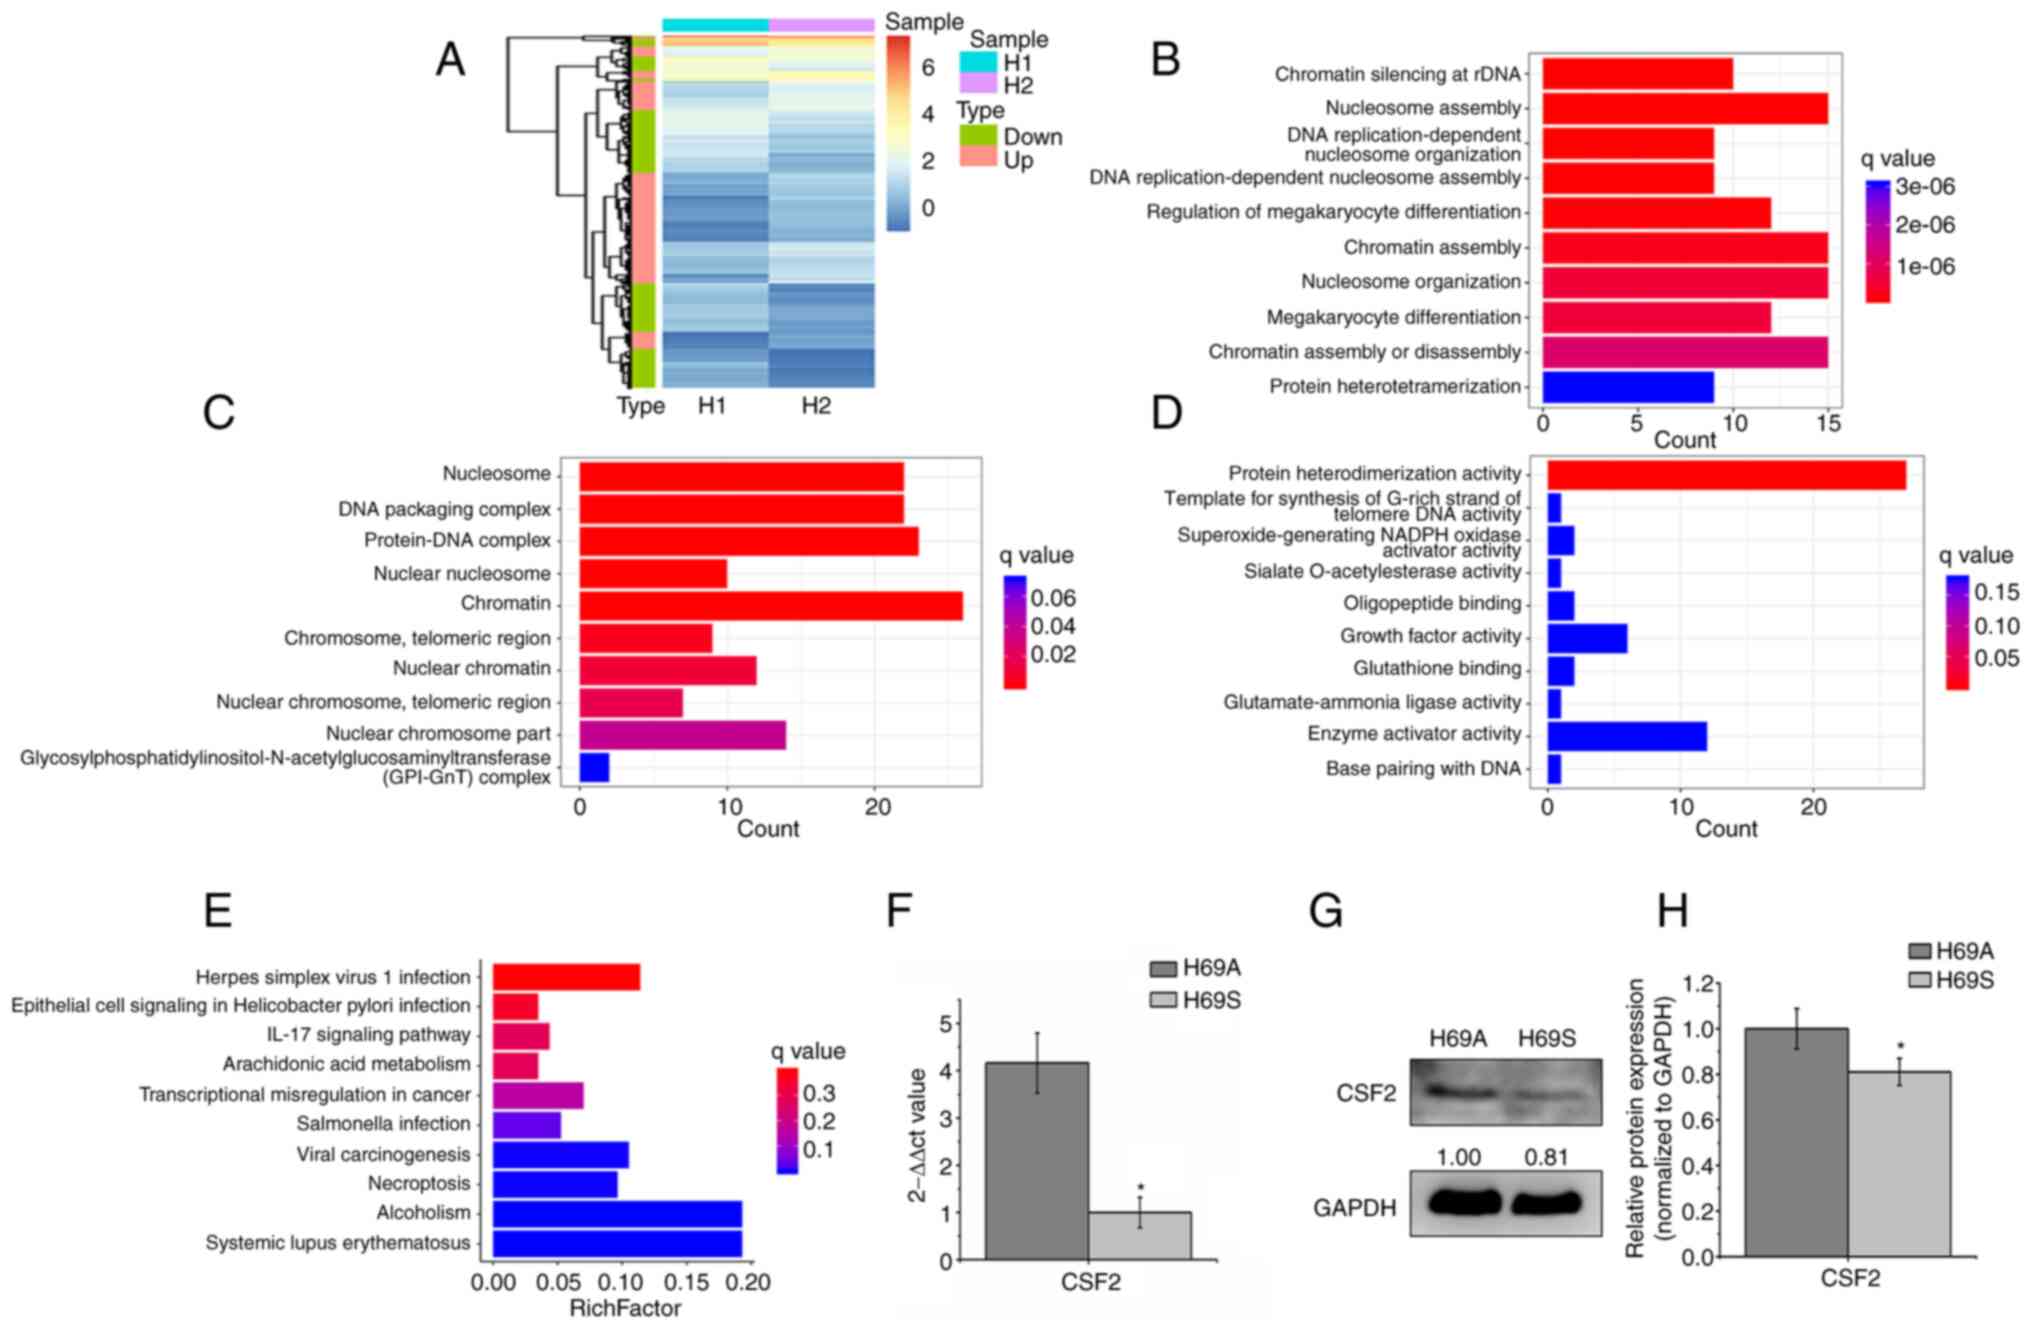
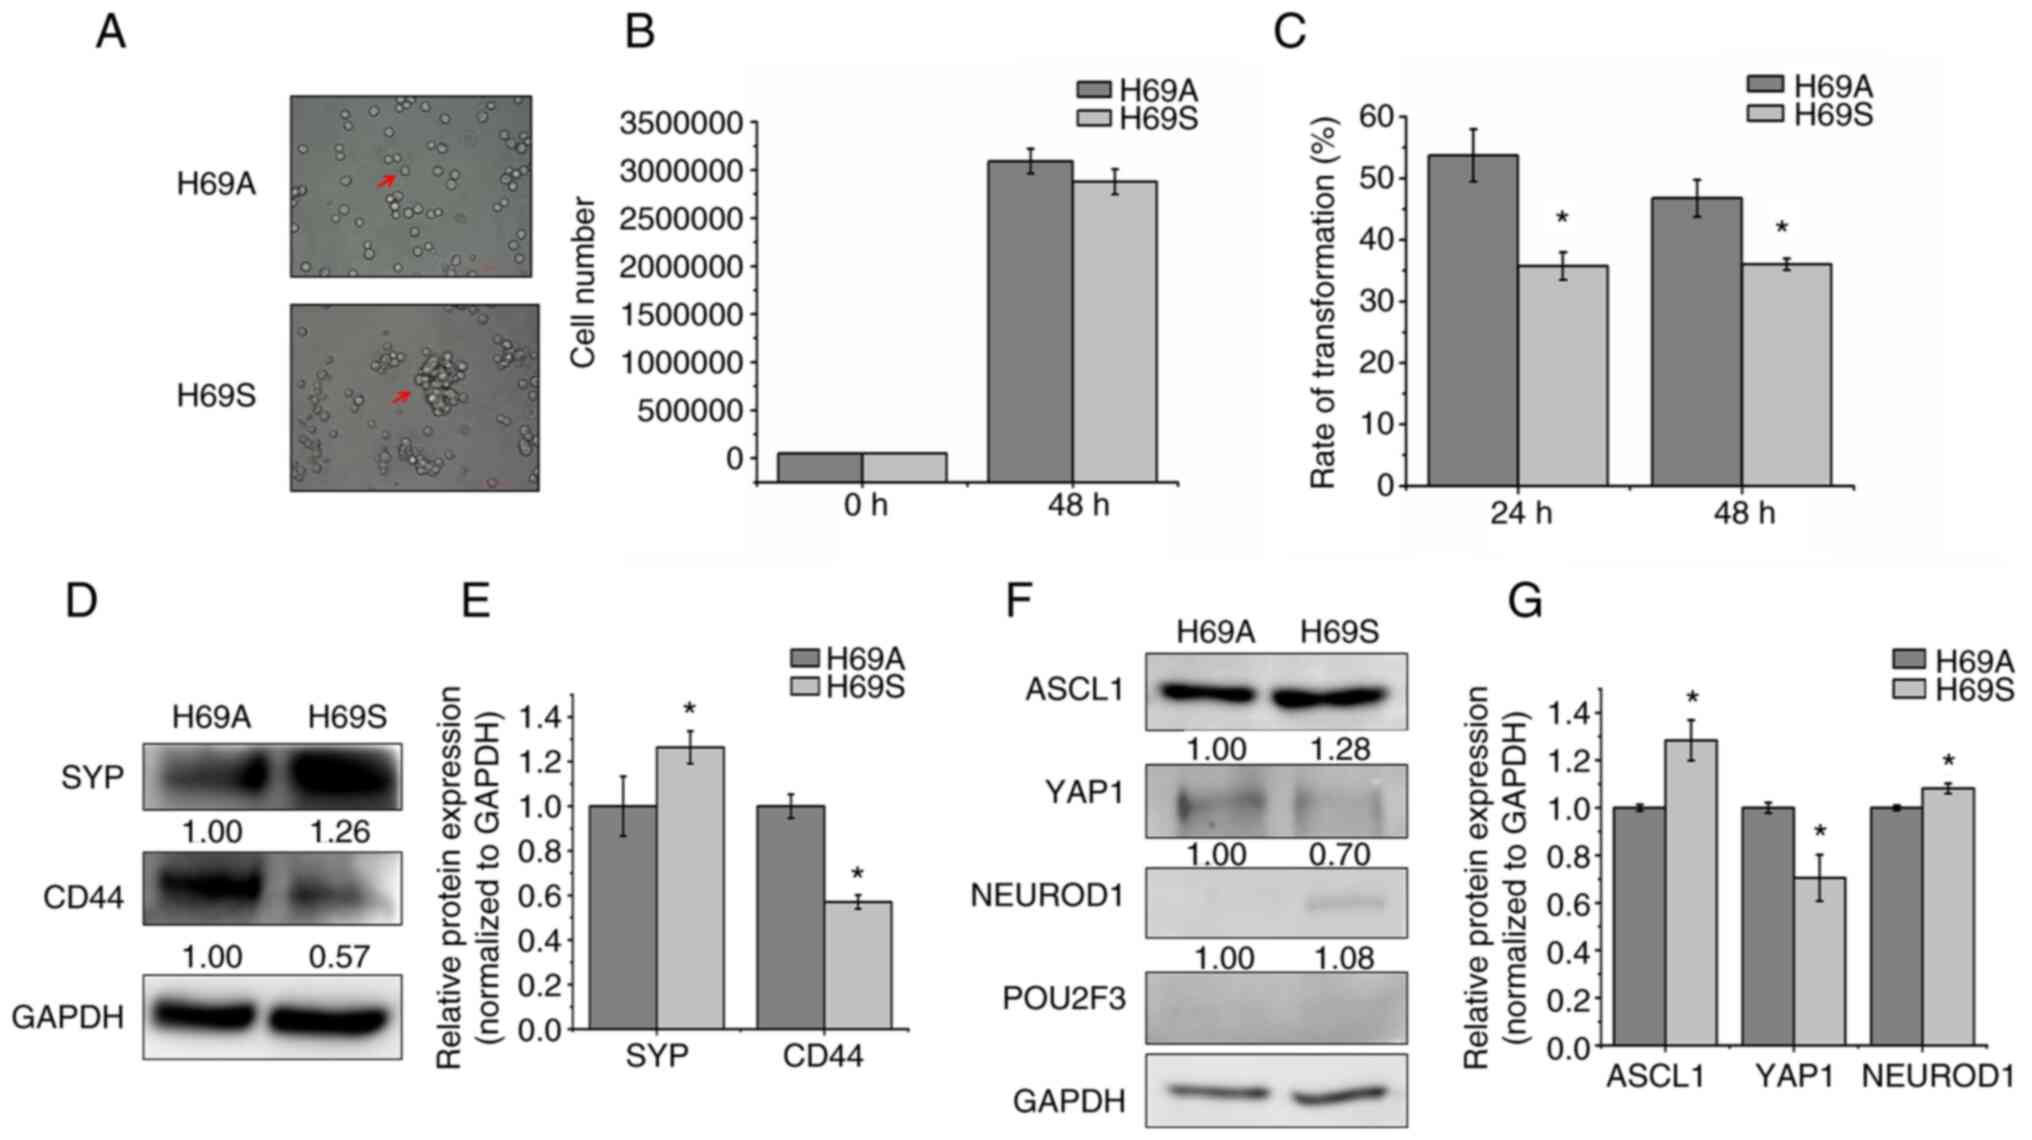 | Figure 1.Two distinct phenotypes of SCLC cell
line NCI-H69. (A) The arrows indicated the bright-field images of
H69A and H69S cells. Magnification, ×200. (B) H69A and H69S cells
were cultured for 48 h and then stained with trypan blue. Cell
proliferation was analyzed using Countstar. (C) H69A and H69S cells
were each cultured for 24 and 48 h and then stained with trypan
blue. Adherent cells and suspended cells were collected. Cell
numbers were counted using Countstar. (D) H69A and H69S cells were
collected and western blotting was used to detect the expression of
SYP and CD44. GAPDH was the internal standard. (E) Quantitative
analysis of (D): H69A was the control (100%). Data are presented as
the mean ± standard deviation of three independent experiments. (F)
Western blotting was used to detect the expression of ASCL1,
NEUROD1, POU2F3, YAP1 and GAPDH. (G) Quantitative analysis of (F):
H69A was the control (100%). Data are presented as the mean ±
standard deviation of three independent experiments. *P<0.05.
SCLC, small cell lung cancer; SYP, synaptophysin; ASCL1,
achaete-scute homologue 1; NEUROD1, neurogenic differentiation
factor 1; POU2F3, POU class 2 homeobox 3; YAP1, YES-associated
protein 1. |
Suspended and adherent cells possess
heterogeneity with respect to cytotoxicity
Resistance has been attributed to SCLC heterogeneity
and a main contributor to ITH is the emergence of multiple clones
with genetic variations during tumor progression (25). Therefore, the sensitivity of H69A
and H69S to drugs commonly used clinically for SCLC was tested.
Commonly used chemotherapy drugs and targeted drugs that have
positive results or are receiving greater attention in clinical
trials were chosen. H69A and H69S cells were treated with the
indicated concentrations of cisplatin, etoposide, anlotinib, CS2164
and RAD001 for 48 h. Inhibitory concentration values were
determined by using a cell viability assay in the two cell lines
(Fig. 2A-E). Dose-dependent cell
survival was observed in H69A and H69S cells. The inhibitory
effects of a single drug on the two SCLC cell lines increased with
increasing drug concentration. However, the cytotoxic effects of
anlotinib, CS2164 and RAD001 were enhanced in H69S cells, compared
to H69A cells. The IC50s of anlotinib, CS2164 and RAD001
were 3.09, 3.8 and 17.46 µg/ml, respectively, for H69A and 2.18,
2.09 and 8.48 µg/ml, respectively, for H69S.
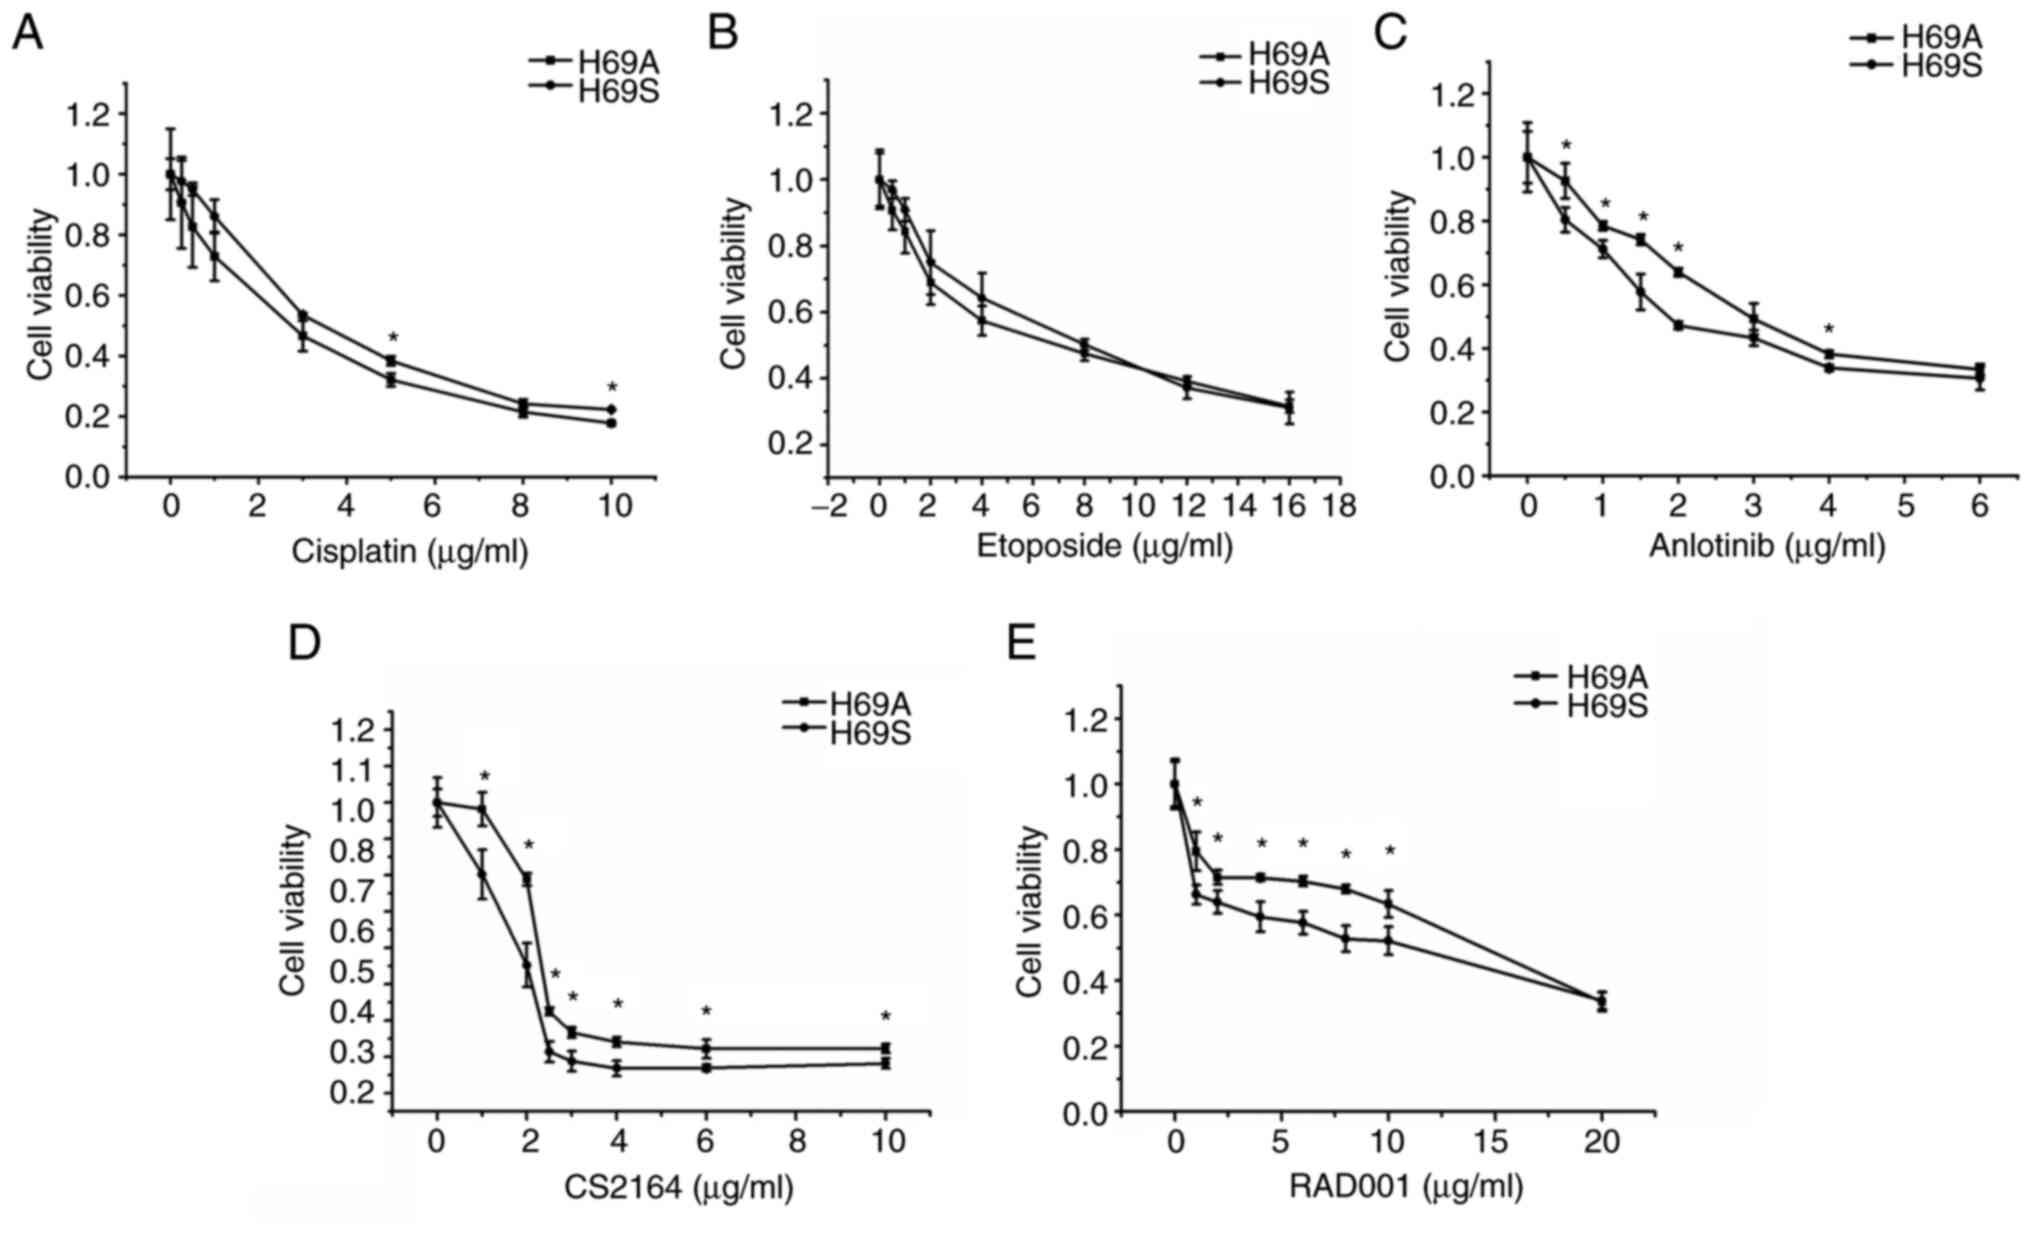 | Figure 2.Different drug sensitivities in
suspended cells and adherent cells. H69A cells and H69S cells were
treated with different concentrations of (A) cisplatin (0, 0.25,
0.5, 1, 3, 5, 8 and 10 µg/ml), (B) etoposide (0, 0.25, 0.5, 1, 3,
5, 8, 12 and 16 µg/ml), (C) anlotinib (0, 0.5, 1, 1.5, 2, 3, 4 and
6 µg/ml), (D) CS2164 (0, 1, 2, 2.5, 3, 4, 6 and 10 µg/ml) and (E)
RAD001 (0, 1, 2, 4, 6, 8, 10 and 20 µg/ml) for 48 h. Cell viability
was tested using Alamar Blue reagent. All experiments were repeated
three times. *P<0.05, vs. adherent group. |
Expression of the targeted receptors
for anlotinib, CS2164 and RAD001 is higher in the SCLC suspension
cells
As the cytotoxicity of anlotinib, CS2164 and RAD001
differed between the H69A and H69S cells, the mechanisms involved
were explored. Anlotinib and CS2164 are multitarget inhibitors;
therefore, the target receptors VEGFR, PDGFR, FGFR, c-Kit, AuroraB
and CSF1R were tested (Fig. 3A).
The expression of VEGFR, FGFR and CSF1R was much higher in H69S
than in H69A by 7.38, 7.55 and 2.92-fold, respectively. The levels
of the RAD001 targets (p-mTOR/mTOR) were also higher in H69S cells
than in H69A cells (Fig. 3B and
C). Based on these results, it was hypothesized that the levels
of targeted receptors against anlotinib, CS2164 and RAD001 could
have an important role in the different cytotoxic responses between
the two SCLC cells phenotypes.
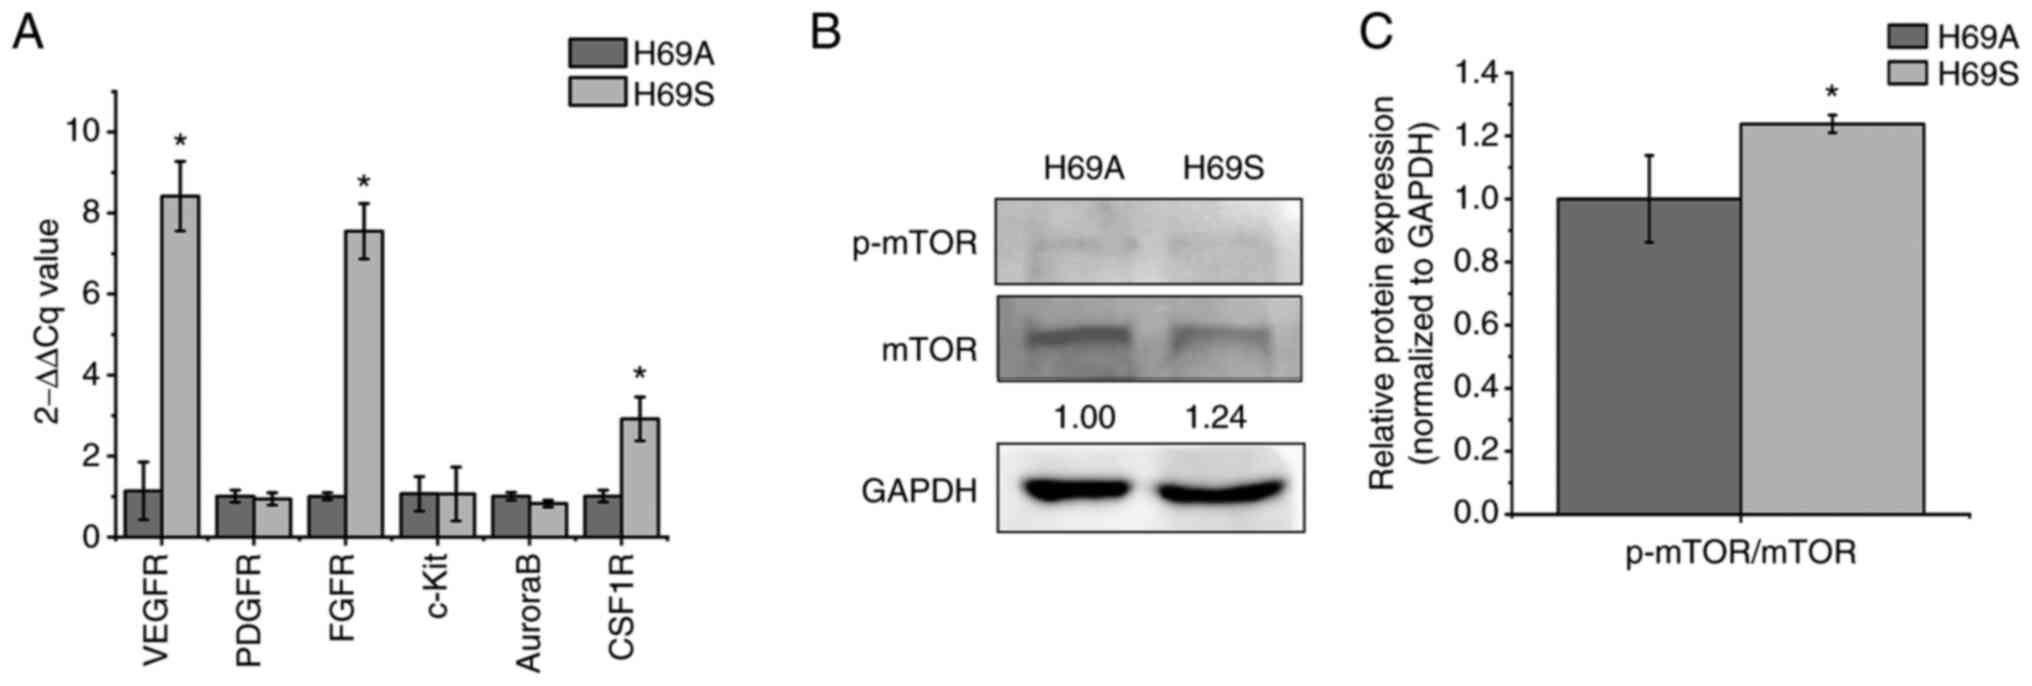 | Figure 3.Expression of receptors targeted by
anlotinib, CS2164 and RAD001 in H69S cells and H69A cells. H69A and
H69S cells were collected. (A) Reverse-transcription quantitative
PCR analysis of VEGFR, PDGFR, FGFR, c-Kit, Aurora B and CSF1R mRNA
levels were assessed using the 2-ΔΔCq method. (B)
Phosphorylated mTOR/mTOR were tested by using western blotting.
GAPDH was used as the internal standard. (C) Quantitative analysis
of (B): H69A was the control (100%). Data are presented as the mean
± the SD of three independent experiments. *P<0.05. VEGFR,
vascular endothelial growth factor receptor; PDGFR,
platelet-derived growth factor receptor; FGFR, fibroblast growth
factor receptors; c-Kit, stem cell factor receptor; CSF1R,
colony-stimulating factor 1 receptor; mTOR, mammalian target of
rapamycin; p-, phosphorylated. |
Treatment-induced stress may induce
different subtypes of SCLC interconversion
To investigate whether the selective pressure of
therapy would change the SCLC subtypes, these cells were treated
with RAD001, anlotinib and CS2164 individually or in combination
with chemotherapy [cisplatin + etoposide (EP)]. For RAD001,
anlotinib and CS2164, low- and high-concentration experimental
groups, respectively, were established. The results were that,
after 48 h of drug treatment, YAP1 expression was not significantly
altered in low-concentration monotherapy-drug group in H69A and
H69S cells (Fig. 4A, C, E and G).
The high concentration of RAD001 and the combination treatment
group reduced YAP1 by 16 and 17% respectively in H69A and more
significantly (41 and 51%, respectively) in H69S (Fig. 4A and C). The high concentration of
CS2164 increased YAP1 in H69A cells by 48%, which was significantly
higher than that in H69S cells (30%). However, the combination
treatment group did not clearly change YAP expression in H69A and
H69S cells (Fig. 4E and G). In
both phenotypes, ASCL1 expression was not significantly altered in
the low-concentration monotherapy group of RAD001 or anlotinib
(Fig. 4A, B, E and F), but was
decreased in the high-concentration monotherapy group (anlotinib
12% and CS2164 5%), which was lower than that in H69S (43 and 48%;
Fig. 4E and F). NEUROD1 expression
was increased 14% in high-concentration of CS2164 group in H69A,
but decrease 14% in H69S. Moreover, the high concentration of
CS2164 combined with EP reduced NEUROD1 by 7% in H69A and more
clearly by 33% in H69S (Fig. 4E and
H). None of the drugs significantly altered the expression of
POU2F3 in the two phenotypes. These results suggest that RAD001,
anotinib and CS2164 alone or in combination with EP affect the
expression of ASCL1, YAP1 and NEUROD1 with a significant difference
between the two phenotypes (Fig.
4A-H).
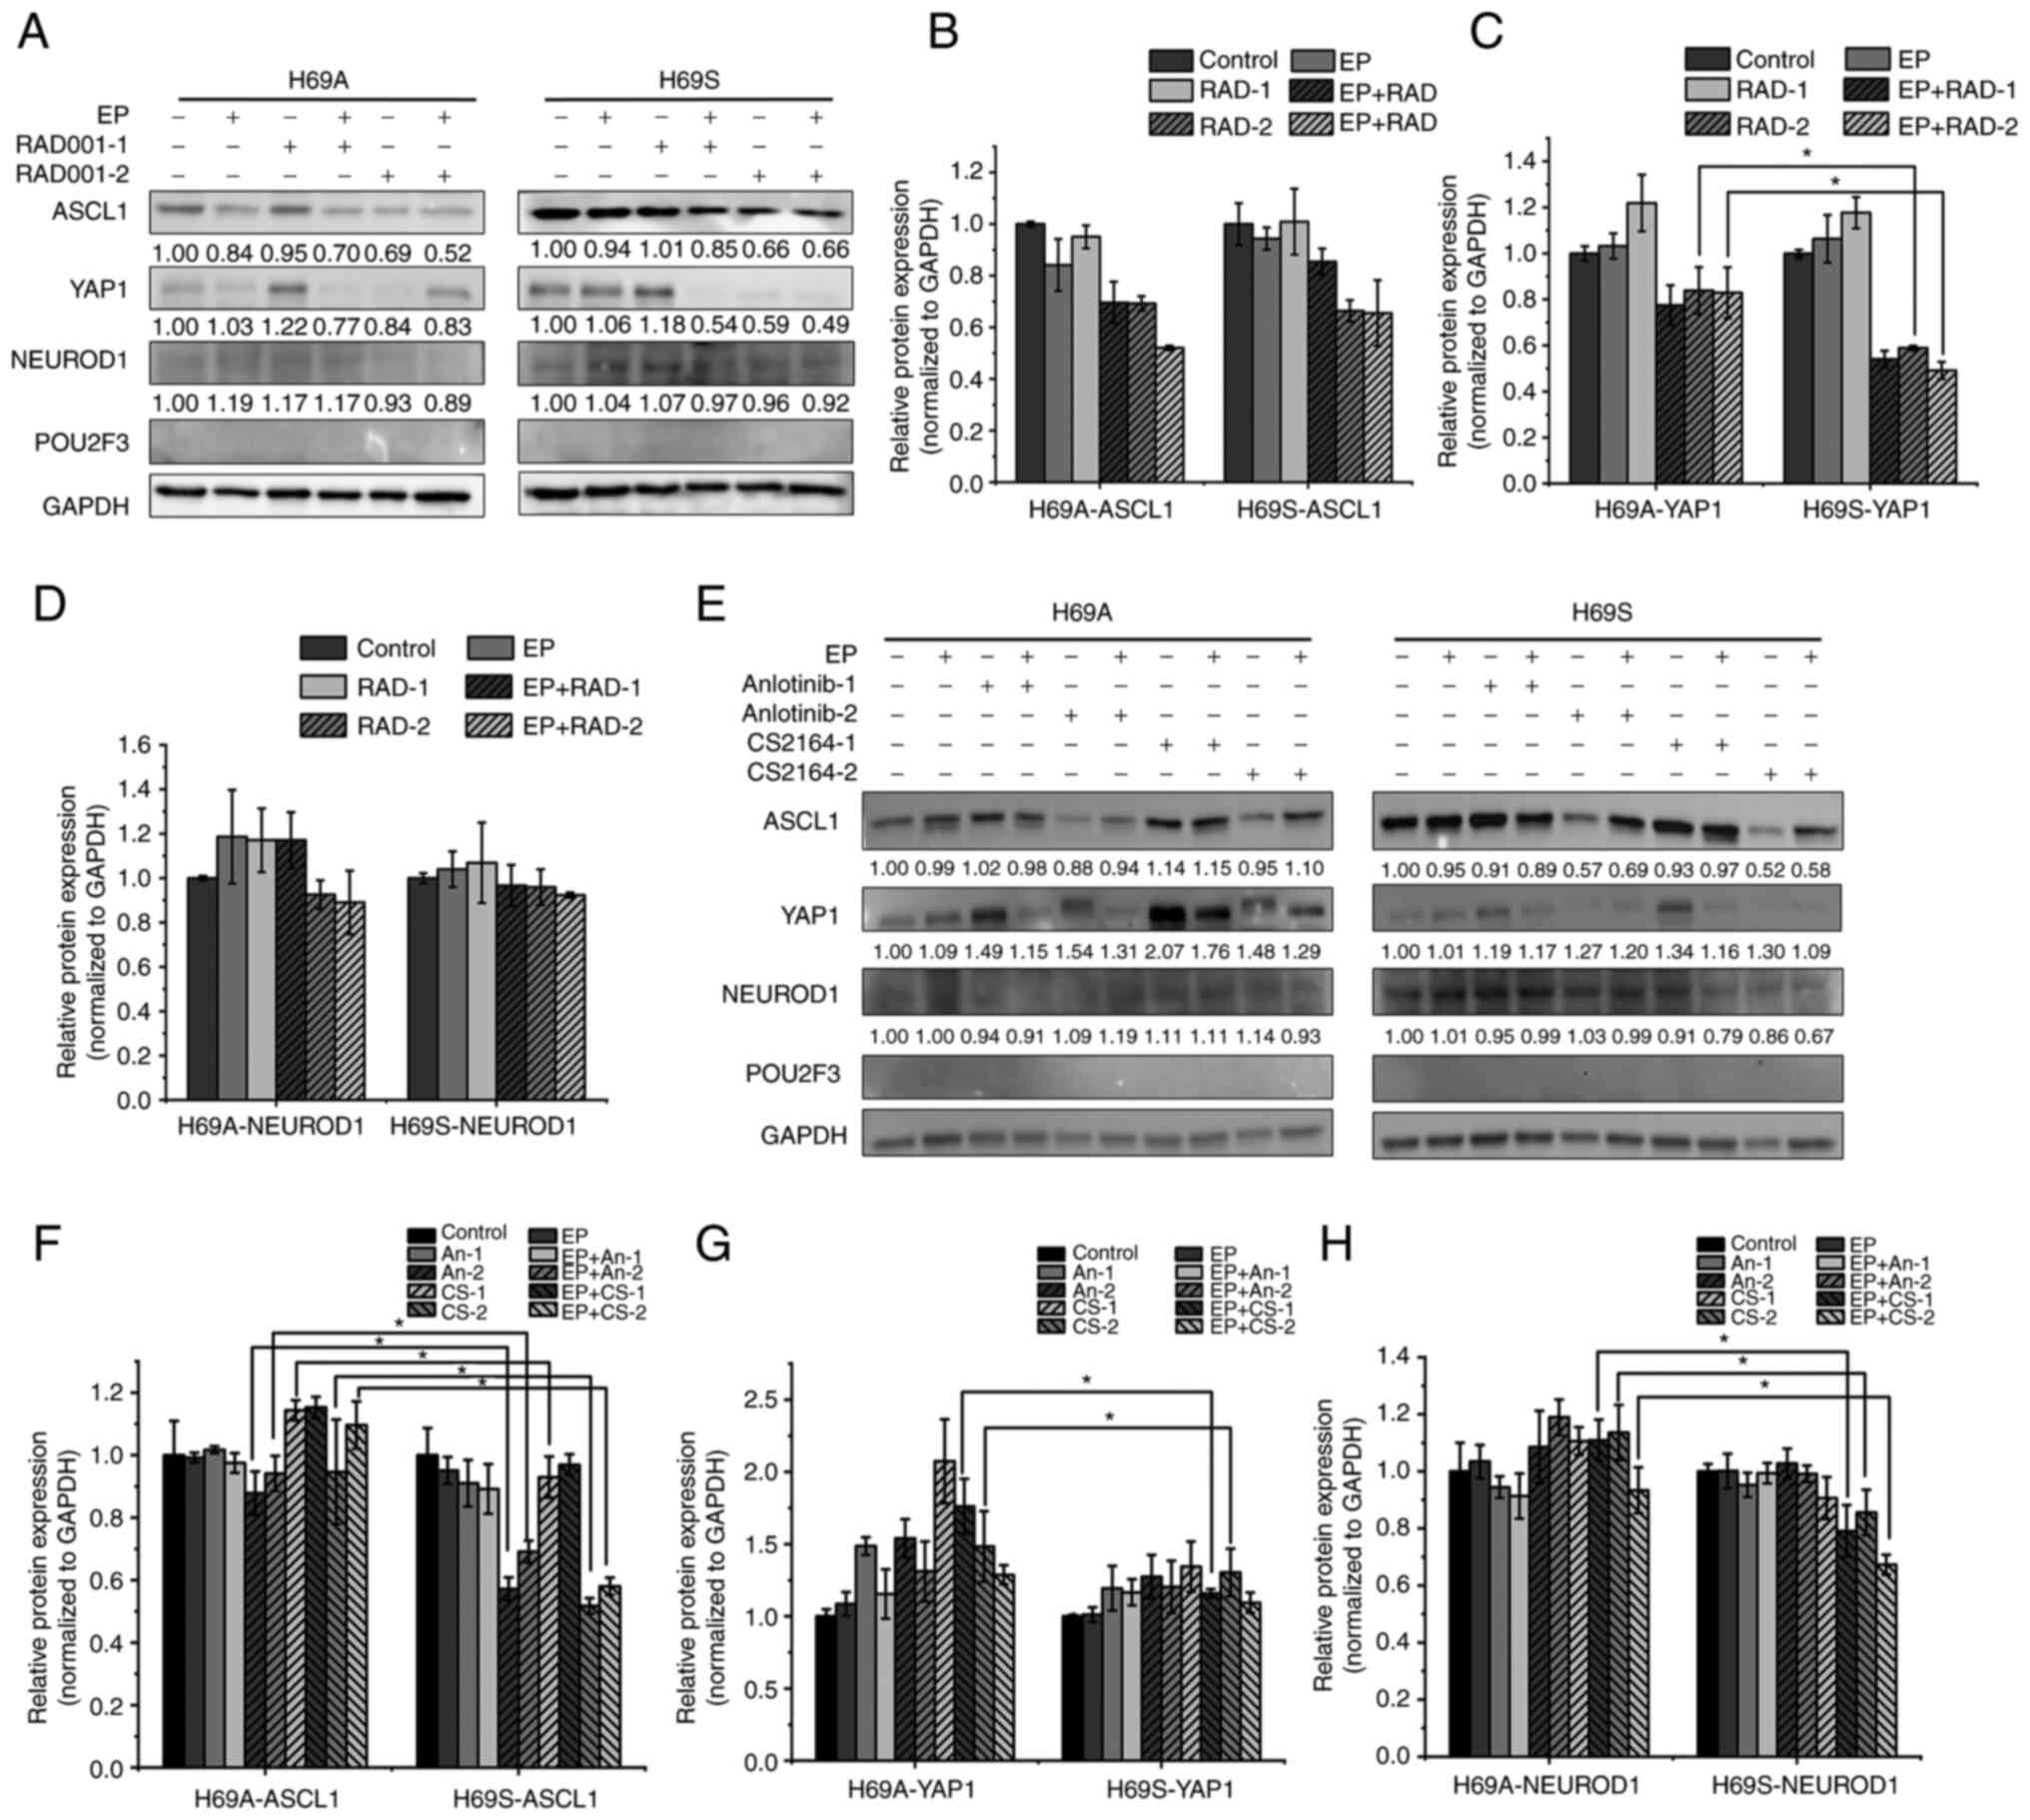 | Figure 4.Alternative transcriptional genetic
subtypes in H69A and H69S cells. (A) H69A and H69S cells were
treated with RAD001 (1 or 8 µg/ml), cisplatin (1 µg/ml) + etoposide
(2 µg/ml), or in combination for 48 h. The cells were then
harvested and subjected to western blotting analysis using the
indicated antibodies. (B-D) Quantitative analysis of (A):
mock-treated H69A cells were used as the control. Data are
presented as the mean ± the SD of three independent experiments.
(E) For 48 h, H69A and H69S cells were treated with cisplatin (1
µg/ml) + etoposide (2 µg/ml), anlotinib (0.5 or 2 µg/ml), CS2164
(0.5 or 2 µg/ml), cisplatin (1 µg/ml) + etoposide (2 µg/ml) +
anlotinib (0.5 or 2 µg/ml) and cisplatin (1 µg/ml) + etoposide (2
µg/ml) + CS2164 (0.5 or 2 µg/ml). Western blotting analysis was
used to detect the expression of ASCL1, NEUROD1, POU2F3 and YAP1.
GAPDH was used as the internal standard. (F-H) Quantitative
analysis of (E): mock-treated H69A cells were used as the control
(100%). Data are presented as the mean ± standard deviation of
three independent experiments. *P<0.05. EP, cisplatin (1 µg/ml)
+ etoposide (2 µg/ml); ASCL1, achaete-scute homologue 1; NEUROD1,
neurogenic differentiation factor 1; POU2F3, POU class 2 homeobox
3; YAP1, YES-associated protein 1; RAD-1, RAD001 1 µg/ml; RAD-2,
RAD001 8 µg/ml; An-1, anlotinib 0.5 µg/ml; An-2, anlotinib 2 µg/ml;
CS-1, CS2164 0.5 µg/ml; CS-2, CS2164 2 µg/ml. |
CSF2 is the main DEG between SCLC
adherent and suspended phenotype cells
To explore the molecular mechanism of phenotypic
plasticity driving ITH, RNA-seq-based transcriptome profiling
analysis was conducted in the H69A and H69S cells and differential
expression analysis (expression fold, >1.5) was conducted. In
total, 404 DEGs were identified. The heat map analysis indicated
that 50.5% of the genes were upregulated and 49.5% were
downregulated (Fig. 5A). The GO
analysis indicated that these genes were significantly enriched in
the nucleosome assembly, chromatin, growth factor activity, protein
heterodimerization activity and enzyme activator activity function
(Fig. 5B-D). KEGG analysis
indicated that these genes were enriched in dysregulated
transcriptional signaling pathways in cancer and in the IL-17
signaling pathway (Fig. 5E). These
results suggested that DEGs were involved in certain cellular
activities associated with types of cancer. Next, the DEGs enriched
in KEGG (P<0.05) were selected and the differential genes
further screened with log2 (FC)>1.5 or log2 (FC)<-1.5. CSF2
was the only qualified differential gene [P=0.039, log2
(FC)=−1.7796]. CSF2 was significantly enriched in adherent cells,
compared to suspension cells. To verify the results of RNA
sequencing, the expression levels of the CSF2 gene and proteins in
H69A and H69S were detected by using RT-qPCR and western blotting.
The expression levels of the CSF2 gene and protein in H69A were
higher in H69A cells than in H69S cells (Fig. 5F-H). These results suggested that
CSF2 was a major differential gene in SCLC cells of the same clone
with different phenotypes.
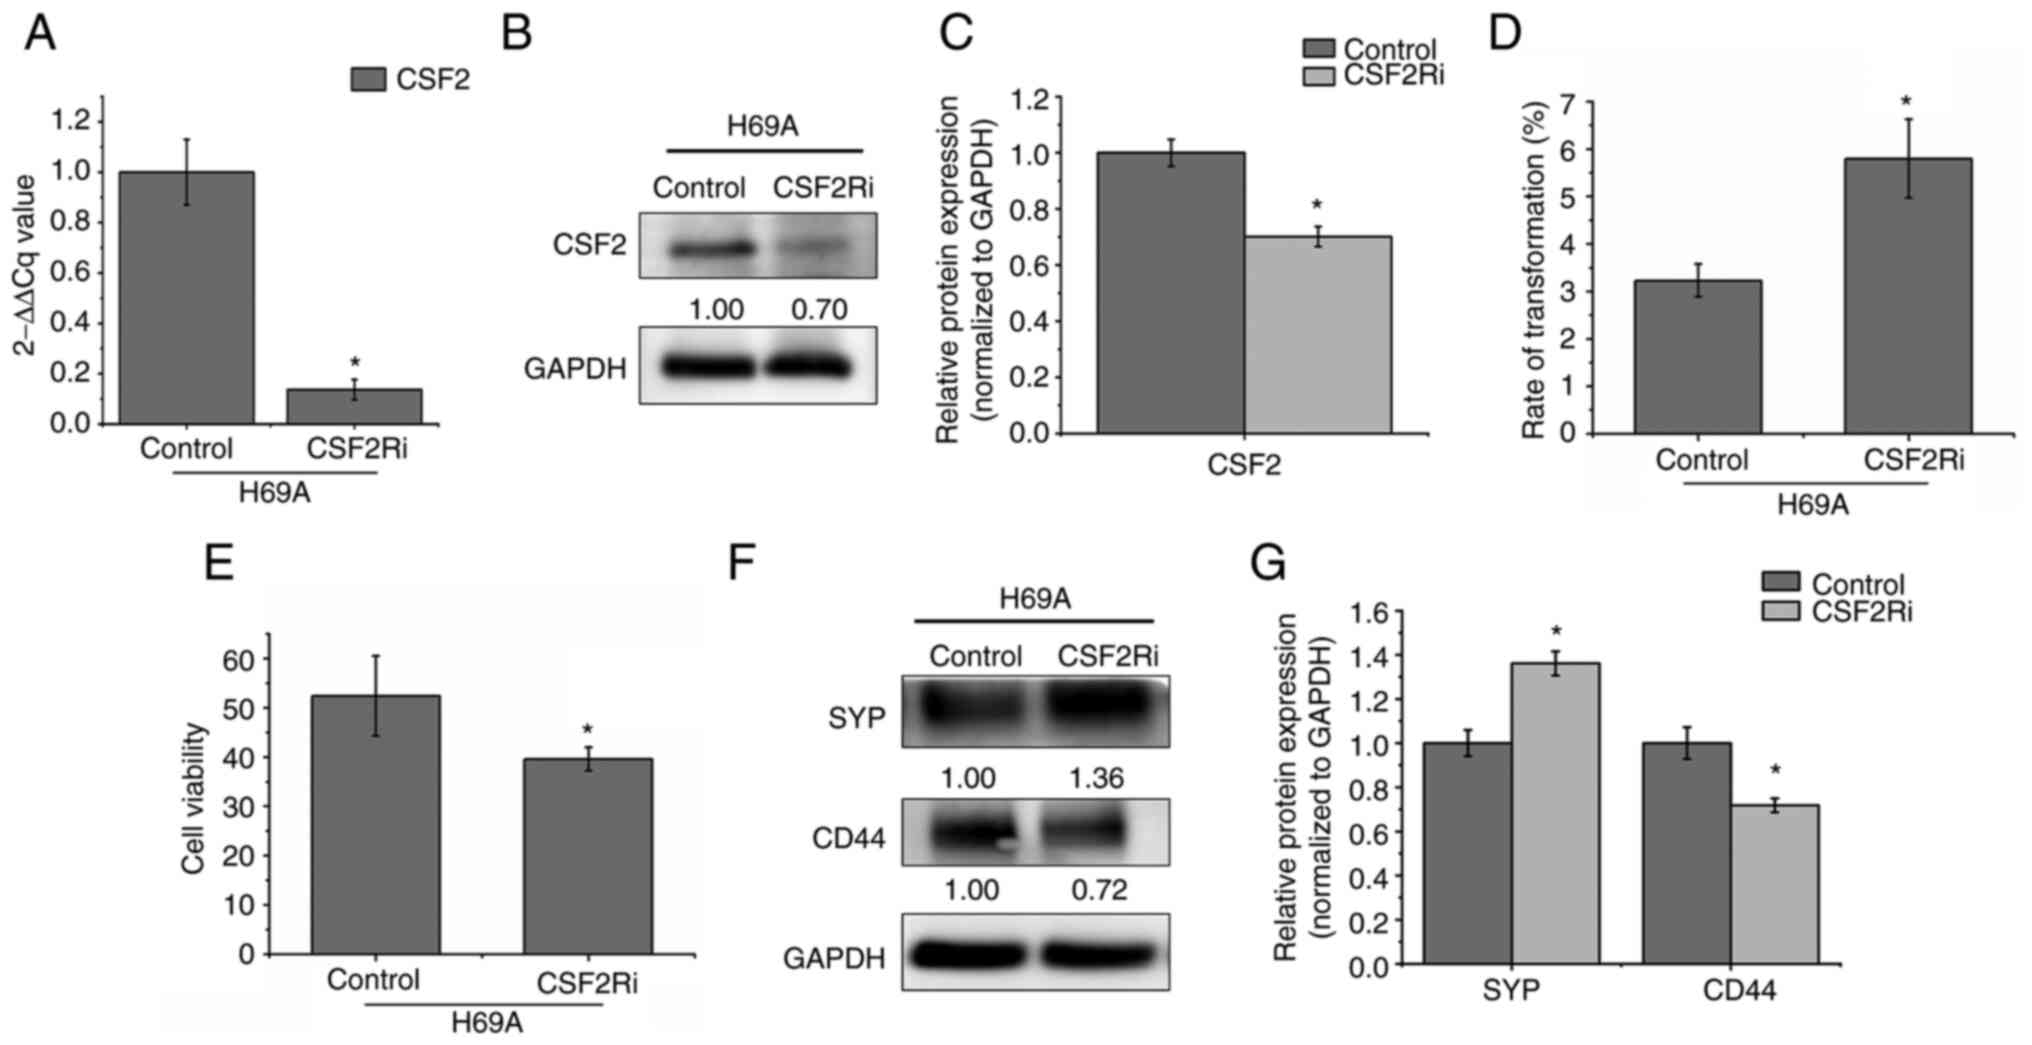
CSF2 silencing promotes the transition
from the adherent phenotype to the suspended phenotype and from the
non-NE type to the NE type
CSF2 is involved in the growth, invasion and
migration of various tumors such as human melanoma, skin cancer and
colorectal cancer (8–9,12).
To explore whether CSF2 regulates phenotypic transformation in
SCLC, CSF2 was silenced by electroporation in H69A. RT-qPCR and
western blotting verified that the cell model was successfully
constructed (Fig. 6A-C). It was
found that, compared to the control group, the conversion rate of
adherent cells to suspension cells increased by 79.57% and cell
activity decreased by 24.42% after 48 h of CSF2 silencing (Fig. 6D and E). Furthermore, compared to
the control cells, the NE marker SYP increased by 36% and the
non-NE marker CD44 decreased by 28% in CSF2 knockdown cells
(Fig. 6F and G). This finding
suggested that the regulation of CSF2 affected the conversion of
adherent cells from the same clone to suspension cells, thereby
decreasing the number of non-NE SCLC cells and increasing the
number of NE-type SCLC cells.
Inhibition of CSF2 increases cell drug
sensitivity and the conversion of the non-NE type to the NE
type
The CSF2 inhibitor butoconazole nitrate was used to
explore the effects of CSF2 on the phenotypic plasticity of SCLC.
H69A was treated with butoconazole 24 and 48 h following treatment.
As the drug concentration and time increased, cell activity
gradually decreased in a dose- and time-dependent manner (Fig. 7A and B). The maximum non-effect
dose or minimum toxic dose (7 µg/ml for 24 h and 3 µg/ml for 48 h)
at two timepoints was selected to test the inhibitory effect of
butoconazole on CSF2. It was found that CSF2 decreased markedly by
30% after 7 µg/ml of butoconazole treatment for 24 h (Fig. 7C and D). H69A cells were then
treated with butoconazole nitrate (7 µg/ml for 24 h) combined with
anlotinib, CS2164, or RAD001. The results were that, as the
combined drug concentration increased, the cell activity gradually
decreased in a dose-dependent manner (Fig. 7E-G). Compared with anlotinib,
CS2164 and RAD001 alone, the combination increased the cell
sensitivity to the three drugs (IC50: 4.76 µg/ml vs.
3.46 µg/ml, 5.67 µg/ml vs. 4.57 µg/ml and 23.11 µg/ml vs. 8.23
µg/ml, respectively). H69A cells were then treated with low or high
concentrations of butoconazole nitrate. The two concentrations of
drugs significantly inhibited CSF2 (34% vs. 35%), CD44 (33% vs.
36%) and YAP1 (46% vs. 49%). A high concentration of butoconazole
nitrate strongly increased SYP (59%), but SYP did not change
significantly in the low-concentration group (Fig. 7H and I). These results suggested
that the inhibition of CSF2 increased the sensitivity to drug
treatment and contributes to the transformation of SCLC from the
non-NE type to the NE type.
 | Figure 7.The effect of CSF2 inhibitors on drug
sensitivity and the conversion of the non-NE phenotype to the NE
phenotype. H69A cells were treated with different concentrations of
butoconazole nitrate (0, 1, 2, 3, 4, 5, 6, 7, 8, 9, 10 and 11
µg/ml) and cell viability was detected with Alamar Blue after
treatment for (A) 24 h and (B) 48 h. (C) H69A cells treated with 3
and 7 µg/ml butoconazole nitrate. The cells were collected after
treatment for 24 and 48 h. The expression of CSF2 and GAPDH were
analyzed by using western blotting. (D) Quantitative analysis of
(C), mock-treated H69A cells were used as the control (100%). Data
are presented as the mean ± standard deviation of three independent
experiments. (E) H69A cells were treated with butoconazole nitrate
(7 µg/ml) combined with anlotinib (0, 0.5, 1, 1.5, 2, 3, 4 and 6
µg/ml), (F) CS2164 (0, 1, 2, 2.5, 3, 4, 6 and 10 µg/ml) and (G)
RAD001 (0, 1, 2, 4, 6, 8, 10 and 20 µg/ml) for 24 h. Cell viability
was tested by using Alamar Blue. (H) H69A cells were treated with
butoconazole nitrate (3 and 7 µg/ml) for 24 h. Western blotting was
used to detect the expression of CSF2, SYP, CD44, YAP1 and GAPDH.
(I) Quantitative analysis of (H), mock-treated H69A cells were used
as the control (100%). Data are presented as the mean ± standard
deviation of three independent experiments. *P<0.05. CSF2,
colony-stimulating factor 2; NE, neuroendocrine; CSF2,
colony-stimulating factor 2; SYP, synaptophysin; YAP1,
YES-associated protein 1. |
CSF2 regulates phenotypic
transformation through p-STAT3/MYC
To further explore the molecular mechanism by which
CSF2 can regulate the phenotypic plasticity of SCLC, the present
study searched for proteins that could interact with CSF2 through
the STRING database. A total of 25 identified proteins were
analyzed. CSF2 and STAT3 had a close protein interaction
relationship (Fig. 8A). By
analyzing the Reactome database, it was found that MYC had a
regulatory relationship with STAT3 (Fig. 8B). The Pathway Commons and STRING
databases were then searched to analyze the relationship between
CSF2, STAT3 and MYC. A regulatory relationship was found between
CSF2, STAT3 and MYC (Fig. 8C and
D). One report (15)
demonstrates that MYC activation induces a shift in SCLC from
ASCL1+ to NEUROD1+ to YAP1+ states by reprogramming the NE fate.
The CSF2/p-STAT3 signaling pathway promotes epithelial ovarian
cancer cell stemness by upregulating MYC (19). Therefore, it was hypothesized that
CSF2 regulates phenotypic plasticity in SCLC through the
p-STAT3/MYC pathway. The expression of CSF2, p-STAT3 and MYC was
detected in H69A and H69S cells and it was found that they were
more highly expressed in H69A cells than in H69S cells (Fig. 8E and F). CSF2 silencing
significantly reduced the expression of p-STAT3 and MYC in H69A
cells (Fig. 8G and H). These
results suggested that CSF2 regulates the phenotypic plasticity of
SCLC through p-STAT3/MYC.
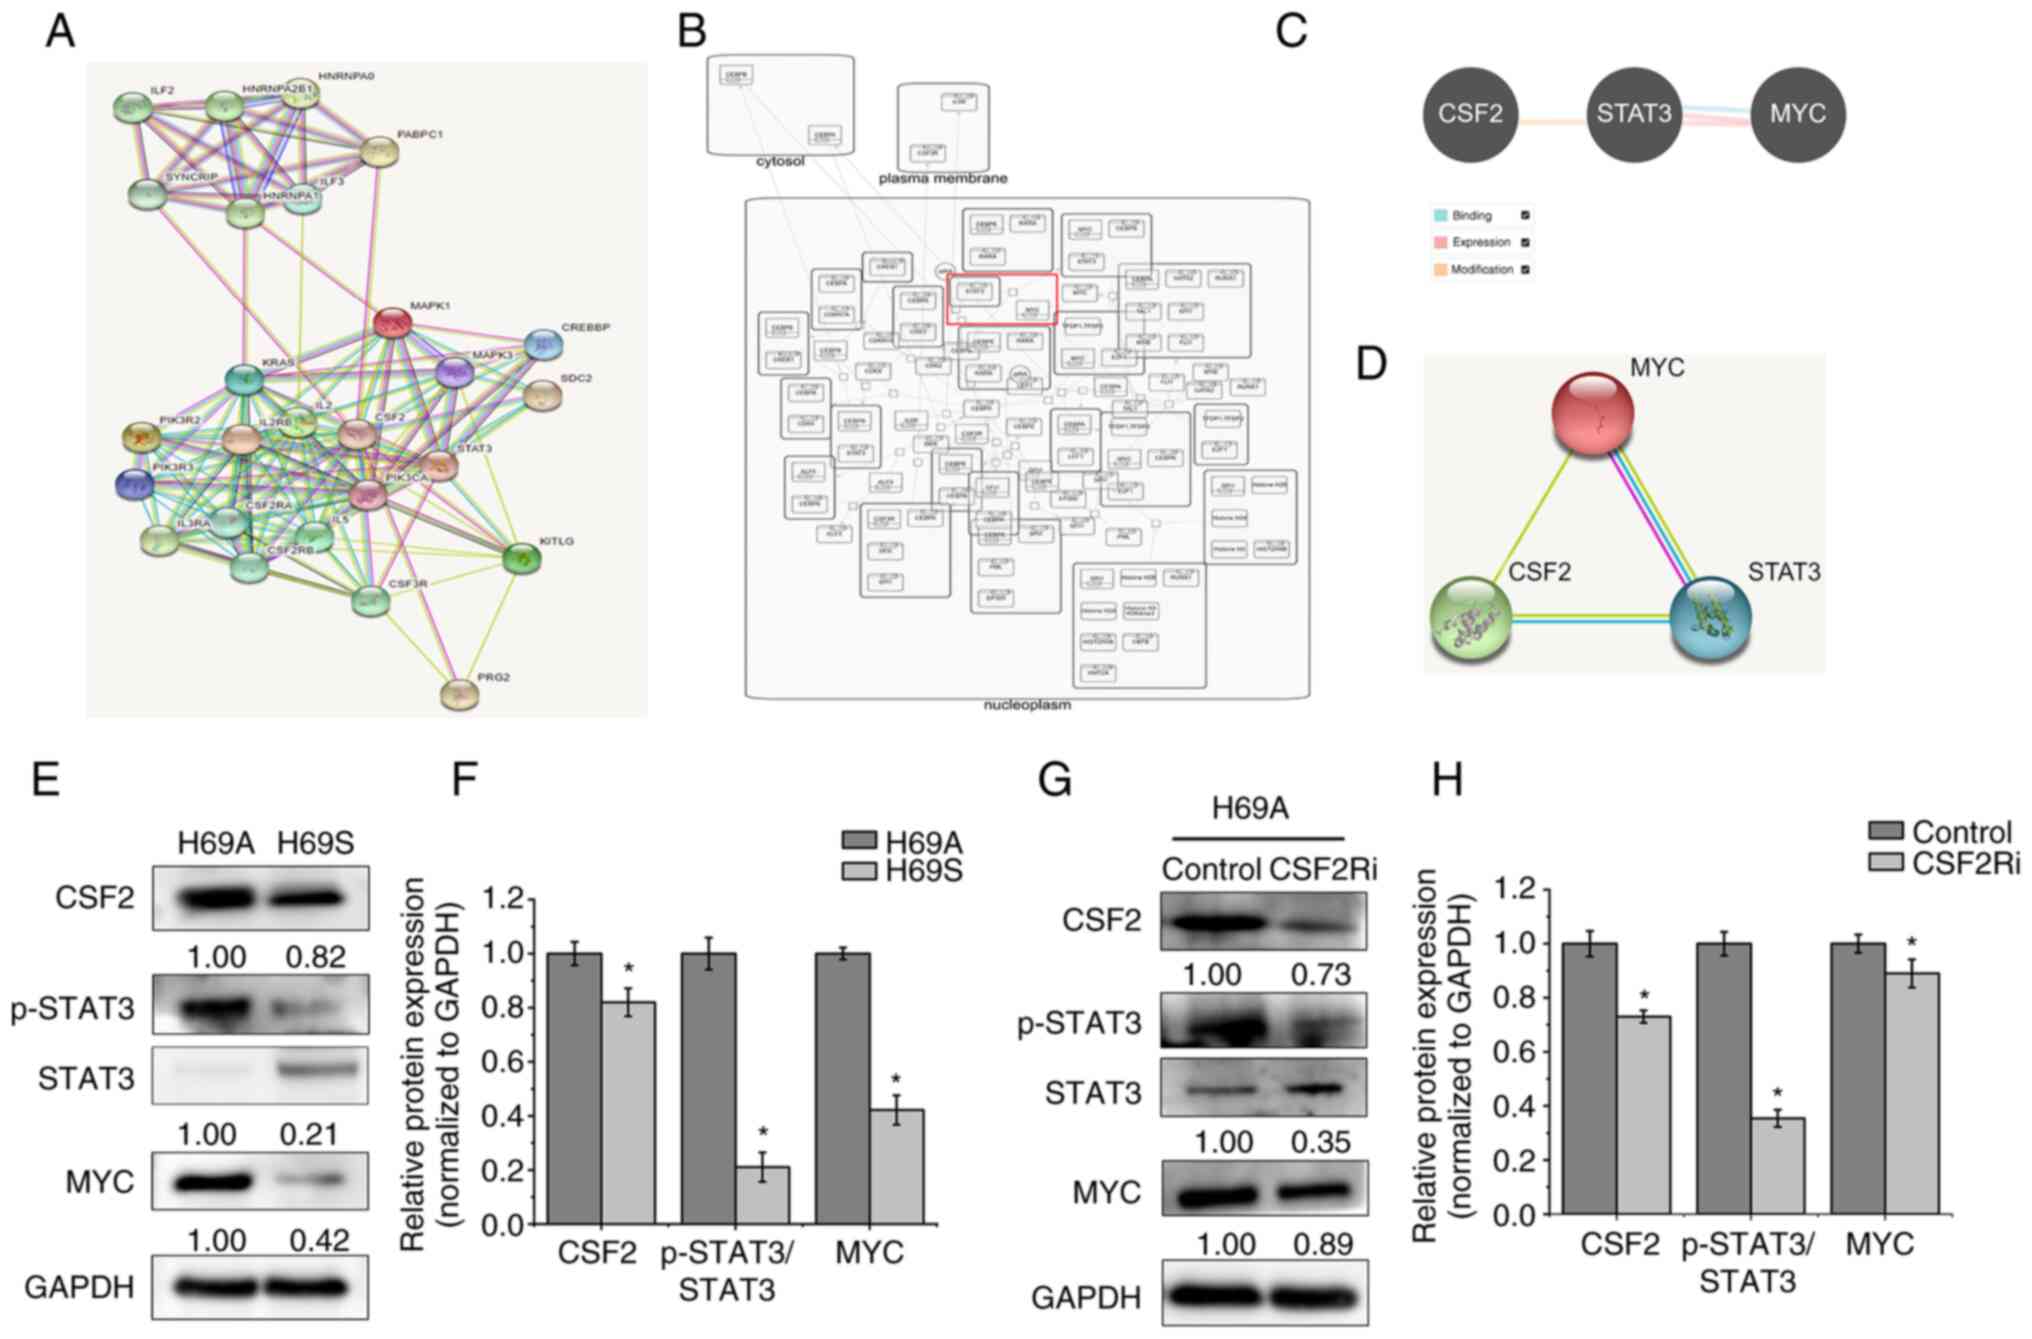 | Figure 8.CSF2 regulated phenotypic
transformation through p-STAT3/MYC. (A) The STRING database was
used to search for proteins that interact with CSF2. Known
interactions are indicated with edges of pink (i.e., experimentally
determined) and deep sky blue (i.e., database obtained). Predicted
interactions are indicated with edges of green (i.e., gene
neighborhood), blue (i.e., gene co-occurrence) and red (i.e., gene
fusions). Edges of yellow indicate text-mining. Edges of black
indicate co-expression. Edges of light purple indicate protein
homology. (B) The Reactome database was used to analyze the
regulatory relationship between MYC and STAT3. (C) The Pathway
Commons database was used to analyze the relationship between CSF2,
STAT3 and MYC. The relationship of binding (deep sky blue),
expression (pink) and modification (orange) are shown. (D) The
STRING database was used to analyze the regulatory relationship
between CSF2, STAT3 and MYC. (E) The levels of CSF2, p-STAT3 and
MYC in H69A and H69S cells were tested with western blotting. (F)
Quantitative analysis of (E): H69A was the control (100%). Data are
presented as the mean ± standard deviation of three independent
experiments. (G) H69A was transfected with CSF2 shRNA and the
expressions of CSF2, p-STAT3, STAT3 and MYC were detected by using
western blotting. (H) Quantitative analysis of (G): H69A cells
transfected with control plasmid were used as the control (100%).
Data are presented as the mean ± standard deviation of three
independent experiments. *P<0.05. p-STAT3, phosphorylated signal
transducer and activator of transcription 3; CSF2,
colony-stimulating factor 2. |
Discussion
Optimal SCLC treatment has been a challenge for
clinicians for nearly three decades. SCLC initially responds well
to platinum-based first-line chemotherapy, although drug resistance
development usually recurs rapidly (26). The main reason is that the
biological characteristics of SCLC have not been clearly
identified, including tumor cell origin, tumor evolution and ITH.
In practice, the present study found that SCLC cells have genetic
differences and phenotypic differences. However, few studies have
investigated the biological function and mechanism of phenotypic
differences, thus, the objective of the present study.
Intertumor heterogeneity can be studied by
microscopic dissection, differences between different tumor sites
and samples from different sources (27,28).
However, ITH, especially exploration of the function and mechanism
of ITH from the same clone source, currently lacks appropriate
research models. Single-cell sequencing is an effective means to
study clonal evolution and ITH (15,29).
However, single cells are difficult to obtain and sequencing is
difficult and costly. Lin et al (30) established two epidermal growth
factor receptor (EGFR) mutant SCLC cell lines from patients with
lung adenocarcinoma after failed treatment with the EGFR-tyrosine
kinase inhibitor (TKI). They revealed that these SCLC cell lines
had two different phenotypes: suspensive and adherent. These two
phenotypic cells came from the same origin and could switch back
and forth. Compared with suspended cells, adherent cells had higher
non-NE characteristics and invasion capacity (30). The present study found that the
adherent and suspended phenotypes of the SCLC cell line NCL-H69
could undergo phenotypic switching and were characterized by
specific heterogeneity such as biogenic preference, NE
characteristics, cell drug sensitivity and drug target expression.
Therefore, NCI-H69 may be a simple and feasible model for exploring
the phenotypic plasticity driving ITH.
In non-small-cell lung cancer (NSCLC), DNA-level
driver gene mutation typing such as EGFR, anaplastic lymphoma
kinase (ALK) and ROS proto-oncogene 1 (ROS1) promotes the long-term
survival of patients with NSCLC and lays the foundation for
gene-based mutational screening of SCLC (31). Unlike NSCLC, which has clear
driving mutations, SCLC is extremely complex with significant
heterogeneity in growth pattern, origin, genome expression and copy
number changes (5,32). SCLC has obvious characteristics
from the standpoint of DNA mutations such as the mutation of P53
and RB deletion, although these DNA gene mutations cannot be used
as targets to develop specific targeted drugs or used as features
to distinguish between subtypes (33,34).
Recent studies (35,36) have demonstrated that several key
transcription factors have an important role in the occurrence and
development of SCLC through RNA sequencing and that SCLC can be
classified, based on transcriptional regulators. Different SCLC
subtypes have unique therapeutic vulnerabilities (37–40).
Through RNA sequencing, the present study identified CSF2, an
important target that drives the phenotypic transition of SCLC and
affects the sensitivity of multiple targeted drugs.
Tumor-associated endothelial cells have been
reported to secrete cytokines to promote angiogenesis by increasing
the expression of cell adhesion molecules (41). CSF2-dependent phosphorylation of
JAK2 and STAT3 recruitment are important in tumor angiogenesis and
vascularization (42,43). In gliomas, CSF2 can activate
antiapoptotic and proangiogenic pathways to promote tumor
progression by activating STAT-3 transcription factor or increasing
VEGF/VEGFR expression (44–48).
Primary and metastatic lung cancers are by far the commonest type
of malignant tumor driven by secreted ectopic CSF2 (25,49–51).
Microarray data show that CSF2 is enhanced in SCLC, but not in
NSCLC (42). In the present study,
compared with the SCLC suspension phenotype, CSF2 was expressed at
a higher level in adherent SCLC. CSF2 regulated the p-STAT3/MYC
signaling pathway to inhibit cell transformation from the adherent
type to the suspension type, which was of the same origin in SCLC.
Inhibition of CSF2 weakened cell adhesion ability, increased the
conversion of adherent phenotypic cells to suspended phenotypic
cells and increased the sensitivity of multitarget TKIs with
anti-vascular functions. CSF2 is an important target for regulating
ITH driven by phenotypic plasticity in SCLC and overcoming drug
resistance.
mTOR inhibitors are a targeted therapy approved by
the US Food and Drug Administration for some types of cancer, such
as NSCLC, breast cancer and pancreatic neuroendocrine neoplasms
(52). RAD001, a mTOR inhibitor,
unfortunately did not improve outcomes in SCLC clinical trials.
This finding may be related to the fact that previous clinical
trials did not stratify the enrolled patients (53,54).
Anlotinib is a multitarget TKI against VEGFR, FGFR, PDGFR and c-Kit
and it suppresses proliferation and induced apoptosis of tumor
cells (55,56). Our ALTER1202 study showed that
anlotinib monotherapy prolonged progression-free survival and
overall survival (OS) in a third-line or later treatment for
extensive SCLC (57). Thus, the
China Food and Drug Administration approved anlotinib for clinical
practice. As stated earlier, whether different SCLC subtypes may
achieve different treatment effects with anlotinib is unclear.
CS2164 is a highly selective multikinase inhibitor with potent
activities against VEGFR, PDGFR, c-Kit, Aurora B and
colony-stimulating factor 1 receptor (58) and it inhibits tumor growth by
targeting certain key pathways such as tumor mitosis, angiogenesis
and the inflammatory microenvironment of the tumor. A Phase I
clinical study (59) of CS2164
demonstrates an acceptable safety and favorable pharmacokinetic
profile with potential antitumor activity. The current study used
three targeted drugs, RAD001, anlotinib and CS2164, which have been
marketed or included in clinical studies. It was found that the
sensitivity to the three drugs was different in SCLC with different
phenotypes, although both phenotypes belonged to the SCLC-A
subtype. Even if patients with SCLC belong to the same molecular
subtype, differences may exist in antitumor effects. Further
stratification of SCLC patients is necessary before treatment.
YAP1 can be activated by the HIPPO signaling pathway
(33), is highly expressed in
non-NE SCLC (60) and defines a
distinct subtype with a T-cell inflamed phenotype in SCLC (61). As a cytokine, CSF2 is primarily
involved in the regulation of immune activation and inflammatory
factors in the tumor microenvironment (62,63).
The present study found that the inhibition of CSF2 reduced non-NE
expression and YAP1 expression. It was hypothesized that CSF2
directly regulated the tumor itself and regulated the phenotypic
plasticity of SCLC through the tumor microenvironment. The authors
of the present study are conducting research in this area. A high
level of YAP1 is reported to promote multidrug resistance (4). In the present study, YAP1 expression
was the significantly changed following treatment with multiple
chemotherapy or targeted drugs. Compared with H69S cells, H69A
cells treated with high concentrations of RAD001 had a
significantly decreased expression of YAP1. However, high
concentrations of CS2164 had a clearly increased expression of
YAP1. Therefore, how to select drugs and doses to suppress
ITH-driven drug resistance is worth considering when determining
the existence of ITH. Ireland et al (15) showed that MYC activates Notch
signaling during NE dedifferentiation in SCLC on a conserved
trajectory from SCLC-A to SCLC-N to SCLC-Y. Their study suggested
that the SCLC-A, SCLC-N and SCLC-Y subtypes are different stages of
the progressive evolution of SCLC and that the regulation of MYC
expression changes cell fate, morphology and drug sensitivity.
Other studies show that the CSF2/p-STAT3 signaling
pathway upregulates MYC expression and enhances the stemness of
epithelial ovarian cancer cells (19). Inhibition of STAT3 significantly
reduces cell adhesion capacity (20) and the expression of the non-NE
marker CD44 (21). The present
study also found that CSF2, p-STAT3 and MYC may be involved in the
regulation of cell phenotypic plasticity. CSF2 inhibition decreased
p-STAT3 and MYC expression and promoted the conversion of adherent
cells with relatively low ASCL1 expression and relatively high YAP1
expression to suspension cells with a relatively high ASCL1
expression and relatively low YAP1. Furthermore, because few
studies exist on ITH-driven drug resistance, additional studies are
warranted to verify the results in clinical specimens such as
organoids and we are conducting such research.
In conclusion, the present study confirmed that SCLC
with different phenotypes of the same clone can switch between
phenotypes and exhibit heterogeneity in cellular viability, drug
sensitivity, NE/non-NE characteristics and other aspects. CSF2 is
an important target for regulating phenotypic plasticity, which
drives ITH. Targeting CSF2 can drive SCLC from the adherent
phenotype to the suspended phenotype through the p-STAT3/MYC
pathway, thereby making cells more anchored to the suspended
phenotype and increasing the expression of the NE marker and the
sensitivity of anlotinib, CS2164 and RAD001. The present study
identified novel pathways involved in restricting phenotypic
plasticity and reducing ITH of SCLC, which is essential for the
development of new therapies to control drug resistance and relapse
in SCLC.
Acknowledgements
Not applicable.
Funding
The present study was financially supported by the Health and
Family Planning Commission of Jilin Province (grant nos. 2021JC095
and 2018J023) and the Development and Reform Commission of Jilin
Province (grant nos. 2021C042-7 and 2021C043-1).
Availability of data and materials
The data generated using high-throughput sequencing
in this study can be found in the Sequence Read Archive under
accession number PRJNA792442 (http://www.ncbi.nlm.nih.gov/sra/PRJNA792442). Other
data generated and analyzed during the current study are available
from the corresponding author on reasonable request.
Authors' contributions
HL and RZ designed the study and wrote the
manuscript. RZ, CH, CT and YL conducted the experiments and
acquired the data. HC, RL and SL assisted with data analysis. YL
and SL contributed reagents, materials and analytical tools. YC was
involved in the conception and design of the study. YC and RZ
confirm the authenticity of all the raw data. All authors reviewed
and approved the final manuscript.
Ethics approval and consent to
participate
Not applicable.
Patient consent for publication
Not applicable.
Competing interests
The authors declare that they have no competing
interests.
Glossary
Abbreviations
Abbreviations:
|
SCLC
|
small cell lung cancer
|
|
PCR
|
polymerase chain reaction
|
|
RT-qPCR
|
reverse transcription quantitative
PCR
|
|
NE
|
neuroendocrine
|
|
CSF2
|
colony-stimulating factor 2
|
|
ASCL1
|
achaete-scute homologue 1
|
|
NEUROD1
|
neurogenic differentiation factor
1
|
|
YAP1
|
YES-associated protein 1
|
|
POU2F3
|
POU class 2 homeobox 3
|
|
NSCLC
|
non-small cell lung cancer
|
|
CTCs
|
circulating tumor cells
|
|
ITH
|
intratumoral heterogeneity
|
|
MDSCs
|
myeloid-derived suppressor cells
|
|
VEGFR
|
vascular endothelial growth factor
receptor
|
|
PDGFR
|
platelet-derived growth factor
receptor
|
|
FGFR
|
fibroblast growth factor receptors
|
|
c-Kit
|
stem cell factor receptor
|
|
CSF1R
|
colony-stimulating factor 1
receptor
|
|
SYP
|
synaptophysin
|
|
EGFR
|
epidermal growth factor receptor
|
|
ALK
|
anaplastic lymphoma kinase
|
|
ROS1
|
ROS proto-oncogene 1
|
|
TKI
|
tyrosine kinase inhibitor
|
|
FC
|
fold change
|
|
GO
|
Gene Ontology
|
|
KEGG
|
Kyoto Encyclopedia of Genes and
Genomes
|
|
DEG
|
differentially expressed genes
|
|
OD
|
optical density
|
|
SDS
|
sodium dodecyl sulfate
|
|
mTOR
|
mammalian target of rapamycin
|
|
OS
|
overall survival
|
References
|
1
|
Oronsky B, Reid TR, Oronsky A and Carter
CA: What's new in sclc? A review. Neoplasia. 19:842–847. 2017.
View Article : Google Scholar
|
|
2
|
Jahchan NS, Lim JS, Bola B, Morris K,
Seitz G, Tran KQ, Xu L, Trapani F, Morrow CJ, Cristea S, et al:
Identification and targeting of long-term tumor-propagating cells
in small cell lung cancer. Cell Rep. 16:644–656. 2016. View Article : Google Scholar : PubMed/NCBI
|
|
3
|
Nicholson AG, Chansky K, Crowley J,
Beyruti R, Kubota K, Turrisi A, Eberhardt WE, van Meerbeeck J,
Rami-Porta R; Staging, Prognostic Factors Committee, et al: The
international association for the study of lung cancer lung cancer
staging project: Proposals for the revision of the clinical and
pathologic staging of small cell lung cancer in the forthcoming
eighth edition of the tnm classification for lung cancer. J Thorac
Oncol. 11:300–311. 2016. View Article : Google Scholar
|
|
4
|
Song Y, Sun Y, Lei Y, Yang K and Tang R:
YAP1 promotes multidrug resistance of small cell lung cancer by
CD74-related signaling pathways. Cancer Med. 9:259–268. 2020.
View Article : Google Scholar : PubMed/NCBI
|
|
5
|
Prabavathy D and Ramadoss N: Heterogeneity
of small cell lung cancer stem cells. Adv Exp Med Biol. 1139:41–57.
2019. View Article : Google Scholar
|
|
6
|
Gazdar AF, Carney DN, Nau MM and Minna JD:
Characterization of variant subclasses of cell lines derived from
small cell lung cancer having distinctive biochemical,
morphological, and growth properties. Cancer Res. 45:2924–2930.
1985.PubMed/NCBI
|
|
7
|
Zhang W, Girard L, Zhang YA, Haruki T,
Papari-Zareei M, Stastny V, Ghayee HK, Pacak K, Oliver TG, Minna JD
and Gazdar AF: Small cell lung cancer tumors and preclinical models
display heterogeneity of neuroendocrine phenotypes. Transl Lung
Cancer Res. 7:32–49. 2018. View Article : Google Scholar : PubMed/NCBI
|
|
8
|
Calbo J, van Montfort E, Proost N, van
Drunen E, Beverloo HB, Meuwissen R and Berns A: A functional role
for tumor cell heterogeneity in a mouse model of small cell lung
cancer. Cancer Cell. 19:244–256. 2011. View Article : Google Scholar
|
|
9
|
Sutherland KD, Proost N, Brouns I,
Adriaensen D, Song JY and Berns A: Cell of origin of small cell
lung cancer: Inactivation of Trp53 and Rb1 in distinct cell types
of adult mouse lung. Cancer Cell. 19:754–764. 2011. View Article : Google Scholar
|
|
10
|
Quintanal-Villalonga Á, Chan JM, Yu HA,
Pe'er D, Sawyers CL, Sen T and Rudin CM: Lineage plasticity in
cancer: A shared pathway of therapeutic resistance. Nat Rev Clin
Oncol. 17:360–371. 2020. View Article : Google Scholar
|
|
11
|
Baldwin GC, Golde DW, Widhopf GF, Economou
J and Gasson JC: Identification and characterization of a
low-affinity granulocyte-macrophage colony-stimulating factor
receptor on primary and cultured human melanoma cells. Blood.
78:609–615. 1991. View Article : Google Scholar : PubMed/NCBI
|
|
12
|
Lamouille S, Xu J and Derynck R: Molecular
mechanisms of epithelial-mesenchymal transition. Nat Rev Mol Cell
Biol. 15:178–196. 2014. View Article : Google Scholar
|
|
13
|
Chen S, Chen X, Li W, Shan T, Lin WR, Ma
J, Cui X, Yang W, Cao G, Li Y, et al: Conversion of
epithelial-to-mesenchymal transition to mesenchymal-to-epithelial
transition is mediated by oxygen concentration in pancreatic cancer
cells. Oncol Lett. 15:7144–7152. 2018.
|
|
14
|
Chaffer CL, Marjanovic ND, Lee T, Bell G,
Kleer CG, Reinhardt F, D'Alessio AC, Young RA and Weinberg RA:
Poised chromatin at the ZEB1 promoter enables breast cancer cell
plasticity and enhances tumorigenicity. Cell. 154:61–74. 2013.
View Article : Google Scholar
|
|
15
|
Ireland AS, Micinski AM, Kastner DW, Guo
B, Wait SJ, Spainhower KB, Conley CC, Chen OS, Guthrie MR, Soltero
D, et al: MYC drives temporal evolution of small cell lung cancer
subtypes by reprogramming neuroendocrine fate. Cancer Cell.
38:60–78.e12. 2020. View Article : Google Scholar
|
|
16
|
Hong IS: Stimulatory versus suppressive
effects of GM-CSF on tumor progression in multiple cancer types.
Exp Mol Med. 48:e2422016. View Article : Google Scholar : PubMed/NCBI
|
|
17
|
Mueller MM and Fusenig NE: Constitutive
expression of G-CSF and GM-CSF in human skin carcinoma cells with
functional consequence for tumor progression. Int J Cancer.
83:780–789. 1999. View Article : Google Scholar : PubMed/NCBI
|
|
18
|
Trutmann M, Terracciano L, Noppen C, Kloth
J, Kaspar M, Peterli R, Tondelli P, Schaeffer C, Zajac P, Heberer M
and Spagnoli GC: GM-CSF gene expression and protein production in
human colorectal cancer cell lines and clinical tumor specimens.
Int J Cancer. 77:378–385. 1998. View Article : Google Scholar : PubMed/NCBI
|
|
19
|
Li X, Wang J, Wu W, Gao H, Liu N, Zhan G,
Li L, Han L and Guo X: Myeloid-derived suppressor cells promote
epithelial ovarian cancer cell stemness by inducing the
CSF2/p-STAT3 signalling pathway. FEBS J. 287:5218–5235. 2020.
View Article : Google Scholar : PubMed/NCBI
|
|
20
|
Qin W, Tian Y, Zhang J, Liu W, Zhou Q, Hu
S, Yang F, Lu L, Lu H, Cui S, et al: The double inhibition of PDK1
and STAT3-Y705 prevents liver metastasis in colorectal cancer. Sci
Rep. 9:129732019. View Article : Google Scholar : PubMed/NCBI
|
|
21
|
Lin CH, Chiang MC and Chen YJ: STAT3
mediates resistance to anoikis and promotes invasiveness of
nasopharyngeal cancer cells. Int J Mol Med. 40:1549–1556. 2017.
View Article : Google Scholar : PubMed/NCBI
|
|
22
|
Li X, Brock GN, Rouchka EC, Cooper NGF, Wu
D, O'Toole TE, Gill RS, Eteleeb AM, O'Brien L and Rai SN: A
comparison of per sample global scaling and per gene normalization
methods for differential expression analysis of RNA-seq data. PLoS
One. 12:e01761852017. View Article : Google Scholar : PubMed/NCBI
|
|
23
|
Sahraeian SME, Mohiyuddin M, Sebra R,
Tilgner H, Afshar PT, Au KF, Bani Asadi N, Gerstein MB, Wong WH,
Snyder MP, et al: Gaining comprehensive biological insight into the
transcriptome by performing a broad-spectrum RNA-seq analysis. Nat
Commun. 8:592017. View Article : Google Scholar : PubMed/NCBI
|
|
24
|
Livak KJ and Schmittgen TD: Analysis of
relative gene expression data using real-time quantitative PCR and
the 2(−Delta Delta C(T)) method. Methods. 25:402–408. 2001.
View Article : Google Scholar : PubMed/NCBI
|
|
25
|
Fukutomi T, Kohno M, Izumi Y, Watanabe M,
Hayashi Y and Nomori H: Pulmonary pleomorphic carcinoma producing
granulocyte-macrophage colony-stimulating factor: Report of a case.
Surg Today. 42:288–291. 2012. View Article : Google Scholar : PubMed/NCBI
|
|
26
|
Rudin CM, Ismaila N, Hann CL, Malhotra N,
Movsas B, Norris K, Pietanza MC, Ramalingam SS, Turrisi AT III and
Giaccone G: Treatment of small-cell lung cancer: American society
of clinical oncology endorsement of the american college of chest
physicians guideline. J Clin Oncol. 33:4106–4111. 2015. View Article : Google Scholar
|
|
27
|
Giercksky HE, Thorstensen L, Qvist H,
Nesland JM and Lothe RA: Comparison of genetic changes in frozen
biopsies and microdissected archival material from the same
colorectal liver metastases. Diagn Mol Pathol. 6:318–325. 1997.
View Article : Google Scholar
|
|
28
|
Friedmann-Morvinski D: Glioblastoma
heterogeneity and cancer cell plasticity. Crit Rev Oncog.
19:327–336. 2014. View Article : Google Scholar : PubMed/NCBI
|
|
29
|
Maynard A, McCoach CE, Rotow JK, Harris L,
Haderk F, Kerr DL, Yu EA, Schenk EL, Tan W, Zee A, et al:
Therapy-induced evolution of human lung cancer revealed by
single-cell RNA sequencing. Cell. 182:1232–1251.e22. 2020.
View Article : Google Scholar
|
|
30
|
Lin CA, Yu SL, Chen HY, Chen HW, Lin SU,
Chang CC, Yu CJ, Yang PC and Ho CC: EGFR-mutant SCLC exhibits
heterogeneous phenotypes and resistance to common antineoplastic
drugs. J Thorac Oncol. 14:513–526. 2019. View Article : Google Scholar
|
|
31
|
Herbst RS, Morgensztern D and Boshoff C:
The biology and management of non-small cell lung cancer. Nature.
553:446–454. 2018. View Article : Google Scholar : PubMed/NCBI
|
|
32
|
Raso MG, Bota-Rabassedas N and Wistuba II:
Pathology and classification of SCLC. Cancers (Basel). 13:8202021.
View Article : Google Scholar : PubMed/NCBI
|
|
33
|
Rudin CM, Poirier JT, Byers LA, Dive C,
Dowlati A, George J, Heymach JV, Johnson JE, Lehman JM, MacPherson
D, et al: Molecular subtypes of small cell lung cancer: A synthesis
of human and mouse model data. Nat Rev Cancer. 19:289–297. 2019.
View Article : Google Scholar : PubMed/NCBI
|
|
34
|
George J, Lim JS, Jang SJ, Cun Y, Ozretić
L, Kong G, Leenders F, Lu X, Fernández-Cuesta L, Bosco G, et al:
Comprehensive genomic profiles of small cell lung cancer. Nature.
524:47–53. 2015. View Article : Google Scholar : PubMed/NCBI
|
|
35
|
Rudin CM, Brambilla E, Faivre-Finn C and
Sage J: Small-cell lung cancer. Nat Rev Dis Primers. 7:32021.
View Article : Google Scholar : PubMed/NCBI
|
|
36
|
Gay CM, Stewart CA, Park EM, Diao L,
Groves SM, Heeke S, Nabet BY, Fujimoto J, Solis LM, Lu W, et al:
Patterns of transcription factor programs and immune pathway
activation define four major subtypes of SCLC with distinct
therapeutic vulnerabilities. Cancer Cell. 39:346–360.e7. 2021.
View Article : Google Scholar
|
|
37
|
Huang YH, Klingbeil O, He XY, Wu XS, Arun
G, Lu B, Somerville TDD, Milazzo JP, Wilkinson JE, Demerdash OE, et
al: POU2F3 is a master regulator of a tuft cell-like variant of
small cell lung cancer. Genes Dev. 32:915–928. 2018. View Article : Google Scholar : PubMed/NCBI
|
|
38
|
Chalishazar MD, Wait SJ, Huang F, Ireland
AS, Mukhopadhyay A, Lee Y, Schuman SS, Guthrie MR, Berrett KC,
Vahrenkamp JM, et al: MYC-driven small-cell lung cancer is
metabolically distinct and vulnerable to arginine depletion. Clin
Cancer Res. 25:5107–5121. 2019. View Article : Google Scholar : PubMed/NCBI
|
|
39
|
Huang F, Ni M, Chalishazar MD, Huffman KE,
Kim J, Cai L, Shi X, Cai F, Zacharias LG, Ireland AS, et al:
Inosine monophosphate dehydrogenase dependence in a subset of small
cell lung cancers. Cell Metab. 28:369–382.e5. 2018. View Article : Google Scholar : PubMed/NCBI
|
|
40
|
Mollaoglu G, Guthrie MR, Böhm S,
Brägelmann J, Can I, Ballieu PM, Marx A, George J, Heinen C,
Chalishazar MD, et al: MYC drives progression of small cell lung
cancer to a variant neuroendocrine subtype with vulnerability to
aurora kinase inhibition. Cancer Cell. 31:270–285. 2017. View Article : Google Scholar
|
|
41
|
Chen C, Duckworth CA, Zhao Q, Pritchard
DM, Rhodes JM and Yu LG: Increased circulation of galectin-3 in
cancer induces secretion of metastasis-promoting cytokines from
blood vascular endothelium. Clin Cancer Res. 19:1693–1704. 2013.
View Article : Google Scholar : PubMed/NCBI
|
|
42
|
Valdembri D, Serini G, Vacca A, Ribatti D
and Bussolino F: In vivo activation of JAK2/STAT-3 pathway during
angiogenesis induced by GM-CSF. FASEB J. 16:225–227. 2002.
View Article : Google Scholar : PubMed/NCBI
|
|
43
|
Zgheib A, Lamy S and Annabi B:
Epigallocatechin gallate targeting of membrane type 1 matrix
metalloproteinase-mediated Src and Janus kinase/signal transducers
and activators of transcription 3 signaling inhibits transcription
of colony-stimulating factors 2 and 3 in mesenchymal stromal cells.
J Biol Chem. 288:13378–13386. 2013. View Article : Google Scholar : PubMed/NCBI
|
|
44
|
Brantley EC, Nabors LB, Gillespie GY, Choi
YH, Palmer CA, Harrison K, Roarty K and Benveniste EN: Loss of
protein inhibitors of activated STAT-3 expression in glioblastoma
multiforme tumors: Implications for STAT-3 activation and gene
expression. Clin Cancer Res. 14:4694–4704. 2008. View Article : Google Scholar : PubMed/NCBI
|
|
45
|
Weissenberger J, Loeffler S, Kappeler A,
Kopf M, Lukes A, Afanasieva TA, Aguzzi A and Weis J: Il-6 is
required for glioma development in a mouse model. Oncogene.
23:3308–3316. 2004. View Article : Google Scholar : PubMed/NCBI
|
|
46
|
Niola F, Evangelisti C, Campagnolo L,
Massalini S, Buè MC, Mangiola A, Masotti A, Maira G, Farace MG and
Ciafrè SA: A plasmid-encoded VEGF siRNA reduces glioblastoma
angiogenesis and its combination with interleukin-4 blocks tumor
growth in a xenograft mouse model. Cancer Biol Ther. 5:174–179.
2006. View Article : Google Scholar : PubMed/NCBI
|
|
47
|
Jung KH, Chu K, Lee ST, Kim SJ, Sinn DI,
Kim SU, Kim M and Roh JK: Granulocyte colony-stimulating factor
stimulates neurogenesis via vascular endothelial growth factor with
STAT activation. Brain Res. 1073–1074. 190–201. 2006.
|
|
48
|
Ohki Y, Heissig B, Sato Y, Akiyama H, Zhu
Z, Hicklin DJ, Shimada K, Ogawa H, Daida H, Hattori K and Ohsaka A:
Granulocyte colony-stimulating factor promotes neovascularization
by releasing vascular endothelial growth factor from neutrophils.
FASEB J. 19:2005–2007. 2005. View Article : Google Scholar : PubMed/NCBI
|
|
49
|
Lammel V, Stoeckle C, Padberg B, Zweifel
R, Kienle DL, Reinhart WH and Simon HU: Hypereosinophilia driven by
GM-CSF in large-cell carcinoma of the lung. Lung Cancer.
76:493–495. 2012. View Article : Google Scholar : PubMed/NCBI
|
|
50
|
Bahar B, Acedil Ayc Iota B, Çoşkun U,
Büyükberber S, Benekli M and Yildiz R: Granulocyte colony
stimulating factor (G-CSF) and macrophage colony stimulating factor
(M-CSF) as potential tumor markers in non small cell lung cancer
diagnosis. Asian Pac J Cancer Prev. 11:709–712. 2010.PubMed/NCBI
|
|
51
|
Shalom G, Sion-Vardy N, Dudnik J and Ariad
S: Leukemoid reaction in lung cancer patients. Isr Med Assoc J.
12:255–256. 2010.PubMed/NCBI
|
|
52
|
Orr-Asman MA, Chu Z, Jiang M, Worley M,
LaSance K, Koch SE, Carreira VS, Dahche HM, Plas DR, Komurov K, et
al: mTOR kinase inhibition effectively decreases progression of a
subset of neuroendocrine tumors that progress on rapalog therapy
and delays cardiac impairment. Mol Cancer Ther. 16:2432–2441. 2017.
View Article : Google Scholar : PubMed/NCBI
|
|
53
|
Besse B, Heist RS, Papadmitrakopoulou VA,
Camidge DR, Beck JT, Schmid P, Mulatero C, Miller N, Dimitrijevic
S, Urva S, et al: A phase Ib dose-escalation study of everolimus
combined with cisplatin and etoposide as first-line therapy in
patients with extensive-stage small-cell lung cancer. Ann Oncol.
25:505–511. 2014. View Article : Google Scholar
|
|
54
|
Tarhini A, Kotsakis A, Gooding W, Shuai Y,
Petro D, Friedland D, Belani CP, Dacic S and Argiris A: Phase II
study of everolimus (RAD001) in previously treated small cell lung
cancer. Clin Cancer Res. 16:5900–5907. 2010. View Article : Google Scholar : PubMed/NCBI
|
|
55
|
Lin B, Song X, Yang D, Bai D, Yao Y and Lu
N: Anlotinib inhibits angiogenesis via suppressing the activation
of VEGFR2, PDGFRβ and FGFR1. Gene. 654:77–86. 2018. View Article : Google Scholar : PubMed/NCBI
|
|
56
|
Xie C, Wan X, Quan H, Zheng M, Fu L, Li Y
and Lou L: Preclinical characterization of anlotinib, a highly
potent and selective vascular endothelial growth factor receptor-2
inhibitor. Cancer Sci. 109:1207–1219. 2018. View Article : Google Scholar
|
|
57
|
Cheng Y, Wang Q, Li K, Shi J, Liu Y, Wu L,
Han B, Chen G, He J, Wang J, et al: Anlotinib vs placebo as third-
or further-line treatment for patients with small cell lung cancer:
A randomised, double-blind, placebo-controlled phase 2 study. Br J
Cancer. 125:366–371. 2021. View Article : Google Scholar : PubMed/NCBI
|
|
58
|
Zhou Y, Shan S, Li ZB, Xin LJ, Pan DS,
Yang QJ, Liu YP, Yue XP, Liu XR, Gao JZ, et al: CS2164, a novel
multi-target inhibitor against tumor angiogenesis, mitosis and
chronic inflammation with anti-tumor potency. Cancer Sci.
108:469–477. 2017. View Article : Google Scholar
|
|
59
|
Sun Y, Yang L, Hao X, Liu Y, Zhang J, Ning
Z and Shi Y: Phase I dose-escalation study of chiauranib, a novel
angiogenic, mitotic, and chronic inflammation inhibitor, in
patients with advanced solid tumors. J Hematol Oncol. 12:92019.
View Article : Google Scholar
|
|
60
|
Pearsall SM, Humphrey S, Revill M, Morgan
D, Frese KK, Galvin M, Kerr A, Carter M, Priest L, Blackhall F, et
al: The rare YAP1 subtype of SCLC revisited in a biobank of 39
circulating tumor cell patient derived explant models: A brief
report. J Thorac Oncol. 15:1836–1843. 2020. View Article : Google Scholar
|
|
61
|
Owonikoko TK, Dwivedi B, Chen Z, Zhang C,
Barwick B, Ernani V, Zhang G, Gilbert-Ross M, Carlisle J, Khuri FR,
et al: YAP1 expression in SCLC defines a distinct subtype with
T-cell-inflamed phenotype. J Thorac Oncol. 16:464–476. 2021.
View Article : Google Scholar
|
|
62
|
Hamilton JA: GM-CSF in inflammation. J Exp
Med. 217:e201909452020. View Article : Google Scholar : PubMed/NCBI
|
|
63
|
Mehta HM, Malandra M and Corey SJ: G-CSF
and GM-CSF in neutropenia. J Immunol. 195:1341–1349. 2015.
View Article : Google Scholar
|