Introduction
Despite a decline in incidence and mortality rates
over recent decades, gastric cancer (GC) remains the 5th most
common malignancy worldwide, with a significant proportion of new
cases emerging in Japan, South Korea and China (1). Its asymptomatic nature in early stages
often results in delayed diagnosis and increased mortality rates
(2). Concurrently, there has been a
burgeoning interest in elucidating the tumor microenvironment (TME)
in GC progression, characterized by a complex interplay among
diverse immune cells, cancer-associated fibroblasts (CAFs),
endothelial cells (ECs) and various tissue-resident cells (3). This milieu undergoes dynamic changes
throughout GC progression, typified by an augmented proportion of
stromal and immunosuppressive cells, including CAFs, ECs and
tumor-associated macrophages (TAMs) (4). Despite advancements in targeted
therapy and immunotherapy, chemotherapy remains pivotal in GC
treatment, notwithstanding the persistent challenge of chemotherapy
resistance, the mechanisms of which remain inadequately understood
(5).
Decidual protein induced by progesterone (DEPP1),
initially identified as a progesterone-induced protein during
decidualization of endometrial stromal cells, manifests
heterogeneous roles in tumorigenesis across diverse cancers
(6–10). DEPP1 contributes to cellular
reactive oxygen species (ROS) accumulation in neuroblastoma by
impairing catalase activity, thereby sensitizing neuroblastoma
cells to ROS-induced cell death (7). DEPP1 expedites the senescence of
colorectal cancer cells, characterized by the improved activity of
senescence-associated β-galactosidase upon its ectopic or induced
expression, suggesting a tumor-suppressive role (8). Conversely, high DEPP1 expression is
associated with a poor prognosis in patients with cervical cancer
(9). In glioma, upregulated by
hypoxia, DEPP1 facilitates tumor growth and predicts a poor
prognosis, implicating a tumor-supportive effect (10). To the best of our knowledge, no
research has explored the role of DEPP1 in GC before.
The investigation unveiled a pronounced expression
of DEPP1 in GC, correlating with poor prognosis and potentially
enhancing the prognostic utility of the tumor-node-metastasis (TNM)
staging system. Furthermore, DEPP1 expression exhibited
associations with a stroma-rich and immunosuppressive
microenvironment in GC, suggesting its contributory role in shaping
the TME. Notably, DEPP1 was also found to promote resistance to
oxaliplatin, a commonly used chemotherapeutic agent. These findings
collectively posit DEPP1 as a prognostic indicator and plausible
therapeutic target for overcoming oxaliplatin resistance in GC.
Materials and methods
Data collection
Gene expression data and corresponding clinical
characteristics of patients with GC were obtained from The Cancer
Genome Atlas (TCGA) database [TCGA-Stomach Adenocarcinoma (STAD);
https://portal.gdc.cancer.gov/] and the
Gene Expression Omnibus (GEO; http://www.ncbi.nlm.nih.gov/geo/) database, including
datasets GSE84437 and GSE15459 (11,12).
For sequencing data from the TCGA-STAD cohort, FPKM values were
transformed into transcripts per million values for subsequent
analysis. Detailed clinicopathologic information for these three
cohorts is summarized in Table SI.
A systematic search was conducted to identify GEO datasets that
provided high-quality mRNA expression profiling data for GC and
normal tissues, with a minimum sample size of 50 to ensure robust
statistical analysis.
Differential expression analysis
The ‘limma’ R package (v.3.58.1) was utilized to
identify differentially expressed genes (DEGs) between GC and
normal tissues in the screened GEO datasets, employing thresholds
of |log2FoldChange|>0.9 and an adjusted P-value <0.05
(13). During data processing,
expression values were evaluated and normalized using the
‘normalizeBetweenArrays’ function to ensure consistency if
necessary. Subsequently, the ‘VennDiagram’ R package (v.1.7.3) was
employed to determine the overlap of upregulated and downregulated
genes across the three cohorts (14).
Cell culture and reagents
Human GC cell line MKN45 was purchased from MEISEN
CELL (cat. no. CTCC-ZHYC-0503; http://www.casmart.com.cn//product-details/page/300039501/508278209).
293T cell line and GC cell line HGC27 were preserved at the
Shanghai Cancer Institute (Shanghai, China). All cell lines were
authenticated using short tandem repeat DNA profiling analysis and
routinely tested to confirm the absence of mycoplasma
contamination. MKN45 and HGC27 cells were cultured in RPMI-1640
medium (cat. no. C11875500BT; Gibco; Thermo Fisher Scientific,
Inc.), supplemented with 10% fetal bovine serum (FBS) (cat. no.
S711-001S; Lonsera). 293T cells were cultured in DMEM medium
(C11995500BT; Gibco; Thermo Fisher Scientific, Inc.), supplemented
with 10% FBS. Cultures were maintained at 37°C in a humidified
incubator with 5% CO2. Oxaliplatin (cat. no. S1224;
Selleck Chemicals) and fluorouracil (5-FU) (cat. no. HY-90006;
MedChemExpress) were utilized in the present study.
RNA isolation and reverse
transcription-quantitative PCR (RT-qPCR)
Total RNA from 11 pairs of GC and adjacent normal
tissues was extracted using the RNAsimple Total RNA Kit (cat. no.
DP419; Tiangen Biotech Co., Ltd.) following the manufacturer's
instructions. The concentration and quality of the isolated RNA
were evaluated using a NanoDrop 2000c spectrophotometer (Thermo
Fisher Scientific, Inc.), with results summarized in Table SII. Subsequently, total RNA was
reverse transcribed into cDNA using the HiScript III 1st Strand
cDNA Synthesis Kit (cat. no. R312; Vazyme Biotech Co., Ltd.). The
RT-qPCR reaction mix was prepared according to the manufacturer
instructions of ChamQ SYBR qPCR Master Mix (cat. no. Q311; Vazyme
Biotech Co., Ltd.) and run on a QuantStudio Dx system (Applied
Biosystems; Thermo Fisher Scientific, Inc.). First, the mix was
pre-denatured at 95°C for 5 min. Subsequently, 40 cycles were
performed: 10 sec at 95°C and 30 sec at 60°C, followed by a melting
curve analysis according to the QuantStudio's default settings.
Relative mRNA expression levels were calculated using the
2-ΔΔCq method, with GAPDH mRNA serving as an internal
reference (15). The primer
sequences for DEPP1 and GAPDH are provided in Table SIII.
Western blotting
GC tissues and cells underwent lysis using RIPA
lysis buffer (cat. no. BL504A; Biosharp Life Sciences) supplemented
with 1 mM PMSF (cat. no. ST506; Beyotime Institute of
Biotechnology) on ice for 30 min. Protein concentrations were
determined using a BCA Protein Quantification Kit (cat. no.
20201ES; Shanghai Yeasen Biotechnology Co., Ltd.). Subsequently, 20
µg of protein samples per lane underwent electrophoresis using 10%
gel and were transferred onto 0.45-µm PVDF membranes (cat. no.
IPVH00010, Sigma-Aldrich). The membranes were then incubated with
5% skimmed milk at room temperature for 1 h. Following this, the
membranes were probed with primary antibodies against DEPP1
(1:1,000; cat. no. 25833-1-AP; Proteintech Group, Inc.), PARP
(1:1,000; cat. no. 9532; Cell Signaling Technology, Inc.), cleaved
PARP (1:500; cat. no. HY-P80448; MedChemExpress), GAPDH (1:1,000;
cat. no. 5174; Cell Signaling Technology, Inc.), or β-actin
(1:20,000; cat. no. 66009-1-Ig; Proteintech Group, Inc.) at 4°C
overnight, followed by incubation with peroxidase-conjugated goat
anti-rabbit IgG (33101ES60, 1:5,000, Shanghai Yeasen Biotechnology
Co., Ltd.) or peroxidase-conjugated goat anti-mouse IgG (1:5,000;
cat. no. BL001A; Biosharp Life Sciences) at room temperature for 1
h. Finally, proteins were visualized using an Omni-ECL™Pico Light
Chemiluminescence Kit (cat. no. SQ202L; Epizyme, Inc.).
Immunofluorescence assay
GC and adjacent normal tissues were fixed with 4%
paraformaldehyde at room temperature for at least 24 h.
Subsequently, the formalin-fixed tissues were embedded in paraffin
and sectioned into 4 µm-thick sections. The formalin-fixed and
paraffin-embedded (FFPE) sections underwent deparaffinization in
xylene, followed by rehydration in an alcohol gradient, and antigen
retrieval in Tris-EDTA buffer (pH 9.0). Sections were then blocked
with 5% BSA (cat. no. GC305010; Wuhan Servicebio Technology Co.,
Ltd.) for 1 h at room temperature. Next, sections were incubated
with primary antibody against DEPP1 (1:200; cat. no. NBP3-17581;
Novus Biologicals, Ltd.) at 4°C overnight, followed by incubation
with secondary Alexa Fluor 594 AffiniPure Goat Anti-Rabbit IgG
(1:400; cat. no. BL064A; Biosharp Life Sciences) at room
temperature for 1 h in darkness. Nuclei were stained with DAPI (2
µg/ml; cat. no. G1012; Wuhan Servicebio Technology Co., Ltd.) for
10 min. Images were captured using a Nikon fluorescence microscope
(ECLIPSE Ts2; Nikon Corporation).
Immunohistochemistry (IHC) assay
Human and mouse GC tissue samples were processed
according to the immunofluorescence protocol up to antigen
retrieval. After antigen retrieval in Tris-EDTA buffer (pH 9.0),
FFPE sections were treated with 3% H2O2 at
room temperature for 10 min to inactivate endogenous peroxidases.
Sections were then blocked with 5% BSA for 1 h at room temperature.
Following this, sections were incubated with primary antibody
against DEPP1 (1:200; cat. no. NBP3-17581; Novus Biologicals,
Ltd.), Ki67 (1:2,000; cat. no. ab15580; Abcam), or cleaved caspase
3 (1:2,000; cat. no. 9664; Cell Signaling Technology, Inc.) at 4°C
overnight, followed by incubation with Goat Anti-Rabbit IgG (1:600;
cat. no. 33101ES60, 1:600; Shanghai Yeasen Biotechnology Co., Ltd.)
at room temperature for 1 h. Finally, sections were subjected to a
DAB Substrate Kit (cat. no. BL732A; Biosharp Life Sciences) and
counterstained with hematoxylin. Images were captured using a light
microscope (BX43; Olympus Corporation).
DEPP1 staining intensity and area were independently
assessed by two experienced gastroenterologists, blinded to the
patients' clinical characteristics. Staining intensity was graded
as 0 for negative staining, 1 for weak staining, 2 for moderate
staining, and 3 for intense staining. The positive staining area
was rated as follows: 0 (<5%), 1 (6 to 25%), 2 (26 to 50%), 3
(51 to 75%), and 4 (>75%). Any discrepancies in assessment were
resolved by consultation with a third gastroenterologist when
necessary. The IHC score of DEPP1 was calculated by multiplying
staining intensity by staining area, resulting in scores ranging
from 0 to 12.
Construction and validation of a
prognostic nomogram
Utilizing the results from multivariate Cox
regression analysis in the TCGA-STAD cohort, a prognostic nomogram
that integrates DEPP1 expression and clinical parameters was
developed. This nomogram was constructed using the ‘survival’
(v.3.5–7) and ‘regplot’ (v.1.1) R packages (16). To evaluate its performance,
calibration curves and decision curve analysis (DCA) were employed
(17).
Analysis of the correlation between
DEPP1 and tumor microenvironment
The stromal, immune, and estimate scores for each
patient with GC in the TCGA-STAD cohort were predicted using the
‘Estimation of STromal and Immune cells in MAlignant Tumor tissues
using Expression data’ (ESTIMATE) algorithm (18). Additionally, the EPIC, TIMER, and
quanTIseq algorithms were applied to predict the infiltration level
of stromal and immune cells in the GC TME based on sequencing data
from the TCGA-STAD cohort by employing the ‘immunedeconv’ R package
(v.2.1.0) (19–22).
Functional enrichment analysis and
Friends analysis
Gene Ontology (GO) and Kyoto Encyclopedia of Genes
and Genomes (KEGG) enrichment analyses of the DEGs between the low-
and high-expression groups of DEPP1 were conducted using the
‘clusterProfiler’ R package (v.4.10.0) (23). Furthermore, gene set enrichment
analysis (GSEA) was performed to investigate the underlying
regulatory mechanisms of DEPP1 (23,24).
Subsequently, Friends analysis was carried out to identify the
downstream hub genes of DEPP1, with the top 10 genes with the
highest GO semantic similarity designated as hub genes using the
‘GOSemSim’ R package (v.2.28.1) (25).
Prediction of sensitivity to
chemotherapy
The half maximal inhibitory concentration
(IC50), a common measure reflecting tumor cell
sensitivity to chemotherapy agents, was predicted using the
‘oncoPredict’ R package (v.1.2) (26). This prediction involved utilizing
the Genomics of Drug Sensitivity in Cancer (GDSC; http://www.cancerrxgene.org/) or Cancer Therapeutics
Response Portal (CTRP; http://portals.broadinstitute.org/ctrp/) dataset as a
training set and the gene expression profiles from the TCGA-STAD
cohort as a test set.
Lentivirus production and
infection
Lentiviral plasmids encoding human DEPP1 and an
empty vector were purchased from WZ Biosciences, Inc. 293T cells
were transfected at 37°C with a total of 4 µg of DEPP1-encoding
plasmids, psPAX2 (cat. no. 12260; Addgene, Inc.), and pMD2.G (cat.
no. 12259, Addgene, Inc.) in a ratio of 4:3:2 using jetPRIME
reagent (cat. no. 114-15; Polyplus-transfection SA). After 48 h,
the supernatants were collected, centrifuged, and filtered through
a 0.45 um filter. The lentivirus was then transduced into GC cells
in the presence of 8 µg/ml polybrene (cat. no. 40804ES76; Shanghai
Yeasen Biotechnology Co., Ltd.) for 16 h. Infected cells were
subsequently selected with 2 µg/ml puromycin (cat. no. ST551;
Beyotime Institute of Biotechnology) for 48 h to generate stable
DEPP1-expressing GC cell lines.
Cell proliferation assay
GC cells (1×10⁵) were seeded in 12-well
plates in triplicate. After 24 h, oxaliplatin was added to the
culture medium to achieve a final concentration of 10 µM. Following
another 24-h incubation at 37°C, cells were harvested, and
proliferation rates were assessed using the EdU Kit (cat. no.
CX004; CellorLab; http://www.epizyme.cn/Products/Details/CX004)
according to the manufacturer's instructions.
Annexin V/PI flow cytometry
GC cells (1×10⁵) were seeded in 12-well
plates in triplicate. Upon adherence, oxaliplatin was added to a
final concentration of 20 µM. After 24 h, cells were stained with
BV421-conjugated Annexin V (cat. no. 640924; BioLegend, Inc.) and
PE-conjugated PI (cat. no. 421301; BioLegend, Inc.) for 15 min in
the dark at room temperature. Samples were analyzed using a Cytek
Northern Lights flow cytometer (Cytek Biosciences) to detect
apoptotic cells, and data were processed using FlowJo software
(v.10.8.1; BD Biosciences).
Wound healing assay
GC cells (6×10⁵) were seeded in 6-well
plates in triplicate. Once confluence was reached, the cell
monolayer was scratched with a sterile 200 µl pipette tip and
washed three times with PBS. Cells were then cultured in serum-free
RPMI 1640 medium, and images were captured at 0 and 48 h using a
light microscope (Nikon ECLIPSE Ts2). Wound areas were measured
using ImageJ software (1.54f; National Institutes of Health).
Animal studies
All mice were housed and fed in the specific
pathogen-free animal experiment center at RenJi Hospital (Shanghai,
China), where they were maintained under a controlled 12/12-h
light/dark cycle, with the temperature at 23±2°C and humidity at
50±1%. All animal experiments were conducted in accordance with
institutional guidelines and were approved by the Institutional
Animal Care and Use Committee of Renji Hospital (approval no.
KY2021-252-B). A total of 20 female BALB/c nude mice, aged 4 weeks
and weighing ~20 g, were purchased from GemPharmatech Co., Ltd.
MKN45 cells (3×10⁶), either stably expressing DEPP1 or
the empty vector, were subcutaneously injected into the right flank
of each mouse, with 5 mice per group. Beginning 8 days
post-injection, oxaliplatin or 5% glucose saline was administered
intraperitoneally at a dosage of 5 mg/kg every 2 to 4 days. Tumor
volumes were measured every 2 to 4 days using the formula 0.5 ×
length × width2. All mice were euthanized by cervical
dislocation under 3% isoflurane-induced anesthesia to minimize
suffering and distress when the tumor diameter reached 15 mm or
when tumor burden exceeded 10% of body weight. The mice were
confirmed dead by the cessation of heartbeat or breathing, or by
the loss of pain response. Tumors were then harvested, weighed and
subjected to further analyses.
Statistical analysis
Statistical analyses were conducted using R
(v.4.1.2; http://cran.r-project.org/) or
GraphPad Prism (v.8.0.1; Dotmatics) software. Continuous variables
are presented as the mean ± standard deviation and compared using
Wilcoxon test for two groups and Kruskal-Wallis test for three or
more groups. Categorical variables are presented as counts and
compared using Fisher's exact test. Pearson's correlation test was
utilized to measure the correlation between two continuous
variables. Logistic regression was employed to explore the
correlation between DEPP1 expression and clinical features.
Kaplan-Meier curves were plotted to display overall survival (OS)
and disease-free survival (DFS) of patients with GC, with
differences between groups determined using the log-rank test. The
restricted mean survival time (RMST) difference was estimated using
the ‘survRM2’ R package (v.1.0–4) (27). Univariate and multivariate Cox
regression analyses were conducted to investigate the prognostic
significance of DEPP1 and other clinicopathologic parameters.
Receiver operating characteristic (ROC) curves were plotted to
evaluate the ability of DEPP1 to predict the OS of patients with
GC. P<0.05 was considered to indicate a statistically
significant difference.
Results
Identification of DEPP1 as a novel
upregulated gene in GC
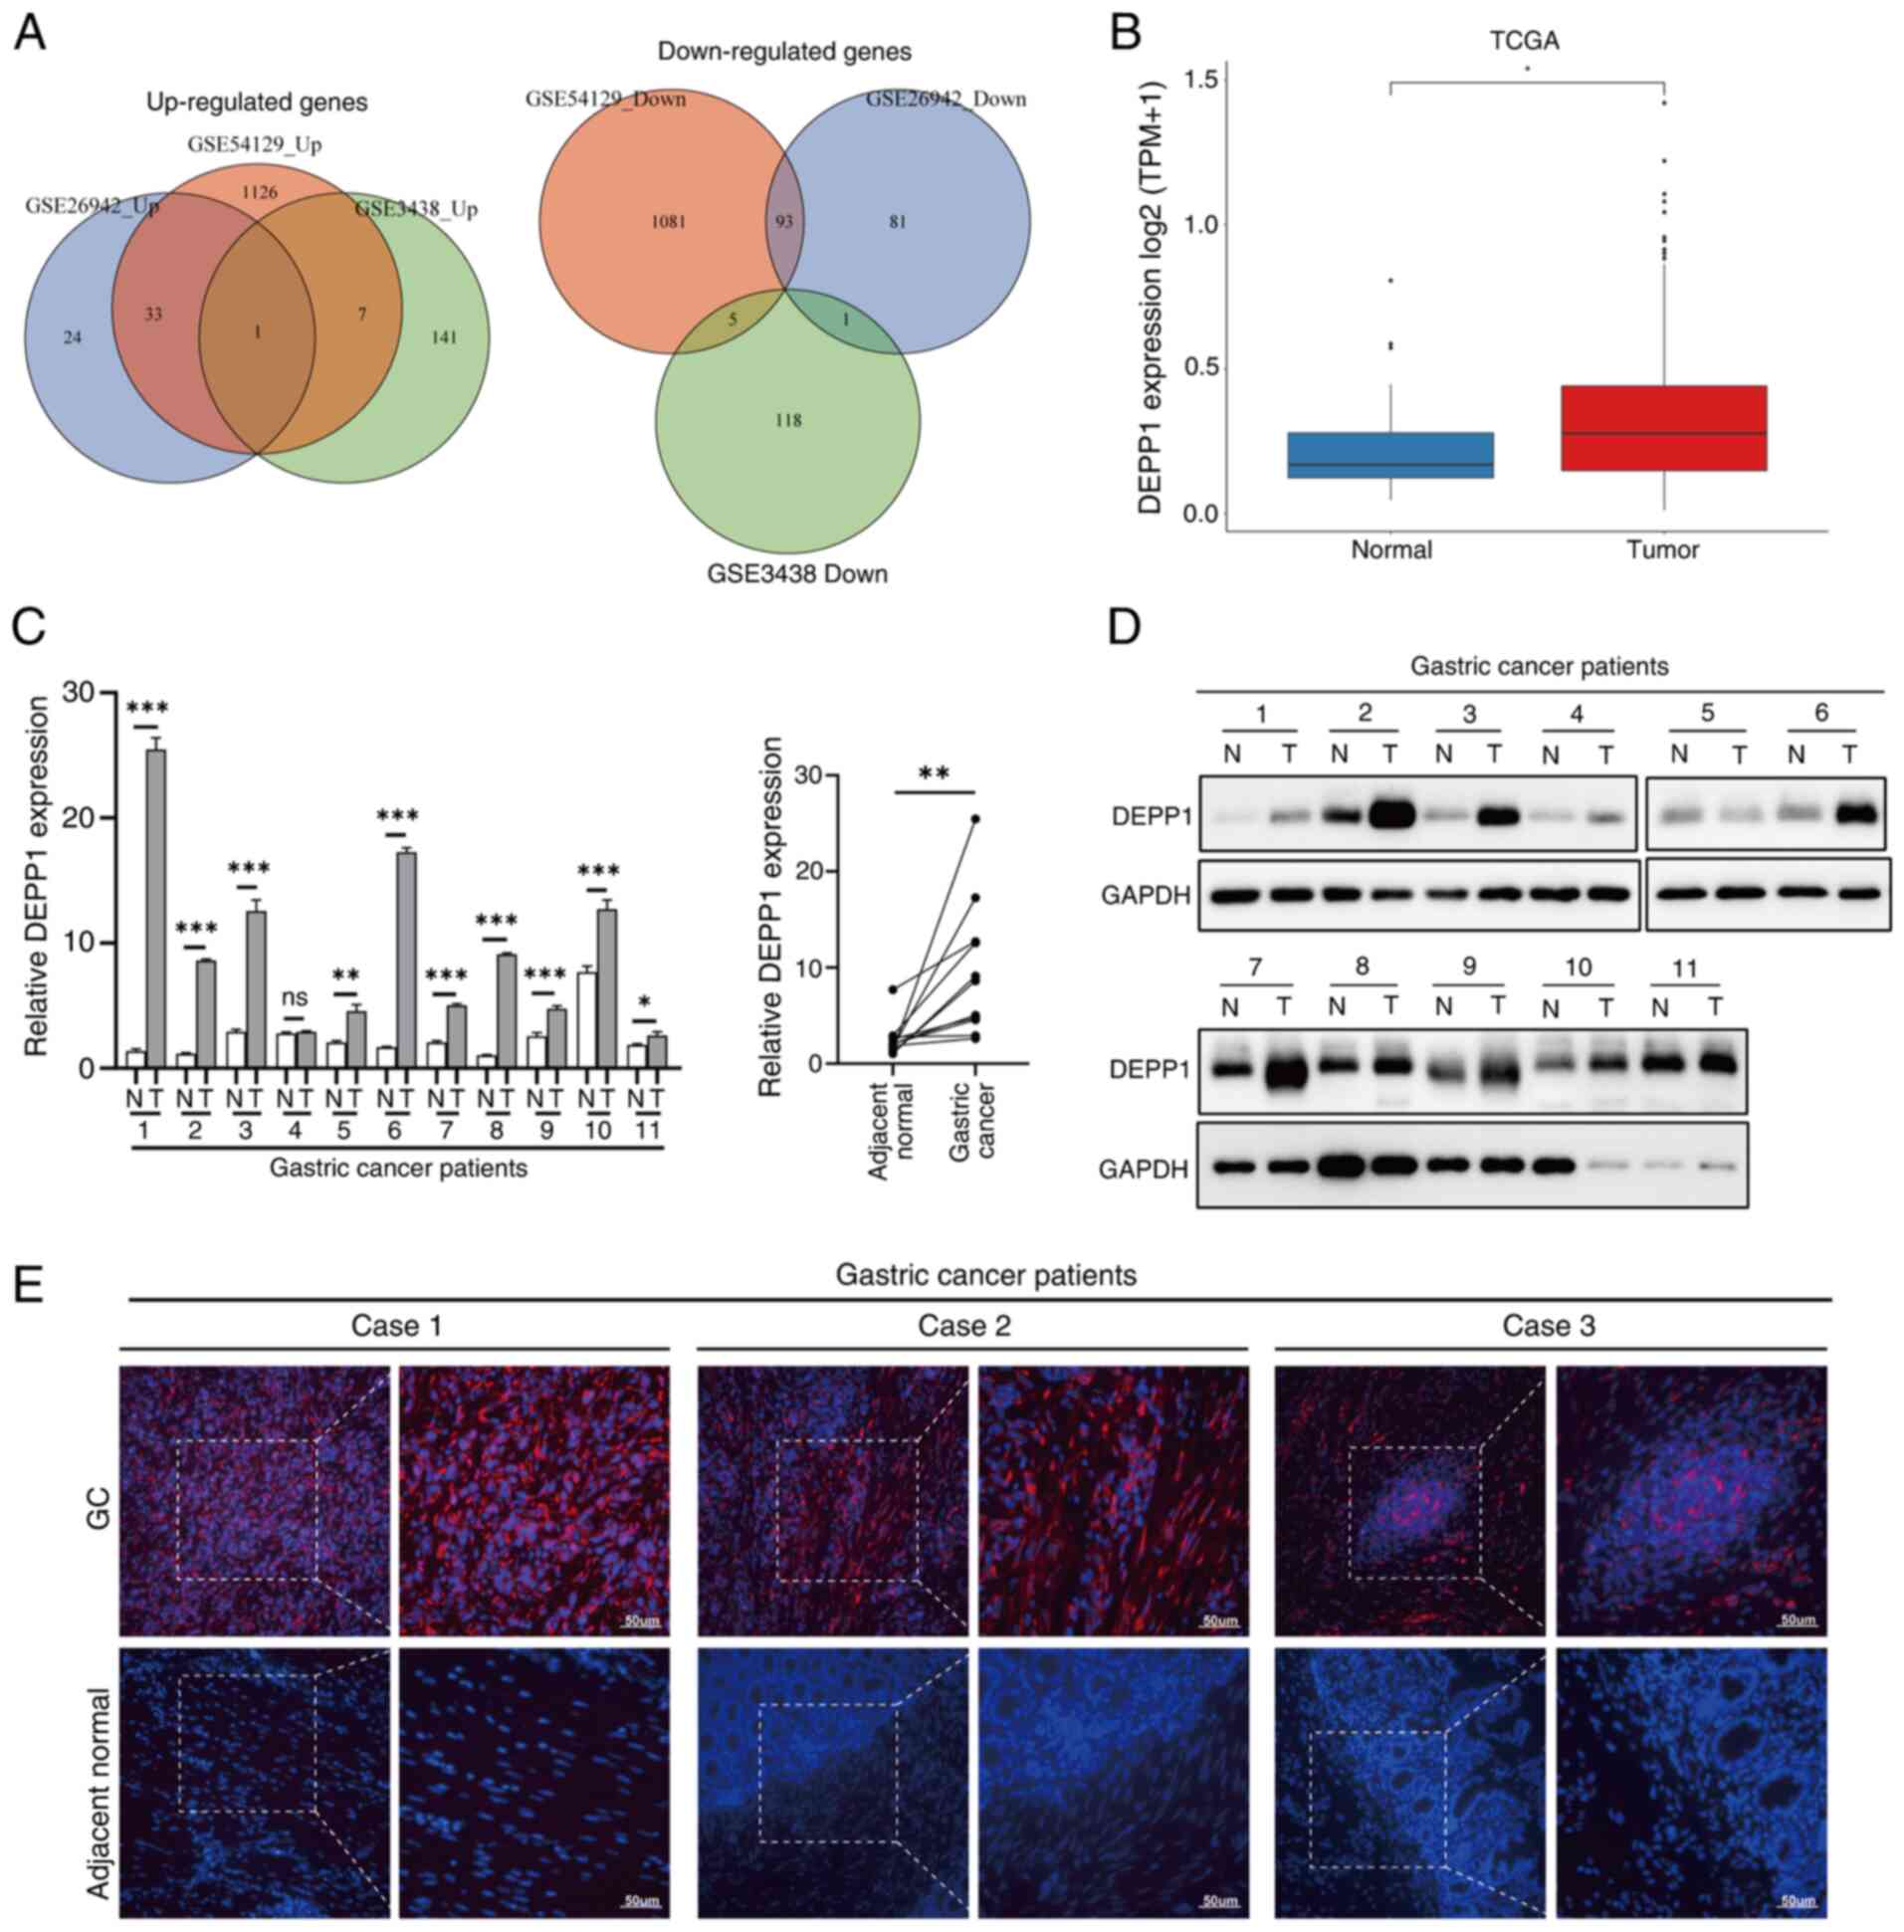
The primary objective was to systematically identify
DEGs between GC and adjacent normal tissues. A comprehensive search
led to the inclusion of three GEO datasets: i) GSE54129, ii)
GSE26942 and iii) GSE3438, which identified 2,786, 284 and 273
DEGs, respectively (Fig. S1;
Table SIV, Table SV, Table SVI). Notably, DEPP1 consistently
emerged as the sole upregulated gene in all three datasets,
suggesting its potential significance in GC. Conversely, no genes
were consistently downregulated across all datasets (Fig. 1A). Analysis of sequencing data from
the TCGA-STAD dataset further corroborated these findings (Fig. 1B). To validate these results,
RT-qPCR was performed on 11 pairs of GC and adjacent normal
tissues, confirming a significant increase in DEPP1 mRNA expression
in GC tissues (Fig. 1C).
Consistently, western blotting revealed elevated protein levels of
DEPP1 in GC tissues (Fig. 1D).
Immunofluorescence staining further supported these observations,
with DEPP1 exhibiting diffuse positivity in GC tissues while being
barely detected in adjacent normal tissues (Fig. 1E). It is possible that DEPP1 is
expressed in rare cell subsets or localized regions within adjacent
tissues, which may not be adequately represented in
immunofluorescence sections due to the sparsity of these cells. In
contrast, western blotting analyzes protein from the entire tissue
lysate, allowing for the detection of even minimal levels of DEPP1
expression. Furthermore, tissue fixation may impact antigen
accessibility, while the denaturation of proteins during western
blotting ensures optimal binding of antibodies. Collectively, these
findings indicate significant upregulation of DEPP1 in GC,
warranting further investigation.
The prognostic value of DEPP1 in
GC
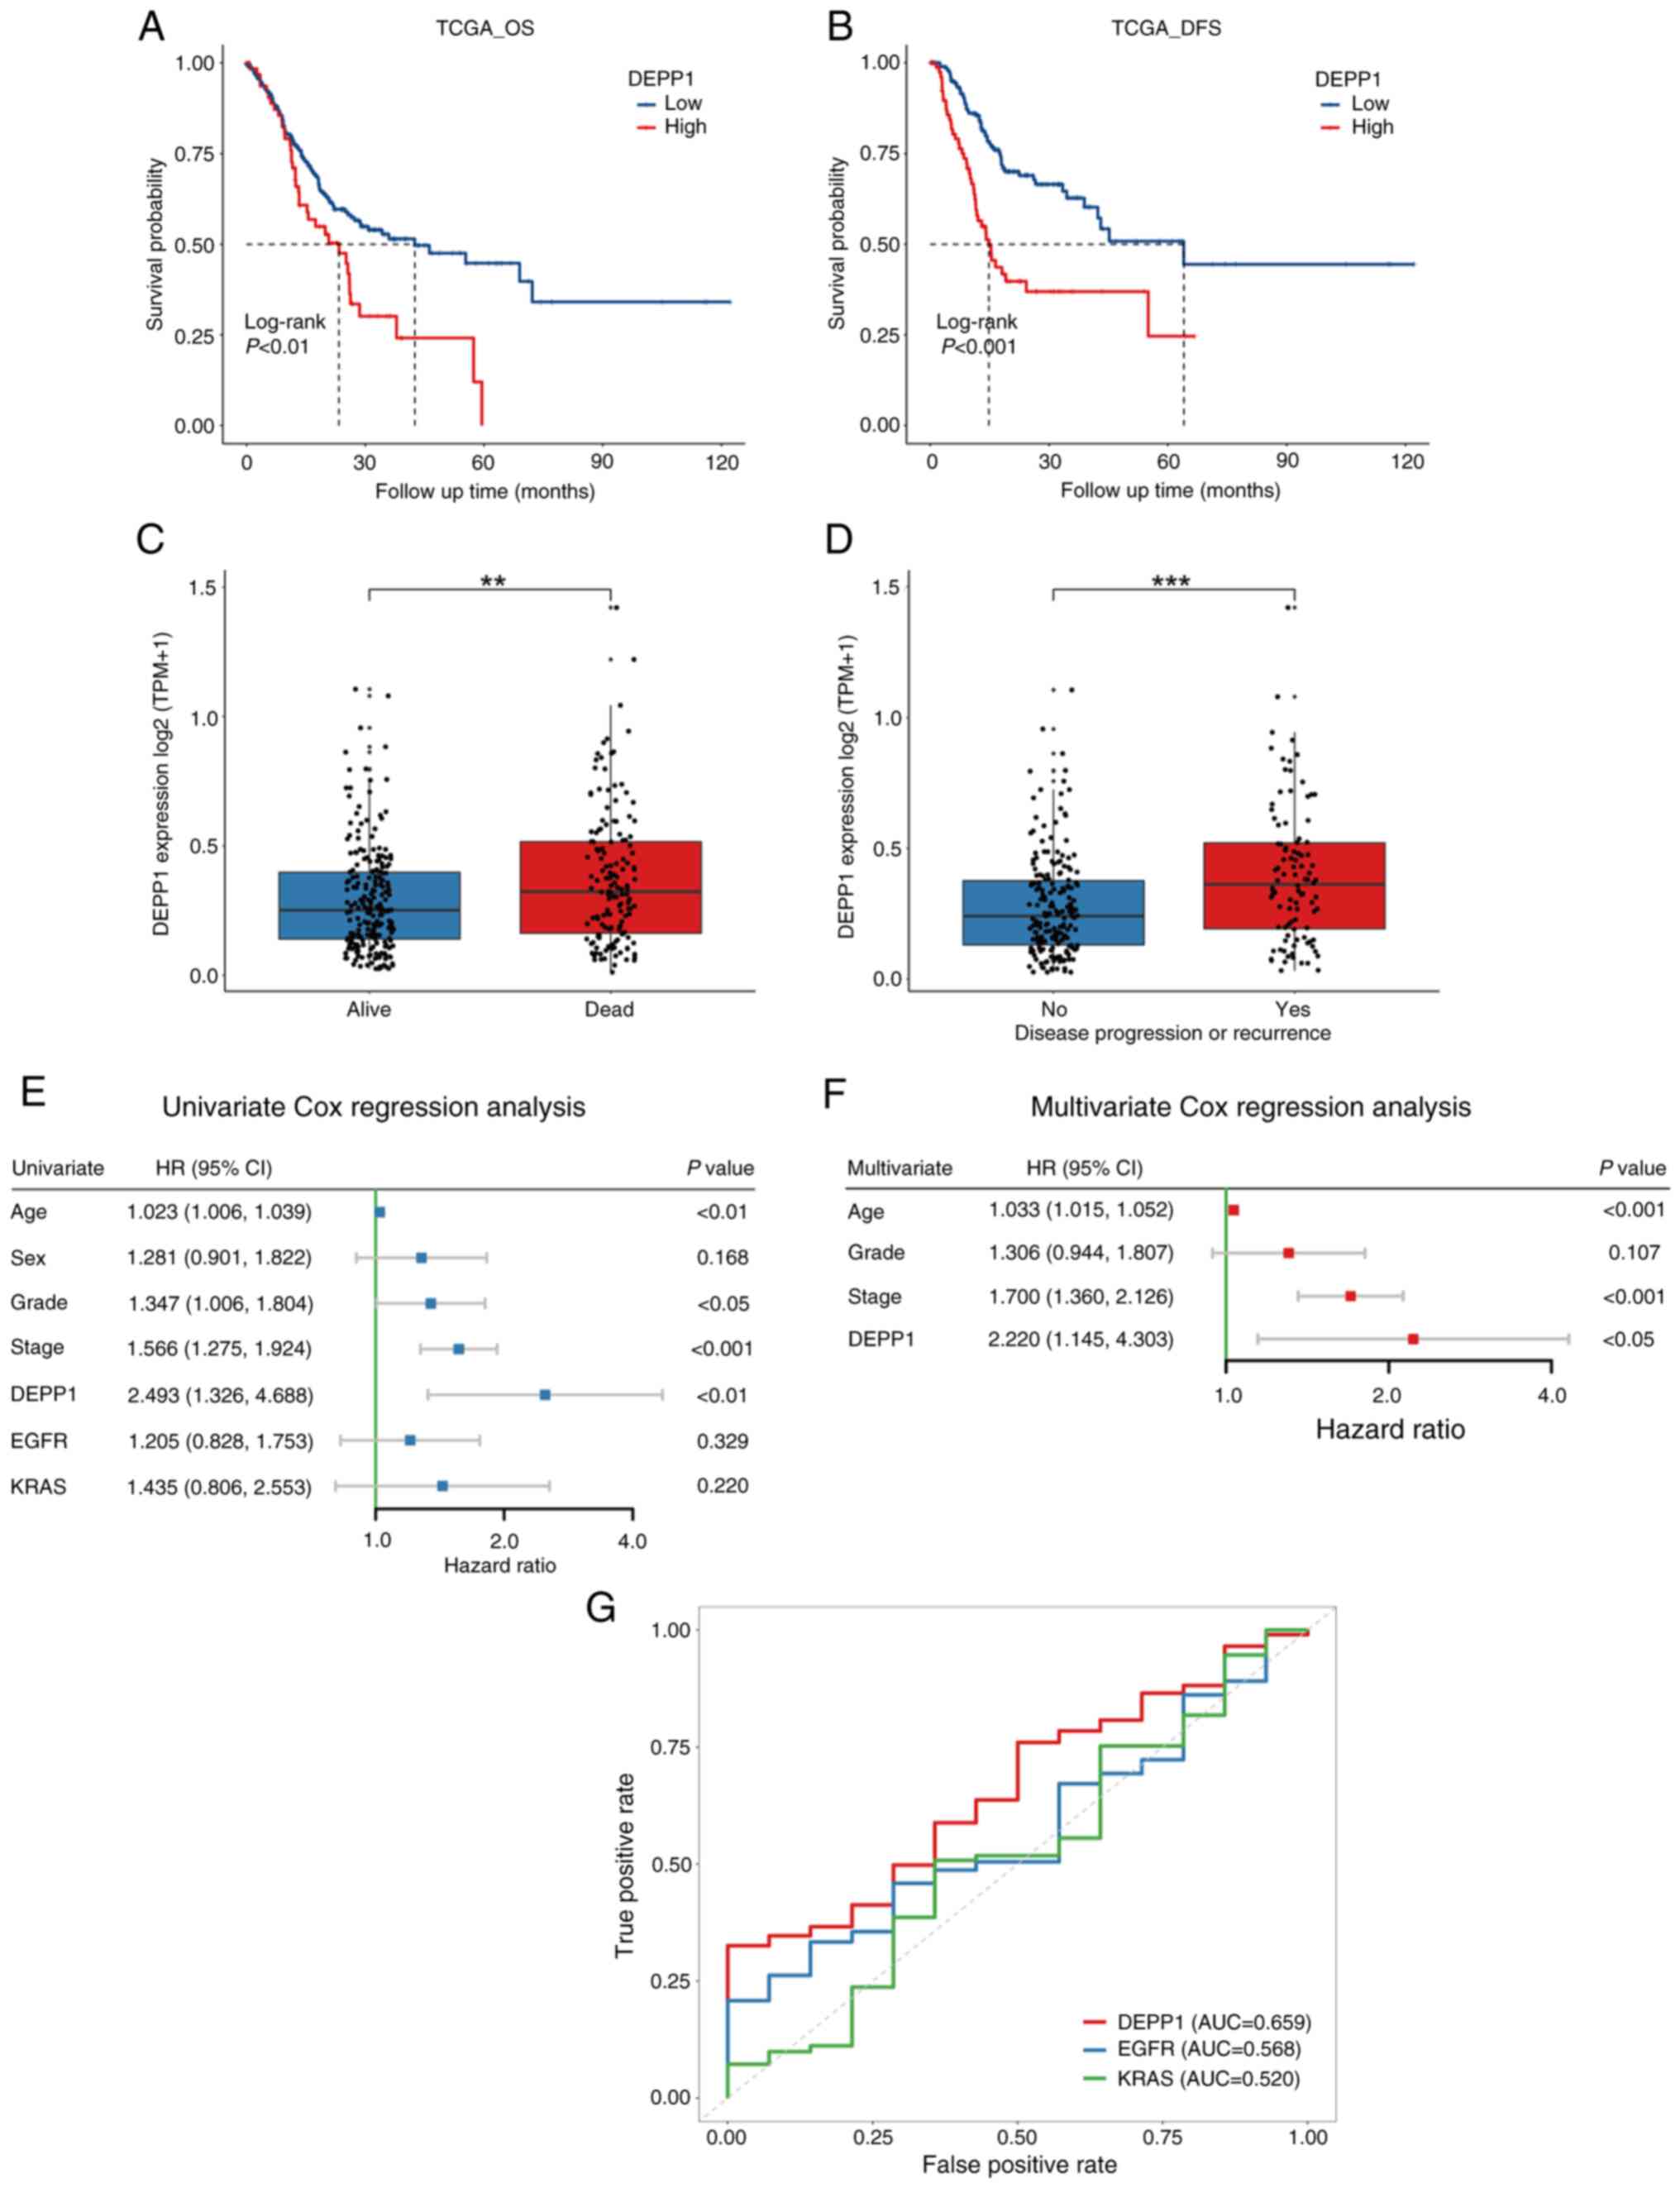
In the TCGA-STAD dataset, patients with GC
exhibiting higher expression levels of DEPP1 experienced
significantly shorter OS and DFS compared with those with lower
DEPP1 expression (Fig. 2A and B).
Consistently, individuals with GC who died or experienced tumor
recurrence during follow-up showed substantially higher expression
levels of DEPP1 (Fig. 2C and D).
Moreover, significant differences in RMST were observed between
low- and high-expression groups of DEPP1 at 36 and 60 months
(Table I). Notably, the RMST
difference increased from 4.116 months (P=0.02) at 36 months to
10.202 months (P<0.01) at 60 months. While EGFR and KRAS are
recognized potent oncogenes and promising therapeutic targets in
GC, DEPP1 (HR, 2.493; 95% CI, 1.326–4.688; P<0.01) was found to
be a significant prognostic factor of GC, as demonstrated by
univariate Cox regression analysis (Fig. 2E) (28). In addition to DEPP1,
clinicopathologic characteristics including age (HR, 1.023; 95% CI,
1.006–1.039; P<0.01), histological grade (HR, 1.347; 95% CI,
1.006–1.804; P<0.05), and TNM stage (HR, 1.566; 95% CI,
1.275–1.924; P<0.001) were identified as prognostic factors of
GC. Multivariate Cox regression analysis further confirmed DEPP1 as
an independent prognostic factor (HR, 2.220; 95% CI, 1.145–4.303;
P<0.05) in GC (Fig. 2F). ROC
curves revealed that DEPP1 exhibited improved predictive capability
for 5-year OS of patients with GC (AUC, 0.659) compared with
traditional oncogenes such as EGFR (AUC, 0.568) and KRAS (AUC,
0.520) (Fig. 2G).
 | Table I.Restricted mean survival time
differences between the low- and high-expression groups of DEPP1 at
12, 36 and 60 months. |
Table I.
Restricted mean survival time
differences between the low- and high-expression groups of DEPP1 at
12, 36 and 60 months.
|
|
| RMSTa |
|
|
|---|
|
|
|
|
|
|
|---|
| Cohort | Time point
(months) | Low expression (95%
CI) | High expression
(95% CI) | RMST
differenceb |
P-valuec |
|---|
| TCGA-STAD | 12 | 10.812 (10.490,
11.135) | 10.718 (10.048,
11.387) | 0.095 (−0.648,
0.838) | 0.803 |
| cohort (n=375) | 36 | 25.600 (23.994,
27.206) | 21.484 (18.407,
24.561) | 4.116 (0.645,
7.587) | 0.020 |
|
| 60 | 37.218 (33.940,
40.496) | 27.016 (21.208,
32.825) | 10.202 (3.532,
16.871) | 0.003 |
| GSE84437 | 12 | 11.708 (11.510,
11.905) | 11.080 (10.762,
11.398) | 0.627 (0.253,
1.002) | 0.001 |
| cohort (n=433) | 36 | 31.971 (30.661,
33.280) | 28.538 (27.152,
29.924) | 3.433 (1.526,
5.339) | <0.001 |
|
| 60 | 50.110 (47.414,
52.806) | 41.659 (39.057,
44.260) | 8.451 (4.705,
12.198) | <0.001 |
| GSE15459 | 12 | 11.079 (10.663,
11.494) | 10.574 (9.856,
11.291) | 0.505 (−0.324,
1.334) | 0.233 |
| cohort (n=192) | 36 | 26.433 (24.203,
28.662) | 22.147 (18.786,
25.509) | 4.286 (0.252,
8.319) | 0.037 |
|
| 60 | 38.778 (34.436,
43.119) | 29.375 (23.310,
35.440) | 9.403 (1.944,
16.861) | 0.013 |
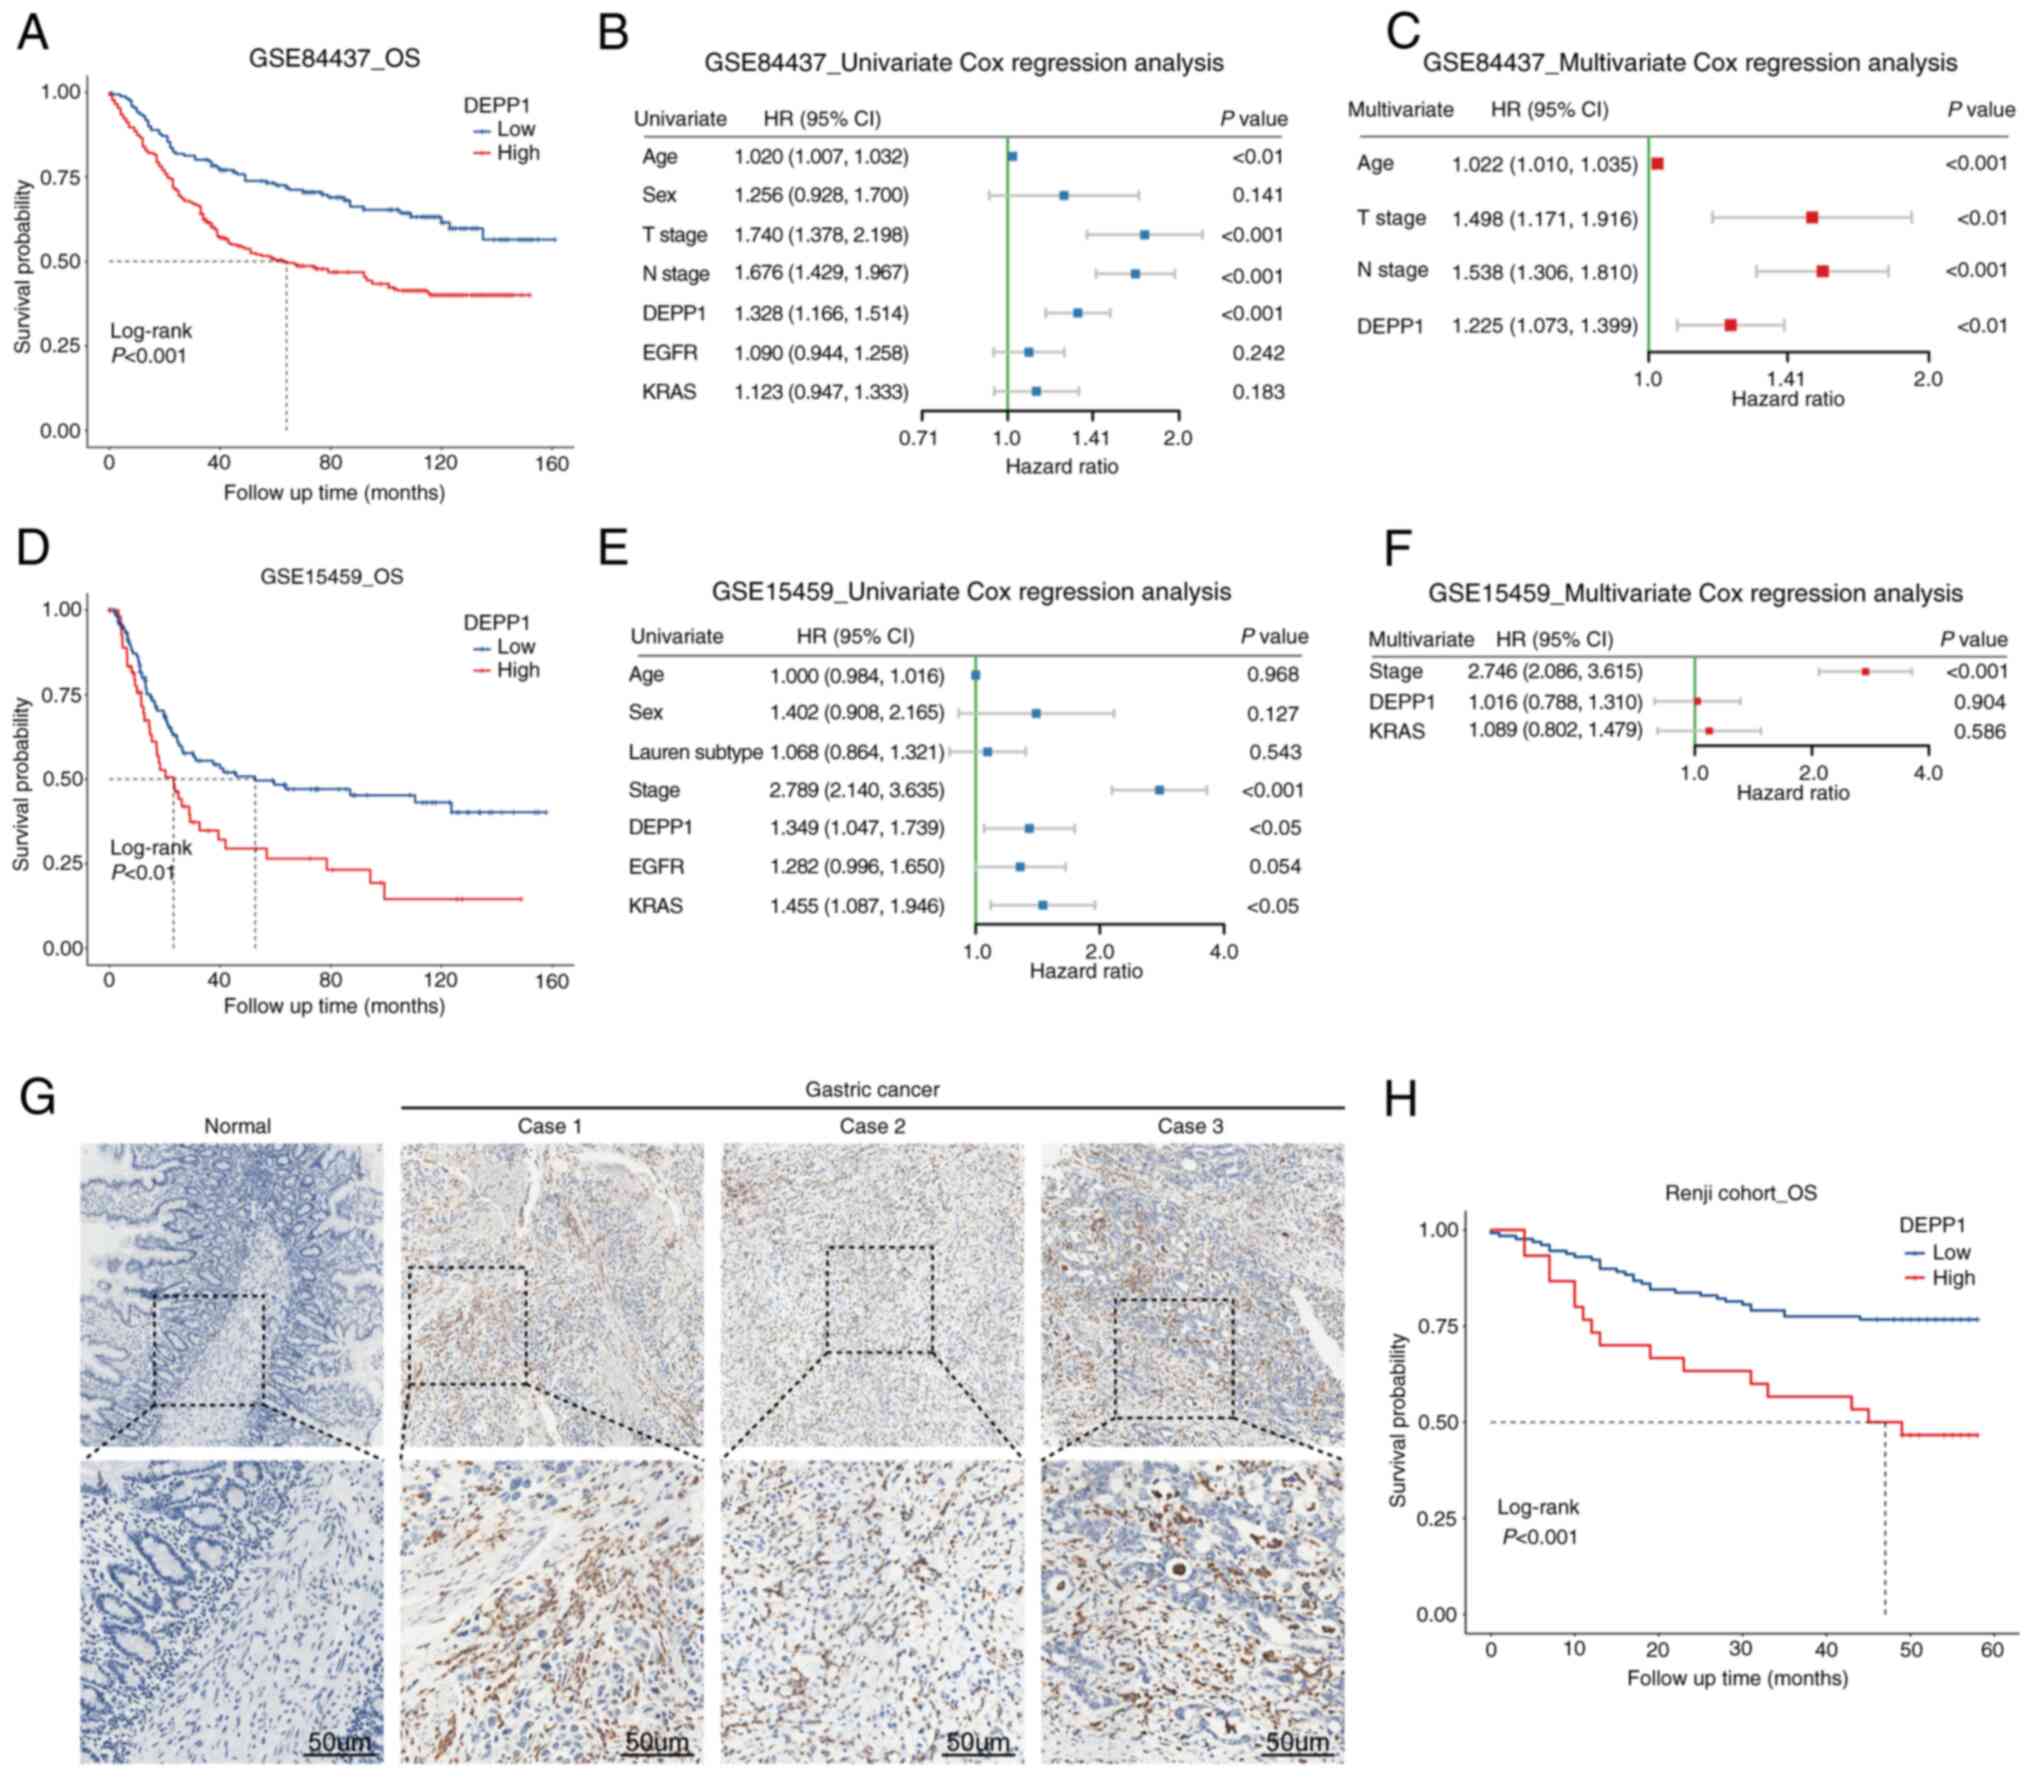
Similarly, in the GSE84437 cohort, patients with
lower DEPP1 expression levels exhibited longer OS compared with
those with higher DEPP1 expression (Fig. 3A). Statistically significant RMST
differences were observed at 12 months (0.627 months; 95% CI,
0.253–1.002 months; P<0.01), 36 months (3.433 months; 95% CI,
1.526–5.339 months; P<0.001), and 60 months (8.451 months; 95%
CI, 4.705–12.198 months; P<0.001) (Table I). Univariate and multivariate Cox
regression analyses confirmed DEPP1 as an independent prognostic
indicator of GC (Fig. 3B and C). In
the GSE15459 cohort, higher DEPP1 expression was associated with
shorter OS in patients with GC (Fig.
3D). Significant RMST differences were observed at 36 months
(4.286 months; 95% CI, 0.252–8.319 months; P<0.05) and 60 months
(9.403 months; 95% CI, 1.944–16.861 months; P<0.05) (Table I). Univariate Cox regression
analysis revealed DEPP1 (HR, 1.349; 95% CI, 1.047–1.739;
P<0.05), KRAS (HR, 1.455; 95% CI, 1.087–1.946; P<0.05) and
TNM stage (HR, 2.789; 95% CI, 2.140–3.635; P<0.001) as
prognostic factors of GC (Fig. 3E).
However, the independent prognostic effect of DEPP1 and KRAS was
not evident except for TNM stage (Fig.
3F). To further clarify the prognostic role of DEPP1 in GC, an
IHC assay was performed on 11 slides of normal gastric tissues and
a tissue microarray containing 160 GC patient specimens. DEPP1 was
diffusely overexpressed in GC tissues compared with normal gastric
tissues, and patients with higher DEPP1 expression levels exhibited
significantly shorter OS compared with those with lower DEPP1
expression (Fig. 3G and H). The
survival data and corresponding IHC scores of the Renji cohort were
summarized in Table SVII.
Collectively, DEPP1 emerges as a significant risk factor for
patients with GC.
Construction and validation of a
prognostic nomogram
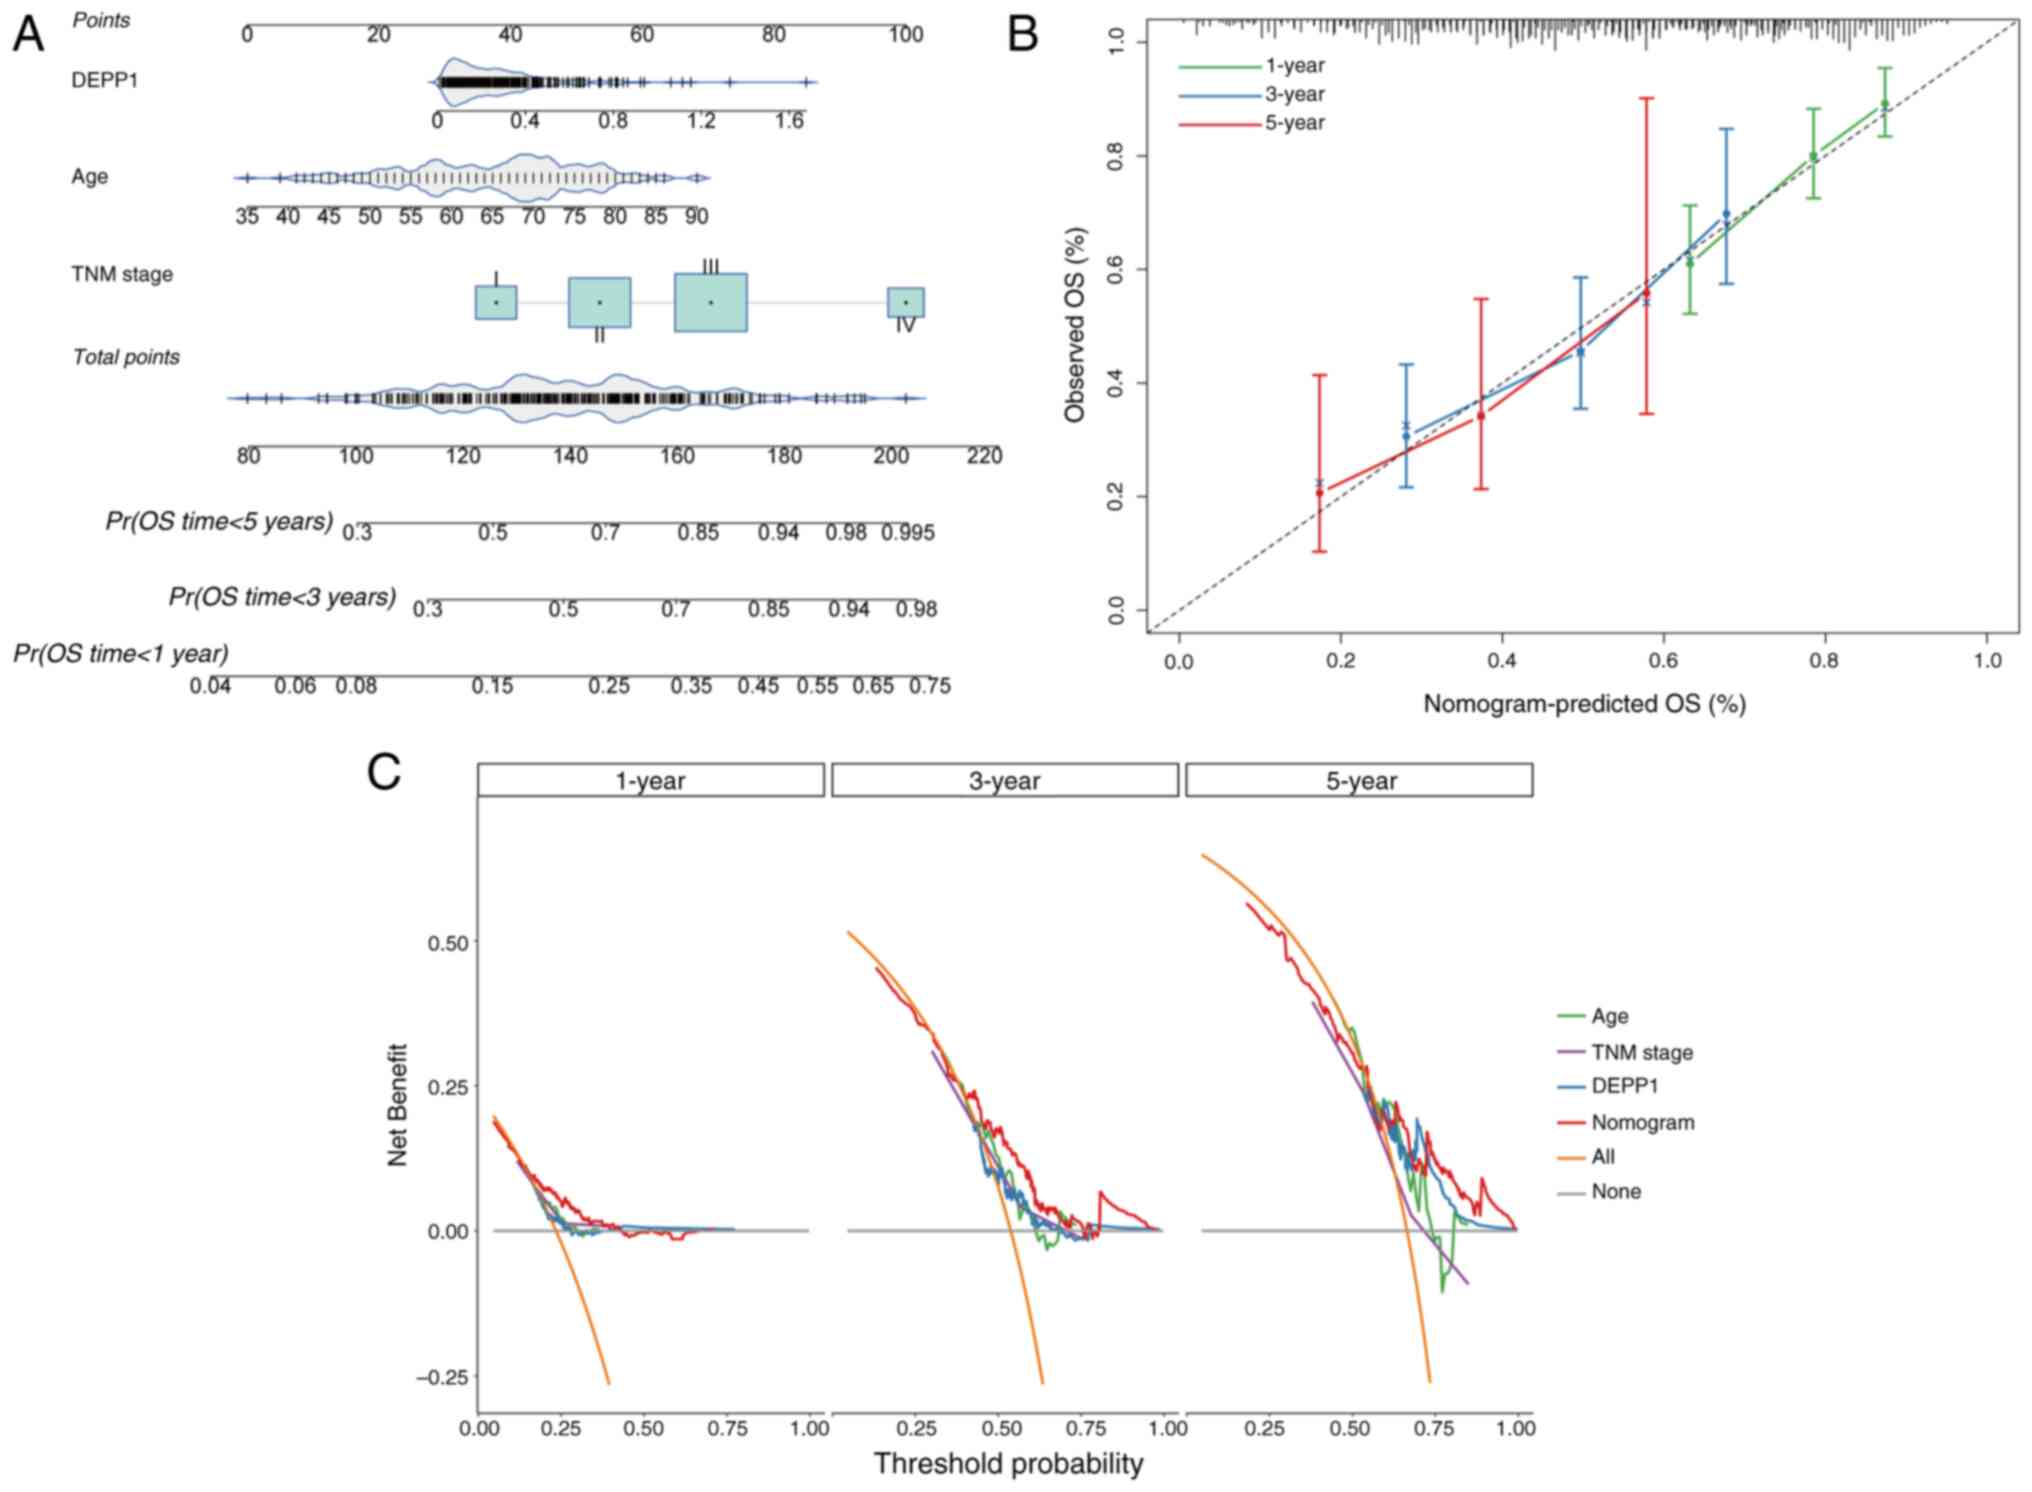
In order to provide a quantitative tool for
predicting the OS rate of patients with GC, a nomogram
incorporating the expression level of DEPP1, patient age and TNM
stage was developed. These factors were identified as independent
prognostic indicators of GC based on the analysis of data from the
TCGA-STAD cohort (Fig. 4A). The
calibration curves demonstrated that the predicted 1-, 3- and
5-year OS rates from the nomogram closely matched the observed
rates in patients with GC, indicating excellent predictive
performance (Fig. 4B).
Additionally, DCA showed that the composite nomogram provided
greater clinical net benefit compared with DEPP1, age, or TNM stage
alone at 1-, 3- and 5-year intervals (Fig. 4C). Overall, the nomogram enhances
the predictive ability of the TNM staging system for OS rates of
patients with GC.
Association between DEPP1 and
clinicopathologic factors of patients with GC
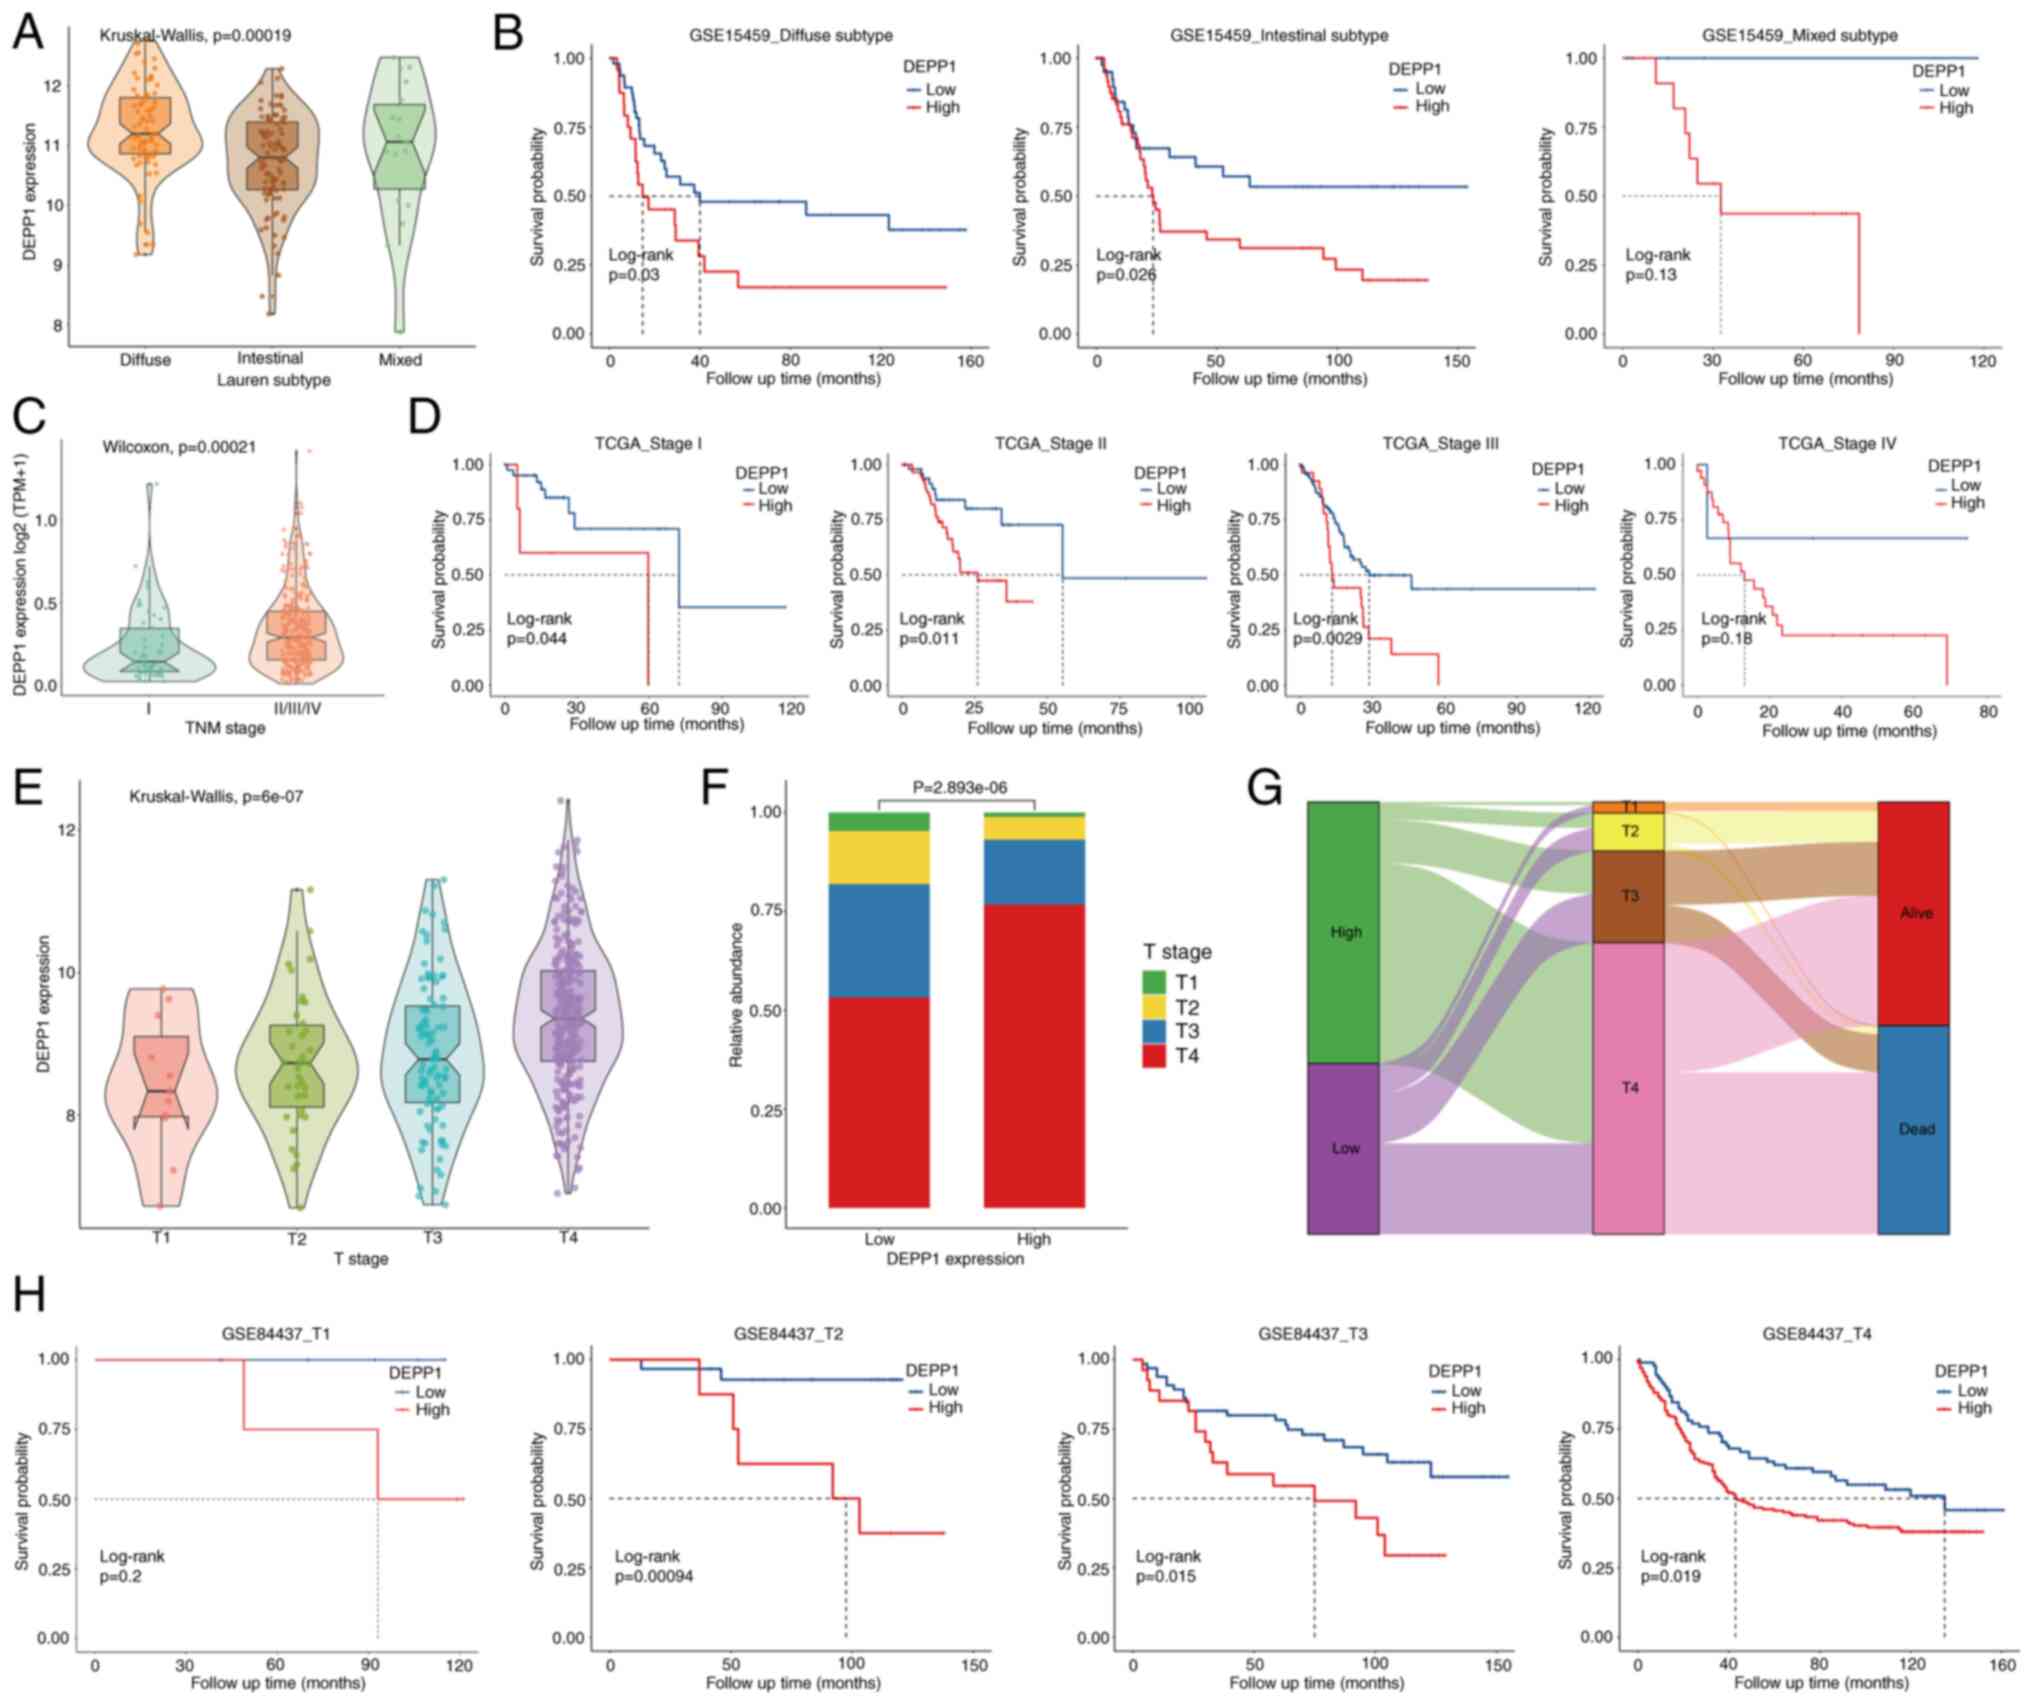
Lauren's classification categorizes GC into
intestinal, diffuse and mixed phenotypes, with the diffuse
phenotype typically associated with therapy resistance and poor
prognosis (29,30). The present analysis revealed that
patients with GC with the diffuse phenotype exhibited significantly
higher expression levels of DEPP1 compared with those with
intestinal or mixed phenotypes in the GSE15459 cohort (Fig. 5A). Logistic regression analysis
identified DEPP1 as a significant risk factor for the diffuse
phenotype (Table II; diffuse vs.
intestinal phenotype; OR, 2.288; 95%CI, 1.504–3.480; P<0.001).
Additionally, DEPP1 was significantly associated with histological
grade in the TCGA-STAD cohort (Table
SVIII). Stratified analysis revealed that higher DEPP1
expression was associated with shorter OS across all histological
subtypes of GC, indicating consistent predictive value across
different subtypes (Fig. 5B).
| Table II.Correlation between DEPP1 expression
and clinical features using logistic regression. |
Table II.
Correlation between DEPP1 expression
and clinical features using logistic regression.
| Cohorts | Clinical
features | OR | 95% CI |
P-valuea |
|---|
| TCGA-STAD cohort
(n=375) | TNM stage | II vs. I | 15.467 | 2.239–106.843 | 0.005 |
|
|
| III vs. I | 8.672 | 1.291–58.226 | 0.026 |
|
|
| IV vs. I | 8.94 | 0.938–85.220 | 0.057 |
| GSE84437 cohort
(n=433) | T stage | T2 vs. T1 | 1.434 | 0.697–2.949 | 0.328 |
|
|
| T3 vs. T1 | 1.644 | 0.836–3.235 | 0.150 |
|
|
| T4 vs. T1 | 2.755 | 1.419–5.346 | 0.003 |
| GSE15459 cohort
(n=192) | Lauren
phenotype | Diffuse vs.
intestinal | 2.288 | 1.504–3.480 | <0.001 |
|
|
| Mixed vs.
intestinal | 1.289 | 0.704–2.360 | 0.412 |
Furthermore, significantly higher DEPP1 expression
was observed in advanced-stage patients with GC compared with those
at stage I (Fig. 5C). DEPP1 was
identified as a significant risk factor for advanced TNM stages
(Table II; stage II vs. stage I;
OR, 15.467; 95% CI, 2.239–106.843; P=0.005; stage III vs. stage I;
OR, 8.672; 95% CI, 1.291–58.226; P<0.05). Patients with higher
DEPP1 expression levels across all stages had substantially shorter
OS (Fig. 5D). Similarly, concerning
local infiltration depth, tumors with deeper infiltration exhibited
significantly higher DEPP1 expression levels (Fig. 5E), and higher DEPP1 expression
associated with deeper infiltration (Fig. 5F and G). Logistic regression
analysis indicated DEPP1 as a significant risk factor for advanced
T stages (Table II; T4 vs. T1; OR,
2.755; 95% CI, 1.419–5.346; P<0.01). Stratified analysis based
on infiltration depth revealed that higher DEPP1 expression was
associated with shorter OS across all T stages (Fig. 5H). Overall, DEPP1 serves as a potent
risk factor for TNM and T stages and an effective prognostic
biomarker across distinct stages.
Association between DEPP1 and
stroma-rich and immunosuppressive microenvironment of GC
The TME has emerged as a hallmark of cancer,
garnering increasing attention in recent years for its significant
role in tumorigenesis (31). In the
present study, the correlation between DEPP1 expression and the TME
in GC was investigated. It was observed that GC with higher DEPP1
expression exhibited significantly elevated stromal scores,
indicating increased infiltration of stromal cells within tumor
tissues (Fig. 6A; Table SIX). Moreover, a positive
correlation was identified between DEPP1 expression and stromal
score, suggesting a potential role of DEPP1 in shaping the stromal
component of the GC microenvironment (Fig. 6B).
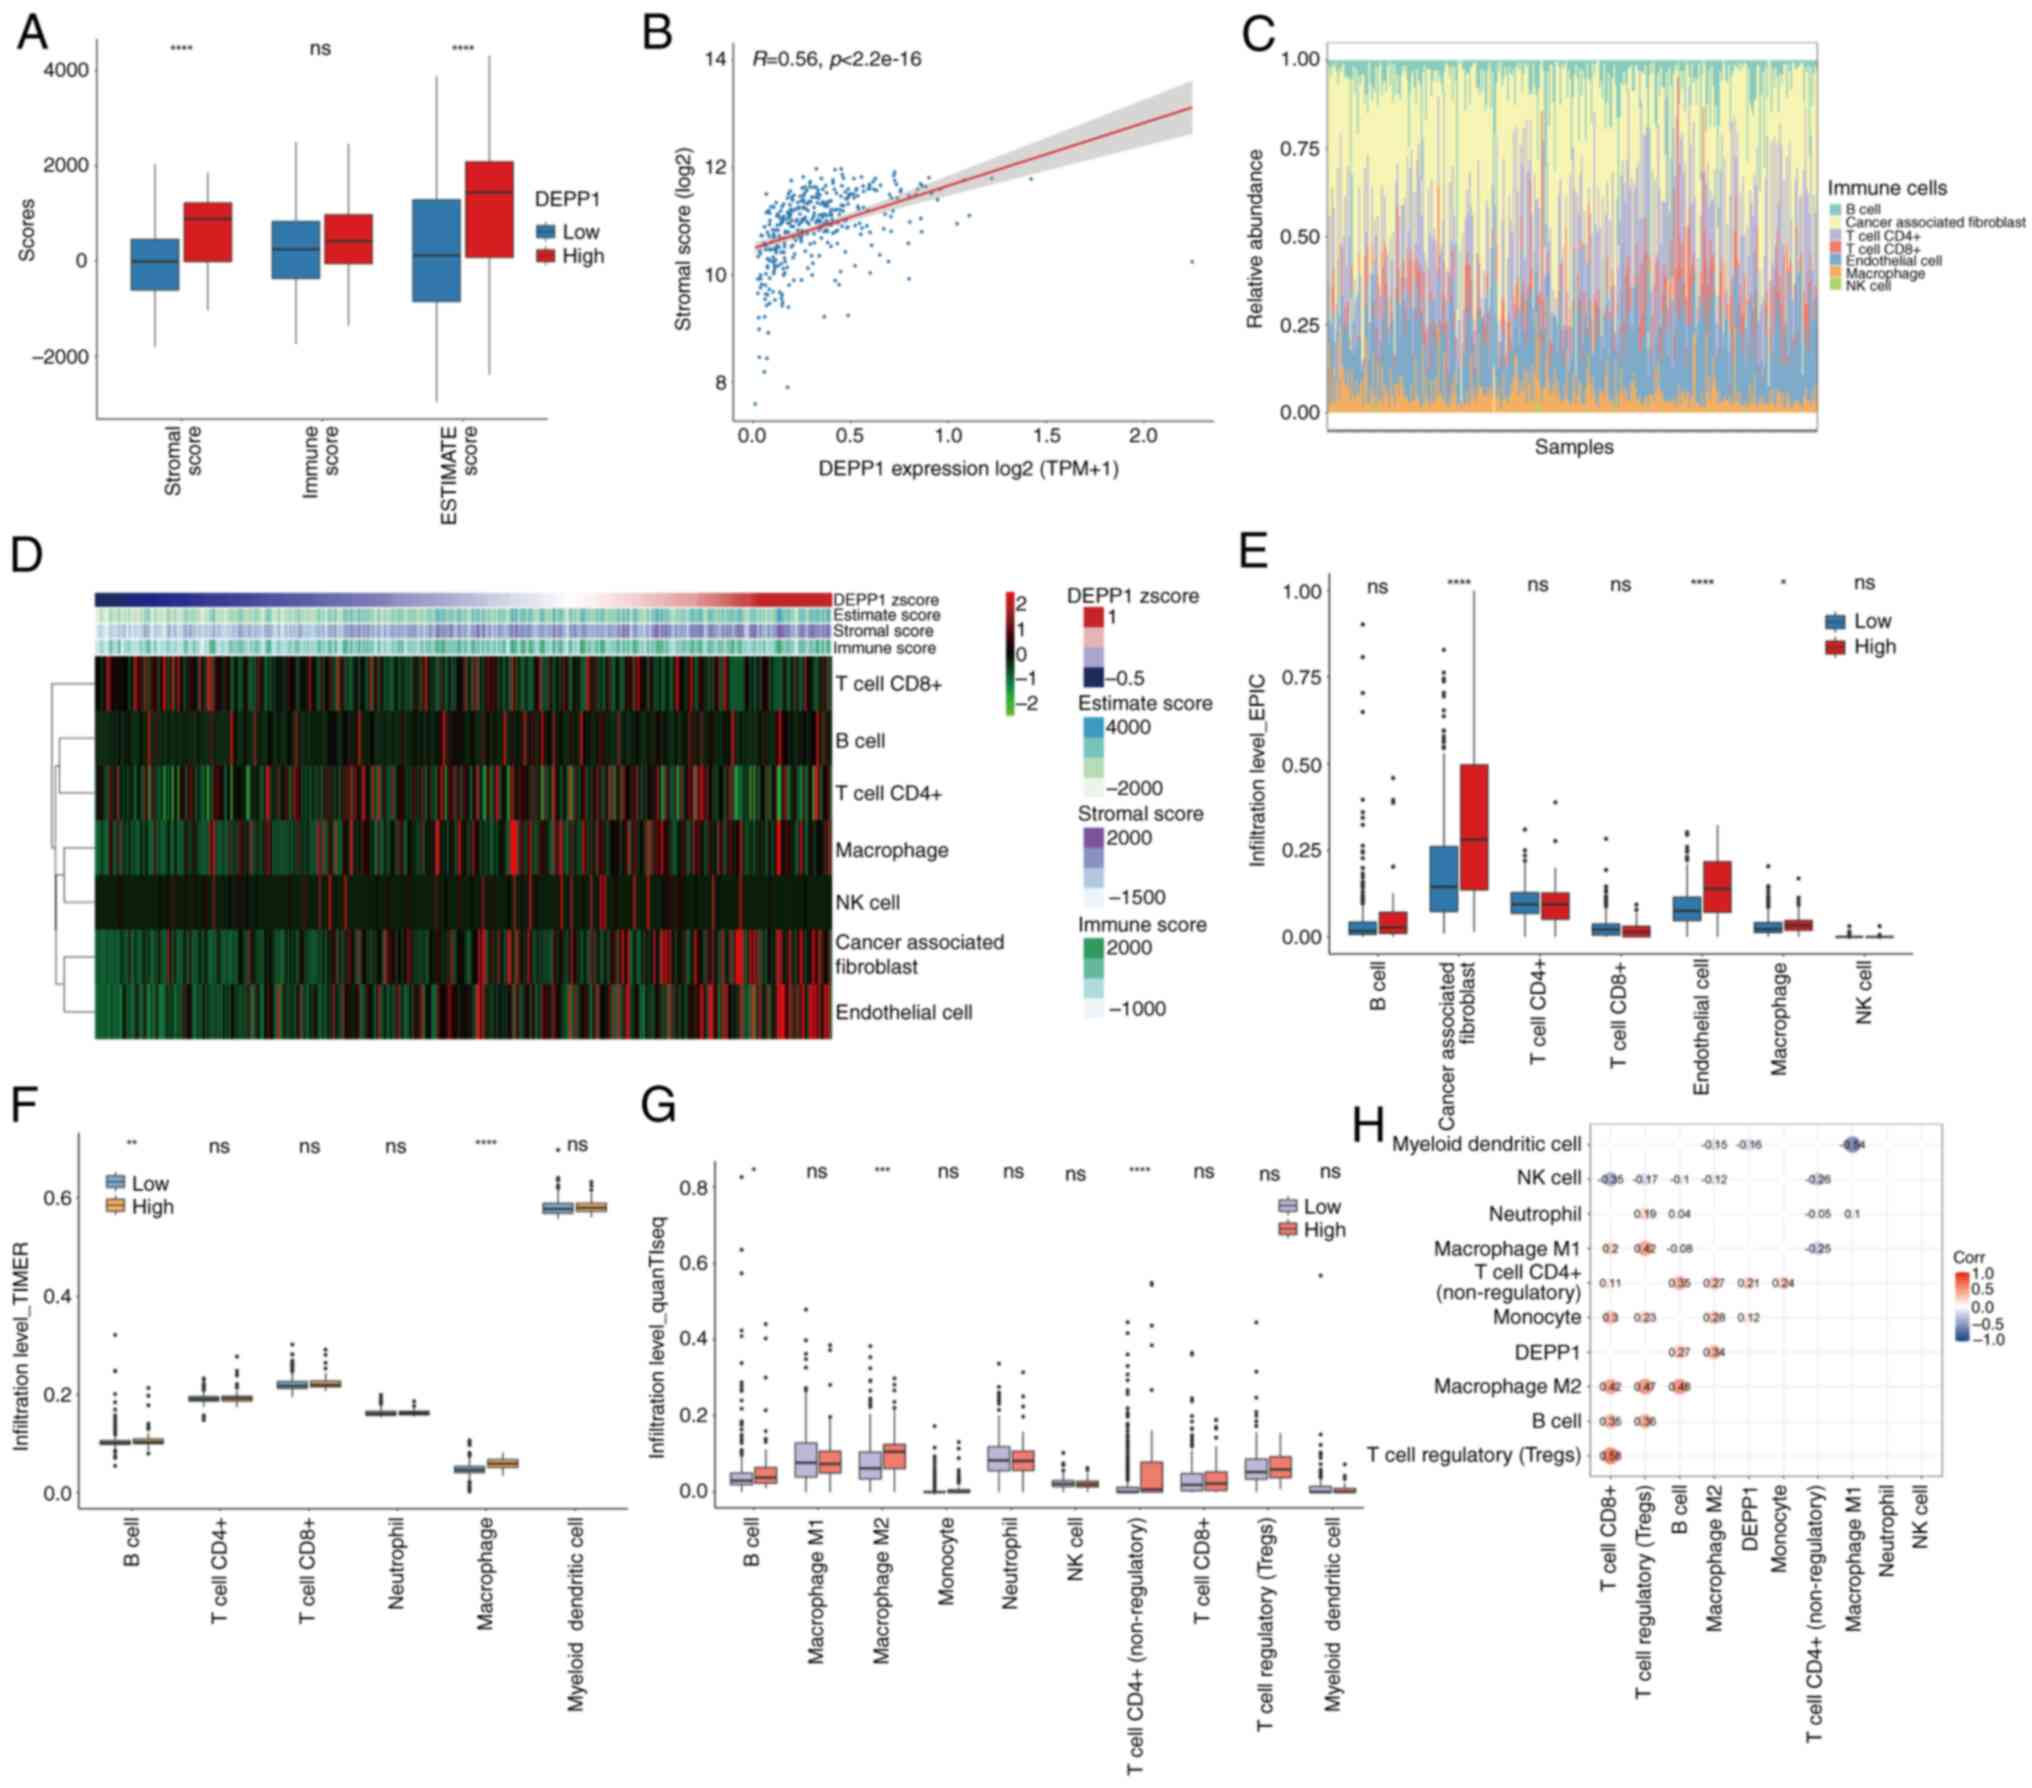 | Figure 6.DEPP1 correlates with a stroma-rich
and immunosuppressive microenvironment of GC. (A) The stromal,
immune, and estimate scores in the low- and high-expression groups
of DEPP1. (B) The correlation between DEPP1 expression and stromal
score. (C) The distribution of various immune and stromal cells in
the GC microenvironment estimated by the EPIC algorithm. (D) The
heatmap showing the correlation between DEPP1 expression and immune
and stromal cell populations. The infiltration levels of distinct
immune and stromal cells in the low- and high-expression groups of
DEPP1, as assessed by (E) EPIC, (F) TIMER and (G) quanTIseq
methods, respectively. (H) A correlation heatmap illustrating the
relationships between DEPP1 expression and various immune and
stromal cells based on the results of the quanTIseq algorithm.
*P<0.05, **P<0.01, ***P<0.001 and ****P<0.0001. DEPP1,
decidual protein induced by progesterone; GC, gastric cancer; NK,
natural killer; ns, not significant. |
The landscape of the GC TME, as assessed by the EPIC
algorithm, revealed an increase in the infiltration levels of CAFs
and ECs with higher DEPP1 expression (Fig. 6C and D). Concurrently, macrophage
infiltration also exhibited a slight positive correlation with
DEPP1 expression. Additionally, tumors with higher DEPP1 expression
showed significantly elevated levels of CAFs, ECs and macrophages
compared with those with lower DEPP1 expression (Fig. 6E).
Further analysis using the TIMER algorithm
demonstrated increased infiltration rates of macrophages and B
cells in the high-expression group of DEPP1 (Fig. 6F). The quanTIseq method revealed
higher infiltration of M2 macrophages, but not M1 macrophages, in
GC tumors expressing higher levels of DEPP1 (Fig. 6G). The correlation heatmap indicated
a significant positive association between DEPP1 expression and
various immune and stromal cell populations, particularly M2
macrophages (Fig. 6H).
Collectively, these findings suggest that DEPP1 plays a pivotal
role in shaping the GC TME by promoting the recruitment of CAFs and
ECs and inducing the polarization of TAMs towards an
immunosuppressive M2 phenotype, thereby contributing to the
establishment of a stromal-rich and immunosuppressive
microenvironment.
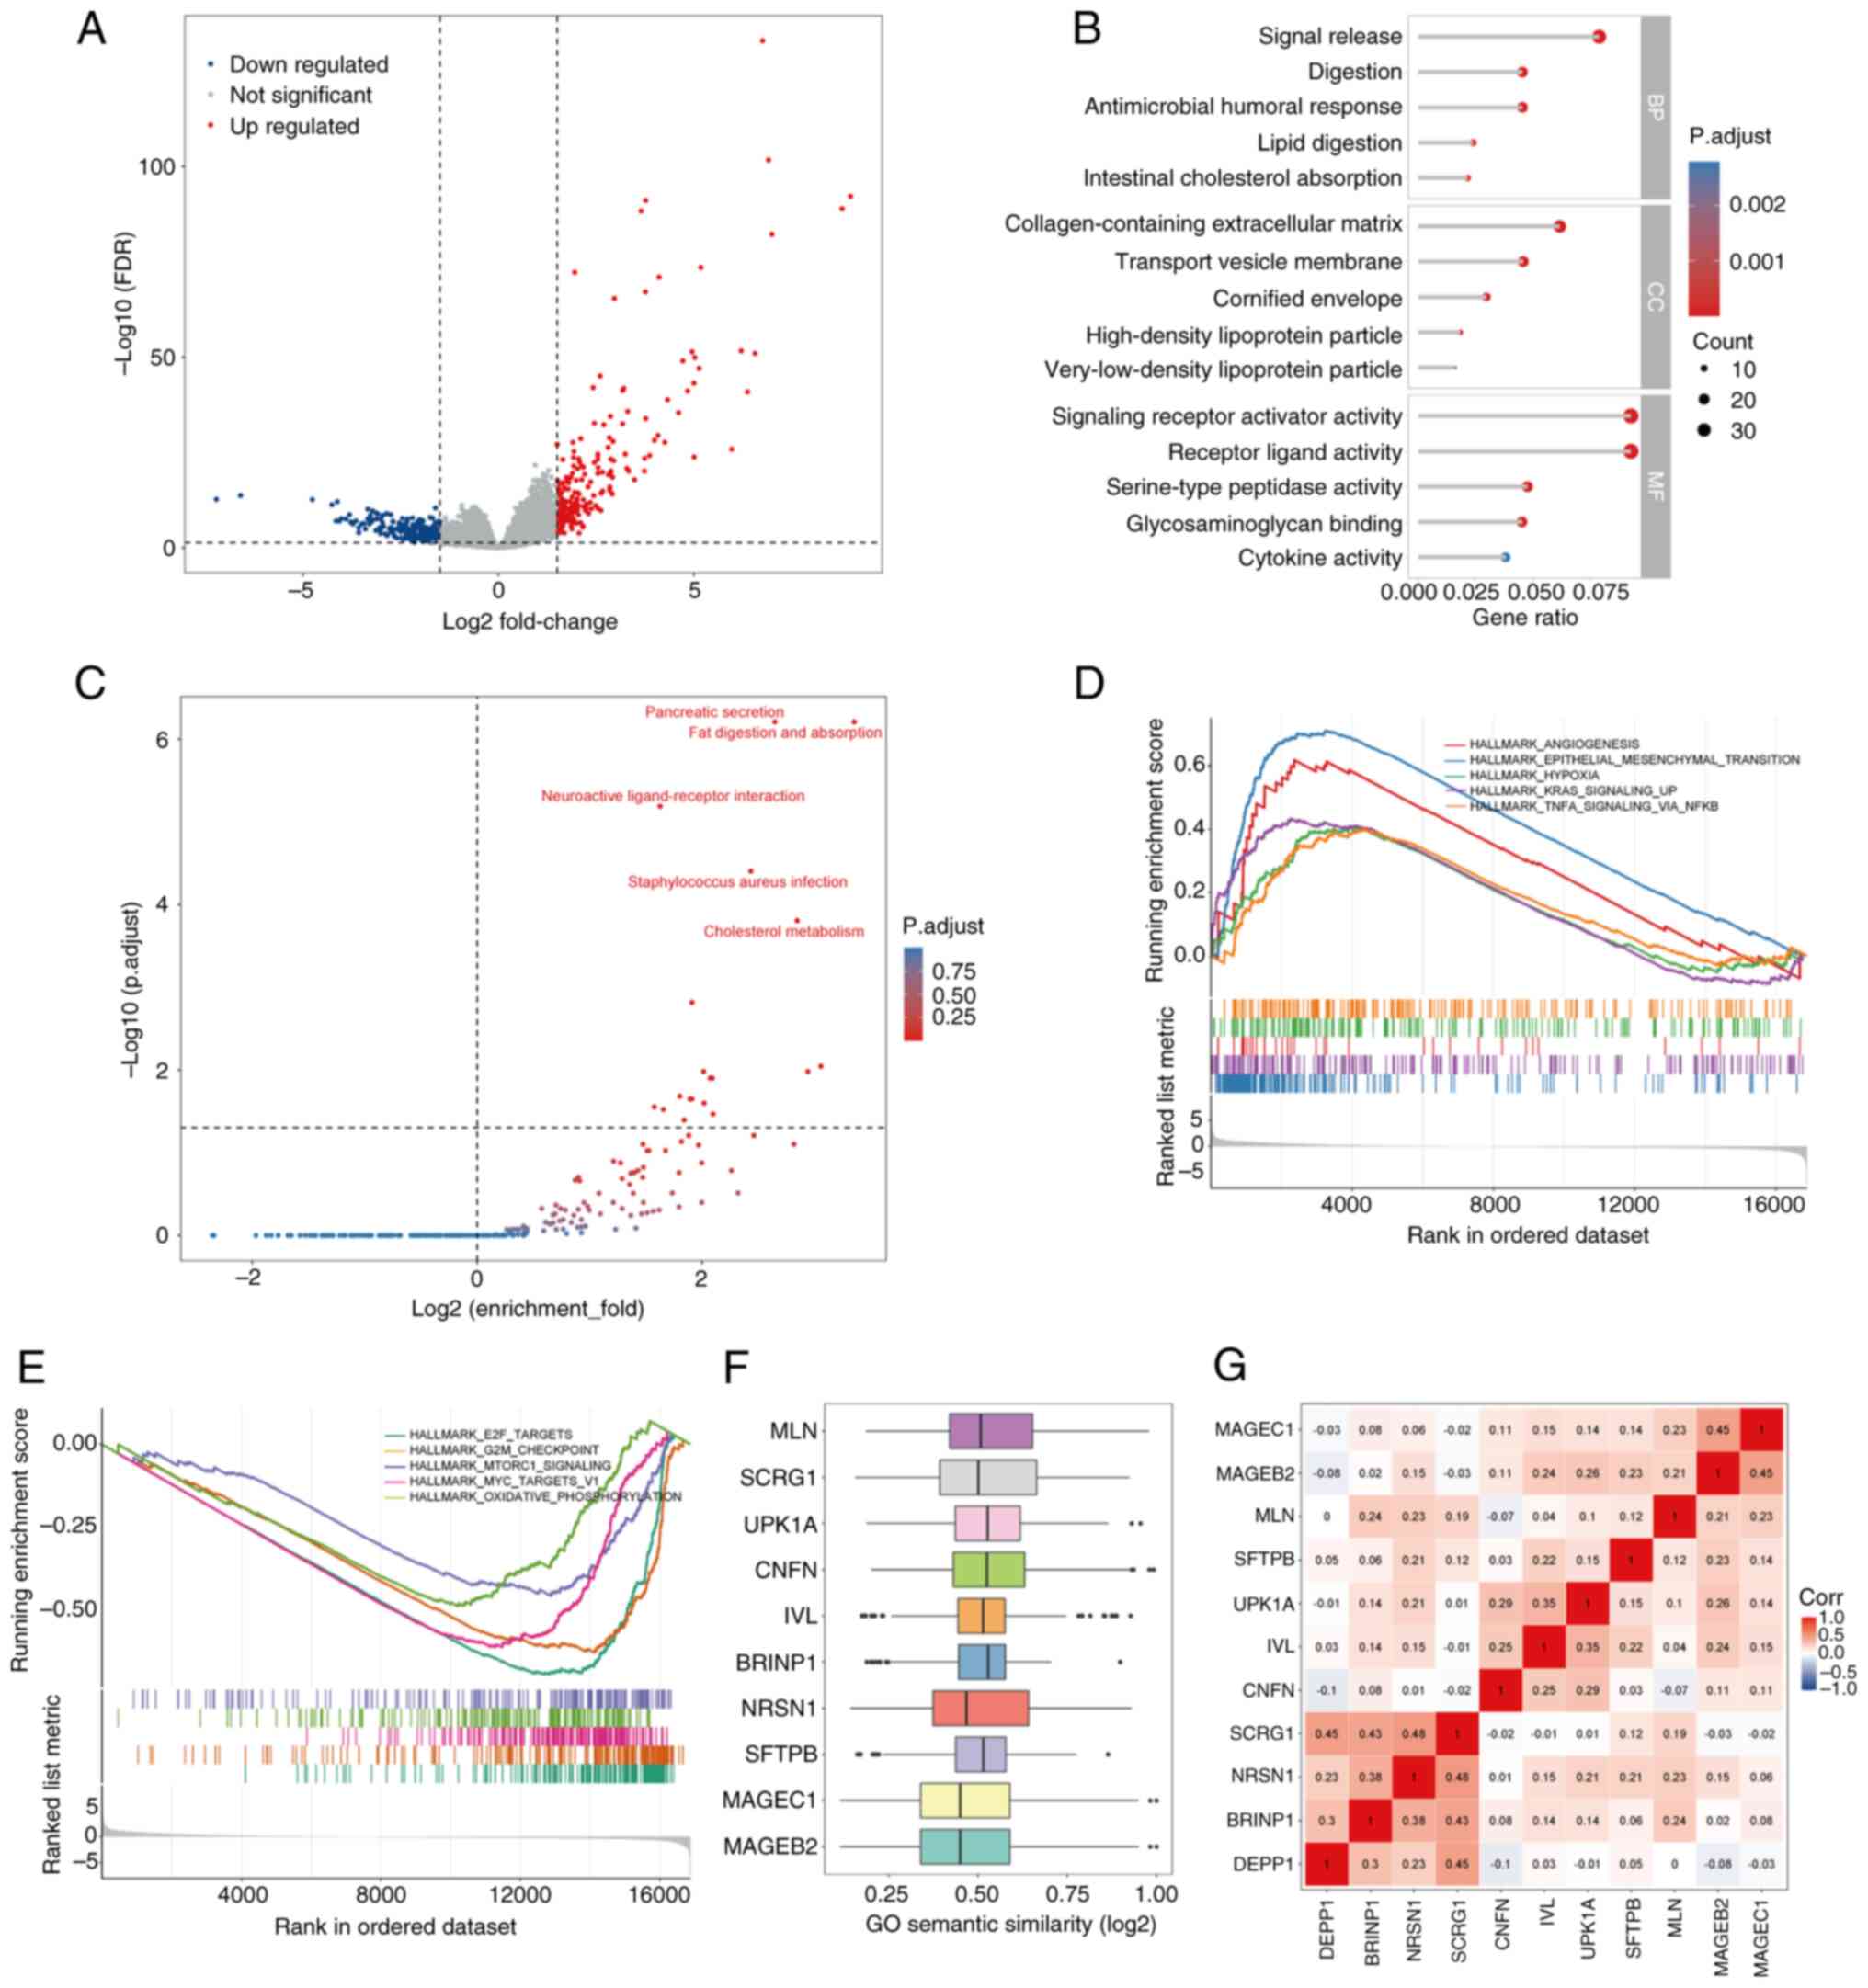
Exploration of the potential
regulatory mechanisms of DEPP1
Given the association of high DEPP1 expression with
poor prognosis, advanced TNM stage, and a stroma-rich,
immunosuppressive TME in GC, the authors sought to elucidate the
underlying regulatory mechanisms of DEPP1. Differential expression
analysis identified 216 upregulated and 251 downregulated genes in
the high-expression group of DEPP1 (Fig. 7A; Table SX). GO enrichment analysis
revealed enrichment in signal release, signaling receptor activator
activity, receptor-ligand activity, lipid digestion, intestinal
cholesterol absorption, and the collagen-containing extracellular
matrix (Fig. 7B; Table SXI). Similarly, KEGG analysis
highlighted pathways such as pancreatic secretion, fat digestion
and absorption, and neuroactive ligand-receptor interaction
(Fig. 7C; Table SXII).
GSEA further uncovered enrichment of hallmark
pathways, such as angiogenesis, epithelial-mesenchymal transition
(EMT), hypoxia, KRAS signaling, and TNFα signaling via NFκB in the
high-expression group of DEPP1 (Fig.
7D; Table SXIII). Conversely,
pathways including E2F targets, G2M checkpoint, MTORC1 signaling,
MYC targets and oxidative phosphorylation were enriched in the
low-expression group (Fig. 7E;
Table SXIII).
Subsequently, the Friends analysis identified
downstream hub genes of DEPP1, including MLN, SCRG1, UPK1A, CNFN,
IVL, BRINP1, NRSN1, SFTPB, MAGEC1 and MAGEB2, based on semantic
similarity of GO terms (Fig. 7F;
Table SXIV). These hub genes
exhibited significant correlations, suggesting potential
coordinated regulatory roles with DEPP1 in GC (Fig. 7G).
The prediction of chemotherapy
sensitivity
Chemotherapy remains a cornerstone in the treatment
of GC, particularly for patients with local non-resectable,
recurrent, or metastatic disease (32). To assess the predictive effect of
DEPP1 on chemotherapy sensitivity in GC, the IC50 of
select chemotherapy agents was estimated by using data from GDSC
and CTRP datasets (Tables SXV and
SXVI). Notably, the
IC50 of these drugs increased with DEPP1 expression,
indicating a potential association between high DEPP1 expression
and decreased chemotherapy sensitivity (Fig. 8A). Consistently, patients with GC
with higher DEPP1 expression exhibited significantly higher
IC50 values for these drugs compared with those with
lower DEPP1 expression, corroborating that increased DEPP1
expression may predict poor chemotherapy sensitivity in patients
with GC (Fig. 8B and C).
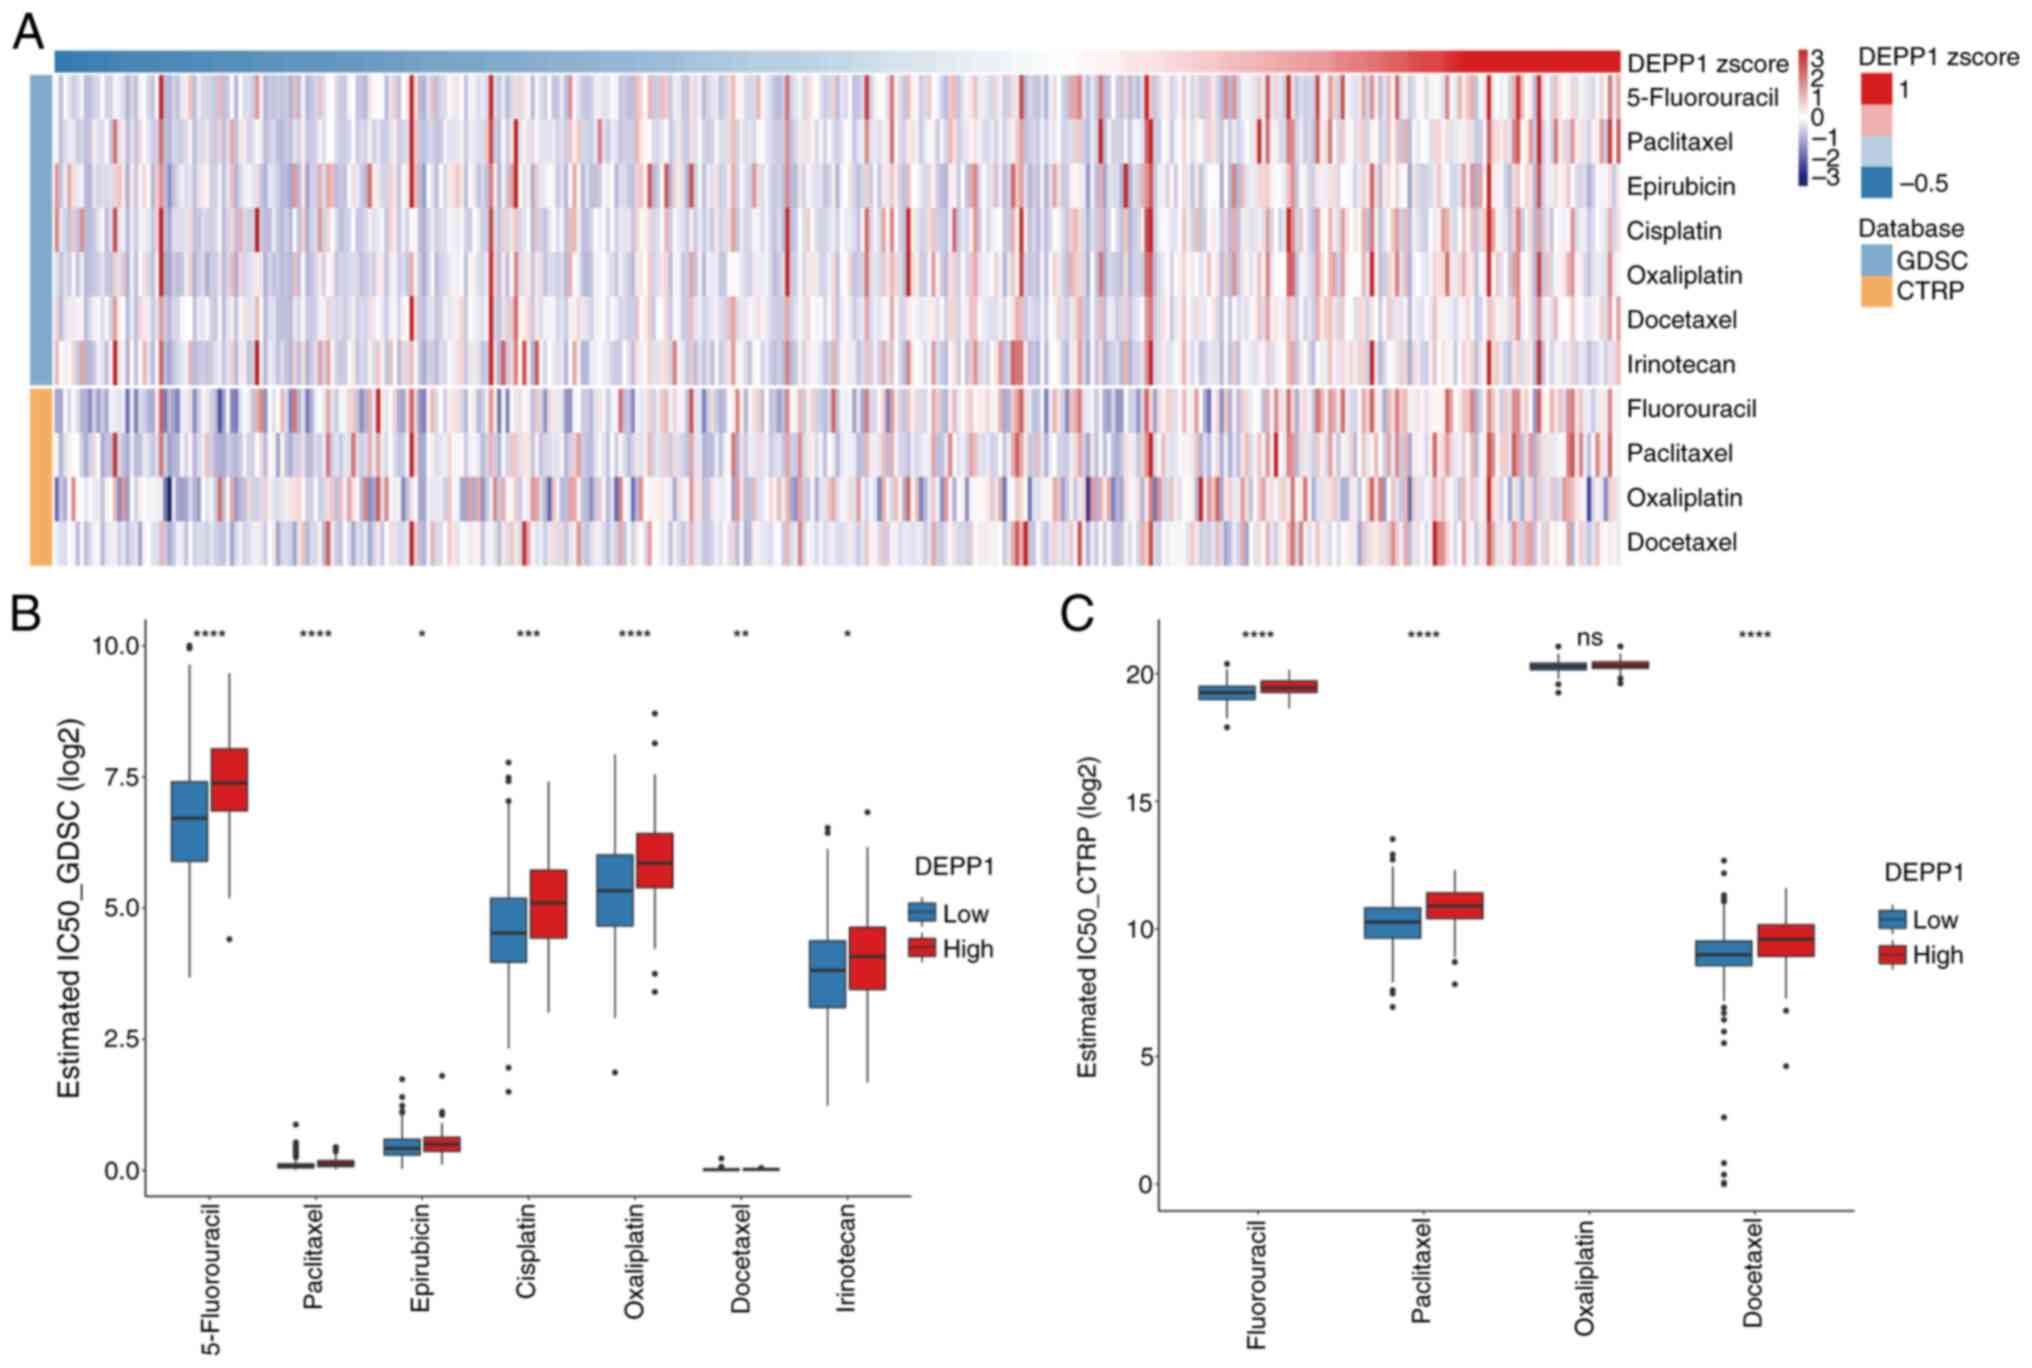 | Figure 8.High DEPP1 expression predicts poor
chemotherapy sensitivity in patients with GC. (A) The association
between DEPP1 expression levels and the IC50 of
selective chemotherapy drugs as shown by the heatmap. The estimated
IC50 of chemotherapy drugs in the low- and
high-expression groups of DEPP1, as analyzed using data from the
(B) GDSC and (C) CTRP datasets, respectively. *P<0.05,
**P<0.01, ***P<0.001 and ****P<0.0001. DEPP1, decidual
protein induced by progesterone; GC, gastric cancer;
IC50, half-maximal inhibitory concentration; GDSC,
Genomics of Drug Sensitivity in Cancer; CTRP, Cancer Therapeutics
Response Portal; ns, not significant. |
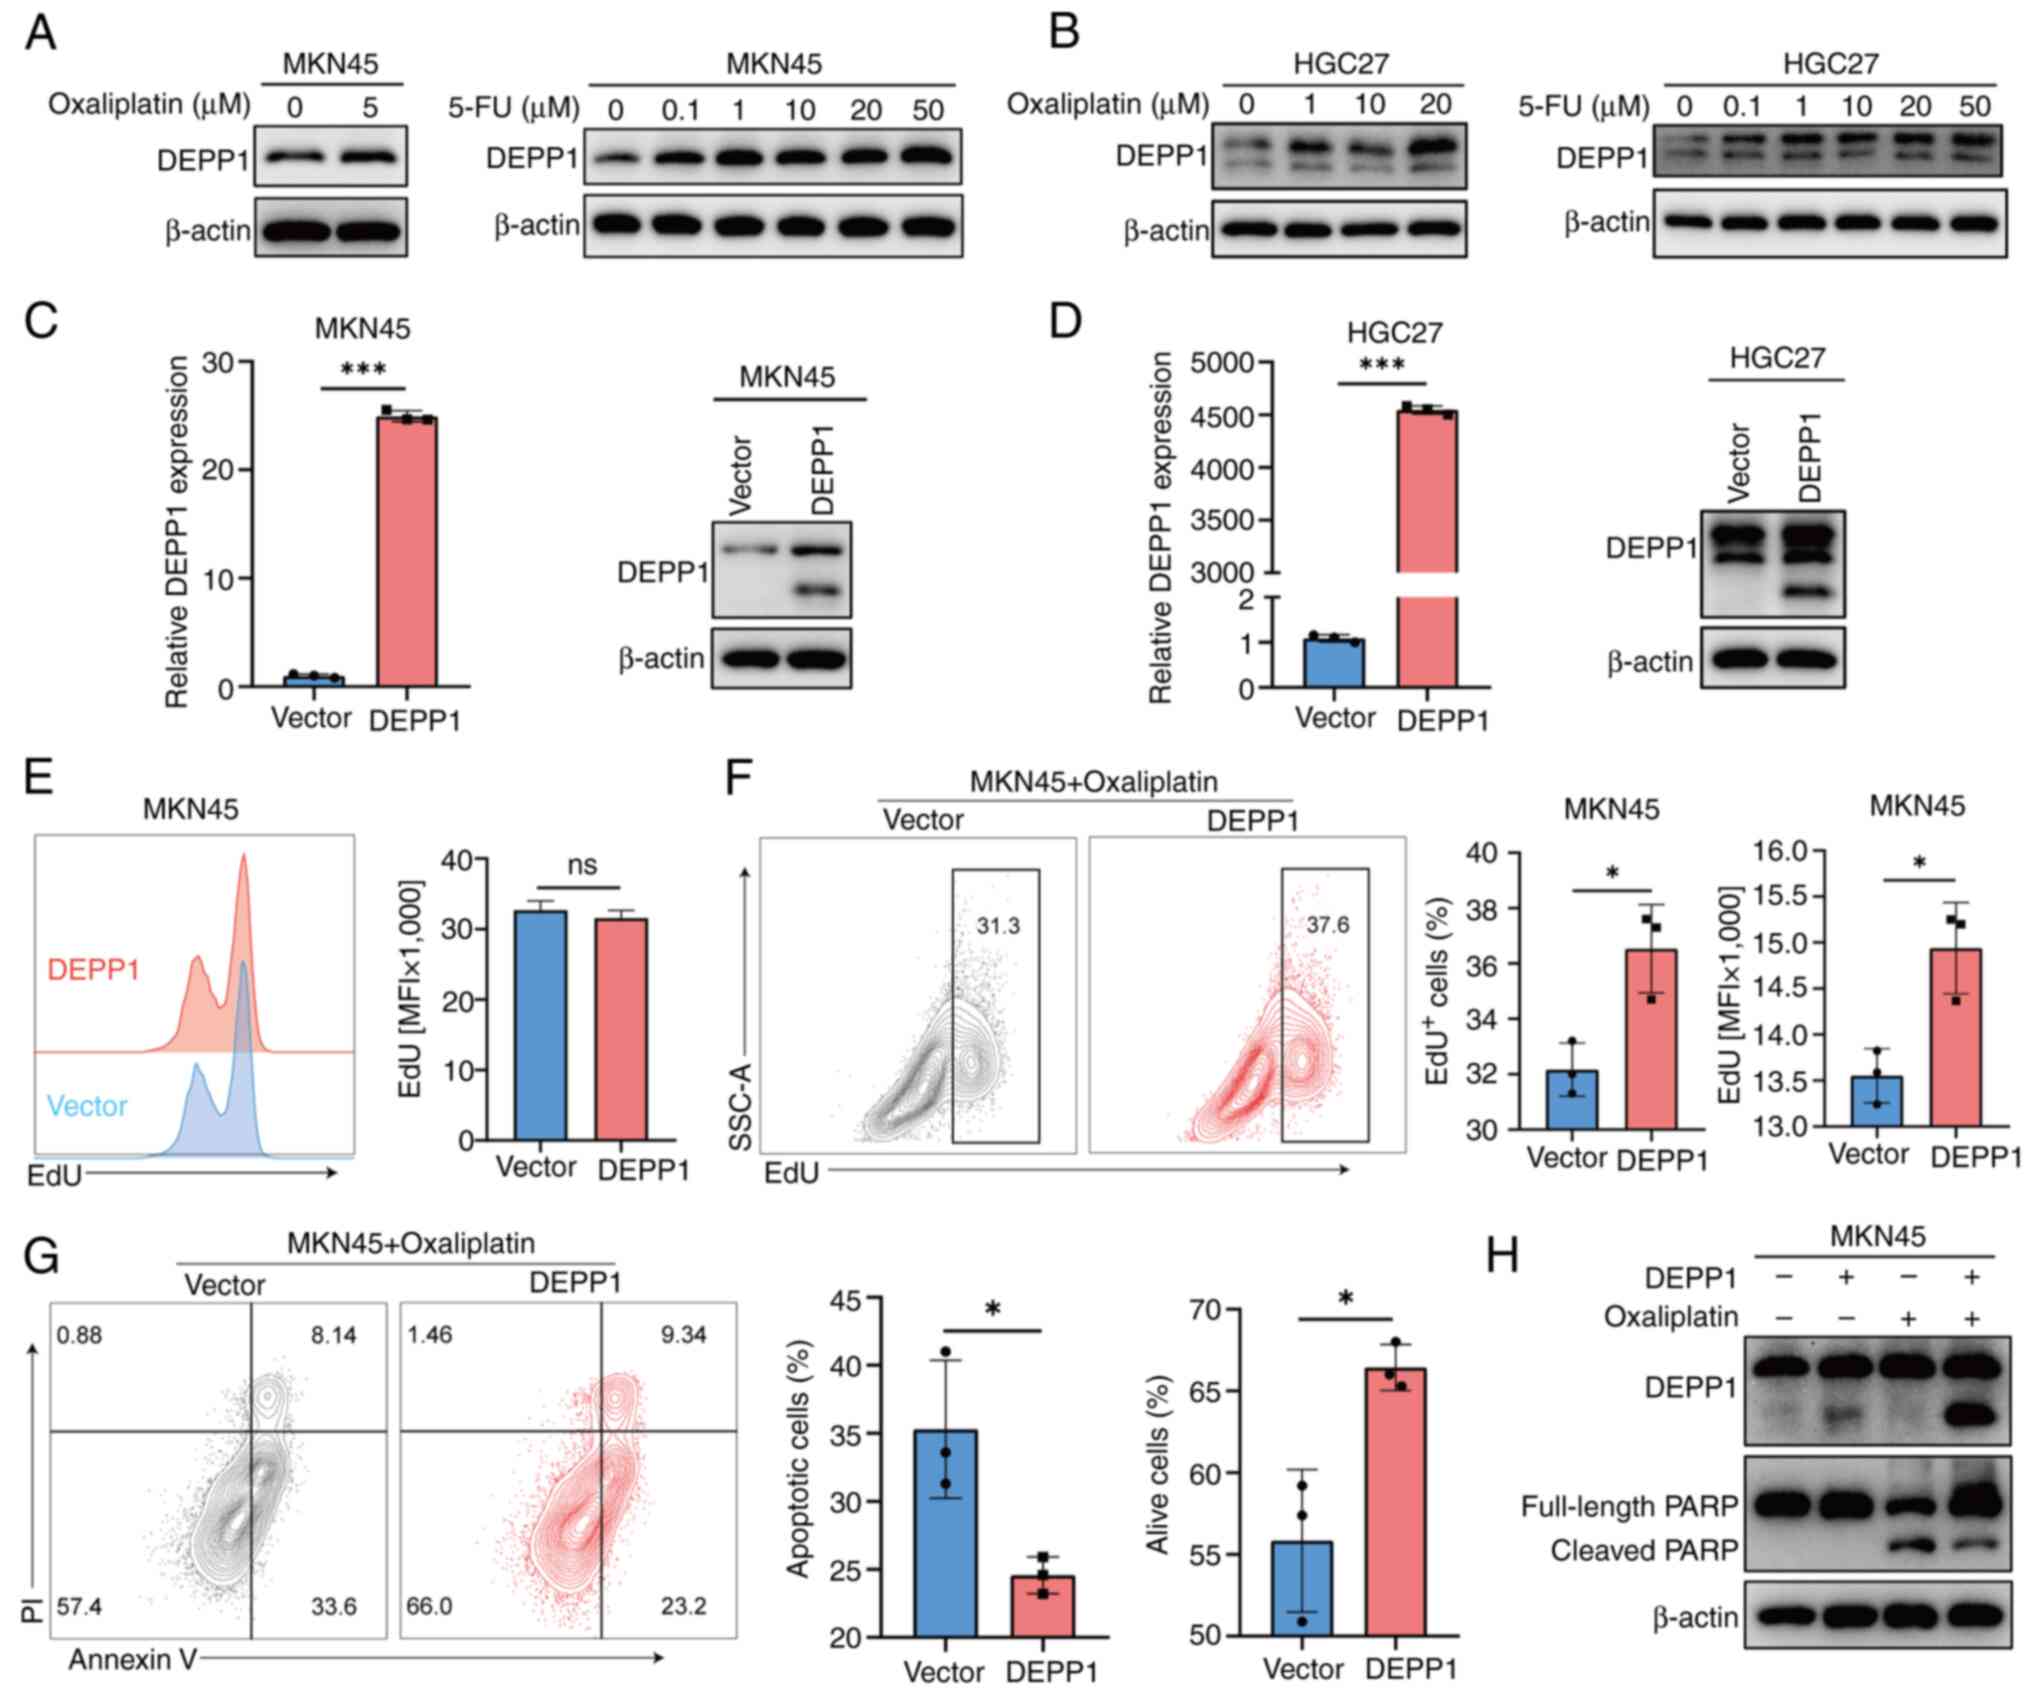
DEPP1 promotes oxaliplatin resistance
in GC cells in vitro
Given the association between elevated DEPP1
expression and increased IC50 values for chemotherapy
agents, the authors investigated whether these agents could
regulate DEPP1 expression. Remarkably, treatment with oxaliplatin
and 5-FU upregulated DEPP1 expression in MKN45 and HGC27 cells
(Fig. 9A and B). This finding
prompted the hypothesis that DEPP1 may regulate chemotherapy
resistance in GC. Therefore, the authors focused on oxaliplatin for
further analysis.
Using lentiviral vectors, the authors successfully
overexpressed DEPP1 in MKN45 and HGC27 cells, as verified by
RT-qPCR and western blotting (Fig. 9C
and D). It was observed that ectopic DEPP1 expression had
little effect on MKN45 cell proliferation (Fig. 9E) and a slightly promoting effect on
HGC27 (Fig. S2A). Of note, DEPP1
overexpression significantly enhanced the proliferation of MKN45
cells following a 24-h treatment with oxaliplatin (Fig. 9F), and a similar trend, though not
statistically significant, was observed in HGC27 cells (Fig. S2B).
It was further examined whether DEPP1 modulates
oxaliplatin-induced apoptosis. Flow cytometry results indicated
that increased DEPP1 expression reduced apoptosis and enhanced cell
survival under oxaliplatin treatment (Figs. 9G and S2C). Additionally, DEPP1 overexpression
led to a marked decrease in cleaved PARP protein levels, in MKN45
cells (Fig. 9H), whereas this
effect was less pronounced in HGC27 cells (Fig. S2D). It was also discovered that
ectopic DEPP1 expression attenuated the migratory abilities of GC
cells (Fig. S2E and F). These
findings collectively demonstrated that DEPP1 may enhance
oxaliplatin resistance in GC cells in vitro.
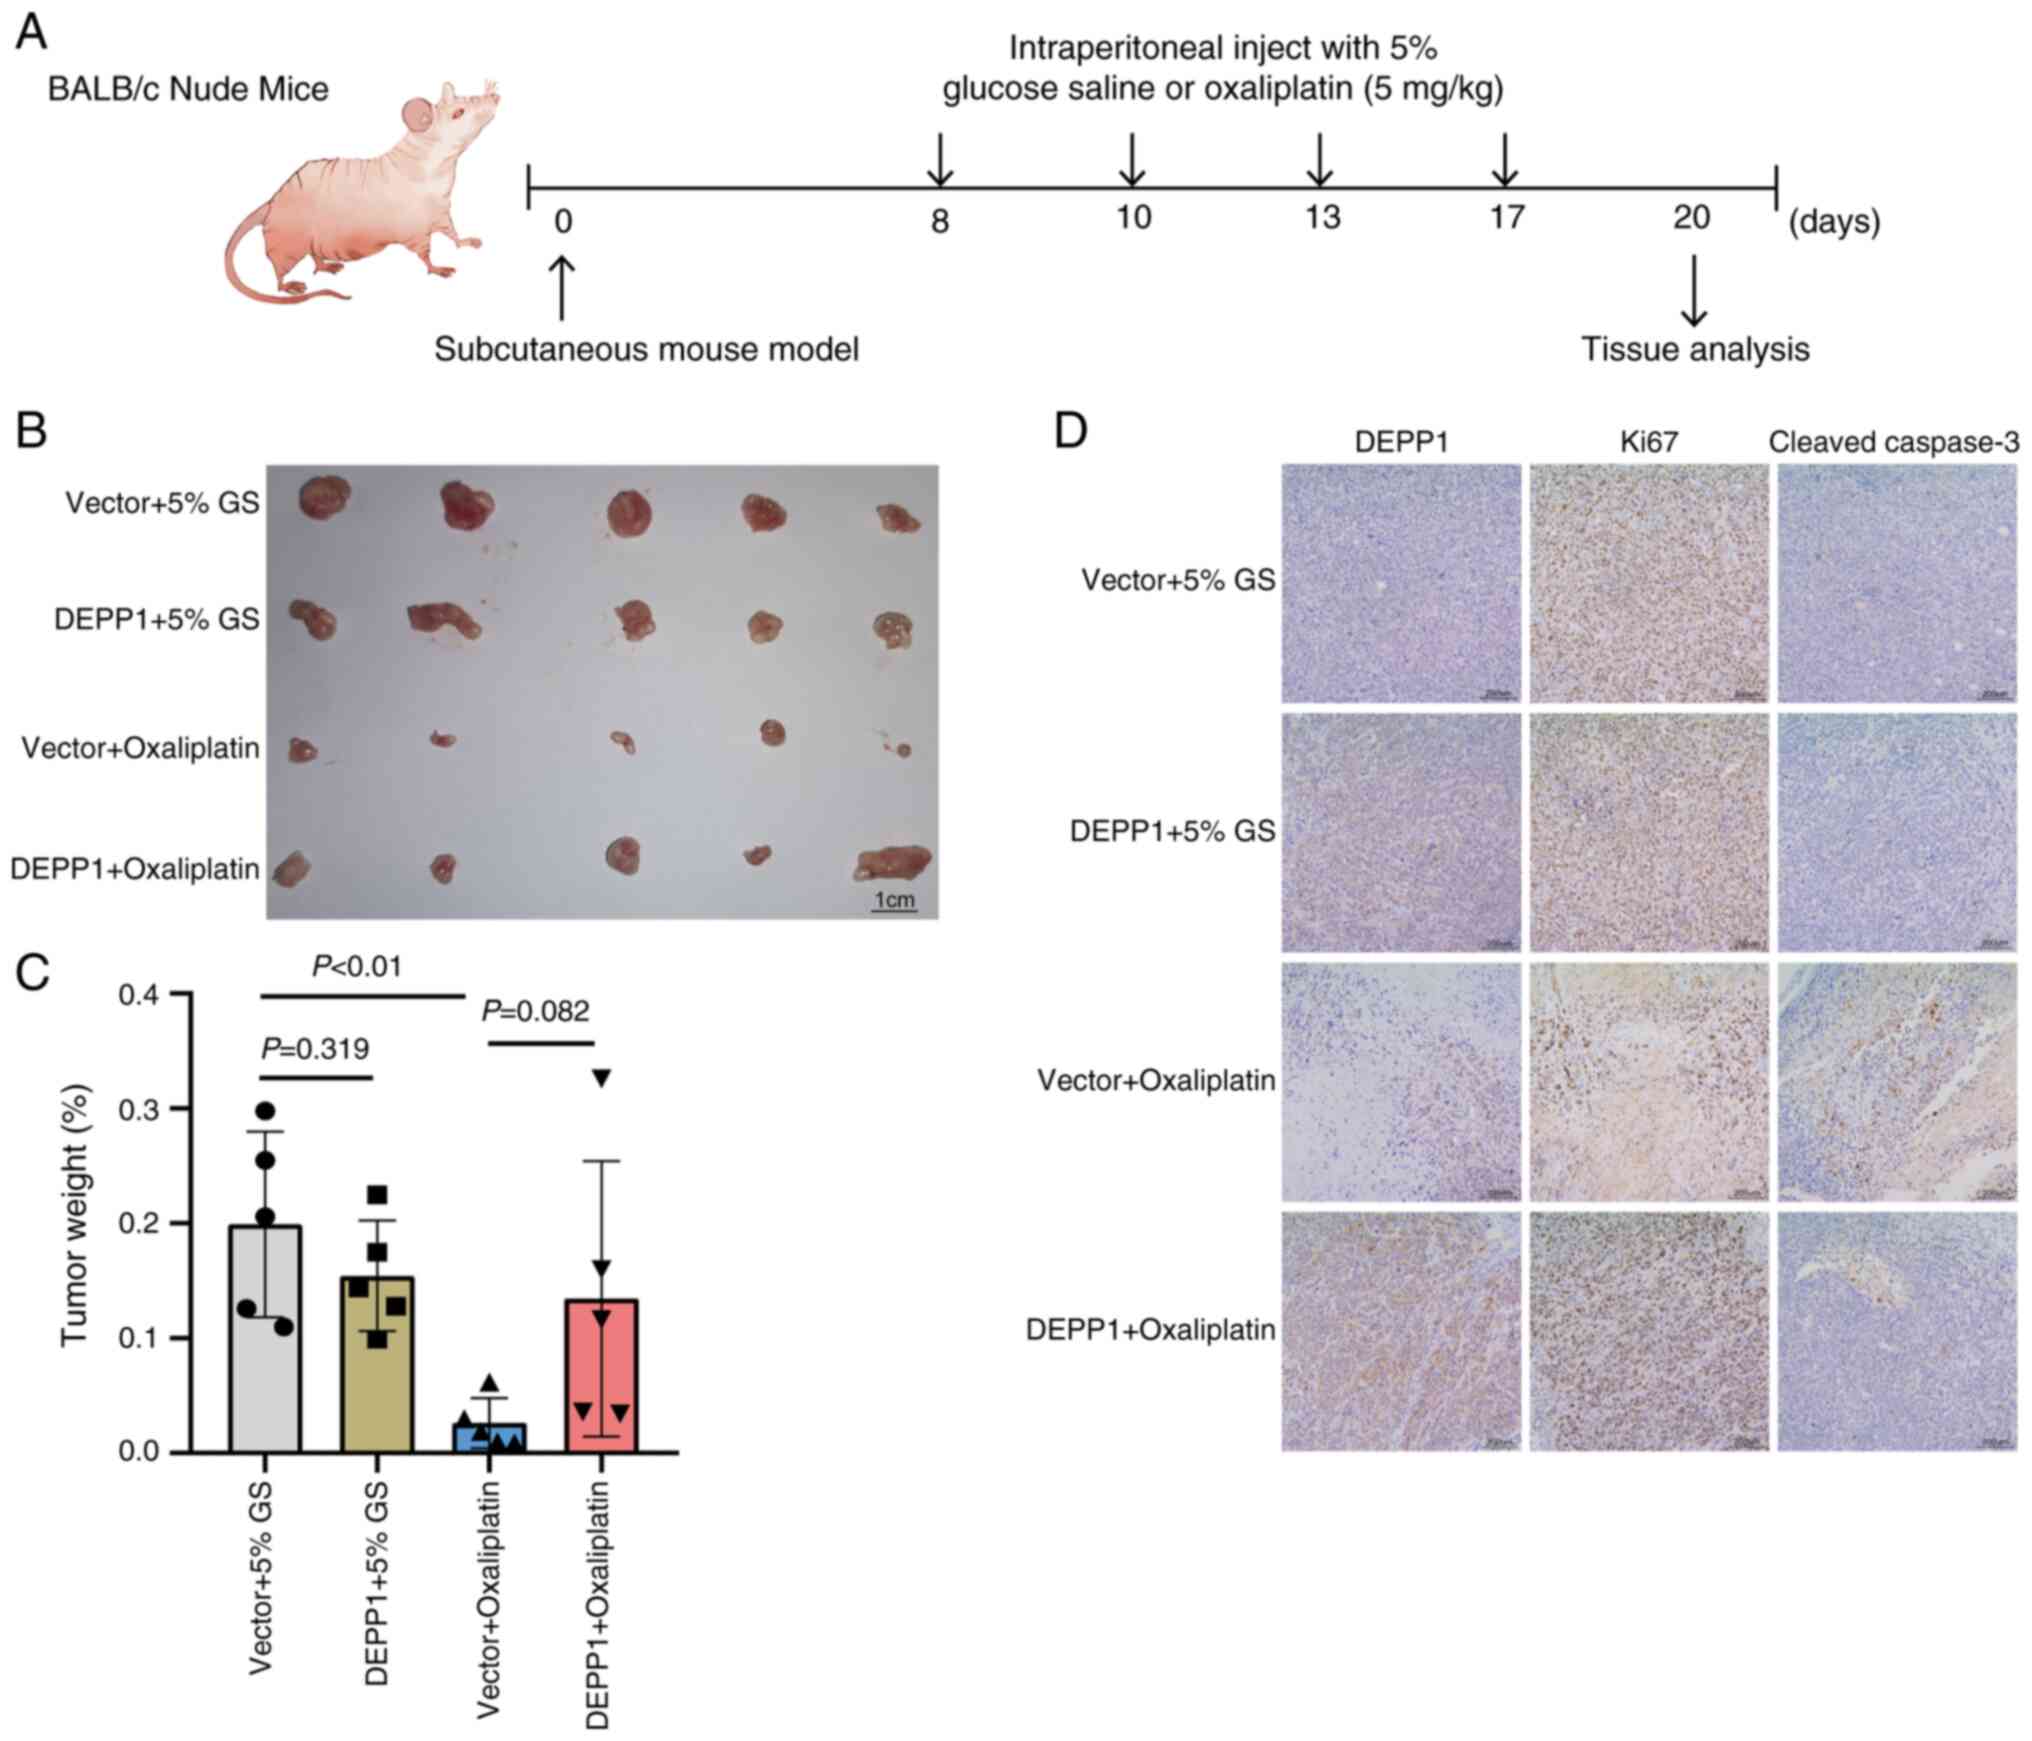
DEPP1 promotes oxaliplatin resistance
in GC cells in vivo
Building on the in vitro observations, the
impact of DEPP1 on oxaliplatin resistance was assessed in
vivo. Control and DEPP1-overexpressing MKN45 cells were
subcutaneously injected into the right flanks of nude mice,
followed by intraperitoneal administration of oxaliplatin or 5%
glucose saline at a dosage of 5 mg/kg (Fig. 10A). All mice survived during the
treatment and were euthanized via cervical dislocation 12 days
post-treatment. Consistent with in vitro results, ectopic
DEPP1 expression did not affect MKN45 tumor growth in vivo
but maintained tumor growth in the presence of oxaliplatin
(Fig. 10B-D). An induction of
DEPP1 expression was observed in GC tissues following oxaliplatin
treatment (Fig. 10D). Importantly,
the pronounced apoptosis induced by oxaliplatin was significantly
attenuated by DEPP1 overexpression, thereby confirming DEPP1′s role
in promoting oxaliplatin resistance in GC (Fig. 10D).
Discussion
GC ranks as the fifth most diagnosed malignancy and
the fourth leading cause of cancer-related deaths globally, posing
a significant threat to public health (2). Common symptoms of GC include
indigestion, anorexia, weight loss and abdominal pain. However, the
disease is often diagnosed at an advanced stage, rendering it
incurable and resulting in poor prognosis (32). Advanced GC frequently presents with
peritoneal or liver metastasis, further exacerbating prognosis
(30,33). The present study revealed a
significant overexpression of DEPP1 in GC tissues compared with
normal gastric tissues at both RNA and protein levels, suggesting
its potential as a biomarker for GC. Given DEPP1′s heterogenous
roles in several cancers, the authors aimed to investigate its
impact on GC, an aspect not previously addressed.
The American Joint Committee on Cancer TNM staging
system serves as the primary tool for evaluating GC patient
prognosis. However, its predictive efficiency varies, as patients
in the same stage exhibit significantly distinct survival outcomes
(34). Therefore, there is a
pressing need to identify novel prognostic biomarkers for GC to
complement the TNM staging system. The present study identified
high DEPP1 expression as predicting poor OS in patients with GC
across multiple cohorts, which was further validated by IHC testing
in our cohort. Additionally, DEPP1, along with TNM stage, emerged
as an independent risk factor for GC in TCGA-STAD and GSE84437
cohorts. Notably, DEPP1 outperformed classical oncogenes such as
EGFR and KRAS in predicting prognosis, highlighting its potential
as a promising prognostic biomarker for GC. Moreover, DEPP1
expression correlated significantly with TNM and T stages,
underscoring its critical role in GC progression. To enhance the
predictive accuracy of the TNM staging system, a nomogram
incorporating DEPP1 expression, age, and TNM stage was developed,
demonstrating superior predictive ability over the TNM staging
system alone.
The TME, comprising various stromal and immune
cells, exerts a crucial influence on tumor progression, including
GC (35). Intriguingly, a positive
correlation was observed between elevated DEPP1 expression and
stromal score in the GC TME, suggesting increased stromal cell
infiltration. Notably, the diffuse type of GC, characterized by
excessive stroma deposition and aggressive phenotypes, exhibited
significantly higher DEPP1 expression compared with other
phenotypes (29,30). CAFs constitute a pivotal component
of the TME, actively participating in cancer progression through
ECM generation and remodeling, as well as secretion of diverse
molecules, exosomes, and metabolites (36). ECs also hold significant importance
within the TME, contributing to immunosuppression and facilitating
remote dissemination of cancer cells (37,38).
In the present study, DEPP1 expression displayed a positive
correlation with infiltration rates of both CAFs and ECs.
Furthermore, significant enrichment of downstream genes associated
with DEPP1 was observed in the collagen-containing
extracellular matrix, indicating a potential regulatory role for
DEPP1 in the stromal component of the TME.
TAMs exhibit diverse phenotypes in the TME, with M2
macrophages promoting an immunosuppressive microenvironment
conducive to tumor progression (39). The findings of the present study
revealed a positive correlation between DEPP1 expression and M2
macrophage infiltration in the GC TME, suggesting DEPP1 as a
potential biomarker for an immunosuppressive microenvironment.
Angiogenesis and hypoxia are established hallmarks of TME of most
solid tumors (31,40). The stromal and immune cells in the
TME can secret a wide range of cytokines and chemokines, such as
TGFβ, IL-6, and CCL18, to induce the EMT of tumor cells (41). The present study demonstrated that
pathways related to angiogenesis, hypoxia, and EMT were enriched in
the subgroup with higher DEPP1 expression, implicating potential
mechanisms underlying the stroma-rich and immunosuppressive TME
associated with DEPP1.
Despite advancements in immunotherapy and targeted
therapy, chemotherapy remains a cornerstone in GC treatment,
particularly for unresectable or metastatic disease. Chemotherapy
significantly improves the median quality-adjusted survival time
from 2 to 6 months for patients with GC with surgically non-curable
diseases (42). Nevertheless, the
majority of patients eventually develop chemotherapy resistance,
leading to rapid disease progression and mortality (43). The present study demonstrated that
high DEPP1 expression correlated with poor chemotherapy
sensitivity. In vitro and in vivo experiments
confirmed that oxaliplatin treatment induces DEPP1 expression,
which in turn protects GC cells from apoptosis. Interestingly,
overexpression of DEPP1 was also observed to suppress the migration
of GC cells. Previous reports suggest that DEPP1 is upregulated in
challenging conditions, such as hypoxia, and can activate autophagy
(44,45). Emerging evidence indicates that
autophagy may inhibit EMT and Rho GTPase activity, thereby reducing
tumor metastasis (46). These
findings suggest that DEPP1 functions as a critical regulator,
promoting oxaliplatin resistance while simultaneously suppressing
the migratory ability of GC cells in the nutrient-deficient
TME.
There are several limitations to the present study.
First, the expression status of DEPP1 in oxaliplatin-resistant
human GC specimens has yet to be explored. Second, in the
subcutaneous mouse model, while DEPP1 overexpression appeared to
maintain tumor growth following oxaliplatin administration, this
effect did not reach statistical significance due to substantial
heterogeneity and small sample sizes. Additionally, the
apoptosis-protective effect of DEPP1 exhibited variability
across different GC cell lines, possibly attributable to intrinsic
differences in genetic backgrounds and apoptotic pathway
dependencies. This variability emphasizes the need for further
validation in primary GC models, such as organoids. Third, the
molecular mechanisms underlying DEPP1-mediated oxaliplatin
resistance warrant further investigation.
In conclusion, the authors highlight DEPP1 as an
independent prognostic biomarker with the potential to enhance the
predictive accuracy of the TNM staging system. Furthermore, its
association with a stroma-rich and immunosuppressive
microenvironment is elucidated. Most importantly, DEPP1′s role in
promoting oxaliplatin resistance is underscored, positioning it as
a promising therapeutic target for overcoming chemoresistance in GC
patients.
Supplementary Material
Supporting Data
Supporting Data
Supporting Data
Supporting Data
Supporting Data
Supporting Data
Supporting Data
Supporting Data
Supporting Data
Supporting Data
Supporting Data
Supporting Data
Supporting Data
Supporting Data
Supporting Data
Supporting Data
Supporting Data
Acknowledgements
Not applicable.
Funding
The present study was supported by the National Natural Science
Foundation of China (grant no. 82072669; and 81702303) and
CSCO-Zaiding Cancer Research Fund (grant no.
Y-zai2021/ms-0228).
Availability of data and materials
The data generated in the present study are
included in the figures and tables of this article.
Authors' contributions
XQ, TP, and TK conceived the study and drafted the
manuscript. YS, YZ, HG, and BN collected the data. XX, CZ, and ZZ
analyzed and interpreted the data. HC and LT revised the manuscript
and supervised the study. HC and LT confirm the authenticity of all
the raw data. All authors read and approved the final version of
the manuscript.
Ethics approval and consent to
participate
The present study adhered to the principles
outlined in The Declaration of Helsinki and obtained approval from
the Ethics Committee of Renji Hospital, Shanghai Jiao Tong
University School of Medicine (approval no. KY2021-252-B; Shanghai,
China). Written informed consent was obtained from all participants
included in the study, encompassing a statement on the collection
and utilization of clinical samples for scientific research
purposes.
Patient consent for publication
Not applicable.
Competing interests
The authors declare that they have no competing
interests.
References
|
1
|
Thrift AP, Wenker TN and El-Serag HB:
Global burden of gastric cancer: Epidemiological trends, risk
factors, screening and prevention. Nat Rev Clin Oncol. 20:338–349.
2023. View Article : Google Scholar : PubMed/NCBI
|
|
2
|
Sung H, Ferlay J, Siegel RL, Laversanne M,
Soerjomataram I, Jemal A and Bray F: Global cancer statistics 2020:
GLOBOCAN estimates of incidence and mortality worldwide for 36
cancers in 185 countries. CA Cancer J Clin. 71:209–249. 2021.
View Article : Google Scholar : PubMed/NCBI
|
|
3
|
de Visser KE and Joyce JA: The evolving
tumor microenvironment: From cancer initiation to metastatic
outgrowth. Cancer Cell. 41:374–403. 2023. View Article : Google Scholar : PubMed/NCBI
|
|
4
|
Wang R, Song S, Qin J, Yoshimura K, Peng
F, Chu Y, Li Y, Fan Y, Jin J, Dang M, et al: Evolution of immune
and stromal cell states and ecotypes during gastric adenocarcinoma
progression. Cancer Cell. 41:1407–1426.e9. 2023. View Article : Google Scholar : PubMed/NCBI
|
|
5
|
Guan WL, He Y and Xu RH: Gastric cancer
treatment: Recent progress and future perspectives. J Hematol
Oncol. 16:572023. View Article : Google Scholar : PubMed/NCBI
|
|
6
|
Watanabe H, Nonoguchi K, Sakurai T, Masuda
T, Itoh K and Fujita J: A novel protein Depp, which is induced by
progesterone in human endometrial stromal cells activates Elk-1
transcription factor. Mol Hum Reprod. 11:471–476. 2005. View Article : Google Scholar : PubMed/NCBI
|
|
7
|
Salcher S, Hagenbuchner J, Geiger K,
Seiter MA, Rainer J, Kofler R, Hermann M, Kiechl-Kohlendorfer U,
Ausserlechner MJ and Obexer P: C10ORF10/DEPP, a transcriptional
target of FOXO3, regulates ROS-sensitivity in human neuroblastoma.
Mol Cancer. 13:2242014. View Article : Google Scholar : PubMed/NCBI
|
|
8
|
Wang Z, Ma L, Su M, Zhou Y, Mao K, Li C,
Peng G, Zhou C, Shen B and Dou J: Baicalin induces cellular
senescence in human colon cancer cells via upregulation of DEPP and
the activation of Ras/Raf/MEK/ERK signaling. Cell Death Dis.
9:2172018. View Article : Google Scholar : PubMed/NCBI
|
|
9
|
Deng Y, Song Y, Du Q, Wang CC, Li H, Sui
Y, Zhang Y and Tang T: Anti-HPV16 oncoproteins siRNA therapy for
cervical cancer using a novel transdermal peptide PKU12. Front
Oncol. 13:11759582023. View Article : Google Scholar : PubMed/NCBI
|
|
10
|
Chen Y, Tang M, Li H and Huang J: Effects
of C10orf10 on growth and prognosis of glioma under hypoxia. Zhong
Nan Da Xue Xue Bao Yi Xue Ban. 48:499–507. 2023.(In Chinese,
English). PubMed/NCBI
|
|
11
|
Yoon SJ, Park J, Shin Y, Choi Y, Park SW,
Kang SG, Son HY and Huh YM: Deconvolution of diffuse gastric cancer
and the suppression of CD34 on the BALB/c nude mice model. BMC
Cancer. 20:3142020. View Article : Google Scholar : PubMed/NCBI
|
|
12
|
Ooi CH, Ivanova T, Wu J, Lee M, Tan IB,
Tao J, Ward L, Koo JH, Gopalakrishnan V, Zhu Y, et al: Oncogenic
pathway combinations predict clinical prognosis in gastric cancer.
PLoS Genet. 5:e10006762009. View Article : Google Scholar : PubMed/NCBI
|
|
13
|
Ritchie ME, Phipson B, Wu D, Hu Y, Law CW,
Shi W and Smyth GK: limma powers differential expression analyses
for RNA-sequencing and microarray studies. Nucleic Acids Res.
43:e472015. View Article : Google Scholar : PubMed/NCBI
|
|
14
|
Jia A, Xu L and Wang Y: Venn diagrams in
bioinformatics. Brief Bioinform. 22:bbab1082021. View Article : Google Scholar : PubMed/NCBI
|
|
15
|
Livak KJ and Schmittgen TD: Analysis of
relative gene expression data using real-time quantitative PCR and
the 2(−Delta Delta C(T)) Method. Methods. 25:402–8. 2001.
View Article : Google Scholar : PubMed/NCBI
|
|
16
|
Iasonos A, Schrag D, Raj GV and Panageas
KS: How to build and interpret a nomogram for cancer prognosis. J
Clin Oncol. 26:1364–1370. 2008. View Article : Google Scholar : PubMed/NCBI
|
|
17
|
Balachandran VP, Gonen M, Smith JJ and
DeMatteo RP: Nomograms in oncology: More than meets the eye. Lancet
Oncol. 16:e173–e180. 2015. View Article : Google Scholar : PubMed/NCBI
|
|
18
|
Yoshihara K, Shahmoradgoli M, Martínez E,
Vegesna R, Kim H, Torres-Garcia W, Treviño V, Shen H, Laird PW,
Levine DA, et al: Inferring tumour purity and stromal and immune
cell admixture from expression data. Nat Commun. 4:26122013.
View Article : Google Scholar : PubMed/NCBI
|
|
19
|
Racle J, de Jonge K, Baumgaertner P,
Speiser DE and Gfeller D: Simultaneous enumeration of cancer and
immune cell types from bulk tumor gene expression data. Elife.
6:e264762017. View Article : Google Scholar : PubMed/NCBI
|
|
20
|
Li T, Fan J, Wang B, Traugh N, Chen Q, Liu
JS, Li B and Liu XS: TIMER: A web server for comprehensive analysis
of tumor-infiltrating immune cells. Cancer Res. 77:e108–e110. 2017.
View Article : Google Scholar : PubMed/NCBI
|
|
21
|
Finotello F, Mayer C, Plattner C,
Laschober G, Rieder D, Hackl H, Krogsdam A, Loncova Z, Posch W,
Wilflingseder D, et al: Molecular and pharmacological modulators of
the tumor immune contexture revealed by deconvolution of RNA-seq
data. Genome Med. 11:342019. View Article : Google Scholar : PubMed/NCBI
|
|
22
|
Sturm G, Finotello F and List M:
Immunedeconv: An R package for unified access to computational
methods for estimating immune cell fractions from bulk
RNA-sequencing data. Methods Mol Biol. 2120:223–232. 2020.
View Article : Google Scholar : PubMed/NCBI
|
|
23
|
Yu G, Wang LG, Han Y and He QY:
clusterProfiler: An R package for comparing biological themes among
gene clusters. OMICS. 16:284–287. 2012. View Article : Google Scholar : PubMed/NCBI
|
|
24
|
Liberzon A, Birger C, Thorvaldsdóttir H,
Ghandi M, Mesirov JP and Tamayo P: The molecular signatures
database (MSigDB) hallmark gene set collection. Cell Syst.
1:417–425. 2015. View Article : Google Scholar : PubMed/NCBI
|
|
25
|
Yu G, Li F, Qin Y, Bo X, Wu Y and Wang S:
GOSemSim: An R package for measuring semantic similarity among GO
terms and gene products. Bioinformatics. 26:976–978. 2010.
View Article : Google Scholar : PubMed/NCBI
|
|
26
|
Maeser D, Gruener RF and Huang RS:
oncoPredict: An R package for predicting in vivo or cancer patient
drug response and biomarkers from cell line screening data. Brief
Bioinform. 22:bbab2602021. View Article : Google Scholar : PubMed/NCBI
|
|
27
|
Uno H, Claggett B, Tian L, Inoue E, Gallo
P, Miyata T, Schrag D, Takeuchi M, Uyama Y, Zhao L, et al: Moving
beyond the hazard ratio in quantifying the between-group difference
in survival analysis. J Clin Oncol. 32:2380–2385. 2014. View Article : Google Scholar : PubMed/NCBI
|
|
28
|
Lei ZN, Teng QX, Tian Q, Chen W, Xie Y, Wu
K, Zeng Q, Zeng L, Pan Y, Chen ZS and He Y: Signaling pathways and
therapeutic interventions in gastric cancer. Signal Transduct
Target Ther. 7:3582022. View Article : Google Scholar : PubMed/NCBI
|
|
29
|
Lauren P: The two histological main types
of gastric carcinoma: diffuse and so-called intestinal-type
carcinoma. An attempt at a histo-clinical classification. Acta
Pathol Microbiol Scand. 64:31–49. 1965. View Article : Google Scholar : PubMed/NCBI
|
|
30
|
Ajani JA, Lee J, Sano T, Janjigian YY, Fan
D and Song S: Gastric adenocarcinoma. Nat Rev Dis Primers.
3:170362017. View Article : Google Scholar : PubMed/NCBI
|
|
31
|
Hanahan D and Weinberg RA: Hallmarks of
cancer: The next generation. Cell. 144:646–674. 2011. View Article : Google Scholar : PubMed/NCBI
|
|
32
|
Smyth EC, Nilsson M, Grabsch HI, van
Grieken NC and Lordick F: Gastric cancer. Lancet. 396:635–648.
2020. View Article : Google Scholar : PubMed/NCBI
|
|
33
|
Gwee YX, Chia DKA, So J, Ceelen W, Yong
WP, Tan P, Ong CJ and Sundar R: Integration of genomic biology into
therapeutic strategies of gastric cancer peritoneal metastasis. J
Clin Oncol. 40:28302022. View Article : Google Scholar : PubMed/NCBI
|
|
34
|
Fang C, Wang W, Deng JY, Sun Z, Seeruttun
SR, Wang ZN, Xu HM, Liang H and Zhou ZW: Proposal and validation of
a modified staging system to improve the prognosis predictive
performance of the 8th AJCC/UICC pTNM staging system for gastric
adenocarcinoma: A multicenter study with external validation.
Cancer Commun (Lond). 38:672018.PubMed/NCBI
|
|
35
|
Arner EN and Rathmell JC: Metabolic
programming and immune suppression in the tumor microenvironment.
Cancer Cell. 41:421–433. 2023. View Article : Google Scholar : PubMed/NCBI
|
|
36
|
Chen Y, McAndrews KM and Kalluri R:
Clinical and therapeutic relevance of cancer-associated
fibroblasts. Nat Rev Clin Oncol. 18:792–804. 2021. View Article : Google Scholar : PubMed/NCBI
|
|
37
|
Amersfoort J, Eelen G and Carmeliet P:
Immunomodulation by endothelial cells-partnering up with the immune
system? Nat Rev Immunol. 22:576–588. 2022. View Article : Google Scholar : PubMed/NCBI
|
|
38
|
Ma Q, Dieterich LC and Detmar M: Multiple
roles of lymphatic vessels in tumor progression. Curr Opin Immunol.
53:7–12. 2018. View Article : Google Scholar : PubMed/NCBI
|
|
39
|
Xiang X, Wang J, Lu D and Xu X: Targeting
tumor-associated macrophages to synergize tumor immunotherapy.
Signal Transduct Target Ther. 6:752021. View Article : Google Scholar : PubMed/NCBI
|
|
40
|
Chen Z, Han F, Du Y, Shi H and Zhou W:
Hypoxic microenvironment in cancer: molecular mechanisms and
therapeutic interventions. Signal Transduct Target Ther. 8:702023.
View Article : Google Scholar : PubMed/NCBI
|
|
41
|
Dongre A and Weinberg RA: New insights
into the mechanisms of epithelial-mesenchymal transition and
implications for cancer. Nat Rev Mol Cell Biol. 20:69–84. 2019.
View Article : Google Scholar : PubMed/NCBI
|
|
42
|
Glimelius B, Ekström K, Hoffman K, Graf W,
Sjödén PO, Haglund U, Svensson C, Enander LK, Linné T, Sellström H
and Heuman R: Randomized comparison between chemotherapy plus best
supportive care with best supportive care in advanced gastric
cancer. Ann Oncol. 8:163–168. 1997. View Article : Google Scholar : PubMed/NCBI
|
|
43
|
Yoon C, Park DJ, Schmidt B, Thomas NJ, Lee
HJ, Kim TS, Janjigian YY, Cohen DJ and Yoon SS: CD44 expression
denotes a subpopulation of gastric cancer cells in which Hedgehog
signaling promotes chemotherapy resistance. Clin Cancer Res.
20:3974–3988. 2014. View Article : Google Scholar : PubMed/NCBI
|
|
44
|
Stepp MW, Folz RJ, Yu J and Zelko IN: The
c10orf10 gene product is a new link between oxidative stress and
autophagy. Biochim Biophys Acta. 1843:1076–1088. 2014. View Article : Google Scholar : PubMed/NCBI
|
|
45
|
Wyant GA, Jiang Q, Singh M, Qayyum S,
Levrero C, Maron BA and Kaelin WG Jr: Induction of DEPP1 by HIF
mediates multiple hallmarks of ischemic cardiomyopathy.
Circulation. 150:770–786. 2024. View Article : Google Scholar : PubMed/NCBI
|
|
46
|
Dower CM, Wills CA, Frisch SM and Wang HG:
Mechanisms and context underlying the role of autophagy in cancer
metastasis. Autophagy. 14:1110–1128. 2018. View Article : Google Scholar : PubMed/NCBI
|