Introduction
Despite the improvements in early detection due to
better imaging, more advanced surgical techniques and
individualized systemic therapies, pancreatic ductal adenocarcinoma
(PDAC) remains a highly fatal type of cancer. In the last 40 years,
several systemic adjuvant chemotherapy protocols have been
evaluated, which have improved disease-free survival and overall
survival (1,2). For example, adding oxaliplatin to
standard gemcitabine therapy has been shown to be more efficacious
than treatment with gemcitabine alone (3,4). At
present, oxaliplatin remains one of the mainstay drugs for PDAC
treatment, including in combination with folinic acid and
5-fluorouracil, or with additional irinotecan (5). The pharmacological mechanism of
oxaliplatin includes cellular uptake, release of the oxalate group,
and the subsequent binding of the positively charged platinum
moiety to the N7 atom of the purine bases adenine and guanine,
leading to cytotoxic adducts at DNA or DNA cross-links.
Accordingly, oxaliplatin resistance is mechanistically related to
these molecular steps (6).
In general, two basic modes can lead to oxaliplatin
resistance: i) Poor oxaliplatin accumulation due to low expression
of important influx transporters, such as organic cation
transporters 1–3 (encoded by SLC22A1-3) or human copper
transporter 1 (encoded by SLC31A1), or high expression of
oxaliplatin efflux transporters, including multidrug
resistance-related protein 2 (MRP2, encoded by ABCC2),
Menkes' protein (encoded by ATP7A) or Wilson disease protein
(encoded by ATP7B) (7,8). ii)
An altered molecular response to the drug (6). Among the numerous molecular factors
involved in unresponsiveness to oxaliplatin, alterations in the DNA
damage response or cell cycle regulation seem to be of particular
relevance (9). For example,
expression and activity of MAPK-activated protein kinase 2
(10), TGF-β-activated kinase-1
(11), RAS oncogene family-like
protein 6 isoform A (12), DNA
methyltransferase 3a (13), BRCA2
(14), the HuR/Wee1 axis (15) or the hepatocyte nuclear factor 1
homeobox A/p53-binding protein 1 axis (16) have been implicated in oxaliplatin
resistance in PDAC. Taken together, oxaliplatin resistance in PDAC
is considered to be caused by the combined effect of poor drug
uptake and an altered molecular response to the cytotoxic threat.
However, there is little knowledge on which mechanism dominates.
Accordingly, the present study evaluated the anti-proliferative
pharmacodynamics of oxaliplatin [half maximal inhibitory
concentration (IC50) values] in PDAC models assessing
both nominal extracellular drug concentrations and also the
resulting intracellular concentrations, allowing for the
quantification of the relative contribution of drug uptake to the
overall resistance phenotype. At identical intracellular platinum
concentrations, the kinetics of caspase 3/7 activity, and
transcriptomic changes associated with DNA damage response, cell
cycle regulation, inflammation and fibrosis signaling, and redox
regulation were recorded. Eventually, baseline expression levels of
associated genes and oxaliplatin drug transporters were
evaluated.
Materials and methods
Cell lines
AsPC-1 (classical-like) and BxPC-3 (basal-like) PDAC
cells were purchased from American Type Culture Collection. The
cells were cultured in RPMI-1640 medium (PAN-Biotech GmbH),
supplemented with 10% fetal bovine serum, 100 U/ml penicillin and
100 µg/ml streptomycin sulfate (all from Sigma-Aldrich; Merck
KGaA), in 75 cm2 flasks at 37°C and 5% CO2.
The medium was changed twice a week and cells were passaged at ~80%
confluence.
Human patient-derived organoids
(hPDOs)
hPDOs were obtained from patients undergoing
surgical PDAC resection (with or without neoadjuvant chemotherapy)
and were characterized with much detail (17). h08 is a basal-like organoid, whereas
h19 is a classical-like organoid, with missense mutations in
TP53, BRCA1, SETD2, SPTB, BCORL1, ITPR3 and TLE4.
Moreover, h19 harbors a frameshift deletion in CDKN2A, and
multi-hit mutations in SMAD4 and BRCA2;
phenotypically, it has shown high resistance against several
cytotoxic drugs (17).
Proliferation assay for PDAC cell
lines
To assess the anti-proliferative pharmacodynamics of
oxaliplatin, 2×10⁴ AsPC-1 cells/well or 1×10⁴
BxPC-3 cells/well were seeded into clear 96-well plates. One
cell-free column served as a blank for later staining. After 24 h
of cell attachment, the medium was discarded and replaced with
medium containing different concentrations of cisplatin (control
drug, obtained from the Heidelberg University Hospital Pharmacy as
a 1 mg/ml stock) and oxaliplatin (obtained from the Heidelberg
University Hospital Pharmacy as a 1 mg/ml stock) (AsPC-1, 1–1,000
µM; BxPC-3, 5–500 µM). After 4 h of exposure at 37°C, the
drug-containing medium was replaced with drug-free medium and the
cells were cultured for an additional 48 h at 37°C. Subsequently,
the medium was removed and the cells were washed with PBS, after
which 50 µl crystal violet was added to all wells and incubated on
a shaker for 10 min at room temperature. After removal of the
crystal violet solution, all wells were washed with tap water and
dried at 37°C. By adding 99.9% methanol, the cell-bound dye was
dissolved, and the SpectraMax iD3 Multi-Mode Microplate Reader
(Molecular Devices, LLC) was used to measure the absorbance at 555
nm.
To obtain values corresponding to the proliferation
at each concentration, the mean of the blank absorption values was
subtracted from all other absorption values, and values from the
drug-treated cells were normalized to untreated cells (18). IC50 values were
calculated based on a sigmoidal dose-response curve with variable
slope of the log-transformed data.
Proliferation assay for hPDOs
The organoids were dissociated into single cells
using TrypLE (cat. no. 12604013; Thermo Fisher Scientific, Inc.)
according to the manufacturer's instructions and were dispensed
through a 40-µm cell sieve (cat. no. 542040; Greiner Bio-One),
before seeding 1,000 cells in 10 µl Matrigel/well into white
96-well plates. Oxaliplatin was added 72 h after plating, covering
a concentration range of 50–5,000 µM. After 4 h of treatment at
37°C, the medium was replaced with drug-free complete medium and 48
h after this, cell viability was assessed using the CellTiter-Glo
3D cell viability assay (Promega Corporation). Briefly, 50 µl
CellTiter Glo 3D was added to the medium of each well, after which,
the plate was placed on an orbital shaker (600 rpm) for 5 min at
room temperature and incubated for a further 25 min at room
temperature. Luminescence was measured using the FLUOstar OPTIMA
(BMG Labtech GmbH). Luminescence values were blank-corrected and
values from the drug-treated cells were normalized to untreated
cells. A four-parameter log-logistic function was fitted to the
drug response curve and IC50 values were calculated.
Evaluating total intracellular
platinum concentrations
Sample preparation
To evaluate the resulting intracellular platinum
concentrations after drug exposure, 1×10⁶ cells (AsPC-1
and BxPC-3) were seeded into each well of 6-well plates and
cultured for 24 h at 37°C and 5% CO2. Subsequently, the
cells were exposed to various concentrations of oxaliplatin or
cisplatin (5, 10, 50, 100 and 1,000 µM) for 4 h at 37°C; after
which, the drug-containing medium was removed and the cells were
washed thoroughly with PBS. HNO3 (0.4%; 150 µl) in
distilled water was then added for cell lysis and the cells were
scraped from the bottom of the well. The lysate was transferred
into a tube and sonicated (35 kHz) for 30 min at room temperature,
followed by centrifugation at 17,000 × g for 3 min at room
temperature. The supernatant above the debris pellet was
transferred into a new tube and stored at −20°C until further
analysis.
Drug uptake into hPDOs was evaluated similarly.
After seeding 2×10⁵ cells into the wells of 24-well
plates, drug treatment, lysis, sonication and centrifugation were
performed as aforementioned, and the supernatants were stored at
−20°C until platinum concentrations were analyzed.
Graphite furnace atomic absorption
spectrometry
The platinum concentration of the lysates (obtained
from cell lines and hPDOs) was analyzed with a PinAAcle 900Z
graphite furnace atomic absorption spectrometer (PerkinElmer,
Inc.). The samples were loaded into the sample cups of the
autosampler, which injected 20 µl each sample into the graphite
furnace. The furnace protocol consisted of 30 sec at 110°C, 30 sec
at 130°C, 20 sec at 1,300°C, 5 sec at 2,200°C and 3 sec at 2,450°C.
The platinum absorbance was measured at 265.94 nm. For the
calibration curve, six concentrations (25, 50, 100, 500, 1,000 and
5,000 µg/l) were aliquoted by the autosampler from respective stock
solutions. To demonstrate the accuracy of the method, three samples
for quality control (QC) were prepared by spiking 0.4%
HNO3 with the respective volume of platinum stock
solution, leading to QC samples within the low, mid and high range
of the calibration curve.
BCA assay
The protein concentration of all samples was
evaluated using the Pierce BCA Protein Assay Kit (Thermo Fisher
Scientific, Inc.). For the calibration curve, standard samples of
bovine serum albumin (provided in the kit) in 0.1% HNO3
at concentrations of 0, 25, 125, 250, 500, 750, 1,000, 1,500 and
2,000 µg/ml were prepared and the absorption was measured at 562
nm. The cell lysate samples were analyzed accordingly and the
protein concentration was determined from the absorption via the
linear equation of the calibration curve. The measured platinum
concentrations of the lysates were normalized to the protein
concentration of the lysates, eventually representing the total
intracellular platinum concentration.
Validation of platinum drug
uptake
The intracellular platinum concentration was plotted
over the extracellular concentration for the two PDAC cell lines. A
simple linear regression was used to determine an equation
describing the uptake of each cell line treated with either
cisplatin or oxaliplatin. The regression line was used to determine
the necessary extracellular concentration that leads to the same
intracellular platinum concentration in all cells. The uptake was
validated by exposing the cells to these concentrations and
analyzing the intracellular concentration again.
Caspase 3/7 assay
The enzyme activity of caspase 3/7 was analyzed at
0, 4, 8, 12, 18, 24 and 48 h after the 4-h treatment of PDAC cell
lines at 37°C with drug concentrations (AsPC-1: 150 µM cisplatin or
176 µM oxaliplatin; BxPC-3: 65 µM cisplatin or 150 µM oxaliplatin)
known to result in identical total intracellular platinum
concentrations using the Caspase-Glo® 3/7 kit (cat. no.
G8091; Promega Corporation). Caspase 3/7 activity was additionally
recorded in AsPC-1 cells 36 h after treatment. Briefly,
1.5×10³ cells/well were seeded into white 96-well plates
with a clear bottom and maintained at 37°C and 5% CO2
overnight for adherence. After the 4-h drug treatment, the
drug-containing medium was discarded and replaced with 50 µl fresh
medium. At each time point, 50 µl of the Caspase-Glo reaction
reagent was added to the wells, the plate was shaken for 30 sec and
was subsequently incubated for 30 min at room temperature. The
luminescence of each well was analyzed using the SpectraMax iD3
Multi-Mode Microplate Reader. The luminescence values were
normalized to the untreated control at each time point.
Treatment-related transcriptomic
changes in PDAC cell lines
To record the transcriptional changes in PDAC cell
lines upon identical total intracellular platinum challenge, a
high-throughput reverse transcription-quantitative PCR (RT-qPCR)
analysis was performed according to our previously published
protocol using a Standard BioTools Inc. dynamic array on a BioMark™
system (19,20). After RNA isolation using the
NucleoSpin® RNA Plus Kit (Machery-Nagel GmbH), 1 µg
total RNA was reverse transcribed into cDNA with the qScript™ cDNA
Synthesis Kit (Quantabio) according to the manufacturer's
instructions. Specific target gene amplification was performed to
obtain sufficient amounts of templates of the target genes for the
subsequent high-throughput qPCR, followed by enzymatic digestion
with Escherichia coli exonuclease I (New England BioLabs,
Inc.) to remove unincorporated primers and dNTPs. For
high-throughput qPCR, samples and primers [sequences of which are
provided in a previous study (19)]
were loaded onto a 96.96 Dynamic Array Integrated Fluidic Circuit
(Standard BioTools Inc.), which was transferred into the BioMark HD
System (Standard BioTools Inc.). qPCR (initial denaturation step at
95°C for 10 min, followed by 12 cycles of 15 sec at 95°C for
denaturation, 4 min at 60°C for annealing and elongation, and a
final holding temperature of 4°C) and melting curve analyses were
performed as described previously (19). Evaluation and data analysis were
performed with GenEx software (version 5.3.6.170; MultiD Analyses
AB). For normalization, five reference genes were used [β-actin,
β2-microglobulin (β2MG), glyceraldehyde-3-phosphate
dehydrogenase, glucuronidase-β (GUSB) and hypoxanthine
phosphoribosyltransferase 1]. Changes in the transcript levels of
the target genes were displayed as fold change compared with the
untreated control group by calculating relative quantities
corresponding to the ΔΔCq method (21). The alterations in gene expression
are shown as log2-fold changes with a value of 0 for the untreated
control. This depiction was chosen as it enables a clear
presentation of both induction (with the value 1 for two-fold
enhancement) and repression (with the value-1 for reduction to 50%)
of transcription.
Evaluating drug transporter expression
levels in PDAC cell lines using RT-qPCR
Total RNA was isolated from untreated As-PC1 and
Bx-PC3 cells using the GeneElute Mammalian Total RNA Miniprep Kit
(Sigma-Aldrich; Merck KGaA) according to the manufacturer's
instructions. cDNA was synthesized from total RNA using the
RevertAid™ H Minus First Strand cDNA Synthesis Kit (Thermo Fisher
Scientific, Inc.) according to the manufacturer's instructions. A
random hexamer primer was used according to the manufacturer's
instructions. The mRNA expression levels of ABCC2, ATP7A, ATP7B,
SLC22A1, SLC22A2, SLC22A3 and SCL31A1 were quantified by
qPCR [initial denaturation step at 95°C for 15 min, followed by 40
cycles of 15 sec at 95°C for strand melting, 30 sec at variable
temperatures (see Table I) for
primer annealing and 30 sec at 72°C for elongation, followed by a
melting curve analysis of 5 sec at 95°C, 60 sec at 70°C and 5 sec
at 95°C using a LightCycler® 480 (Roche Applied Science)
and the Quantifast SYBR Green Master mix (Qiagen GmbH) as described
previously (22,23). The quantification of SLC22A1
was performed using the Quantitect Hs_SLC22A1 kit (Qiagen GmbH).
All other primer sequences were used as published previously
(23,24) (Table
I). Among a set of six housekeeping genes tested,
glucose-6-phosphate-dehydrogenase, GUSB and β2MG were
used for normalization. This approach minimizes the potential bias
from correcting target gene expression levels to only one
housekeeping gene (25).
Accordingly, the Roche LightCycler 480 software determined the
geometric mean Cq value of the three housekeeping genes by
calculating the third root of [1st housekeeping gene × 2nd
housekeeping gene × 3rd housekeeping gene], and the normalized
expression level of the target gene was subsequently computed in
line with the ΔCq method including an efficiency correction. Taken
together, the data were analyzed as described previously (22). Three independent biological
replicates with technical duplicates were performed for
RT-qPCR.
 | Table I.Primer sequences. |
Table I.
Primer sequences.
| Gene | Forward primer
sequence, 5′-3′ | Reverse primer
sequence, 5′-3′ | Primer annealing
temperature, °C |
|---|
| ABCC2 |
ACAGAGGCTGGTGGCAACC |
ACCATTACCTTGTCACTGTCCATGA | 57 |
| ATP7A |
ATGATGAGCTGTGTGGCTTG |
TGCCAACCTGAGAAGCAATAG | 60 |
| ATP7B |
TACCCATTGCAGCAGGTGTC |
ACTTGAGCTGCAGGGATGAG | 57 |
| SLC31A1 |
AGCTGGAGAAATGGCTGGAG |
AGGTGAGGAAAGCTCAGCATC | 63 |
| SLC22A2 |
TCTACTCTGCCCTGGTTGAATTC |
ATGCAGCCCAAGGGTAACG | 57 |
| SLC22A3 |
GGAGTTTCGCTCTGTTCAGG |
GGAATGTGGACTGCCAAGTT | 55 |
| β2mg |
CCAGCAGAGAATGGAAAGTC |
CATGTCTCGATCCCACTTAAC | 61 |
| G6PDH |
ATCGACCACTACCTGGGCAA |
TCTGCATCACGTCCCGGA | 61 |
| GUSB |
TTCACCAGGATCCACCTCTG |
AGCACTCTCGTCGGTGACTG | 61 |
RNA sequencing (RNAseq) data
evaluation of hPDOs
RNA isolation, RT to cDNA, preparation of sequencing
libraries and sequencing were performed as described previously
(17). Briefly, total RNA was
extracted from snap-frozen hPDO pellets using the AllPrep
DNA/RNA/miRNA Universal Kit (Qiagen GmbH) and mRNA was purified
using oligo(dT) beads. Poly(A)+ RNA was fragmented to 150 bp and
converted to cDNA, which was end-repaired, adenylated on the 3-end,
adapter-ligated and amplified with 15 cycles of PCR. Sequencing
libraries were prepared using the Illumina TruSeq mRNA stranded kit
(Illumina, Inc.) according the manufacturer's instructions. The
final libraries were validated using Qubit (Invitrogen; Thermo
Fisher Scientific, Inc.) and Tapetstation (Agilent Technologies,
Inc.). Finally, 2×100 bp paired-end sequencing was performed on the
Illumina NovaSeq 6000 (Illumina, Inc.) according to the
manufacturer's protocol. At least 54 Mio reads per sample were
generated.
Statistical analysis
Statistical analysis and generation of all figures
were performed using GraphPad Prism 9 software (Version 9.0.0;
Dotmatics). Differences between IC50 values [presented
as the mean ± SD of four (cell lines) or three (hPDOs) independent
experiments] were evaluated by unpaired Student's t-test. The
statistical significance between the mean total intracellular
platinum levels of the cell lines (treated with oxaliplatin or
cisplatin) and the respective single experiments (AsPC-1 treated
with 150 µM cisplatin; AsPC-1 treated with 176 µM oxaliplatin;
BxPC-3 treated with 65 µM cisplatin; BxPC-3 treated with 150 µM
oxaliplatin; presented as the mean ± SD of four to five independent
experiments) was evaluated by non-parametric Kruskal-Wallis test
and Dunn's post-hoc test, controlling for multiple testing.
Differences in gene expression levels between drug-treated cell
lines (presented as the mean ± SD of three independent experiments)
were evaluated by a two-way ANOVA with Sidak's post-hoc test.
P<0.05 was considered to indicate a statistically significant
difference.
Results
Anti-proliferative pharmacodynamics of
oxaliplatin
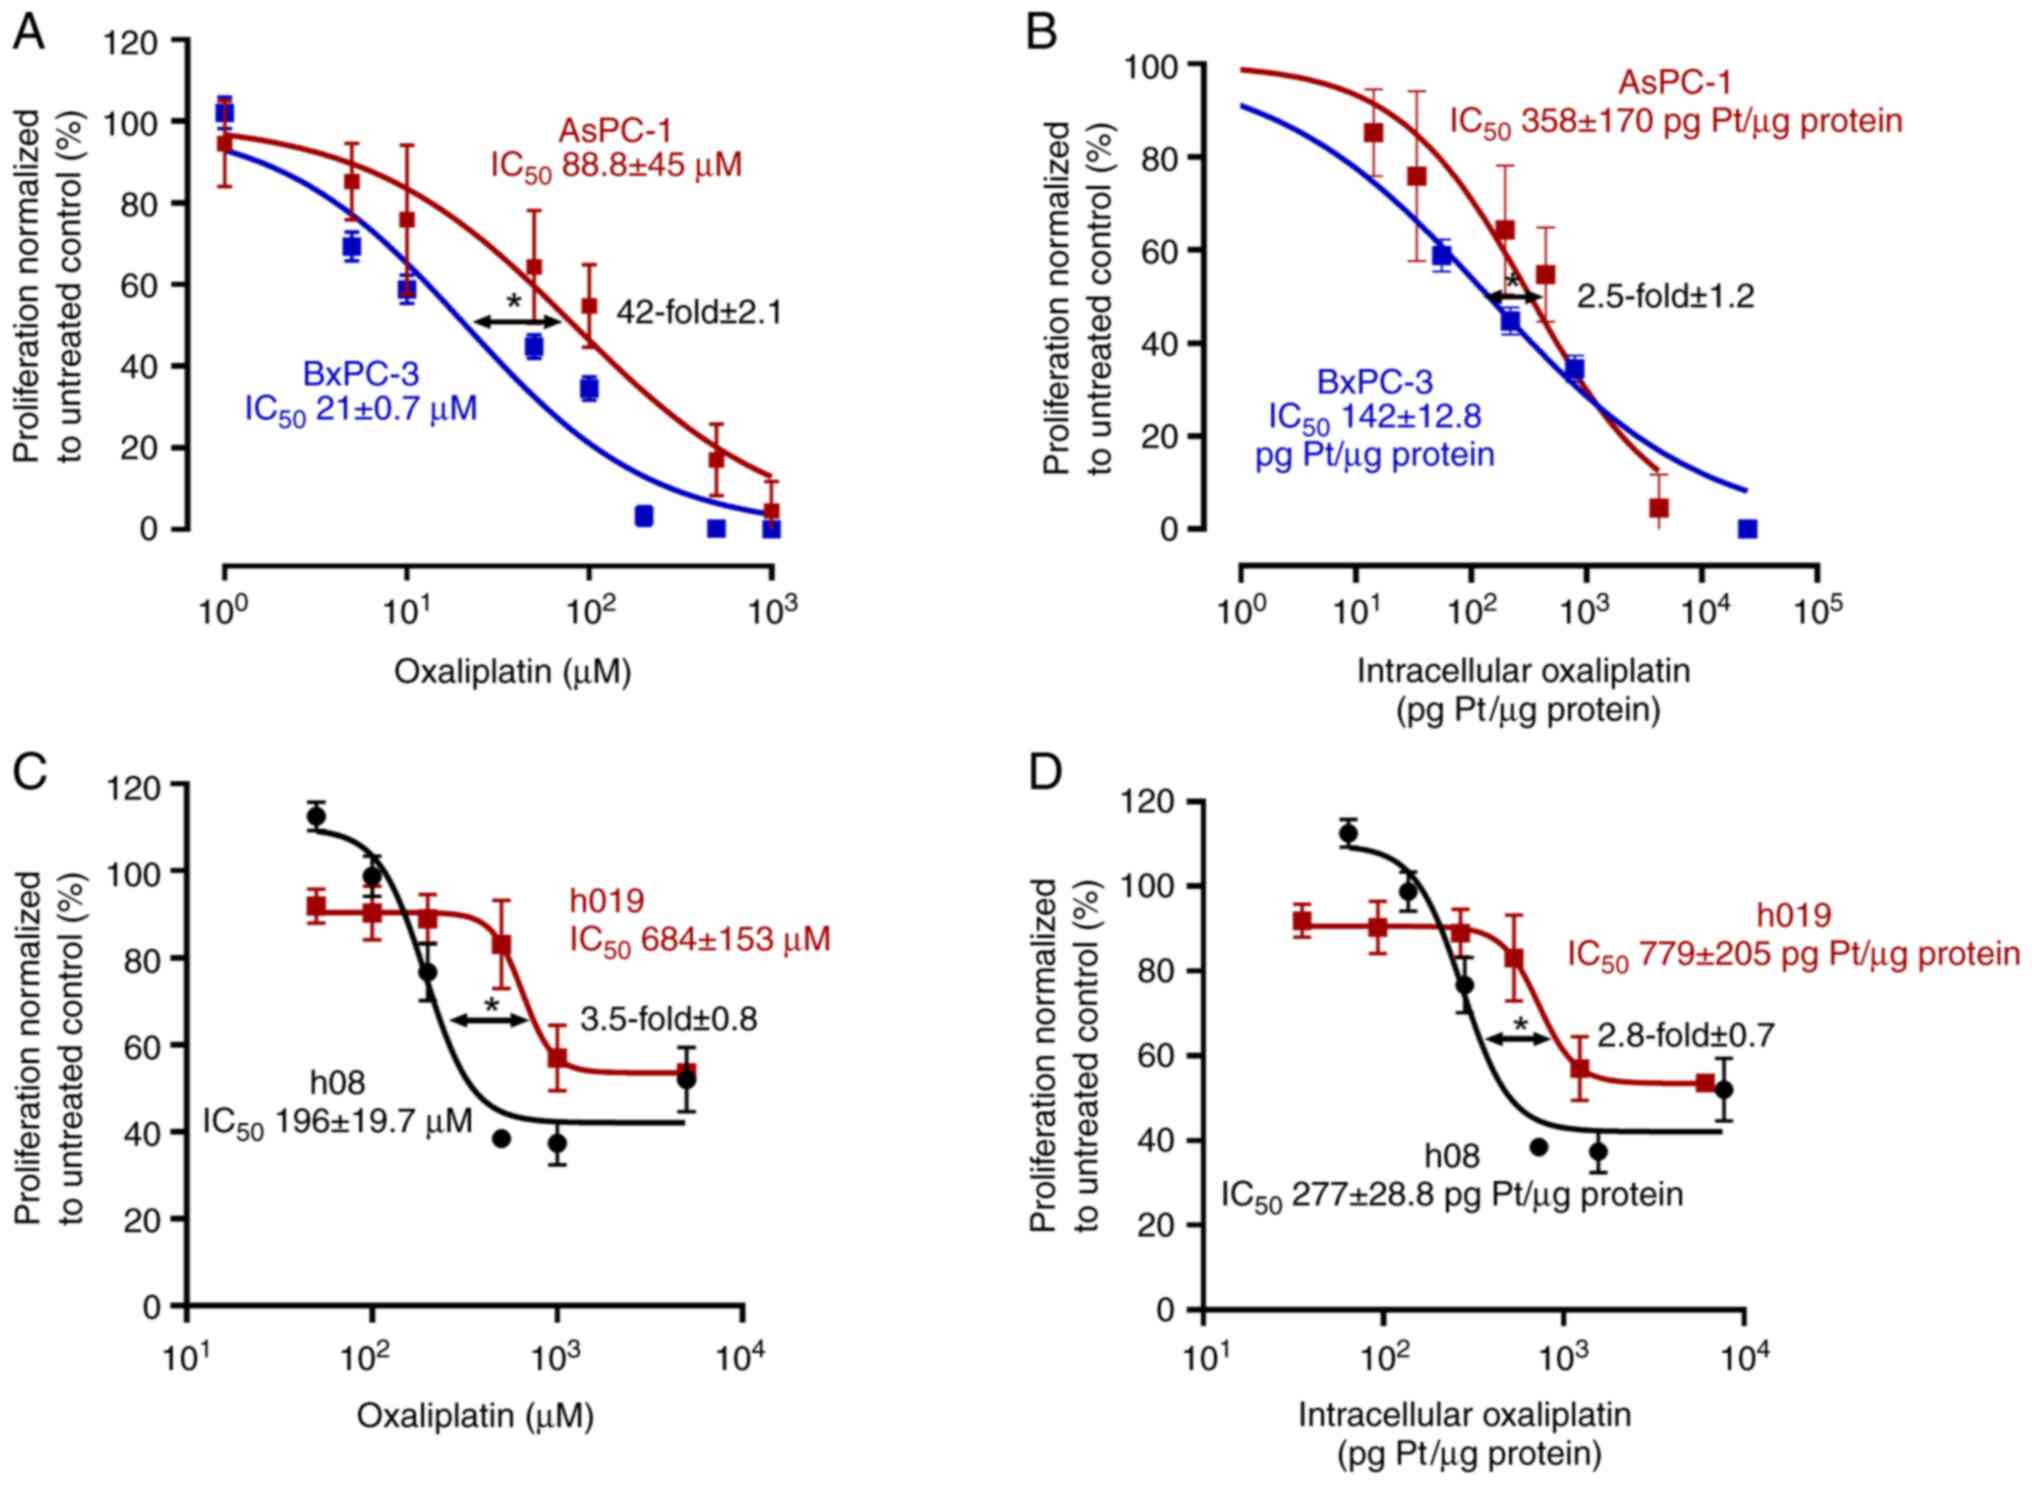
First, the anti-proliferative pharmacodynamics of
oxaliplatin were evaluated in the cell lines (Fig. 1A and B). The IC50 of
oxaliplatin in AsPC-1 cells was 88.8±45 µM, whereas it was 21±0.7
µM in BxPC-3 cells (P=0.02). Accordingly, AsPC-1 cells were
4.2-fold (±2.1) more oxaliplatin resistant than BxPC-3 cells.
However, when anti-proliferative effects were normalized to total
intracellular platinum levels, AsPC-1 cells (IC50,
358±170 pg Pt/µg protein) remained 2.5-fold (±1.2) more resistant
to oxaliplatin than BxPC-3 cells (IC50, 142±12.8 pg
Pt/µg protein; P=0.04), a non-significant decrease of resistance by
40% (P=0.21).
Second, the effects of oxaliplatin were tested on
hPDOs (Fig. 1C and D). The
IC50 of oxaliplatin in h19 cells was 684±153 µM, where
it was 196±19.7 µM for h08 (P<0.029). Therefore, h19 was
3.5-fold (±0.8) more resistant to oxaliplatin than h08. After
normalizing the anti-proliferative effects to total intracellular
platinum levels, h19 (IC50 779±205 pg Pt/µg protein)
remained 2.8-fold (±0.7) more resistant than h08 (IC50,
277±28.8 pg Pt/µg protein; P=0.04), a non-significant decrease of
resistance by 20% (P=0.34).
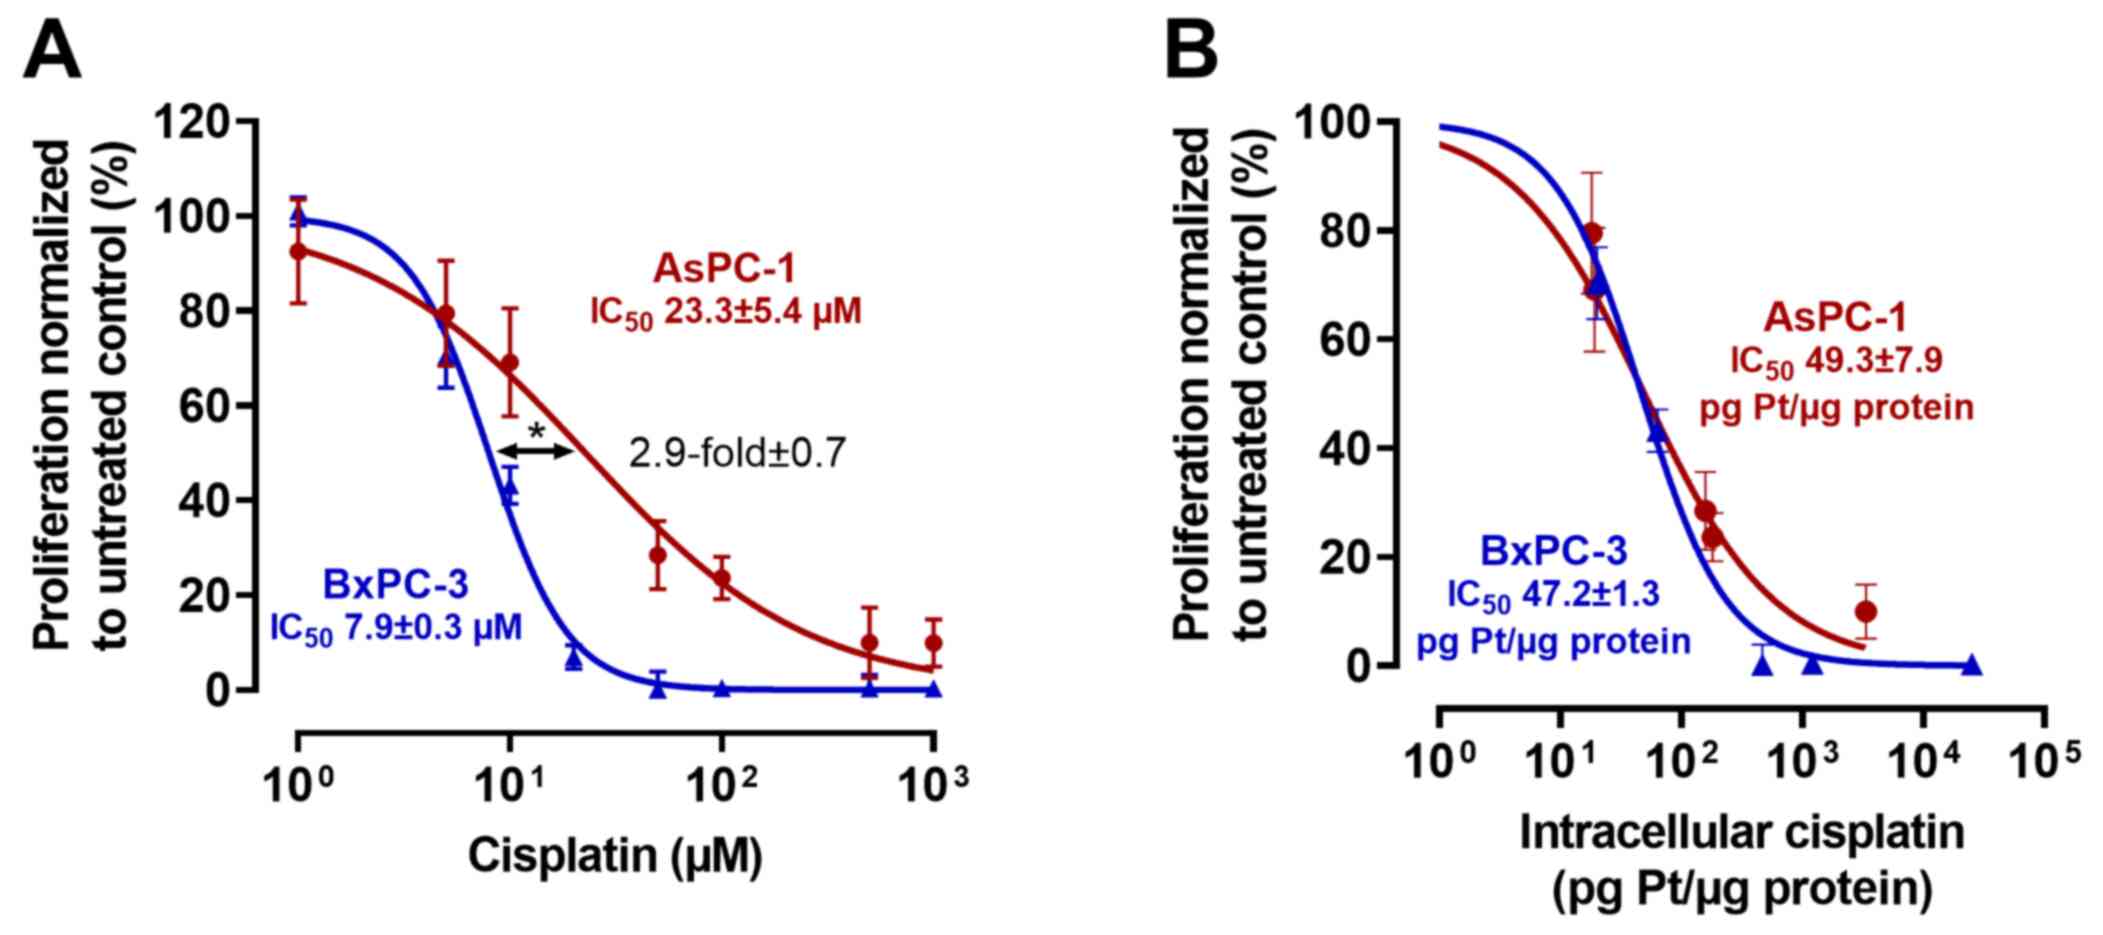
To test for plausibility, the cell line experiments
were repeated with cisplatin as a control drug (Fig. 2). The IC50 of cisplatin
in AsPC-1 cells was 23.3±5.4 µM, whereas it was 7.9±0.3 µM in
BxPC-3 cells (P<0.0013), a nominal resistance difference of
2.9-fold (±0.7). After normalization to total intracellular
platinum levels, IC50 values were very similar (AsPC-1
IC50, 49.3±7.9 pg Pt/µg protein; BxPC-3 IC50,
47.2±1.3 pg Pt/µg protein), indicating a major role of drug uptake
for cisplatin resistance.
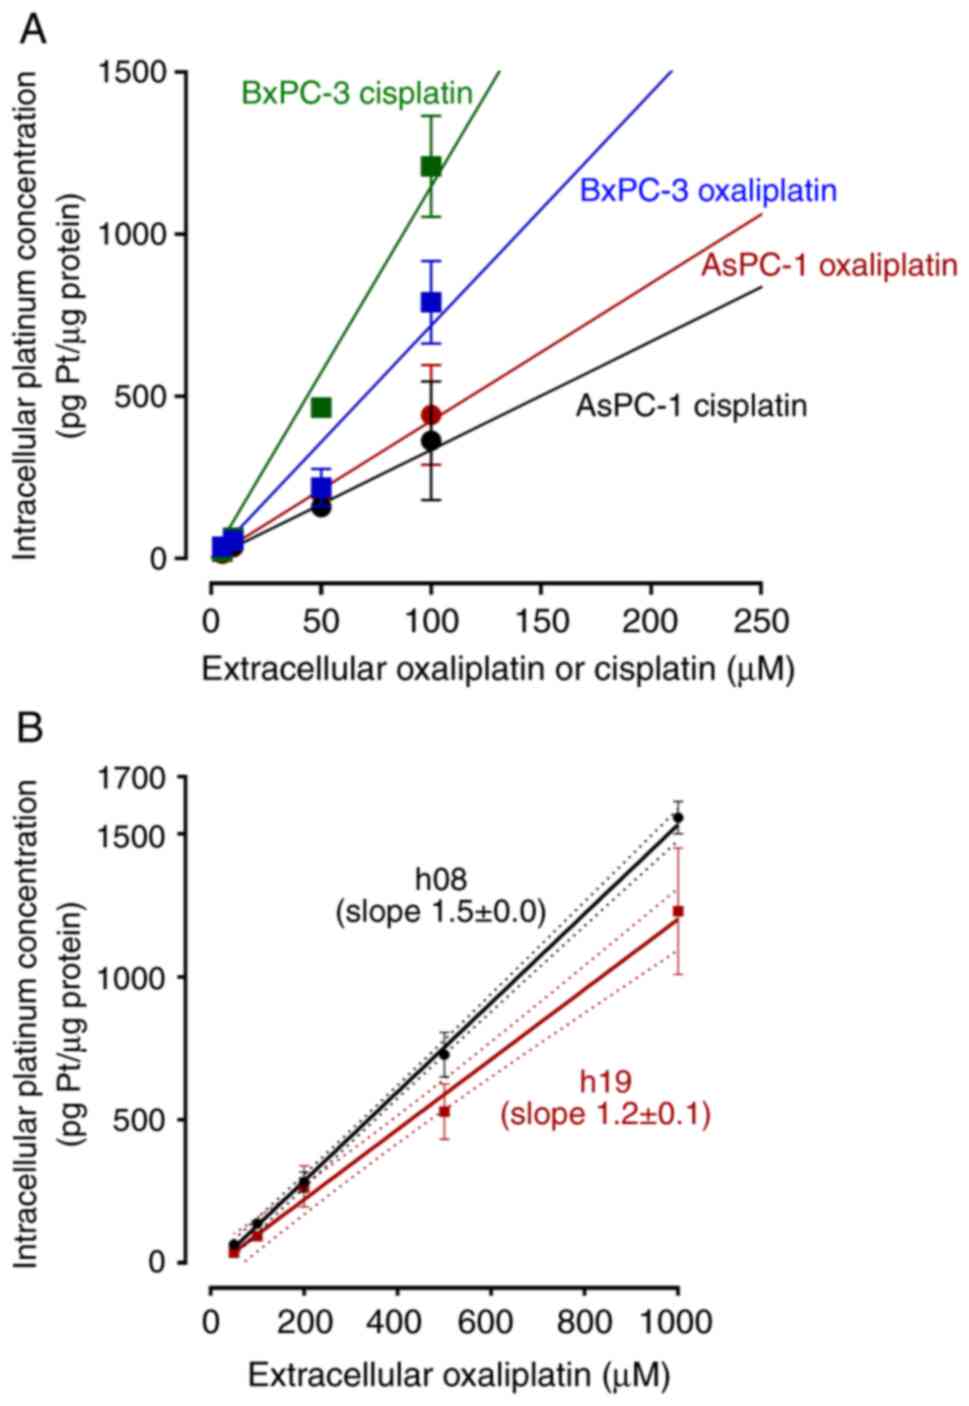
Drug uptake
Drug uptake was calculated for two reasons. First,
to again evaluate uptake characteristics. Second, to deduce
extracellular concentrations that are needed to achieve the same
intracellular drug concentrations during subsequent experiments. In
the PDAC cell lines, uptake of oxaliplatin or cisplatin varied
between the drugs and cell lines, as reflected by different slopes
of the linear regression curves (Fig.
3A). In the hPDOs (Fig. 3B),
the slopes for oxaliplatin uptake were significantly different
(h08, slope 1.5±0.0; h19, slope 1.2±0.1; P=0.0003). By calculating
the area-under-the-line, oxaliplatin uptake into h19 was 22% less
than that into h08.
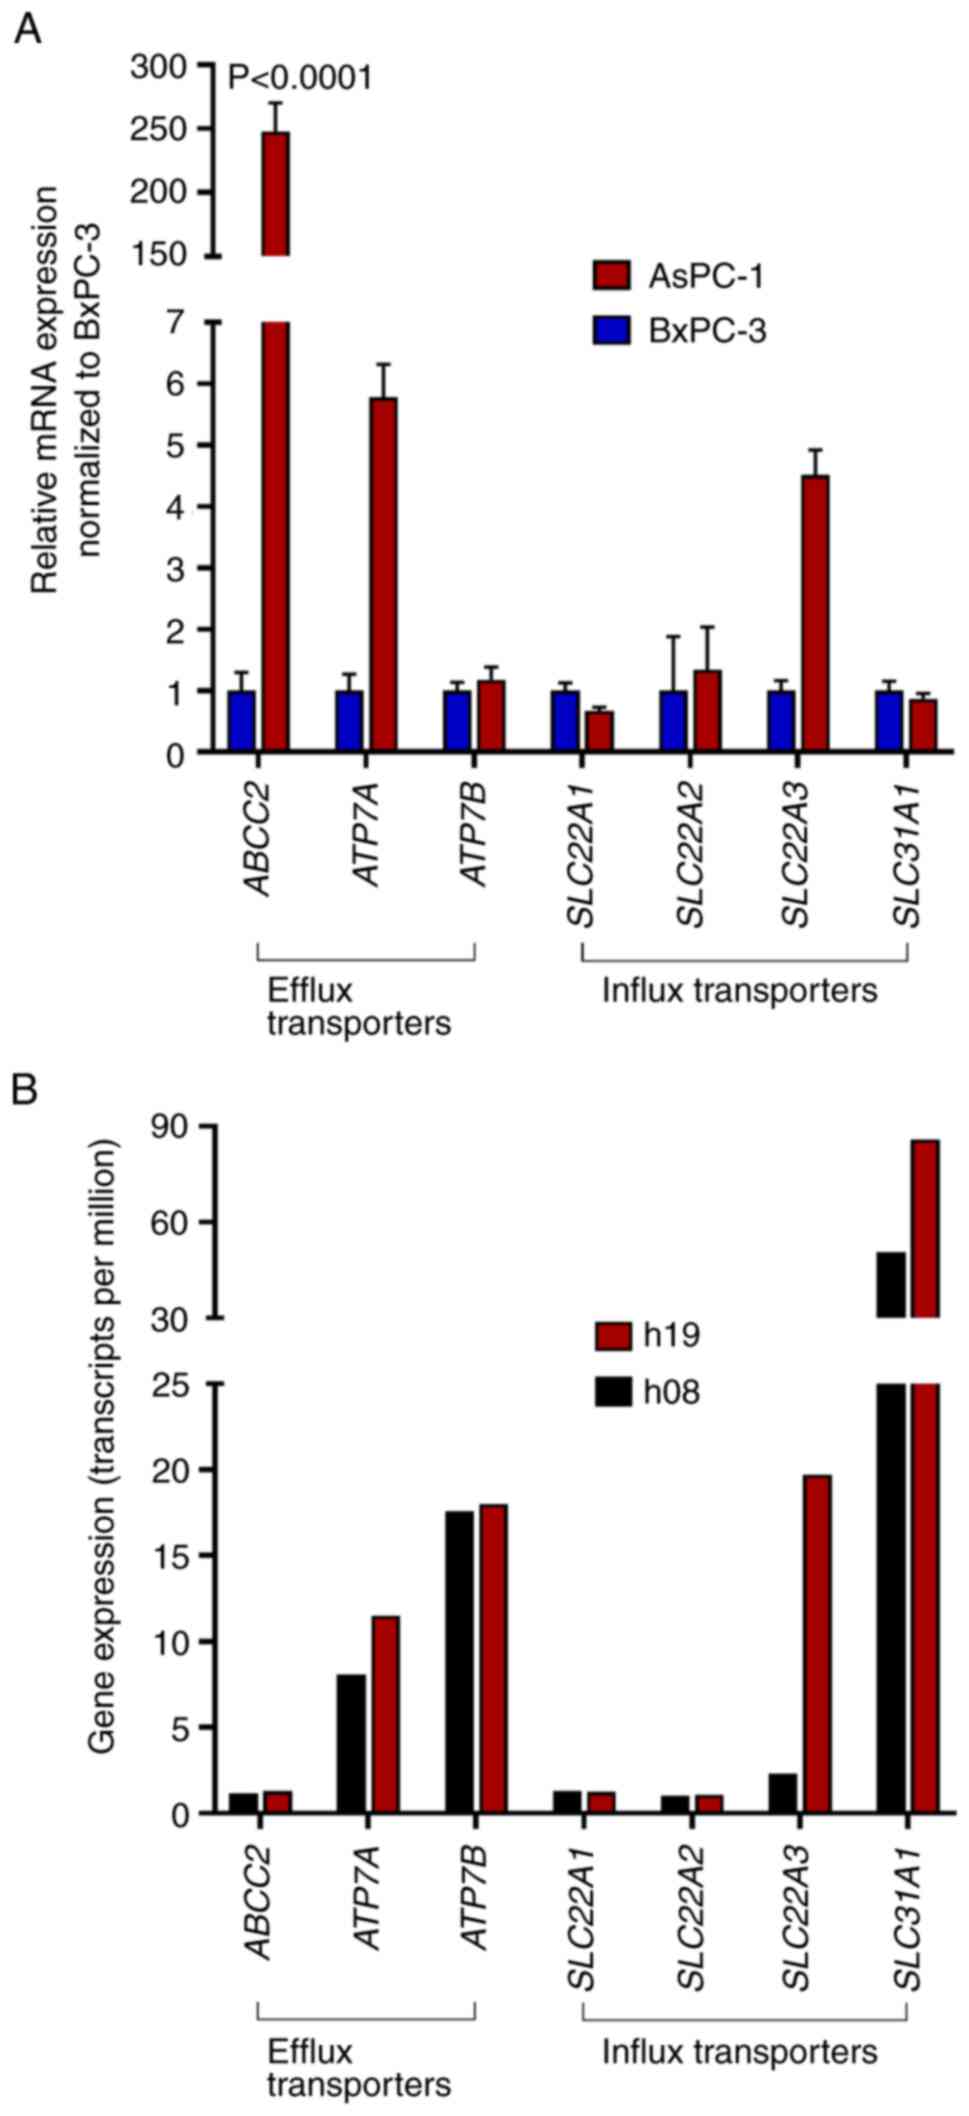
The mRNA expression levels of major platinum drug
transporters were evaluated by PCR (cell lines) or were extracted
from RNAseq data (hPDOs) (Fig. 4).
Compared with in BxPC-3 cells, AsPC-1 cells expressed significantly
higher levels of ABCC2 (248±22-fold; P<0.0001).
ATP7A (5.77±0.5-fold) and SLC22A3 (4.5±0.4-fold) were
also enhanced but the differences did not reach statistical
significance (P>0.94). In the two hPDOs, there were also only
minor differences in expression levels of platinum drug
transporters, with one exception; SLC22A3 was more highly
expressed in h19 (19.7 transcripts per million) than in h08 (2.3
transcripts per million).
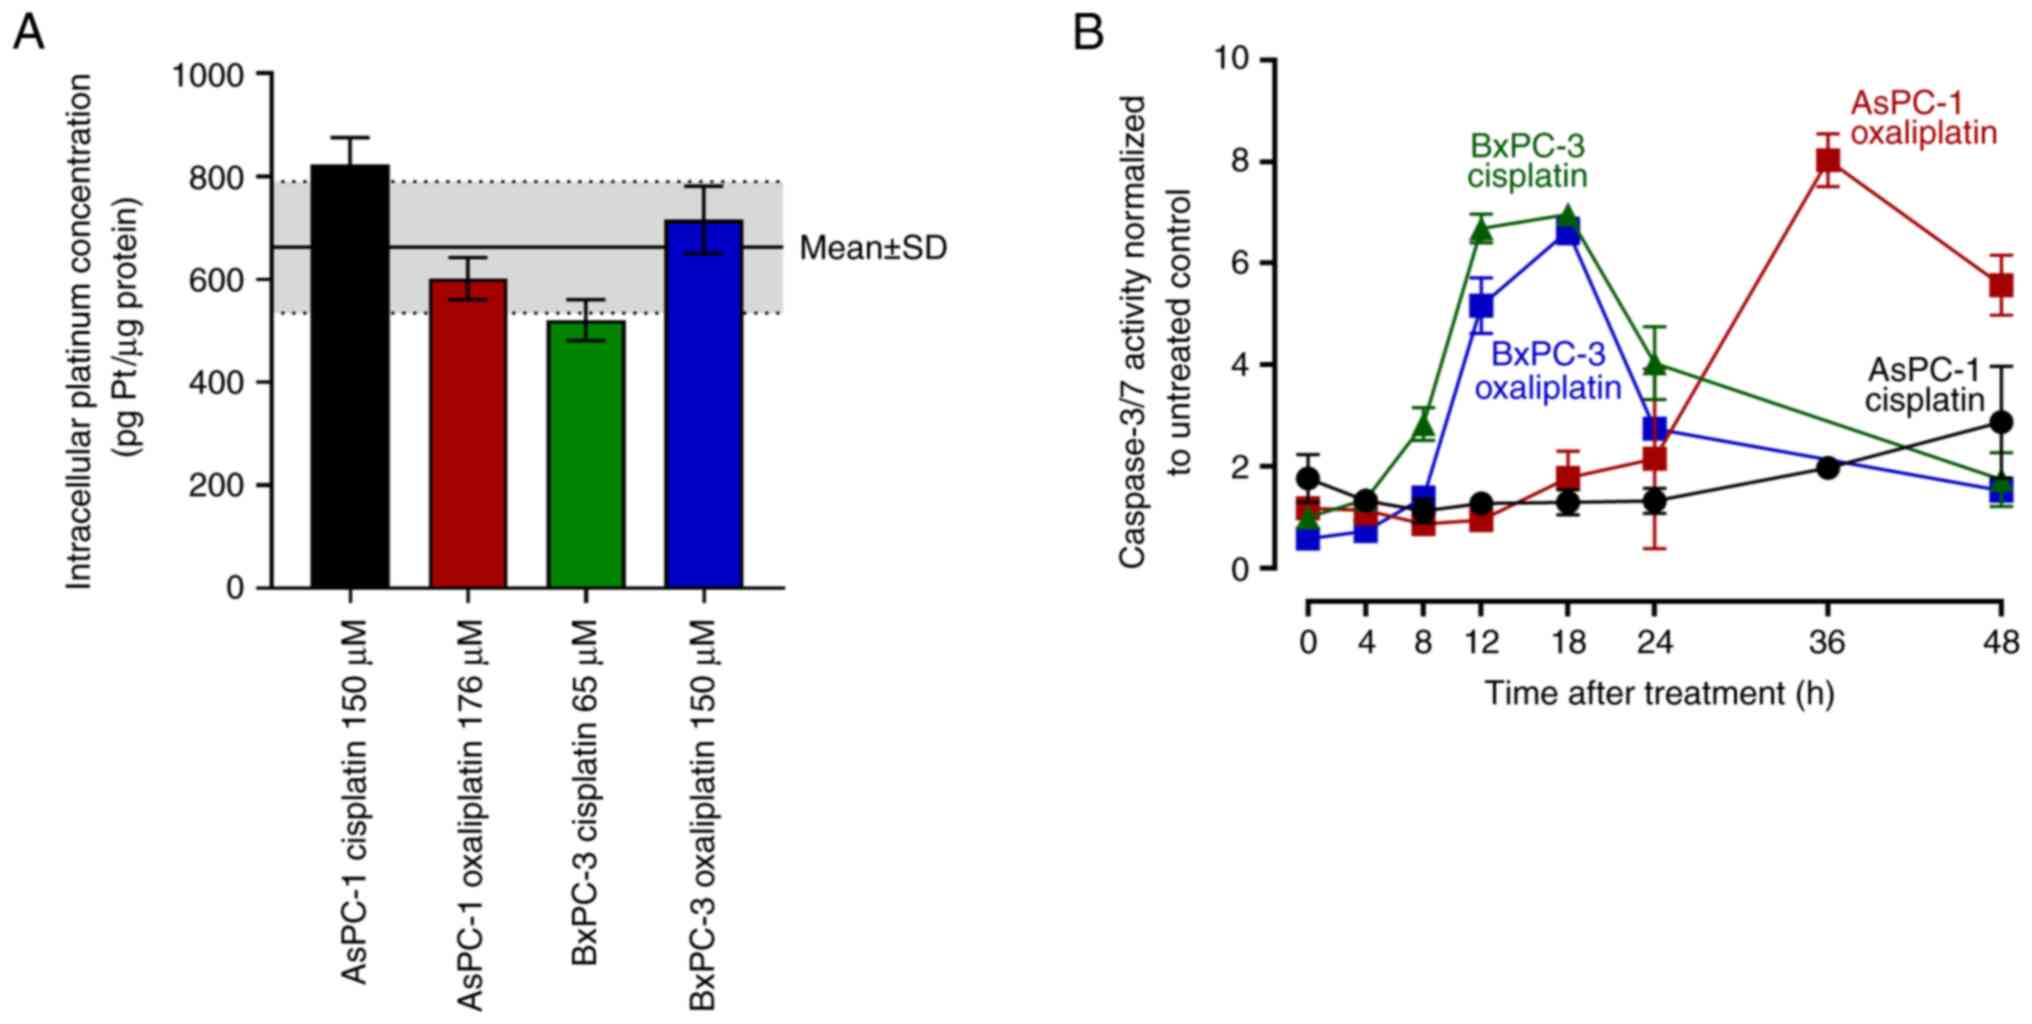
Caspase 3/7 assay
To assess caspase 3/7 activity in response to
similar intracellular drug exposure, AsPC-1 cells were treated for
4 h with 150 µM cisplatin or 176 µM oxaliplatin, whereas BxPC-3
cells were treated with 65 µM cisplatin or 150 µM oxaliplatin.
These treatments led to a mean total intracellular platinum
concentration of 662±128 pg Pt/µg protein, with no statistical
difference between any of the single experiments (Fig. 5A). Caspase 3/7 activity in BxPC-3
cells set in as early as 12 h post-treatment and peaked at 18 h
(7-fold higher compared with the untreated control) without
relevant differences between cells treated with oxaliplatin and
cisplatin. By contrast, caspase 3/7 activity in AsPC-1 cells peaked
36 h after the end of oxaliplatin treatment (8-fold higher compared
with the untreated control), whereas cisplatin treatment only
weakly increased caspase 3/7 activity in AsPC-1 cells (3-fold 48 h
post-treatment) (Fig. 5B).
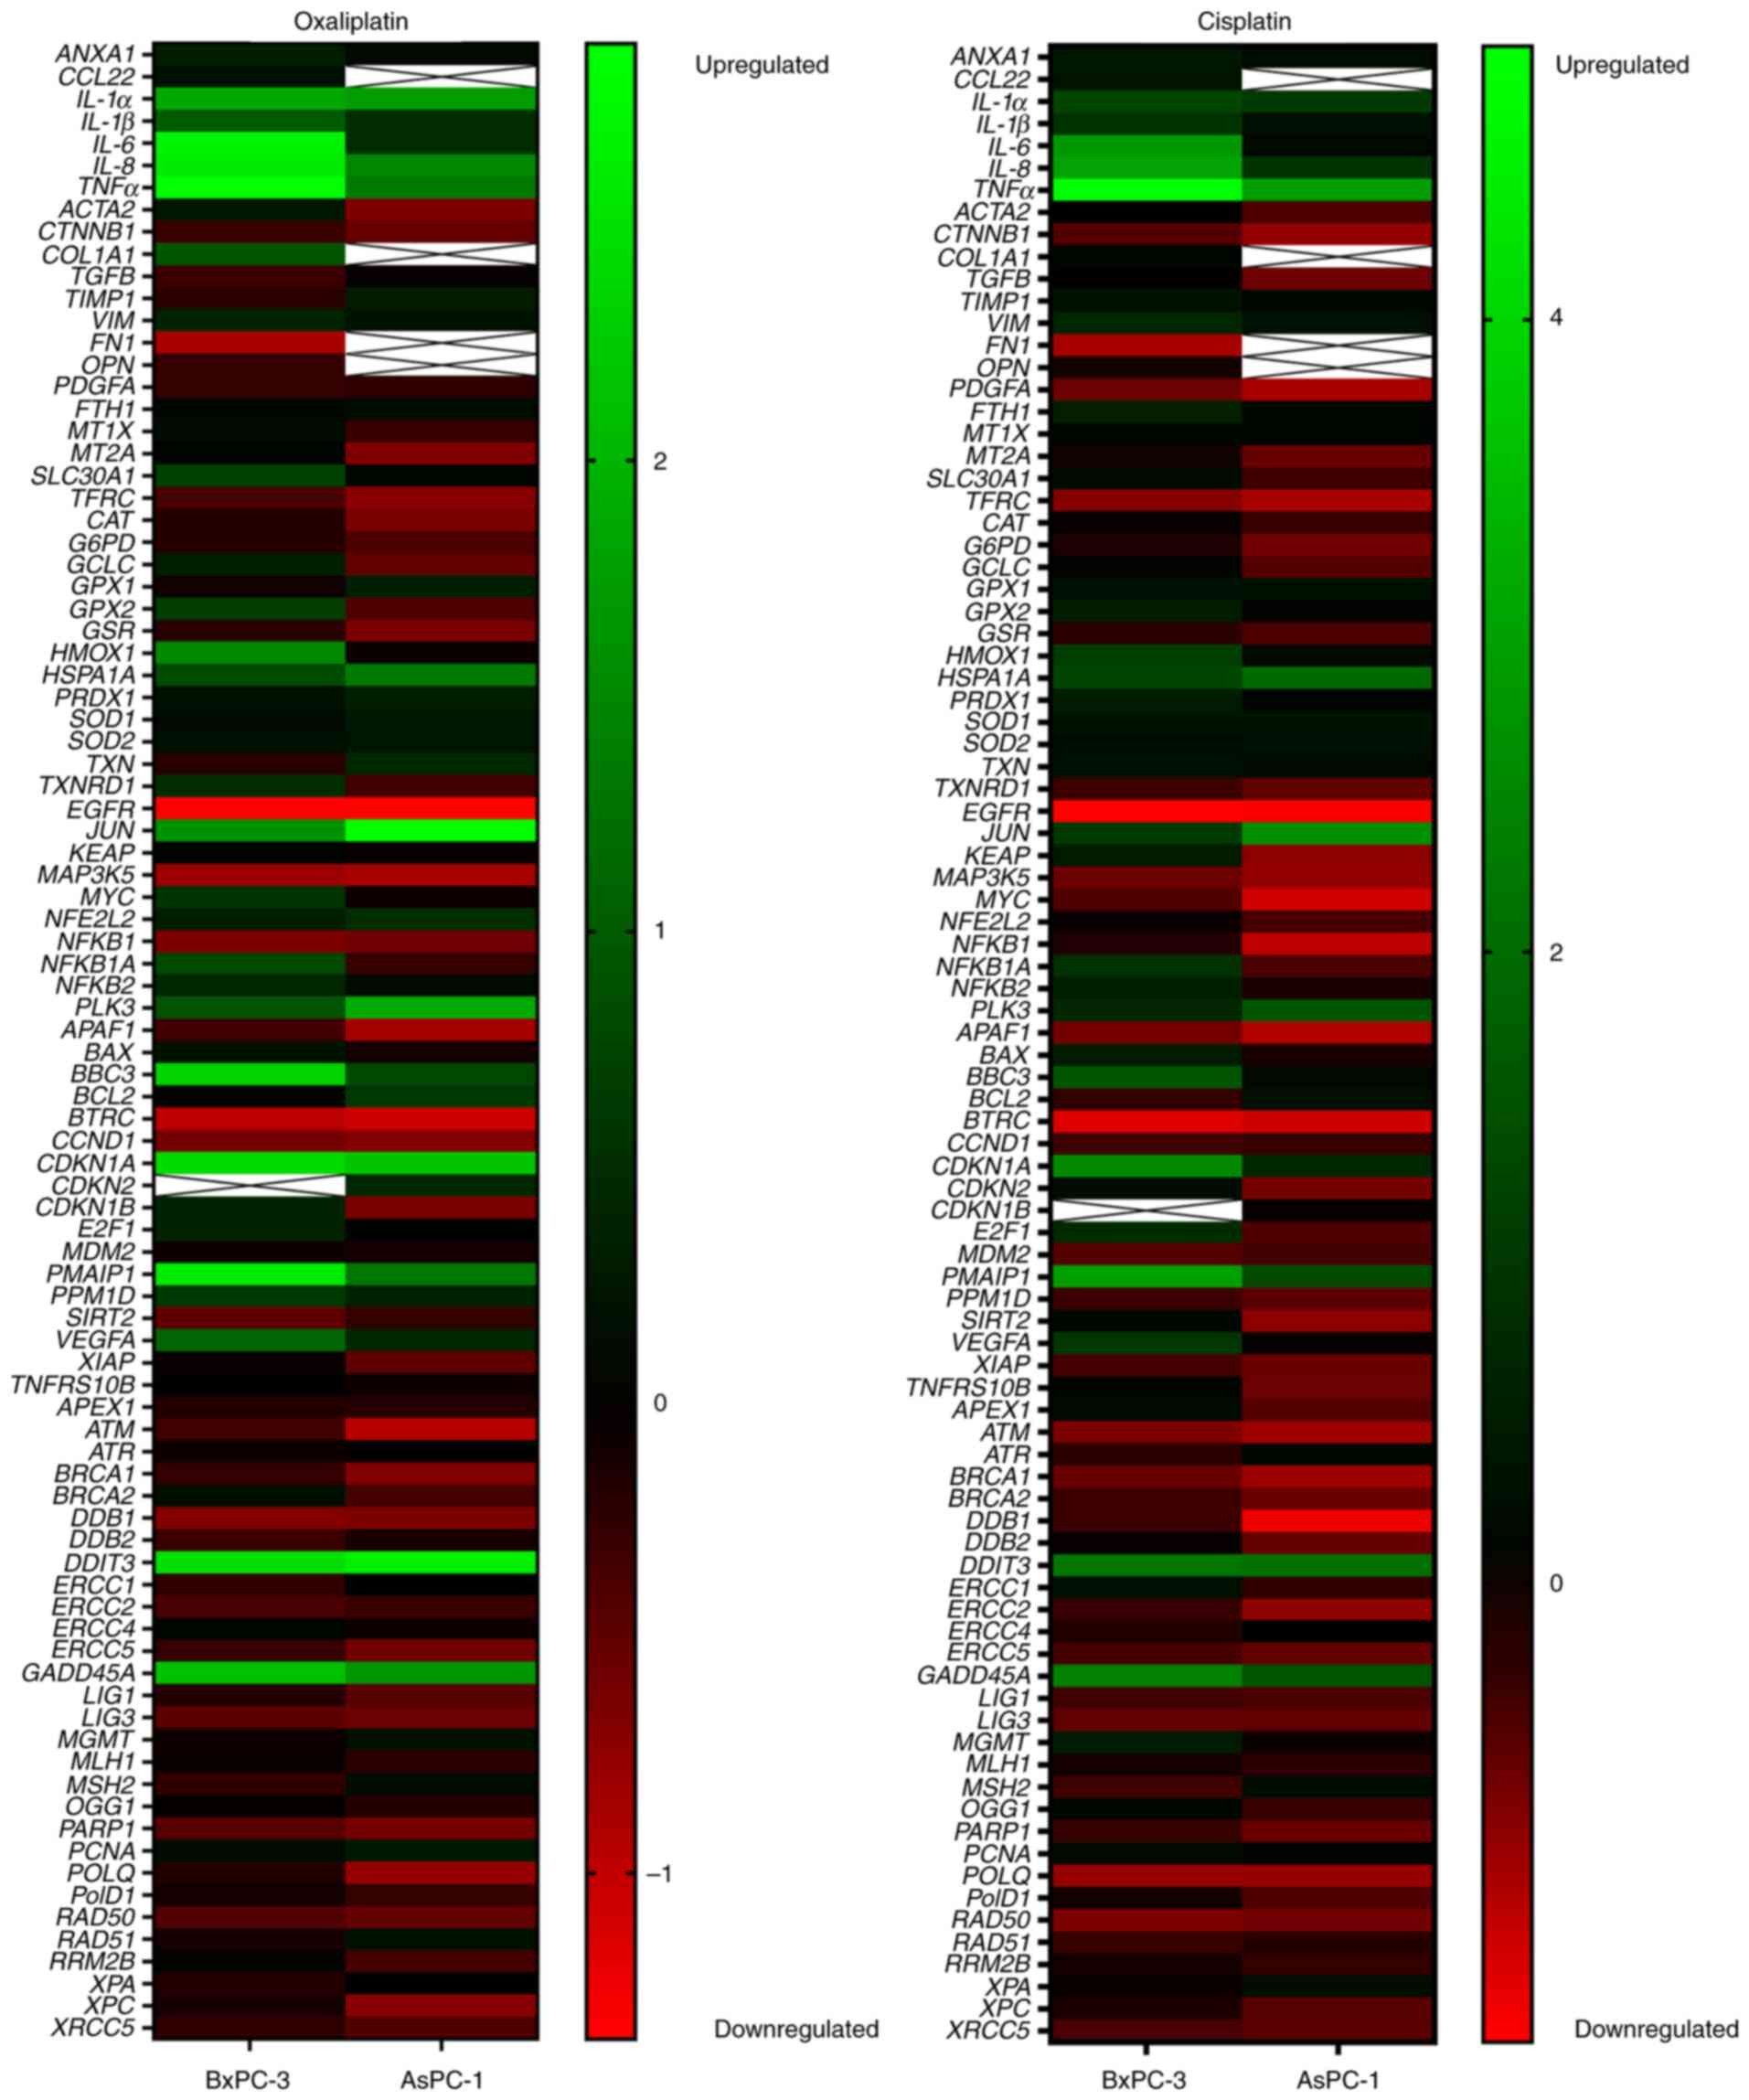
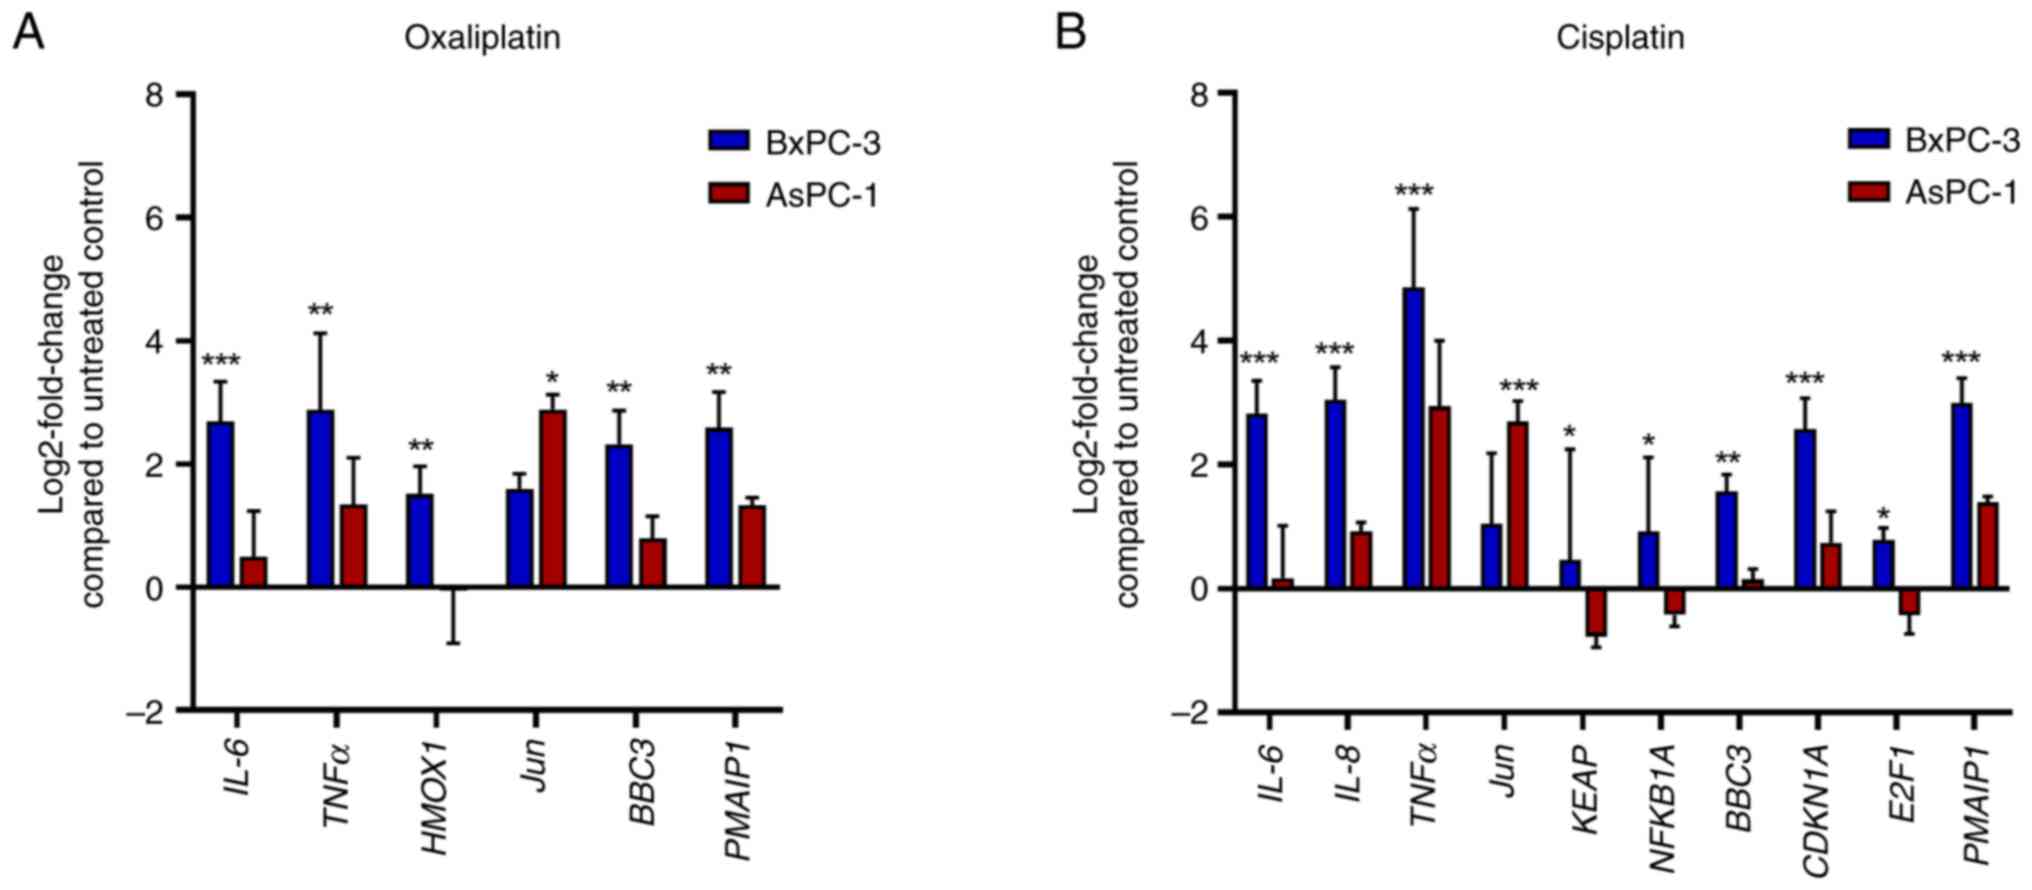
Transcriptomics analysis of the
response of PDAC cell lines to a cytotoxic threat
Cell lines were also screened for transcriptomic
responses after exposure to the same intracellular drug levels as
aforementioned. Treatment with oxaliplatin significantly enhanced
the expression levels of genes implicated in inflammation.
IL-6 and TNFα were enhanced up to 2.5-fold in AsPC-1
cells and up to 7-fold in BxPC-3 cells (Figs. 6 and 7). Compared with in BxPC-3 cells,
oxaliplatin treatment of AsPC-1 cells had a significantly weaker
inducing effect on the pro-apoptotic BBC3 (1.7-fold vs.
5-fold) and PMAIP1 (2.5-fold vs. 6-fold), but a
significantly stronger enhancing effect on the anti-apoptotic
Jun (7-fold vs. 3-fold). Cisplatin (control drug) again
enhanced IL-6 (7-fold) and TNFα (29-fold) in BxPC-3
cells, whereas IL-6 (1.12-fold) and TNFα (7.6-fold)
inductions were rather weak in AsPC-1 cells. BBC3 (1.1-fold
vs. 3-fold) and PMAIP1 (2.6-fold vs. 8-fold) were also more
weakly induced in AsPC-1 cells than in BxPC-3 cells, and Jun
was more strongly enhanced in AsPC-1 cells (6.5-fold) than in
BxPC-3 cells (2-fold).
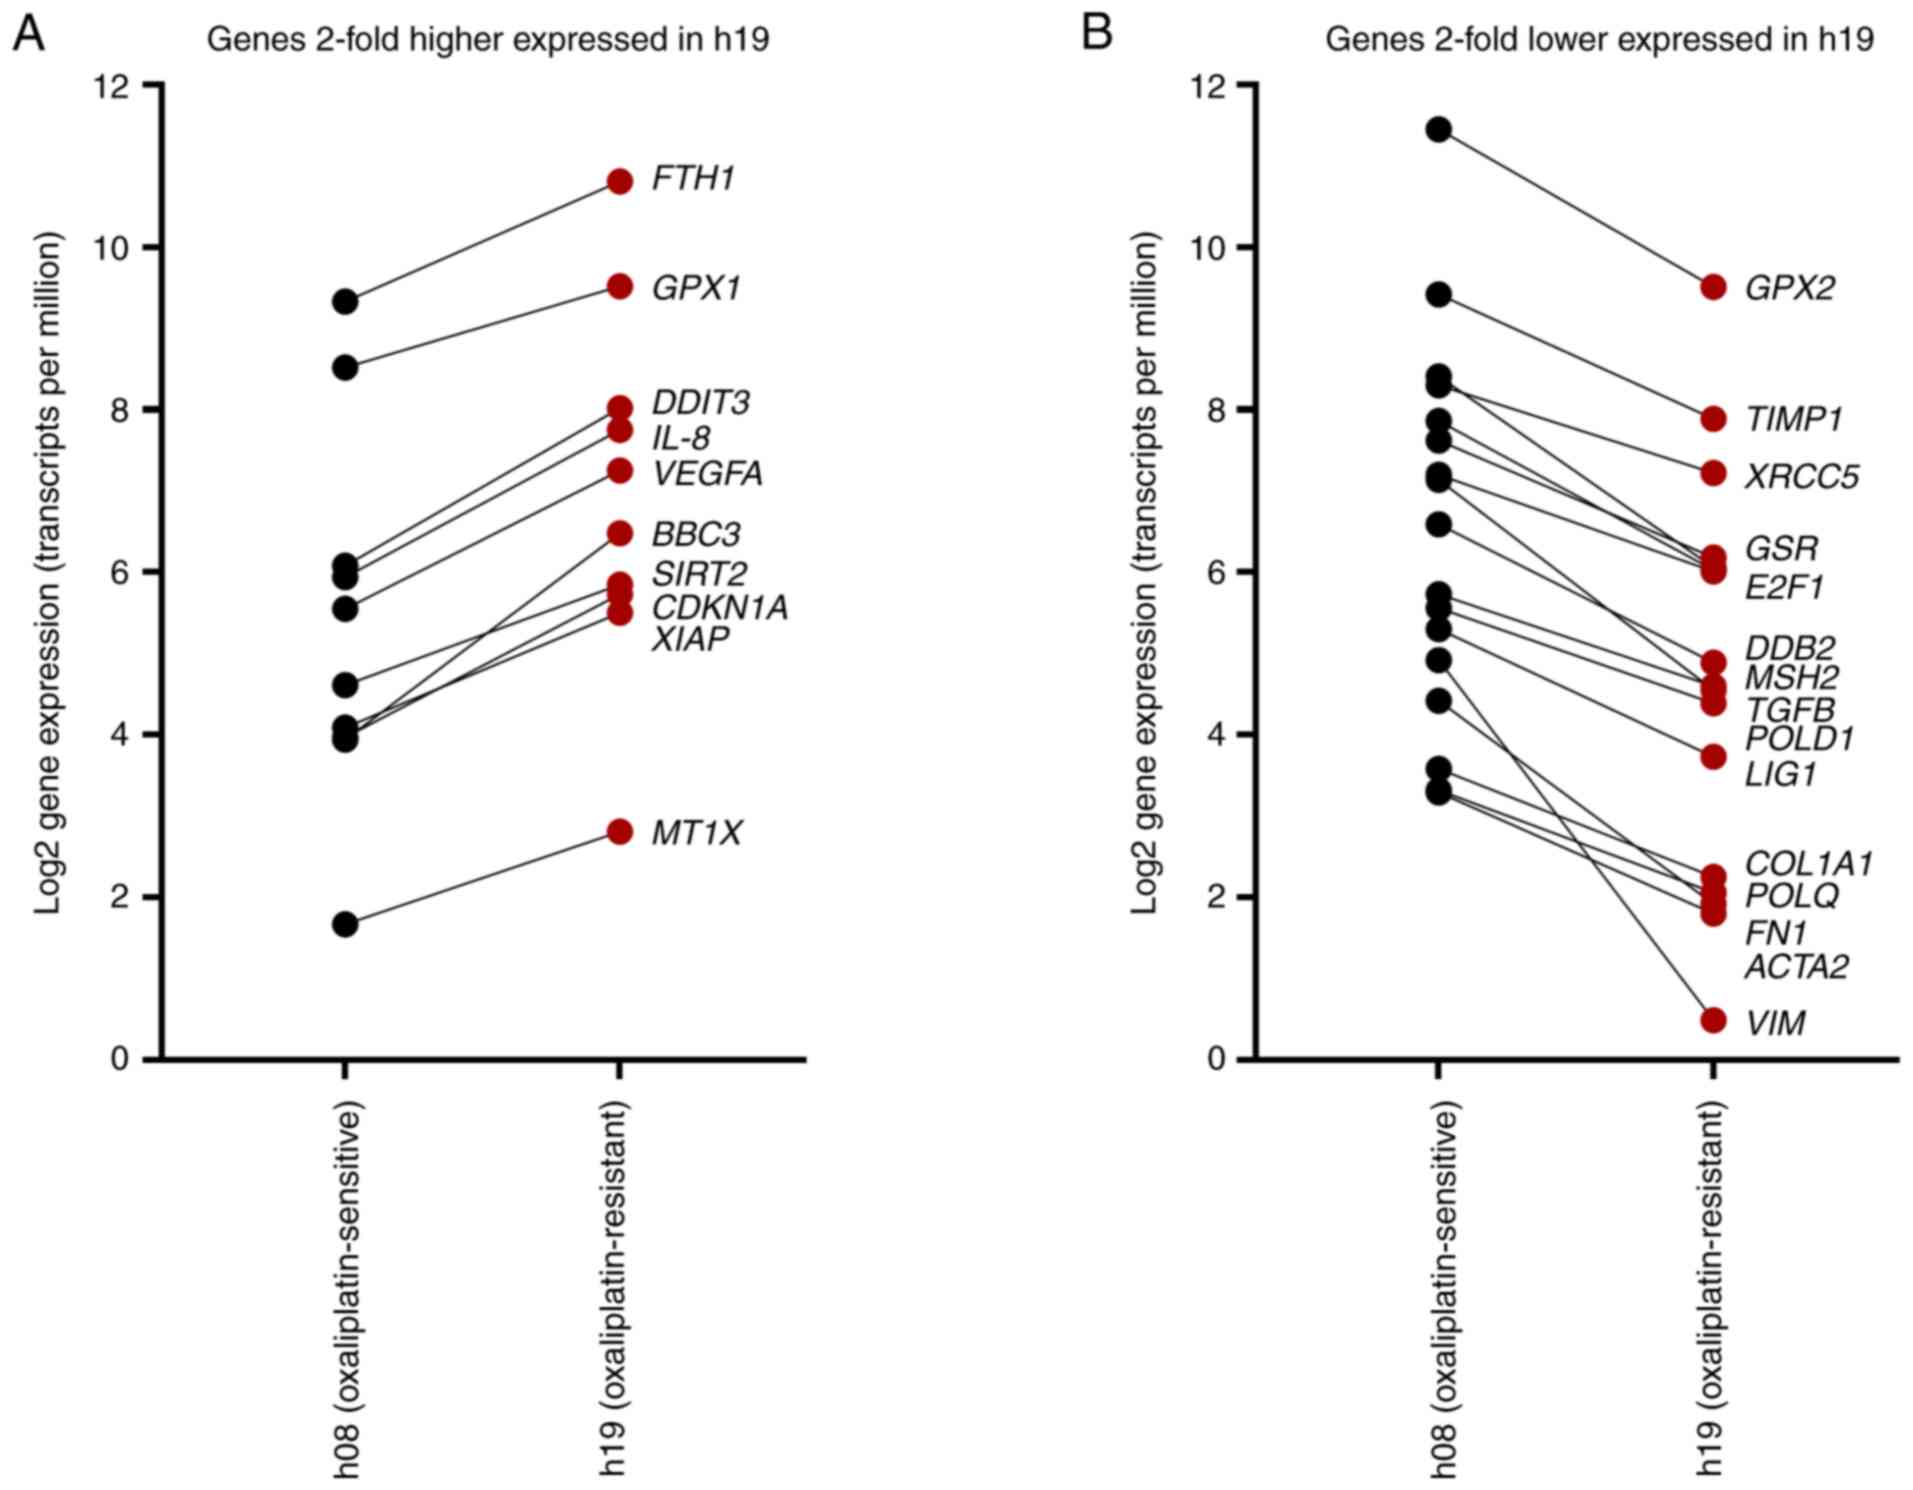
Gene expression levels in hPDOs
The genes evaluated in PDAC cell lines after drug
treatment were also quantified in untreated hPDOs by extracting the
expression levels from RNAseq data. Genes that were >2-fold
higher expressed in h19 compared with h08 included FTH1, GPX1,
DDIT3, IL-8, VEGFA, BBC3, SIRT2, CDKN1A, XIAP and MT1X
(Fig. 8A). By contrast, 17 genes
were >2-fold lower expressed (equals <50% relative
expression) in h19, namely GPX2, TIMP1, XRCC5, GSR, E2F1, DDB2,
MSH2, TGFB, POLD1, LIG1, COL1A1, POLQ, FN1, ACTA2 and
VIM (Fig. 8B).
Discussion
The present study aimed to assess which cellular
factor contributes most to the oxaliplatin resistance phenotype in
PDAC models. The investigation used two well-established PDAC cell
lines, including AsPC-1 cells that have previously been shown to be
oxaliplatin-resistant (26,27); the present study confirmed this by
showing that the oxaliplatin IC50 in AsPC-1 cells was
4-fold higher than that in in BxPC-3 cells. From these data,
however, it cannot be deduced as to whether this resistance
originates from a lower drug uptake or if AsPC-1 cells possess
molecular mechanisms that withstand the cytotoxic threat.
Accordingly, drug uptake was evaluated and the recorded
anti-proliferative effects were subsequently normalized to
intracellular oxaliplatin concentrations. Notably, the resistance
difference non-significantly decreased and remained at 2.5-fold. To
substantiate this finding, two control experiments were performed.
First, in contrast to oxaliplatin resistance, cisplatin resistance
in AsPC-1 cells appeared to be more profoundly mediated by
diminished drug uptake, given the near-perfect overlap of the
concentration-response curves after normalization for intracellular
cisplatin concentrations. Second, the oxaliplatin experiments were
performed using two well-characterized hPDOs (17). In agreement with the cell lines, the
oxaliplatin sensitivity of the hPDOs remained different despite
identical intracellular oxaliplatin concentrations. Taken together,
these findings suggested that poor oxaliplatin uptake may be of
minor relevance for the resistance phenotype. This agrees with
previous evaluations. A previous investigation on
oxaliplatin-resistant colorectal cancer cell lines (generated by
long-term oxaliplatin exposure) showed 5-fold (LoVo-Li cells) to
10-fold (LoVo-92 cells) higher oxaliplatin resistance than their
parental counterparts, but with either only a 50% reduction of
oxaliplatin accumulation (LoVo-92) or no alterations at all
(LoVo-Li) compared with the parental counterparts prior to
resistance induction (28). These
findings indicate that high degrees of oxaliplatin resistance are
not necessarily in line with drug accumulation. In the PDAC cell
lines used in the present study, differences in the expression
pattern of oxaliplatin transporters were also rather minor, with
one exception. ABCC2 (encoding the oxaliplatin efflux
transporter MRP2) was 248-fold more highly expressed in AsPC-1
cells than in BxPC-3 cells. MRP2 has previously been implicated in
oxaliplatin resistance. For example, a knockdown of ABCC2 by
50% also decreased oxaliplatin IC50 by 50–60% (29). Alternatively, transfection-mediated
MRP2 overexpression has been shown to decrease platinum
accumulation by 50% and to make cells 2-fold more oxaliplatin
resistant (30). These findings
however indicate that even a genetically engineered cell model with
artificially high transporter expression eventually only exhibits a
2-fold change in oxaliplatin potency, again questioning the
relevance of drug uptake or transporter expression. Furthermore,
both AsPC-1 cells and the h19 hPDO exhibited SLC22A3
upregulation; this solute carrier is considered a biomarker for
PDAC prognosis (31,32).
To scrutinize the molecular level of oxaliplatin
resistance, the cell lines were treated with oxaliplatin (and
cisplatin as a control) to obtain similar intracellular platinum
levels (~662 pg Pt/µg protein) and subsequently underwent several
experiments. Overall, the data indicated that AsPC-1 cells may
handle the cytotoxic challenge differently than BxPC-3 cells. For
example, caspase 3/7 activity was initiated later in AsPC-1 cells
than that in BxPC-3 cells. Notably, the pro-apoptotic genes
BBC3 and PMAIP1 were weakly enhanced in the
oxaliplatin-resistant AsPC-1 cells, whereas the expression of the
anti-apoptotic Jun was considerably boosted in AsPC-1 cells.
Taken together, these findings suggest that PDAC may exhibit
molecular switches that render cells resistant to pro-apoptotic
signals or trigger sustained proliferation signals. This in turn
also suggests these molecular switches being attractive
pharmacological targets. However, most of the targeted therapeutics
(including kinase inhibitors and monoclonal antibodies) have thus
far disappointed in clinical assessments (1). Therefore, new targets are required.
Among the known driver oncogenes in PDAC (including CDKN2A,
TP53 and SMAD4) that mediate sustained proliferation,
mutated KRAS has been targeted in experimental and clinical
investigations with somewhat promising results (2). Recently, a combined histone
deacetylase/glycogen synthase kinase 3-β inhibitor (Metavert) has
been shown to be efficacious against PDAC hPDOs, both alone, and
particularly in combination with standard anti-PDAC drugs such as
irinotecan (17). This shows that
new agents may be developed, which can selectively address distinct
pathogenic or resistance-mediating mechanisms.
The present study has weaknesses and strengths.
Firstly, a broad set of resistance genes were evaluated at the mRNA
level (such as Jun) and functional apoptosis initiation was
assessed using a caspase 3/7 assay; however, these findings were
not confirmed on the protein level (for example, by western
blotting of select proteins) or by knockdown experiments.
Accordingly, mass spectrometry-based profiling of the relevant
proteins and their manipulation (such as knockdown) should be the
next step in follow-up projects. Notably, the main limitation of
the current study is that most of the data were obtained from
established PDAC cell lines; therefore, general conclusions cannot
be made for clinical PDAC. However, AsPC-1 and BxPC-3 cells are
well-characterized PDAC models with precise information regarding
their origin, differentiation, invasive capacity, angiogenic
potential, tumorigenicity and genotype (33). Thus, these cell lines are considered
meaningful models, which resemble important PDAC features. The
present study provides important information on oxaliplatin uptake
and the expression of drug transporters, and indicates that it is
unlikely that the already observed oxaliplatin resistance in AsPC-1
cells (27) results from poor
oxaliplatin accumulation, which was confirmed in hPDOs. Finally,
the observations regarding delayed caspase 3/7 initiation and
strong induction of Jun in AsPC-1 cells are in agreement
with the p53-deficiency and apoptosis resistance already observed
during the treatment of AsPC-1 cells with gemcitabine or
interferon-γ (34,35).
In conclusion, oxaliplatin resistance in PDAC models
may be highly linked to a poor apoptotic response (weak apoptosis
initiation and poor induction of pro-apoptotic genes), while drug
uptake seems to be of minor relevance.
Acknowledgements
The authors would like to thank Ms. Corina Mueller
(Internal Medicine IX-Department of Clinical Pharmacology and
Pharmacoepidemiology, Heidelberg University, Medical Faculty
Heidelberg, Heidelberg University Hospital, Heidelberg, Germany),
Ms. Jana Kuhn, Ms. Marlene Parsdorfer, Ms. Tatjana Lumpp and Ms.
Sandra Stößer (all affiliated with Department of Food Chemistry and
Toxicology, Karlsruhe Institute of Technology, Karlsruhe, Germany)
for their valuable technical assistance.
Funding
Funding: No funding was received.
Availability of data and materials
The RNAseq raw data generated in the present study
may be found in the European Genome-Phenome Archive under accession
number EGAS00001007143 or at the following URL: https://ega–archive.org/studies/EGAS00001007143. The
gene expression data (RT-qPCR) of the cell lines generated in the
present study may be found in the Gene Expression Omnibus
repository under accession number GSE308898 or at the following
URL: https://www.ncbi.nlm.nih.gov/geo/query/acc.cgi?acc=GSE308898.
The other data generated in the present study may be requested from
the corresponding author.
Authors' contributions
HR, LT, BK, TP, KS, BK and DT designed the study,
performed the experiments, analyzed the data and wrote the
manuscript draft. JW, JB and JPN analyzed and interpreted the data
and made manuscript revisions. DT and BK confirm the authenticity
of all the raw data. All authors read and approved the final
manuscript.
Ethics approval and consent to
participate
Organoids were obtained during a previous study,
which has been approved by the Ethics Committee of Heidelberg
University (Heidelberg, Germany) for use in pancreatic cancer
tissue and organoid generation (project nos. S-018/2020, S-708/2019
and S-083/2021). All patients provided written informed consent for
use of their tissue and clinical data in accordance with The
Declaration of Helsinki.
Patient consent for publication
Not applicable.
Competing interests
All authors declare that they have no competing
interests.
Glossary
Abbreviations
Abbreviations:
|
PDAC
|
pancreatic ductal adenocarcinoma
|
|
hPDOs
|
human patient-derived organoids
|
|
IC50
|
half maximal inhibitory
concentration
|
References
|
1
|
Neoptolemos JP, Kleeff J, Michl P,
Costello E, Greenhalf W and Palmer DH: Therapeutic developments in
pancreatic cancer: Current and future perspectives. Nat Rev
Gastroenterol Hepatol. 15:333–348. 2018. View Article : Google Scholar : PubMed/NCBI
|
|
2
|
Hu ZI and O'Reilly EM: Therapeutic
developments in pancreatic cancer. Nat Rev Gastroenterol Hepatol.
21:7–24. 2024. View Article : Google Scholar : PubMed/NCBI
|
|
3
|
Gresham GK, Wells GA, Gill S, Cameron C
and Jonker DJ: Chemotherapy regimens for advanced pancreatic
cancer: A systematic review and network Meta-analysis. BMC Cancer.
27:4712014. View Article : Google Scholar : PubMed/NCBI
|
|
4
|
Chan K, Shah K, Lien K, Coyle D, Lam H and
Ko YJ: A Bayesian meta–analysis of multiple treatment comparisons
of systemic regimens for advanced pancreatic cancer. PLoS One.
9:e1087492014. View Article : Google Scholar : PubMed/NCBI
|
|
5
|
Springfeld C, Jäger D, Büchler MW, Strobel
O, Hackert T, Palmer DH and Neoptolemos JP: Chemotherapy for
pancreatic cancer. Presse Med. 48:e159–e174. 2019. View Article : Google Scholar : PubMed/NCBI
|
|
6
|
Martinez-Balibrea E, Martínez-Cardús A,
Ginés A, Ruiz de Porras V, Moutinho C, Layos L, Manzano JL, Bugés
C, Bystrup S, Esteller M and Abad A: Tumor-related molecular
mechanisms of oxaliplatin resistance. Mol Cancer Ther.
14:1767–1776. 2015. View Article : Google Scholar : PubMed/NCBI
|
|
7
|
Burger H, Loos WJ, Eechoute K, Verweij J,
Mathijssen RH and Wiemer EA: Drug transporters of Platinum-based
anticancer agents and their clinical significance. Drug Resist
Updat. 14:22–34. 2011. View Article : Google Scholar : PubMed/NCBI
|
|
8
|
Buß I, Hamacher A, Sarin N, Kassack MU and
Kalayda GV: Relevance of copper transporter 1 and organic cation
transporters 1–3 for oxaliplatin uptake and drug resistance in
colorectal cancer cells. Metallomics. 10:414–425. 2018. View Article : Google Scholar
|
|
9
|
Martin LP, Hamilton TC and Schilder RJ:
Platinum resistance: The role of DNA repair pathways. Clin Cancer
Res. 14:1291–1295. 2008. View Article : Google Scholar : PubMed/NCBI
|
|
10
|
Grierson PM, Dodhiawala PB, Cheng Y, Chen
TH, Khawar IA, Wei Q, Zhang D, Li L, Herndon J, Monahan JB, et al:
The MK2/Hsp27 axis is a major survival mechanism for pancreatic
ductal adenocarcinoma under genotoxic stress. Sci Transl Med.
13:eabb54452021.PubMed/NCBI
|
|
11
|
Melisi D, Xia Q, Paradiso G, Ling J,
Moccia T, Carbone C, Budillon A, Abbruzzese JL and Chiao PJ:
Modulation of pancreatic cancer chemoresistance by inhibition of
TAK1. J Natl Cancer Inst. 103:1190–1204. 2011. View Article : Google Scholar : PubMed/NCBI
|
|
12
|
Muniz VP, Askeland RW, Zhang X, Reed SM,
Tompkins VS, Hagen J, McDowell BD, Button A, Smith BJ, Weydert JA,
et al: RABL6A promotes oxaliplatin resistance in tumor cells and is
a new marker of survival for resected pancreatic ductal
adenocarcinoma patients. Genes Cancer. 4:273–284. 2013. View Article : Google Scholar : PubMed/NCBI
|
|
13
|
Jing W, Song N, Liu Y, Qu X, Hou K, Yang X
and Che X: DNA methyltransferase 3a modulates chemosensitivity to
gemcitabine and oxaliplatin via CHK1 and AKT in p53-deficient
pancreatic cancer cells. Mol Med Rep. 17:117–124. 2018.PubMed/NCBI
|
|
14
|
Pishvaian MJ, Biankin AV, Bailey P, Chang
DK, Laheru D, Wolfgang CL and Brody JR: BRCA2 secondary
mutation-mediated resistance to platinum and PARP Inhibitor-based
therapy in pancreatic cancer. Br J Cancer. 116:1021–1026. 2017.
View Article : Google Scholar : PubMed/NCBI
|
|
15
|
Lal S, Burkhart RA, Beeharry N,
Bhattacharjee V, Londin ER, Cozzitorto JA, Romeo C, Jimbo M, Norris
ZA, Yeo CJ, et al: HuR posttranscriptionally regulates WEE1:
Implications for the DNA damage response in pancreatic cancer
cells. Cancer Res. 74:1128–1140. 2014. View Article : Google Scholar : PubMed/NCBI
|
|
16
|
Xia R, Hu C, Ye Y, Zhang X, Li T, He R,
Zheng S, Wen X and Chen R: HNF1A regulates oxaliplatin resistance
in pancreatic cancer by targeting 53BP1. Int J Oncol. 62:452023.
View Article : Google Scholar : PubMed/NCBI
|
|
17
|
An J, Kurilov R, Peccerella T, Bergmann F,
Edderkaoui M, Lim A, Zhou X, Pfütze K, Schulz A, Wolf S, et al:
Metavert synergises with standard cytotoxics in human PDAC
organoids and is associated with transcriptomic signatures of
therapeutic response. Transl Oncol. 49:1021092024. View Article : Google Scholar : PubMed/NCBI
|
|
18
|
Peters T, Lindenmaier H, Haefeli WE and
Weiss J: Interaction of the mitotic kinesin Eg5 inhibitor monastrol
with P-glycoprotein. Naunyn Schmiedebergs Arch Pharmacol.
372:291–299. 2006. View Article : Google Scholar : PubMed/NCBI
|
|
19
|
Fischer BM, Neumann D, Piberger AL, Risnes
SF, Köberle B and Hartwig A: Use of high-throughput RT-qPCR to
assess modulations of gene expression profiles related to genomic
stability and interactions by cadmium. Arch Toxicol. 90:2745–2761.
2016. View Article : Google Scholar : PubMed/NCBI
|
|
20
|
Rose F, Köberle B, Honnen S, Bay C,
Burhenne J, Weiss J, Haefeli WE and Theile D: RNA is a
pro-apoptotic target of cisplatin in cancer cell lines and C.
elegans. Biomed Pharmacother. 173:1164502024. View Article : Google Scholar : PubMed/NCBI
|
|
21
|
Pfaffl MW: A new mathematical model for
relative quantification in real-time RT-PCR. Nucleic Acids Res.
29:e452001. View Article : Google Scholar : PubMed/NCBI
|
|
22
|
Albermann N, Schmitz-Winnenthal FH,
Z'graggen K, Volk C, Hoffmann MM, Haefeli WE and Weiss J:
Expression of the drug transporters MDR1/ABCB1, MRP1/ABCC1,
MRP2/ABCC2, BCRP/ABCG2, and PXR in peripheral blood mononuclear
cells and their relationship with the expression in intestine and
liver. Biochem Pharmacol. 70:949–958. 2005. View Article : Google Scholar : PubMed/NCBI
|
|
23
|
Weiss J, Herzog M and Haefeli WE:
Differential modulation of the expression of important drug
metabolising enzymes and transporters by endothelin-1 receptor
antagonists ambrisentan and bosentan in vitro. Eur J Pharmacol.
660:298–304. 2011. View Article : Google Scholar : PubMed/NCBI
|
|
24
|
Theile D, Ketabi-Kiyanvash N, Herold-Mende
C, Dyckhoff G, Efferth T, Bertholet V, Haefeli WE and Weiss J:
Evaluation of drug transporters' significance for multidrug
resistance in head and neck squamous cell carcinoma. Head Neck.
33:959–968. 2011. View Article : Google Scholar : PubMed/NCBI
|
|
25
|
Vandesompele J, De Preter K, Pattyn F,
Poppe B, Van Roy N, De Paepe A and Speleman F: Accurate
normalization of Real-time quantitative RT-PCR data by geometric
averaging of multiple internal control genes. Genome Biol.
3:RESEARCH00342002. View Article : Google Scholar : PubMed/NCBI
|
|
26
|
Kuo SH, Yang SH, Wei MF, Lee HW, Tien YW,
Cheng AL and Yeh KH: Contribution of nuclear BCL10 expression to
tumor progression and poor prognosis of advanced and/or metastatic
pancreatic ductal adenocarcinoma by activating NF-κB-related
signaling. Cancer Cell Int. 21:4362021. View Article : Google Scholar : PubMed/NCBI
|
|
27
|
Lee JH, Lee SH, Lee SK, Choi JH, Lim S,
Kim MS, Lee KM, Lee MW, Ku JL, Kim DH, et al: Antiproliferative
activity of krukovine by regulating transmembrane protein 139
(TMEM139) in Oxaliplatin-resistant pancreatic cancer cells. Cancers
(Basel). 15:26422023. View Article : Google Scholar : PubMed/NCBI
|
|
28
|
Noordhuis P, Laan AC, van de Born K,
Honeywell RJ and Peters GJ: Coexisting molecular determinants of
acquired oxaliplatin resistance in human colorectal and ovarian
cancer cell lines. Int J Mol Sci. 20:36192019. View Article : Google Scholar : PubMed/NCBI
|
|
29
|
Biswas R, Bugde P, He J, Merien F, Lu J,
Liu DX, Myint K, Liu J, McKeage M and Li Y: Transport-mediated
oxaliplatin resistance associated with endogenous overexpression of
MRP2 in Caco-2 and PANC-1 Cells. Cancers (Basel). 11:13302019.
View Article : Google Scholar : PubMed/NCBI
|
|
30
|
Myint K, Biswas R, Li Y, Jong N, Jamieson
S, Liu J, Han C, Squire C, Merien F, Lu J, et al: Identification of
MRP2 as a targetable factor limiting oxaliplatin accumulation and
response in gastrointestinal cancer. Sci Rep. 9:22452019.
View Article : Google Scholar : PubMed/NCBI
|
|
31
|
Mohelnikova-Duchonova B, Brynychova V,
Hlavac V, Kocik M, Oliverius M, Hlavsa J, Honsova E, Mazanec J,
Kala Z, Melichar B and Soucek P: The association between the
expression of solute carrier transporters and the prognosis of
pancreatic cancer. Cancer Chemother Pharmacol. 72:669–682. 2013.
View Article : Google Scholar : PubMed/NCBI
|
|
32
|
Cervenkova L, Vycital O, Bruha J,
Rosendorf J, Palek R, Liska V, Daum O, Mohelnikova-Duchonova B and
Soucek P: Protein expression of ABCC2 and SLC22A3 associates with
prognosis of pancreatic adenocarcinoma. Sci Rep. 9:197822019.
View Article : Google Scholar : PubMed/NCBI
|
|
33
|
Deer EL, González-Hernández J, Coursen JD,
Shea JE, Ngatia J, Scaife CL, Firpo MA and Mulvihill SJ: Phenotype
and genotype of pancreatic cancer cell lines. Pancreas. 39:425–435.
2010. View Article : Google Scholar : PubMed/NCBI
|
|
34
|
Sugimoto H, Nakamura M, Yoda H, Hiraoka K,
Shinohara K, Sang M, Fujiwara K, Shimozato O, Nagase H and Ozaki T:
Silencing of RUNX2 enhances gemcitabine sensitivity of
p53-deficient human pancreatic cancer AsPC-1 cells through the
stimulation of TAp63-mediated cell death. Cell Death Dis.
6:e19142015. View Article : Google Scholar : PubMed/NCBI
|
|
35
|
Detjen KM, Farwig K, Welzel M, Wiedenmann
B and Rosewicz S: Interferon gamma inhibits growth of human
pancreatic carcinoma cells via caspase-1 dependent induction of
apoptosis. Gut. 49:251–262. 2001. View Article : Google Scholar : PubMed/NCBI
|