Introduction
Gliomas are among the most common primary malignant
tumors of the central nervous system (CNS), arise from glial or
neural precursor cells and encompass histological subtypes such as
astrocytoma [including glioblastoma (GBM)], oligodendroglioma,
ependymoma and oligoastrocytoma [now classified as glioma,
isocitrate dehydrogenase (IDH)-mutant] (1). GBM, the most aggressive glioma
subtype, poses major therapeutic challenges due to its highly
malignant phenotype and poor prognosis. Despite significant
advances in anticancer therapies, including immunotherapy, GBM
remains largely unresponsive to conventional and novel
interventions. The limited efficacy of immunotherapy in GBM
primarily stems from its notably immunosuppressive tumor
microenvironment and intrinsic resistance mechanisms (2,3). The
2016 World Health Organization (WHO) Classification of Tumors of
the CNS marked a paradigm shift by integrating molecular biomarkers
into diagnostic criteria (4). The
2021 fifth edition of the WHO CNS classification further refined
this framework, establishing histomolecular classification as a
cornerstone of modern neuro-oncology (5). Key molecular biomarkers include IDH
mutations, 1p/19q codeletion, H3F3A alterations, α
thalassemia/mental retardia syndrome X-linked mutations,
O6-methylguanine-DNA methyltransferase (MGMT) promoter
methylation, cyclin dependent kinase inhibitor 2A (CDKN2A)
homozygous deletion, epidermal growth factor receptor
amplification, combined chromosome 7 gain/chromosome 10 loss
(7+/10-) and telomerase reverse transcriptase promoter mutations
(5,6). In adults, IDH mutation status and MGMT
promoter methylation serve as strong prognostic indicators for
glioma, while CDKN2A homozygous deletion is a critical marker of
histological progression in IDH-mutant astrocytomas (7). Recent discoveries have expanded the
molecular landscape of glioma. For instance, olfactomedin like 3
has emerged as a biomarker associated with poor prognosis; its
knockdown enhances temozolomide sensitivity and may reflect immune
dysregulation within the tumor microenvironment (8). Such findings underscore the pivotal
role of comprehensive molecular profiling in enabling precise
glioma classification and personalized therapy development. Beyond
molecular characterization, integrating multimodal data, including
radiological, histopathological and genomic modalities, has shown
promise for improving prognostic accuracy and deep learning
frameworks capable of jointly analyzing these data types
consistently outperform single-modality approaches (9). Notably, Yuan et al (10) developed a squeeze-and-excitation
deep learning model that integrated preoperative
T1-contrast-enhanced MRI, digitized whole-slide histopathological
images and circulating 5-hydroxymethylcytosine profiles, achieving
a marked prognostic performance (concordance index=0.897) in a
glioma cohort. By effectively capturing glioma heterogeneity across
spatial and temporal dimensions, such multimodal strategies
represent a significant advance toward precision medicine in
neuro-oncology. Current standard management involves maximal safe
surgical resection followed by adjuvant radiotherapy with
concurrent temozolomide chemotherapy, typically initiated within 30
days postoperatively (11).
Although emerging molecular-targeted therapies and immunotherapies
have shown promise in select molecular subtypes, most patients with
glioma experience limited clinical benefit due to inadequate target
specificity, restricted blood-brain barrier permeability, acquired
resistance and dose-limiting toxicities (12,13).
Consequently, continued discovery of novel molecular markers
remains essential to elucidate gliomagenesis mechanisms, identify
actionable targets and accelerate the translation of precision
medicine in glioma therapy.
The cyclin-dependent kinase (CDK) family plays a
pivotal role in regulating signaling pathways that govern
transcriptional control and cell cycle progression. Within the cell
cycle, CDK2, CDK4 and CDK6 coordinate interphase progression,
whereas CDK1 orchestrates mitotic entry (14). As a key G2/M checkpoint kinase
(15), CDK1 drives tumor
proliferation and survival across multiple malignancies, including
breast, colorectal and lung cancer (16–19).
Clinically, elevated CDK1 expression serves as a prognostic
biomarker strongly associated with poor oncological outcomes,
including in colorectal, ovarian, breast and pancreatic cancer
(20–24). The key regulators of the cell cycle,
including proliferating cell nuclear antigen (PCNA), minichromosome
maintenance complex component 2–4 (MCM2-4), MCM6, polo-like kinase
1 (PLK1), TTK protein kinase (TTK) and mitotic arrest deficient 2
like 1 (MAD2L1), collectively ensure DNA replication and mitotic
fidelity (25,26). However, the functional relationship
between CDK1 and these regulators remains to be fully elucidated.
Therefore, systematically investigating the molecular mechanisms of
CDK1 in glioma is of significant importance (27–29).
Materials and methods
Microarray data download
Gene expression datasets and associated clinical
data (accession nos. GSE29796, GSE4290, GSE50161 and GSE7696) were
retrieved from the Gene Expression Omnibus (GEO; http://www.ncbi.nlm.nih.gov/geo/). The GSE29796
dataset comprises 52 glioma specimens and 20 non-tumoral controls
(30); GSE4290 includes 153 glioma
and 23 non-tumoral samples (31);
GSE50161 contains 117 glioma and 13 non-tumoral samples (32); and GSE7696 includes 80 glioma and 4
non-tumoral specimens (33).
Additional datasets [mRNAseq_693 and mRNAseq_325 (34) were obtained from the Chinese Glioma
Genome Atlas (CGGA; http://www.cgga.org.cn/), encompassing RNA sequencing
profiles and clinical annotations for 1,018 glioma cases, along
with RNA sequencing data from 20 non-tumoral brain tissues. For
independent validation, RNA sequencing data and clinical
information from 592 glioma specimens [449 low-grade glioma (LGG)
and 143 GBM] were acquired from The Cancer Genome Atlas (TCGA;
https://portal.gdc.cancer.gov/; TCGA-LGG
and TCGA-GBM datasets; dbGaP accession phs000178) (35,36).
Samples lacking complete clinical annotations were excluded. To
minimize batch effects and technical variability, RNA sequencing
data were normalized using the ‘limma’ package of Sangerbox 3.0
(http://sangerbox.com/) and log2 (x + 1)
transformed before analysis.
Acquisition of tissue samples from 37
patients
Paired tumor specimens and histologically normal
adjacent tissues (collected >2 cm from the tumor margin) were
obtained from 37 patients with histologically confirmed glioma
treated at the Department of Neurosurgery, The Second Hospital of
Hebei Medical University (Shijiazhuang, China). Patient recruitment
and sample collection spanned the period from August 2019 to
December 2024. The enrolled cohort consisted of patients aged
between 30 and 78 years, with a male-to-female ratio of 1.3:1. The
inclusion criteria were as follows: i) Age ≥18 years; ii) patients
who underwent surgical resection for primary brain tumors at the
Second Hospital of Hebei Medical University; iii) initial diagnosis
of glioma based on preoperative MRI findings and subsequent
histopathological confirmation following surgical resection; iv) no
prior history of radiotherapy or chemotherapy; and v) provision of
written informed consent by the patient or their legal guardian.
Patients were excluded from the study if they met any of the
following criteria: i) Diagnosis of other intracranial tumors (such
as meningioma and metastasis); ii) history of any other malignant
tumors; iii) presence of severe cardiac, hepatic or renal
dysfunction; iv) receipt of any preoperative anticancer therapy;
and v) inadequate tissue sample quality for subsequent analysis.
All collected specimens were immediately snap-frozen in liquid
nitrogen post-resection and stored at −80°C until analysis for CDK1
protein expression. The study protocol was reviewed and approved by
the Ethics Committee of the Second Hospital of Hebei Medical
University (Shijiazhuang, China; approval no.2019-R191) and all
procedures were conducted in accordance with the principles of the
Declaration of Helsinki.
Protein sample extraction
Frozen glioma and matched non-tumoral tissues were
retrieved from −80°C storage, thawed on ice and homogenized in
radioimmunoprecipitation assay (RIPA) lysis buffer (Beijing
Solarbio Science & Technology Co., Ltd.; cat. no. R0010)
supplemented with phosphatase inhibitor cocktail (Beijing Solarbio
Science & Technology Co., Ltd.; cat. no. P1260) using a tissue
grinder. Homogenates were centrifuged at 10,000 × g for 10 min at
4°C, then the supernatants were collected into fresh
microcentrifuge tubes. Protein preparation from U251MG and LN229
cell lines was conducted by placing the processed cells on ice,
adding the aforementioned RIPA buffer containing protein and
phosphatase inhibitors. Lysis was performed on a rocking platform
for 15 min. Protein concentrations were quantified using a BCA
assay kit (Beijing Solarbio Science & Technology Co., Ltd.;
cat. no. PC0020) and lysates were denatured at 100°C for 15 min in
loading buffer (Beijing Solarbio Science & Technology Co.,
Ltd.; cat. no. P1019).
Cell culture
The U251MG and LN229 human glioma cell lines were
obtained from the China Infrastructure of Cell Line Resources,
Institute of Basic Medical Sciences, Chinese Academy of Medical
Sciences (Beijing, China). Cells were maintained in Dulbecco's
Modified Eagle Medium (DMEM; Gibco; Thermo Fisher Scientific, Inc.;
cat. no. 11995065) supplemented with 10% fetal bovine serum (FBS;
Gibco; Thermo Fisher Scientific, Inc.; cat. no. A5670801) and 1%
penicillin-streptomycin solution (Beijing Solarbio Science &
Technology Co., Ltd.; cat. no. P1400) and incubated at 37°C in a
humidified atmosphere containing 5% CO2.
Searching for genes involved in glioma
initiation and progression
For differential expression analysis, the GSE29796,
GSE4290, GSE50161 and GSE7696 datasets were divided into tumor and
non-tumor groups. Differentially expressed genes (DEGs) were
identified based on adjusted P<0.05 and |log2 fold
change (FC)|>1 criteria. Volcano plots for each dataset were
generated using the ‘limma’ package in R v4.0.5 (37). The jvenn online tool (http://jvenn.toulouse.inra.fr/app/usermanual.html)
identified 360 consensus DEGs co-expressed across all four
datasets. These DEGs were imported into the Search Tool for the
Retrieval of Interacting Genes (STRING; http://string-db.org/) to construct a protein-protein
interaction (PPI) network, excluding nodes with an interaction
confidence score of <0.7 and isolated proteins. The resulting
PPI network, containing 180 proteins, was visualized using
Cytoscape (v3.7.2; http://cytoscape.org/). The cytoHubba plugin
identified CDK1 as the hub gene based on maximal degree
centrality.
CDK1 gene expression analysis
CDK1 expression in glioma and non-tumoral samples
from the four GEO datasets (GSE29796, GSE4290, GSE50161 and
GSE7696) was analyzed using the unpaired t-test for parametric data
or the Mann-Whitney U test for non-parametric data in GraphPad
Prism 8 (Dotmatics). Expression validation in GBM and LGG was
further conducted using the Gene Expression Profiling Interactive
Analysis (GEPIA; http://gepia.cancer-pku.cn/) and Human Protein Atlas
(HPA; http://www.proteinatlas.org/)
databases. Experimental validation of CDK1 expression was performed
via western blotting under standardized conditions.
Correlation analysis of CDK1
expression level with clinical information and pathological
features
The CGGA dataset comprising mRNA transcriptome data
and clinical information from 1,018 glioma samples was used to
assess associations between CDK1 expression and clinical prognosis,
with findings validated using TCGA data. Samples were stratified
into high- and low-expression groups based on median CDK1
expression levels. Kaplan-Meier survival analyses were performed
using R v4.0.5 with the ‘survival’ and ‘survminer’ packages, while
time-dependent receiver operating characteristic (ROC) curves at
1-, 3- and 5-year intervals were generated using the ‘survivalROC’
package. Univariate and multivariate Cox regression analyses were
used to identify independent prognostic factors (significance
threshold: P<0.001). Based on CGGA data, nomograms predicting
1-, 2- and 3-year survival probabilities were constructed using the
‘survival’ and ‘rms’ packages (R; v4.0.5), and calibration curves
were used to assess the predictive accuracy. Finally, based on the
CGGA data, associations between CDK1 expression and
clinicopathological characteristics were analyzed using the
‘beeswarm’ package in R (v3.6.3). P<0.05 was considered to
indicate a statistically significant difference for all
analyses.
Western blotting
Denatured proteins (described above) from 37 paired
glioma and adjacent normal tissues, as well as the U251MG and LN229
cell lines, were separated by electrophoresis on 10%
SDS-polyacrylamide gels (an equal amount of 30 µg was loaded per
lane) at a constant voltage of 120 V for 90 min and transferred to
0.45 µm PVDF membranes (Merck KGaA; cat. no. IPVH00010). Membranes
were blocked with 5% (w/v) non-fat dry milk in Tris-buffered saline
containing 0.1% Tween-20 (TBST) at 25°C for 1 h. The membranes were
incubated overnight at 4°C with the following primary antibodies
diluted in blocking buffer: Anti-CDK1 (34 kDa; 1:500; Proteintech
Group, Inc.; cat. no. 19532-1-AP) and β-actin (42 kDa; 1:10,000;
Proteintech Group, Inc.; cat. no. 66009-1-Ig). Following three
10-min washes with TBST at 25°C, the membranes were incubated for 1
h at 25°C with HRP-conjugated goat anti-rabbit/mouse IgG (H+L)
secondary antibodies (1:10,000; Proteintech Group, Inc.; cat. nos.
SA00001-2 and SA00001-1). Protein bands were visualized using an
ECL Western blotting kit (Biosharp Life Sciences; cat. no. BL520B)
and detected via chemiluminescent imaging. Band intensities were
semi-quantified using Image Lab software (v5.2.1; Bio-Rad
Laboratories, Inc.).
CDK1 knockdown
CDK1-targeting small interfering RNAs (siRNAs) and
the scrambled negative control (NC) were synthesized by Shanghai
GenePharma Co., Ltd. The concentration of nucleic acid used was 20
pmol/µl. Transient transfection was performed using Lipofectamine
3000 (Thermo Fisher Scientific, Inc.; cat. no. L3000150) in U251MG
and LN229 cells at 70–80% confluency, following the manufacturer's
protocol. Transfection efficiency was verified by western blotting
48 h post-transfection. The effective siRNA duplex sequences were:
CDK1, 5′-CCUAUGGAGUUGUGUAUAAGGTT-3′ (sense) and
5′-CCUUAUACACAACUCCAUAGGTT-3′ (anti-sense); and NC,
5′-UUCUCCGAACGUGUCACGUTT-3′ (sense) and 5′-ACGUGACACGUUCGGAGAATT-3′
(anti-sense).
Cell Counting Kit (CCK)-8 assay
Cell viability in the U251MG and LN229 cell lines
was assessed using CCK-8 (MedChemExpress; cat. no. HY-K0301)
according to the manufacturer's instructions. Cells were seeded in
96-well plates at 3×10³ cells/well in 100 µl of complete
medium and allowed to adhere for 24 h. The medium was replaced with
110 µl of serum-free medium containing 10% (v/v) CCK-8 reagent, and
plates were incubated for 1 h at 37°C. Absorbance at 450 nm was
recorded daily for 7 consecutive days using a NanoQuant
spectrophotometer (Tecan Group, Ltd.). Data were collected from
triplicate wells in three independent experiments.
EdU cell proliferation assay
U251MG and LN229 cells were seeded in 96-well plates
at 1×10⁴ cells/well in 200 µl complete medium and
cultured at 37°C with 5% CO2 for 24 h. Following the
manufacturer's instructions (EdU Kit; Shanghai Yeasen Biotechnology
Co., Ltd.; cat. no. 40276ES60), cells were incubated with 25 µM EdU
in serum-free medium for 2 h at 37°C. After fixation with 4%
paraformaldehyde (PFA) for 30 min at 25°C and permeabilization with
0.2% Triton X-100 for 20 min, cells were washed three times with
phosphate-buffered saline (PBS). EdU was detected using Apollo 594
fluorescent dye (1:100 dilution) for 30 min in the dark, followed
by nuclear counterstaining with Hoechst 33342 (1 µg/ml) for 10 min.
Proliferating cells were visualized using an inverted fluorescence
microscope (Leica DMi8) at ×200 magnification. The proliferation
index was calculated as the ratio of EdU-positive cells to total
Hoechst 33342-stained nuclei.
Wound healing assay
U251MG cells were seeded in 6-well plates at
5×10⁵ cells/well and cultured to 70–80% confluency in a
humidified incubator (37°C, 5% CO2). Linear scratches
were created using a sterile 200 µl pipette tip and initial wound
widths were recorded under a phase-contrast microscope. After three
PBS washes (pH 7.4), cells were maintained in serum-free DMEM
supplemented with 1% penicillin-streptomycin. Wound closure was
monitored and imaged at 0, 24, 48 and 72 h post-scratch to evaluate
the cell migration rates. The cell migration rate (%) was then
calculated for each time point using the following formula based on
the wound width: Migration rate=[(width at 0 h-width at T h)/width
at 0 h] ×100%, where T represents the specific time point after
scratching.
Acridine orange/ethidium bromide
(AO/EB) assay
U251MG and LN229 cells were seeded in 24-well plates
at 5×10⁴ cells/well in 500 µl complete medium and
incubated at 37°C with 5% CO2 for 24 h. After aspirating
the medium and washing twice with PBS (pH 7.4), cells were stained
following the manufacturer's protocol (AO/EB Staining Kit; Sangon
Biotech Co., Ltd.; cat. no. E607308). Briefly, 200 µl AO/EB working
solution was added per well, and cells were incubated in the dark
at room temperature for 5 min. Fluorescence images were captured
using an inverted fluorescence microscope (TRITC filter; ×200
magnification). The apoptotic index was calculated as
(EB+ cells/total cells) ×100%, based on three random
fields per well. Data are from three biological replicates.
Transwell assay
U251MG and LN229 cells were serum-starved in DMEM
for 24–48 h to promote migratory activation. Subsequently,
3×10⁴ treated cells were resuspended in serum-free DMEM
and seeded into the upper chamber of 8 µm pore Transwell inserts
(Corning, Inc.), either uncoated (migration assay) or coated with
Matrigel (invasion assay). The Matrigel coating was performed by
incubating a 1:8 dilution of Matrigel at 37°C for 4 h to form a
thin layer simulating the extracellular matrix. The lower chamber
contained 500 µl of DMEM supplemented with 10% FBS as a
chemoattractant. After 24–48 h incubation, cells were fixed with 4%
PFA for 15 min at 25°C and stained with 0.5% crystal violet for 20
min at 25°C. Non-migrated cells on the upper surface were removed
with a cotton swab, and the migrated/invaded cells on the lower
surface were imaged under a light microscope.
Flow cytometry
U251MG cells were harvested by trypsinization,
centrifuged at 300 × g for 5 min at 4°C, and resuspended in 1X
binding buffer according to the manufacturer's instructions
(Annexin V-FITC Apoptosis Kit; Shanghai Yeasen Biotechnology Co.,
Ltd.; cat. no. 40302ES08). The cells were subsequently stained with
Annexin V-FITC and propidium iodide staining solution and incubated
in the dark at room temperature for 10–15 min. Following staining,
apoptotic rates were quantified using a flow cytometer (Canto II;
BD Biosciences) in strict accordance with the kit protocol to
ensure reproducibility. For statistical analysis, the proportion of
cells within the Q2 quadrant was selected to represent apoptotic
populations using FlowJo software (v10.8.1, FlowJo LLC; BD
Biosciences).
γ-H2AX immunofluorescence assay
U251MG and LN229 cells were seeded in 8-well chamber
slides at a density of 5×10⁴ cells per well in 300 µl of
complete medium and cultured for 24 h at 37°C under 5%
CO2. After exposure to 5 Gy X-irradiation, cells were
fixed with ice-cold 4% paraformaldehyde for 30 min at the specified
time points (0.5, 2, 6 and 24 h post-irradiation). Permeabilization
was performed using 0.2% Triton X-100 in PBS for 20 min at room
temperature, followed by blocking with 2% BSA (Beijing Solarbio
Science & Technology Co., Ltd.; cat no. A8010) for 1 h at 25°C.
For γ-H2AX foci detection, cells were incubated overnight at 4°C
with rabbit anti-γ-H2AX monoclonal antibody (1:200; Cell Signaling
Technology, Inc.; cat. no. 9718S). After three 5-min PBS washes,
Alexa Fluor 488-conjugated goat anti-rabbit IgG (1:200; Proteintech
Group, Inc.; cat. no. SA00013-2) was applied for 1 h at room
temperature in the dark. Nuclei were counterstained with DAPI
(Abbkine Scientific Co., Ltd.; cat. no. BMU107) for 30 min at 25°C.
Fluorescent images were acquired using a confocal microscope, and
γ-H2AX foci were quantified using ImageJ software (v2.3.0; National
Institutes of Health).
Reverse transcription-quantitative PCR
(RT-qPCR)
Total RNA was isolated from glioma cells using
TRIzol reagent (Invitrogen; Thermo Fisher Scientific, Inc.). cDNA
synthesis was performed using Hifair® III 1st Strand
cDNA Synthesis SuperMix (Shanghai Yeasen Biotechnology Co., Ltd.;
cat. no. 11141ES60) according to the manufacturer's protocol.
Briefly, the reaction mixture was incubated at 25°C for 5 min,
followed by reverse transcription at 55°C for 15 min and final
enzyme inactivation at 85°C for 5 min. qPCR was carried out using
Hieff UNICON® Universal Blue qPCR SYBR Green Master Mix
(Shanghai Yeasen Biotechnology Co., Ltd.; cat. no. 11201ES08) on a
Bio-Rad qPCR system (Bio-Rad Laboratories, Inc.). Thermal cycling
conditions were as follows: Initial denaturation at 95°C for 5 min,
followed by 40 cycles of 95°C for 10 sec (denaturation), 60°C for
10 sec (annealing) and 72°C for 20 sec (extension), ending with a
final hold at 4°C. Primer sequences were as follows: CDK1:
5′-CAGACTAGAAAGTGAAGAGGAAGG-3′ (forward) and
5′-ACTGACCAGGAGGGATAGAATC-3′ (reverse); MCM6:
5′-GAGGAACTGATTCGTCCTGAGA-3′ (forward) and
5′-CAAGGCCCGACACAGGTAAG-3′ (reverse); MCM3:
5′-CTGAAGGCGAGGAATGTTGGTG-3′ (forward) and
5′-GATGGGAAGTAGGGCGGATGAG-3′ (reverse); PLK1:
5′-CCTGCACCGAAACCGAGTTA-3′ (forward) and 5′-TAGGAGTCCCACACAGGGTC-3′
(reverse); MCM2: 5′-GTTCAGCGTCATGCGGAGTAT-3′ (forward) and
5′-TCTCGCCGGAAGGAGAGATA-3′ (reverse); MCM4:
5′-CAACGGCATCTGCTGTATCG-3′ (forward) and
5′-CTGACAGATGATCCCAGCCTTT-3′ (reverse); MAD2L1:
5′-ACGGTGACATTTCTGCCACT-3′ (forward) and 5′-TGGTCCCGACTCTTCCCATT-3′
(reverse); PCNA: 5′-TCGTCTCACGTCTCCTTGGT-3′ (forward) and
5′-TTTTGGACATGCTGGTGAGGT-3′ (reverse); GAPDH:
5′-TCATTTCCTGGTATGACAACGA-3′ (forward) and
5′-GTCTTACTCCTTGGAGGCC-3′ (reverse). GAPDH served as the internal
control for normalization and relative mRNA expression levels were
calculated using the 2−ΔΔCq method (38).
DEG analysis and pathway enrichment
analysis of the CDK1 gene
To investigate the specific biological functions of
the hub gene CDK1 in glioma, a subsequent and distinct DEG analysis
was performed. Unlike the initial analysis aimed at discovering
pan-glioma associated genes across multiple datasets (GSE29796,
GSE4290, GSE50161 and GSE7696), this analysis focused on comparing
transcriptional profiles between CDK1-high and CDK1-low expression
groups within the CGGA glioma cohort. mRNA sequencing data from the
CGGA glioma dataset were retrieved and normalized as
aforementioned. Samples were divided into CDK1-high and CDK1-low
groups based on the median CDK1 expression. DEGs were identified
using thresholds of P<0.05 and |log2FC|>1,
resulting in 638 significant DEGs [false discovery rate
(FDR)<0.05]. Volcano plots were generated using the limma
package in R (v4.3.1) (37). To
elucidate the functional implications of these DEGs, enrichment
analyses were conducted. Gene Ontology (GO) enrichment was
performed using Metascape (39)
(https://metascape.org/), while Kyoto Encyclopedia
of Genes and Genomes (KEGG) pathway enrichment was assessed via
Sangerbox 3.0 (http://sangerbox.com/) using Gene Set
Enrichment Analysis (GSEA). Gene sets were considered significantly
enriched when normalized enrichment score (NES)>1, P<0.05 and
FDR <0.05.
Association analysis between CDK1 and
hub genes
GO and GSEA revealed a prominent association of CDK1
with mitotic cell cycle regulation in glioma. Genes involved in the
cell cycle were intersected between the Metascape and GSEA datasets
using a Venn diagram (http://jvenn.toulouse.inra.fr/app/usermanual.html).
The 29 overlapping genes were imported into the STRING database
(https://string-db.org/) to construct a
high-confidence protein-protein interaction (PPI) network
(interaction score >0.9; FDR <0.01). The resulting network
was visualized in Cytoscape, and the top 8 hub proteins showing
co-expression coefficients of >0.9 relative to CDK1 were
identified. Spearman correlation analysis using the Sangerbox
platform (http://sangerbox.com/) confirmed strong
correlations (ρ>0.65) between CDK1 and these hub genes.
Expression and survival analyses were subsequently performed for
each hub gene using TCGA dataset, assessing their clinical
relevance in glioma prognosis.
Statistical analysis
All experimental data were analyzed and visualized
using R software (v4.2.2) and GraphPad Prism 8.0 (Dotmatics),
respectively. Overall survival (OS) differences were assessed using
the log-rank test and illustrated via Kaplan-Meier survival curves.
The normality of the data distribution was assessed using the
Shapiro-Wilk test prior to statistical comparisons. The statistical
analysis of western blot data (from 37 paired glioma and adjacent
normal tissues) was performed using the non-parametric Wilcoxon
matched-pairs signed-rank test. Statistical comparisons between two
independent groups (such as data derived from CDK1 mRNA expression
in GEO datasets and the EdU, AO/EB, Transwell and apoptotic assays)
were performed using the unpaired t-test for parametric data and
the Mann-Whitney U test for non-parametric data. For comparisons
among more than two groups under one independent variable (such as
transfection efficiency validation across the Blank, NC and siRNA
groups), one-way analysis of variance (ANOVA) with Tukey's post hoc
test was used for parametric data, while the Kruskal-Wallis test
followed by Dunn's post hoc test was applied to non-parametric
data. In cases involving two independent variables (such as CCK-8
assay across days 1 to 7, wound healing assay at 0, 24, 48 and 72 h
and the γ-H2AX assay at 0.5, 2, 6 and 24 h), a two-way ANOVA was
used to assess main effects and interactions, with Sidak's test
employed for multiple comparisons. Correlations were determined
using Pearson's correlation coefficient. P<0.05 was considered
to indicate a statistically significant difference.
Results
Research workflow and sample
characteristics
The overall research workflow is summarized in
Fig. 1. Based on predefined
screening criteria, gene expression profiles (GSE29796, GSE4290,
GSE50161 and GSE7696) and corresponding clinical data were
retrieved from the GEO database. These datasets included 52, 153,
117 and 80 glioma specimens, respectively, alongside 20, 23, 13 and
4 non-tumorous controls. Clinicopathological information, such as
age, tumor grade, histological classification, 1p/19q codeletion
and IDH mutation status, was obtained from the CGGA and TCGA
databases. Additional data on chemoradiotherapy history and MGMT
promoter methylation were available exclusively from the CGGA
dataset. Detailed clinical characteristics are provided in Table SI.
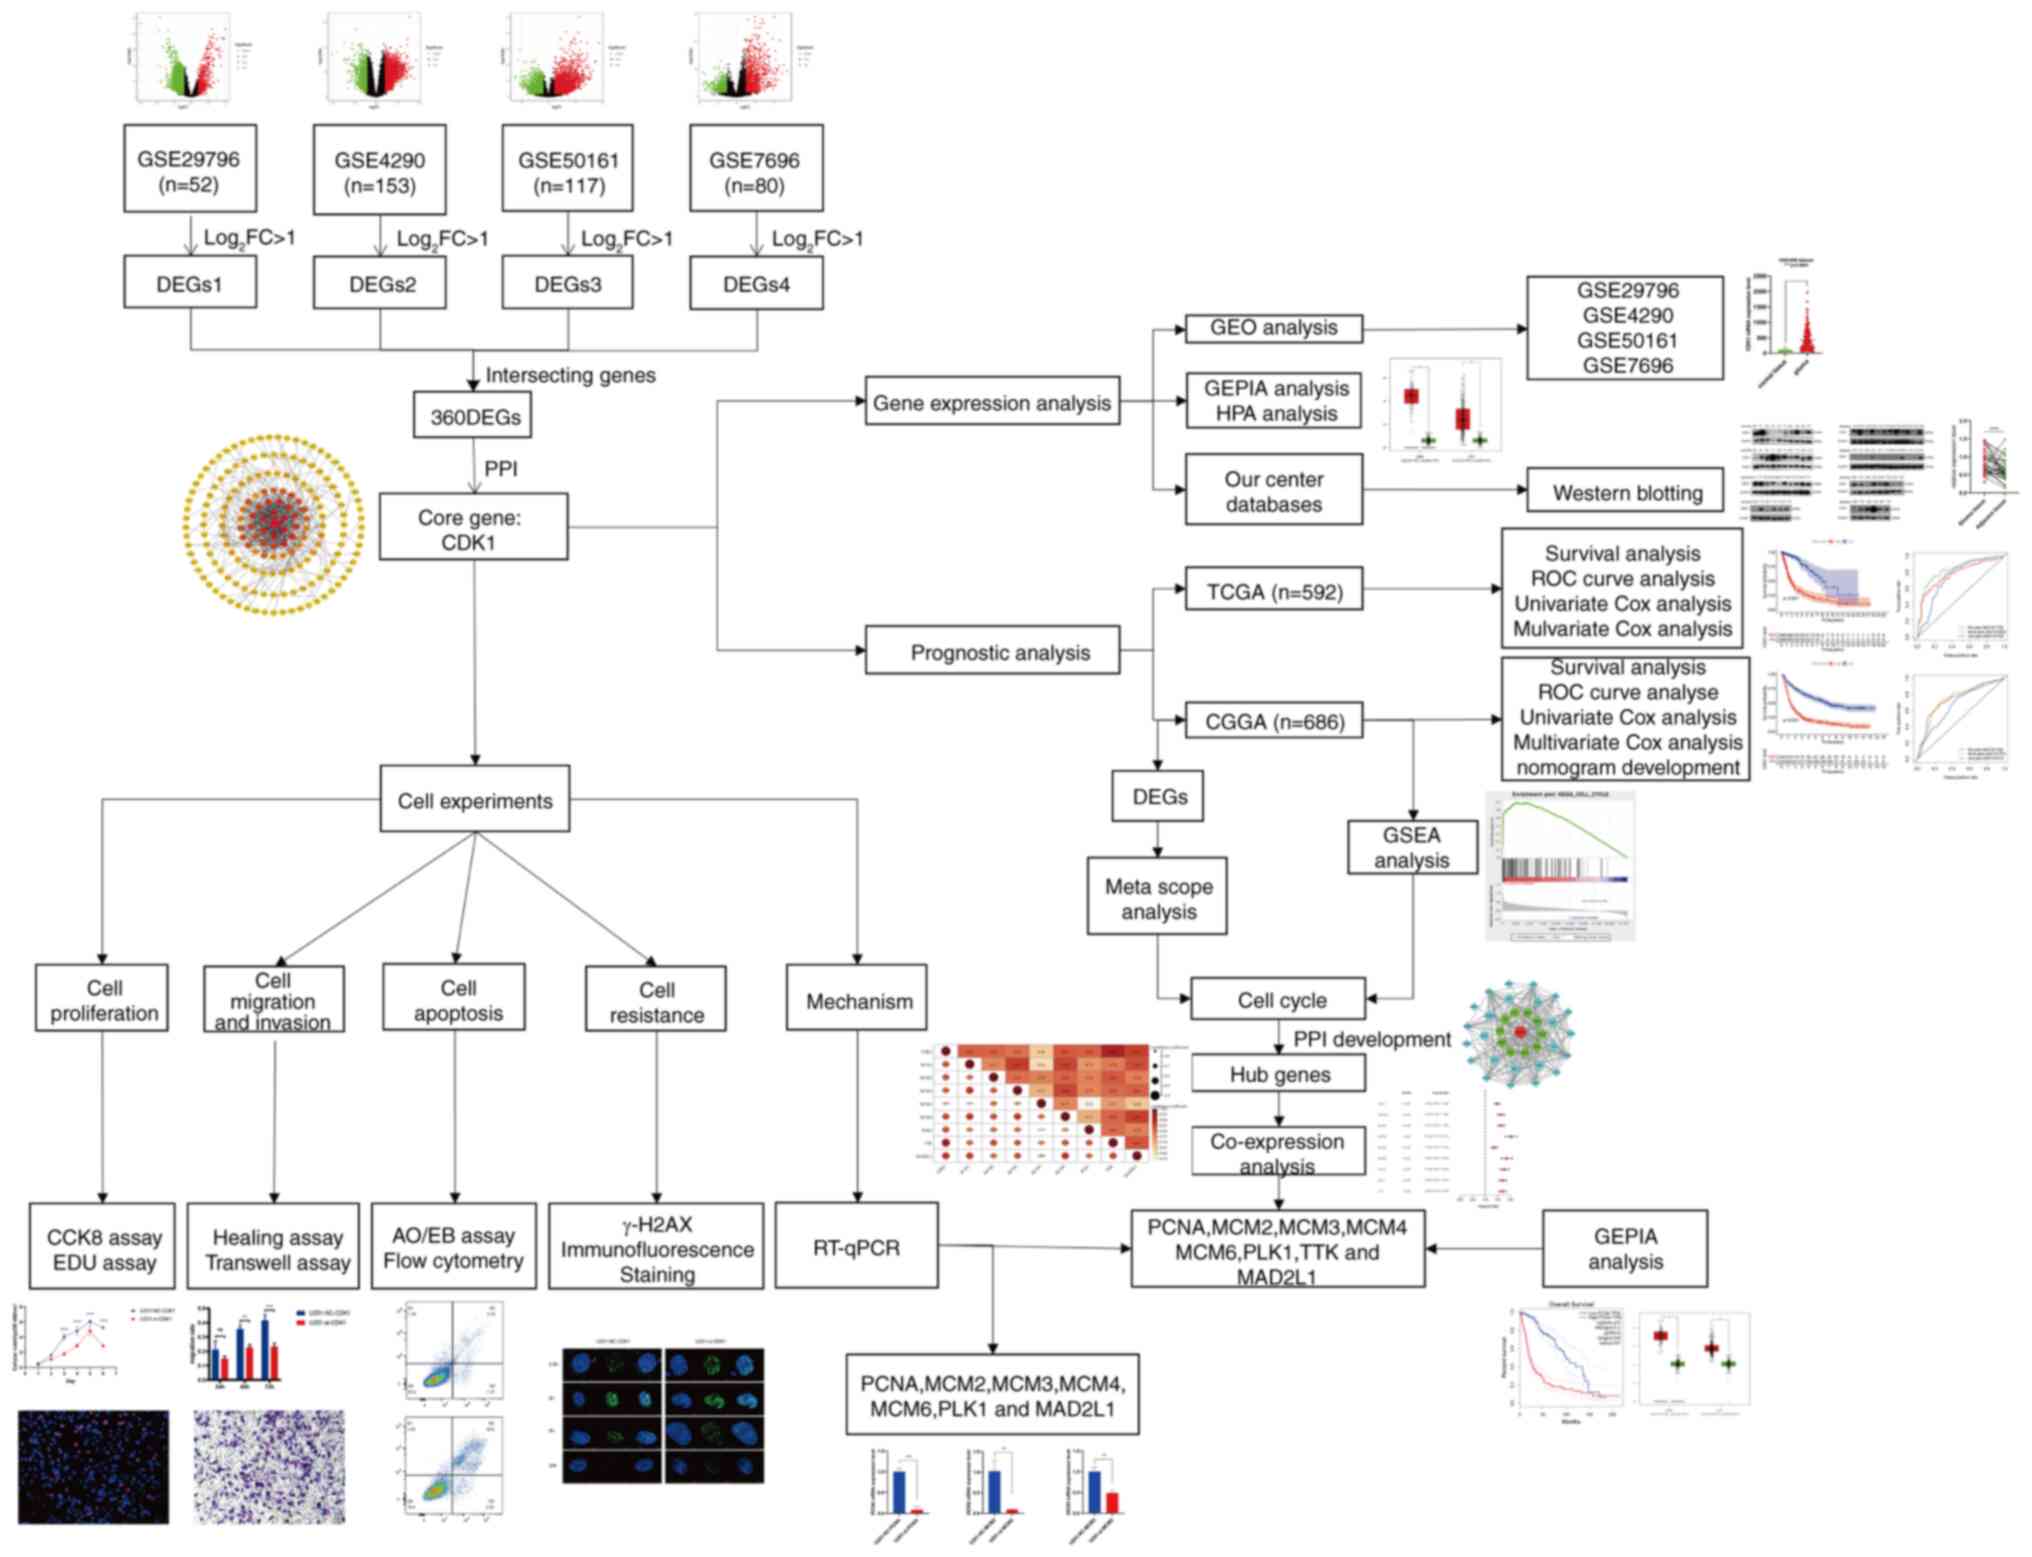 | Figure 1.Workflow of the whole study. FC, fold
change; DEGs, differentially expressed genes; CDK1,
cyclin-dependent kinase 1; GEPIA, Gene Expression Profiling
Interactive Analysis; N, normal tissue; T, tumor; CGGA, Chinese
Glioma Genome Atlas; TCGA, The Cancer Genome Atlas; ROC, receiver
operating characteristic; AUC, area under the curve; PRS,
prognostic risk score; IDH, isocitrate dehydrogenase; MGMT,
O-6-methylguanine-DNA methyltransferase; OS, overall survival; WHO,
World Health Organization; NC, negative control; si, small
interfering RNA; OD, optical density; AO/EB, acridine
orange/ethidium bromide; GSEA, Gene Set Enrichment Analysis; PPI,
protein-protein interaction; PCNA, proliferating cell nuclear
antigen; MCM2/3/4/6, minichromosome maintenance complex component
2/3/4/6; PLK1, polo-like kinase 1; MAD2L1, mitotic arrest deficient
2 like 1; GBM, glioblastoma; LGG, low-grade glioma. |
Identification of important genes
involved in glioma initiation and progression
Gene expression profiles from the GSE29796, GSE4290,
GSE50161 and GSE7696 datasets were stratified into tumor and
non-tumor groups for differential expression analysis. DEGs were
identified using a significance threshold of P<0.05 and
|log2FC|>1. The GSE29796 dataset included 5,715 DEGs
(599 upregulated and 5,116 downregulated; Fig. 2A), GSE4290 included 2,450 DEGs
(1,425 upregulated and 1,025 downregulated; Fig. 2B), GSE50161 included 4,696 DEGs
(2,320 upregulated and 2,376 downregulated; Fig. 2C) and GSE7696 included 1,532 DEGs
(915 upregulated and 617 downregulated; Fig. 2D). Intersecting DEGs across all four
datasets via a Venn diagram (Fig.
2E) yielded 360 commonly dysregulated genes. A PPI network was
generated using STRING and 180 proteins were imported into
Cytoscape for visualization. Subsequent topological analysis using
the cytoHubba plugin identified CDK1 as the core hub gene with the
highest degree value (Fig. 2F).
 | Figure 2.Core gene and its expression levels
in normal tissue and glioma were retrieved. (A) Volcano plots of
the 5,715 DEGs in the GSE29796 dataset (599 upregulated and 5,116
downregulated). (B) Volcano plots of the 2,450 DEGs in the GSE4290
dataset (1,425 upregulated and 1,025 downregulated). (C) Volcano
plots of the 4,696 DEG in the GSE50161 dataset (2,320 upregulated
and 2,376 downregulated). (D) Volcano plots of the 1,532 DEGs in
the GSE7696 dataset (915 upregulated and 617 downregulated). The
red nodes represent the significantly upregulated genes with
log2FC>1 and P<0.05. The green nodes represent the
significantly downregulated genes with log2FC<-1 and P<0.05.
(E) Intersecting genes of the four groups of DEGs are displayed by
Venn diagram. (F) Protein-protein interaction network was
constructed and the core protein with the highest degree of
topology value was screened out, based on the STRING website and
Cytoscape visualization software. Comparison of CDK1 mRNA
expression levels in normal tissue and glioma using the (G)
GSE29796, (H) GSE4290, (I) GSE50161 and (J) GSE7696 datasets. (K)
CDK1 expression levels in normal tissue and glioma via GEPIA
analysis. (L) The protein levels of CDK1 in normal (intensity:
negative; quantity: none) and glioma (intensity: strong; quantity:
<25%) tissue from the Human Protein Atlas. (M) Western blot
assay and (N) Wilcoxon matched-pairs signed rank test (P<0.0001)
of 37 pairs of glioma and adjacent tissues. (O) Data from the
internal cohort showed that CDK1 expression was a statistically
significant difference between Grade 2+3 gliomas (n=20) and Grade 4
gliomas (n=17) (P=0.0018). Data are presented as mean ± SD.
*P<0.05, **P<0.01, ***P<0.001, ****P<0.0001.
Statistical significance was calculated using unpaired t-test, Mann
Whitney test or Wilcoxon matched-pairs signed rank test. FC, fold
change; DEGs, differentially expressed genes; CDK1,
cyclin-dependent kinase 1; GEPIA, Gene Expression Profiling
Interactive Analysis; N, normal tissue; T, tumor. |
CDK1 expression level in glioma
CDK1 expression across GEO datasets revealed
significantly elevated levels in glioma tissues relative to the
normal controls (Fig. 2G-J).
Consistent findings from GEPIA analyses further confirmed
upregulated CDK1 expression in both GBM and LGG cohorts (Fig. 2K). Additionally, immunohistochemical
data from the HPA database demonstrated significantly higher CDK1
protein abundance in glioma tissues compared with normal brain
tissue (Fig. 2L). To experimentally
validate these bioinformatic observations, CDK1 protein expression
in an internal cohort of 37 paired glioma and adjacent normal
tissues was assessed via western blotting. Despite the limited
cohort size, the results consistently showed elevated CDK1 protein
levels in glioma samples (P<0.0001, paired t-test; Fig. 2M and N). Furthermore, data from the
internal cohort showed CDK1 expression was significantly higher in
WHO grade 4 gliomas (n=17) than in WHO grade 2+3 gliomas (n=20)
(P=0.0018; Fig. 2O).
CDK1 upregulation is combined with a
poorer survival and prognosis in patients with glioma
Kaplan-Meier survival analysis of the CGGA dataset
revealed significantly reduced OS in patients with high CDK1
expression (log-rank P<0.001; Fig.
3A), findings that were independently validated using the TCGA
cohort (P<0.001; Fig. 3B). ROC
analysis demonstrated consistent prognostic performance across both
datasets. In the CGGA cohort, CDK1 showed predictive value for 1-,
3- and 5-year survival with area under the curves (AUCs) of 0.672,
0.751 and 0.744, respectively (Fig.
3C). Correspondingly, the TCGA dataset yielded AUCs of 0.745,
0.833 and 0.779 for the same time intervals (Fig. 3D). To assess CDK1 as an independent
prognostic determinant, univariate and multivariate Cox regression
analyses were performed using the CGGA dataset. Univariate analysis
identified significant associations between OS and CDK1 expression
[hazard ratio (HR), 1.482; 95% confidence interval (CI),
1.386–1.585; P<0.001], as well as progression status, tumor
grade, age, IDH mutation and 1p/19q codeletion status (Fig. 3E). Multivariate analysis confirmed
CDK1 as an independent prognostic factor (HR, 1.260; 95% CI,
1.173–1.355; P<0.001), alongside progression status, grade, age,
chemotherapy, IDH mutation, and 1p/19q codeletion status (Fig. 3G). The emergence of chemotherapy as
a significant prognostic factor only in the multivariate analysis
indicates that its effect is not independent but becomes evident
after accounting for other covariates. This pattern implies that
the efficacy of chemotherapy may depend on specific contexts, such
as particular molecular subgroups (such as gliomas with MGMT
promoter methylation), where a significant benefit might be diluted
and non-significant in a heterogeneous cohort under univariate
assessment. These associations were validated using the TCGA
dataset (Fig. 3F and H).
Collectively, these results establish CDK1 as an independent
prognostic biomarker for glioma. A prognostic nomogram integrating
tumor grade, IDH mutation status, MGMT promoter methylation, 1p/19q
codeletion status and CDK1 expression was constructed using the
CGGA cohort (Fig. 3I). Among the
variables integrated into the nomogram, CDK1 expression was
established as a key driver of the predictive power of the model
based on variable importance analysis. Calibration plots
demonstrated good concordance between predicted and observed
survival probabilities, particularly for 3-year OS (Fig. 3J-L).
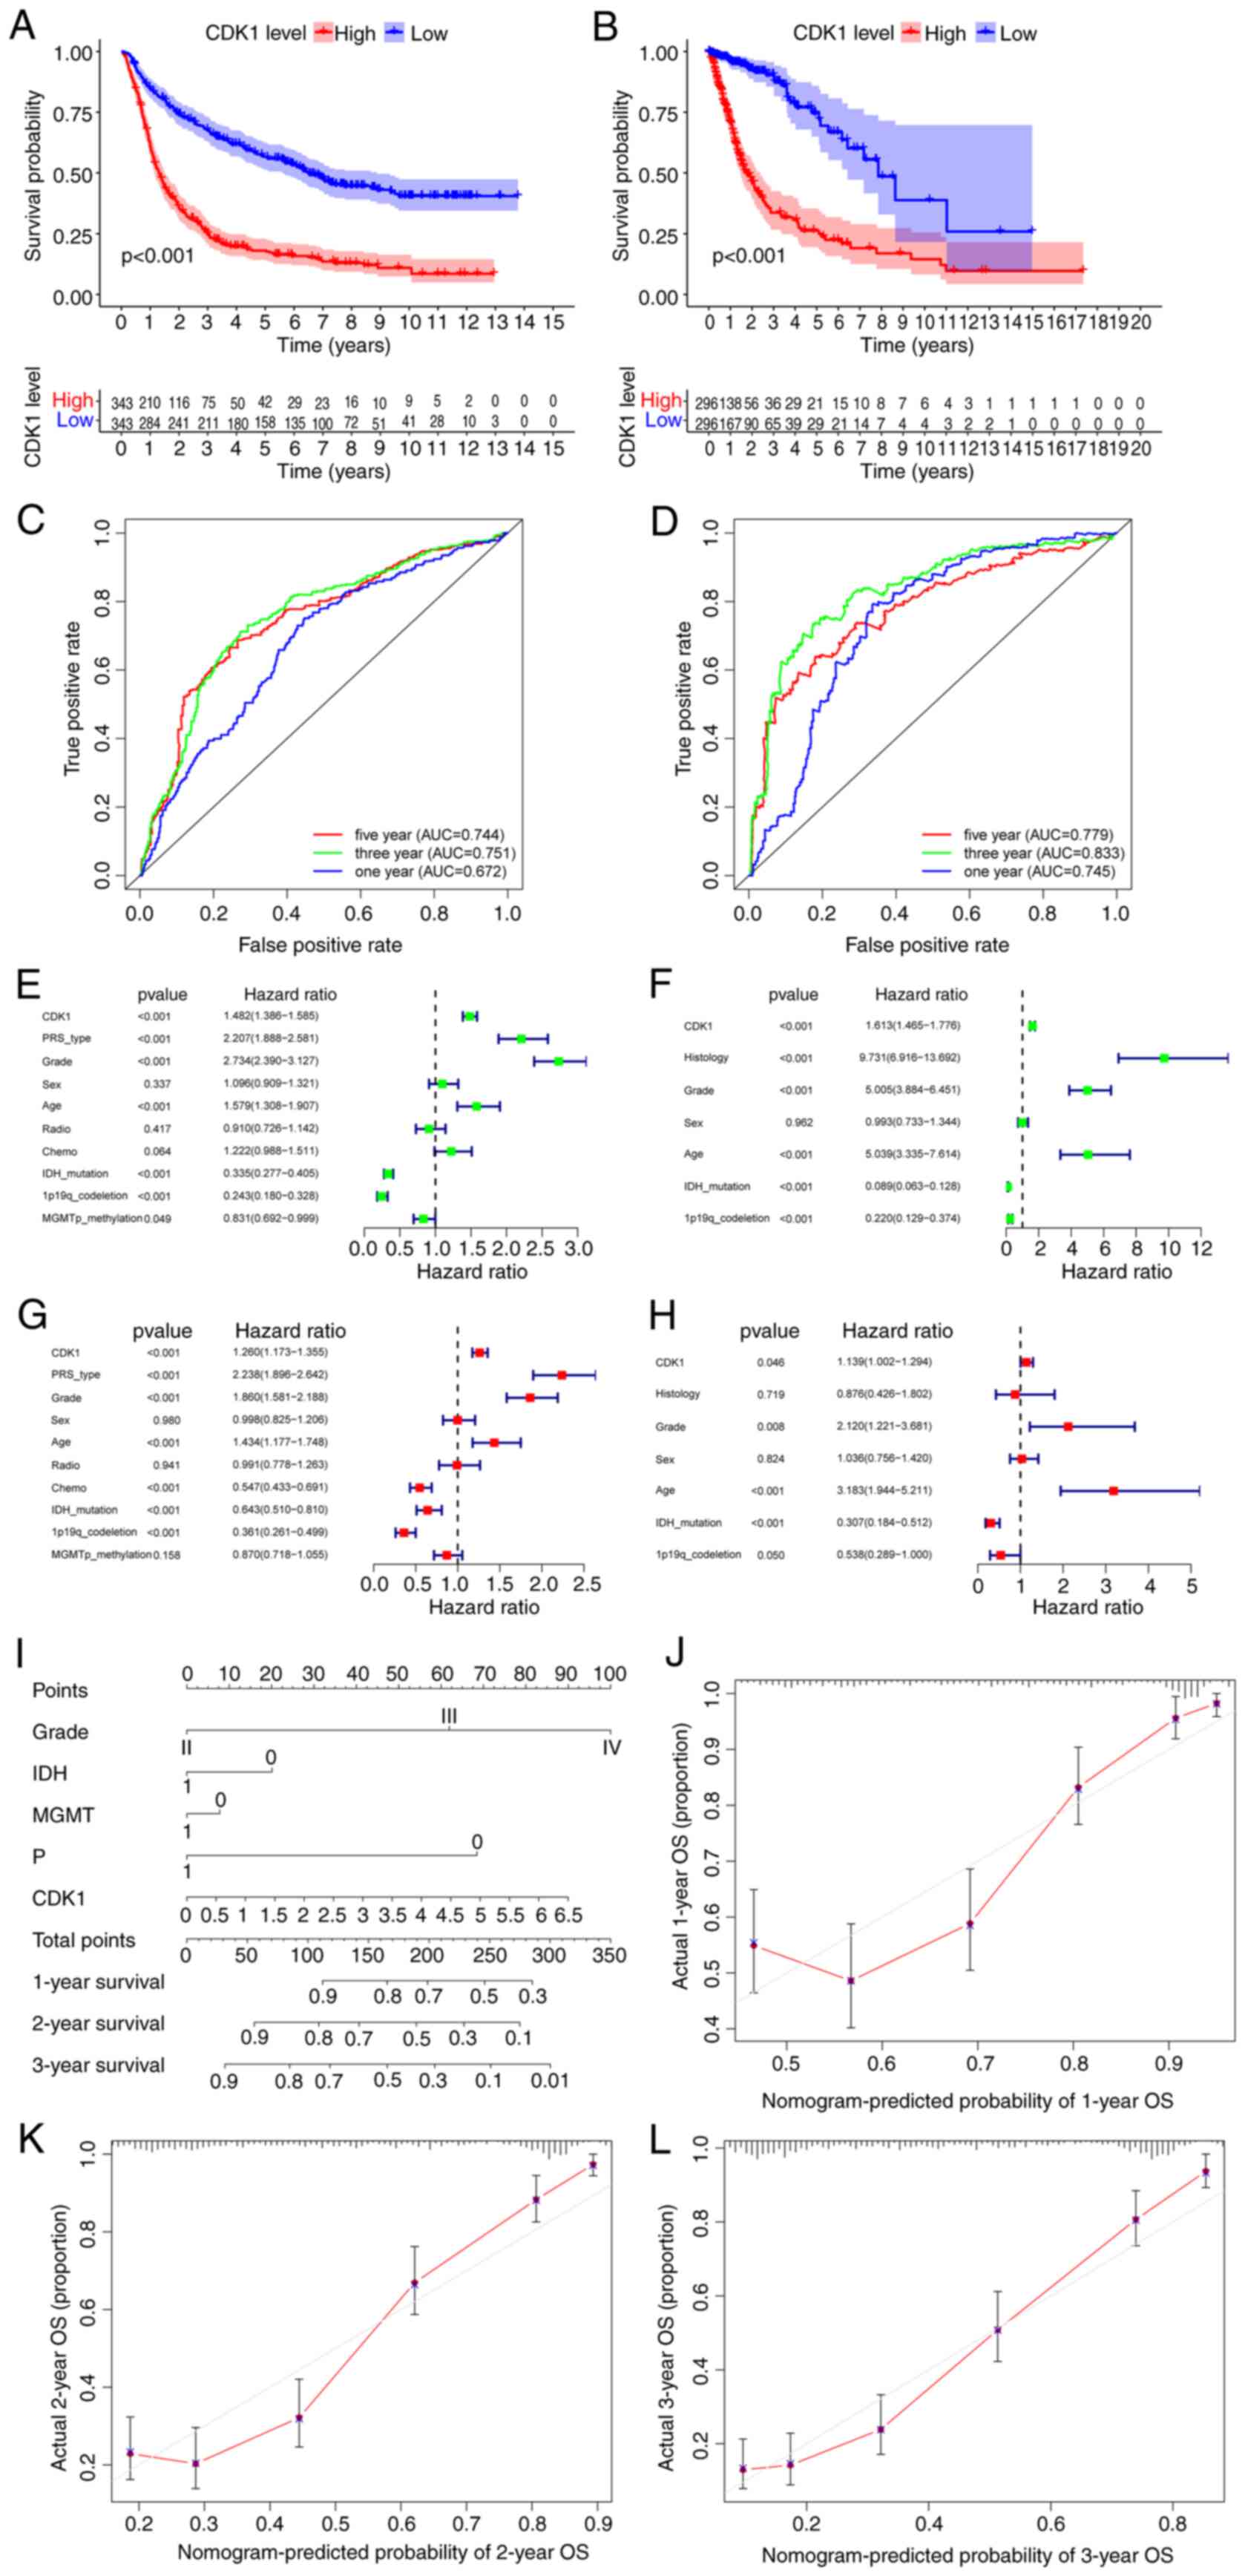 | Figure 3.Survival analysis and independent
prognostic analysis of CDK1 based on bioinformatics analysis.
Survival analysis of the high and low CDK1 groups in patients with
glioma from the (A) CGGA and (B) TCGA datasets. The ROC curves of
CDK1 at 1, 3 and 5 year survival in the (C) CGGA and (D) TCGA
datasets. Univariate analysis of CDK1 in the (E) CGGA and (F) TCGA
datasets. Multivariate analysis of CDK1 in the (G) CGGA and (H)
TCGA datasets. (I) Prognostic nomogram constructed based on the
CGGA dataset including clinical information to predict the survival
of patients with glioma. Calibration curves of the nomogram
constructed based on the CGGA dataset to predict survival at (J) 1
year, (K) 2 years and (L) 3 years. CDK1, cyclin-dependent kinase 1;
CGGA, Chinese Glioma Genome Atlas; TCGA, The Cancer Genome Atlas;
ROC, receiver operating characteristic; AUC, area under the curve;
PRS, prognostic risk score; IDH, isocitrate dehydrogenase; MGMT,
O-6-methylguanine-DNA methyltransferase; OS, overall survival. |
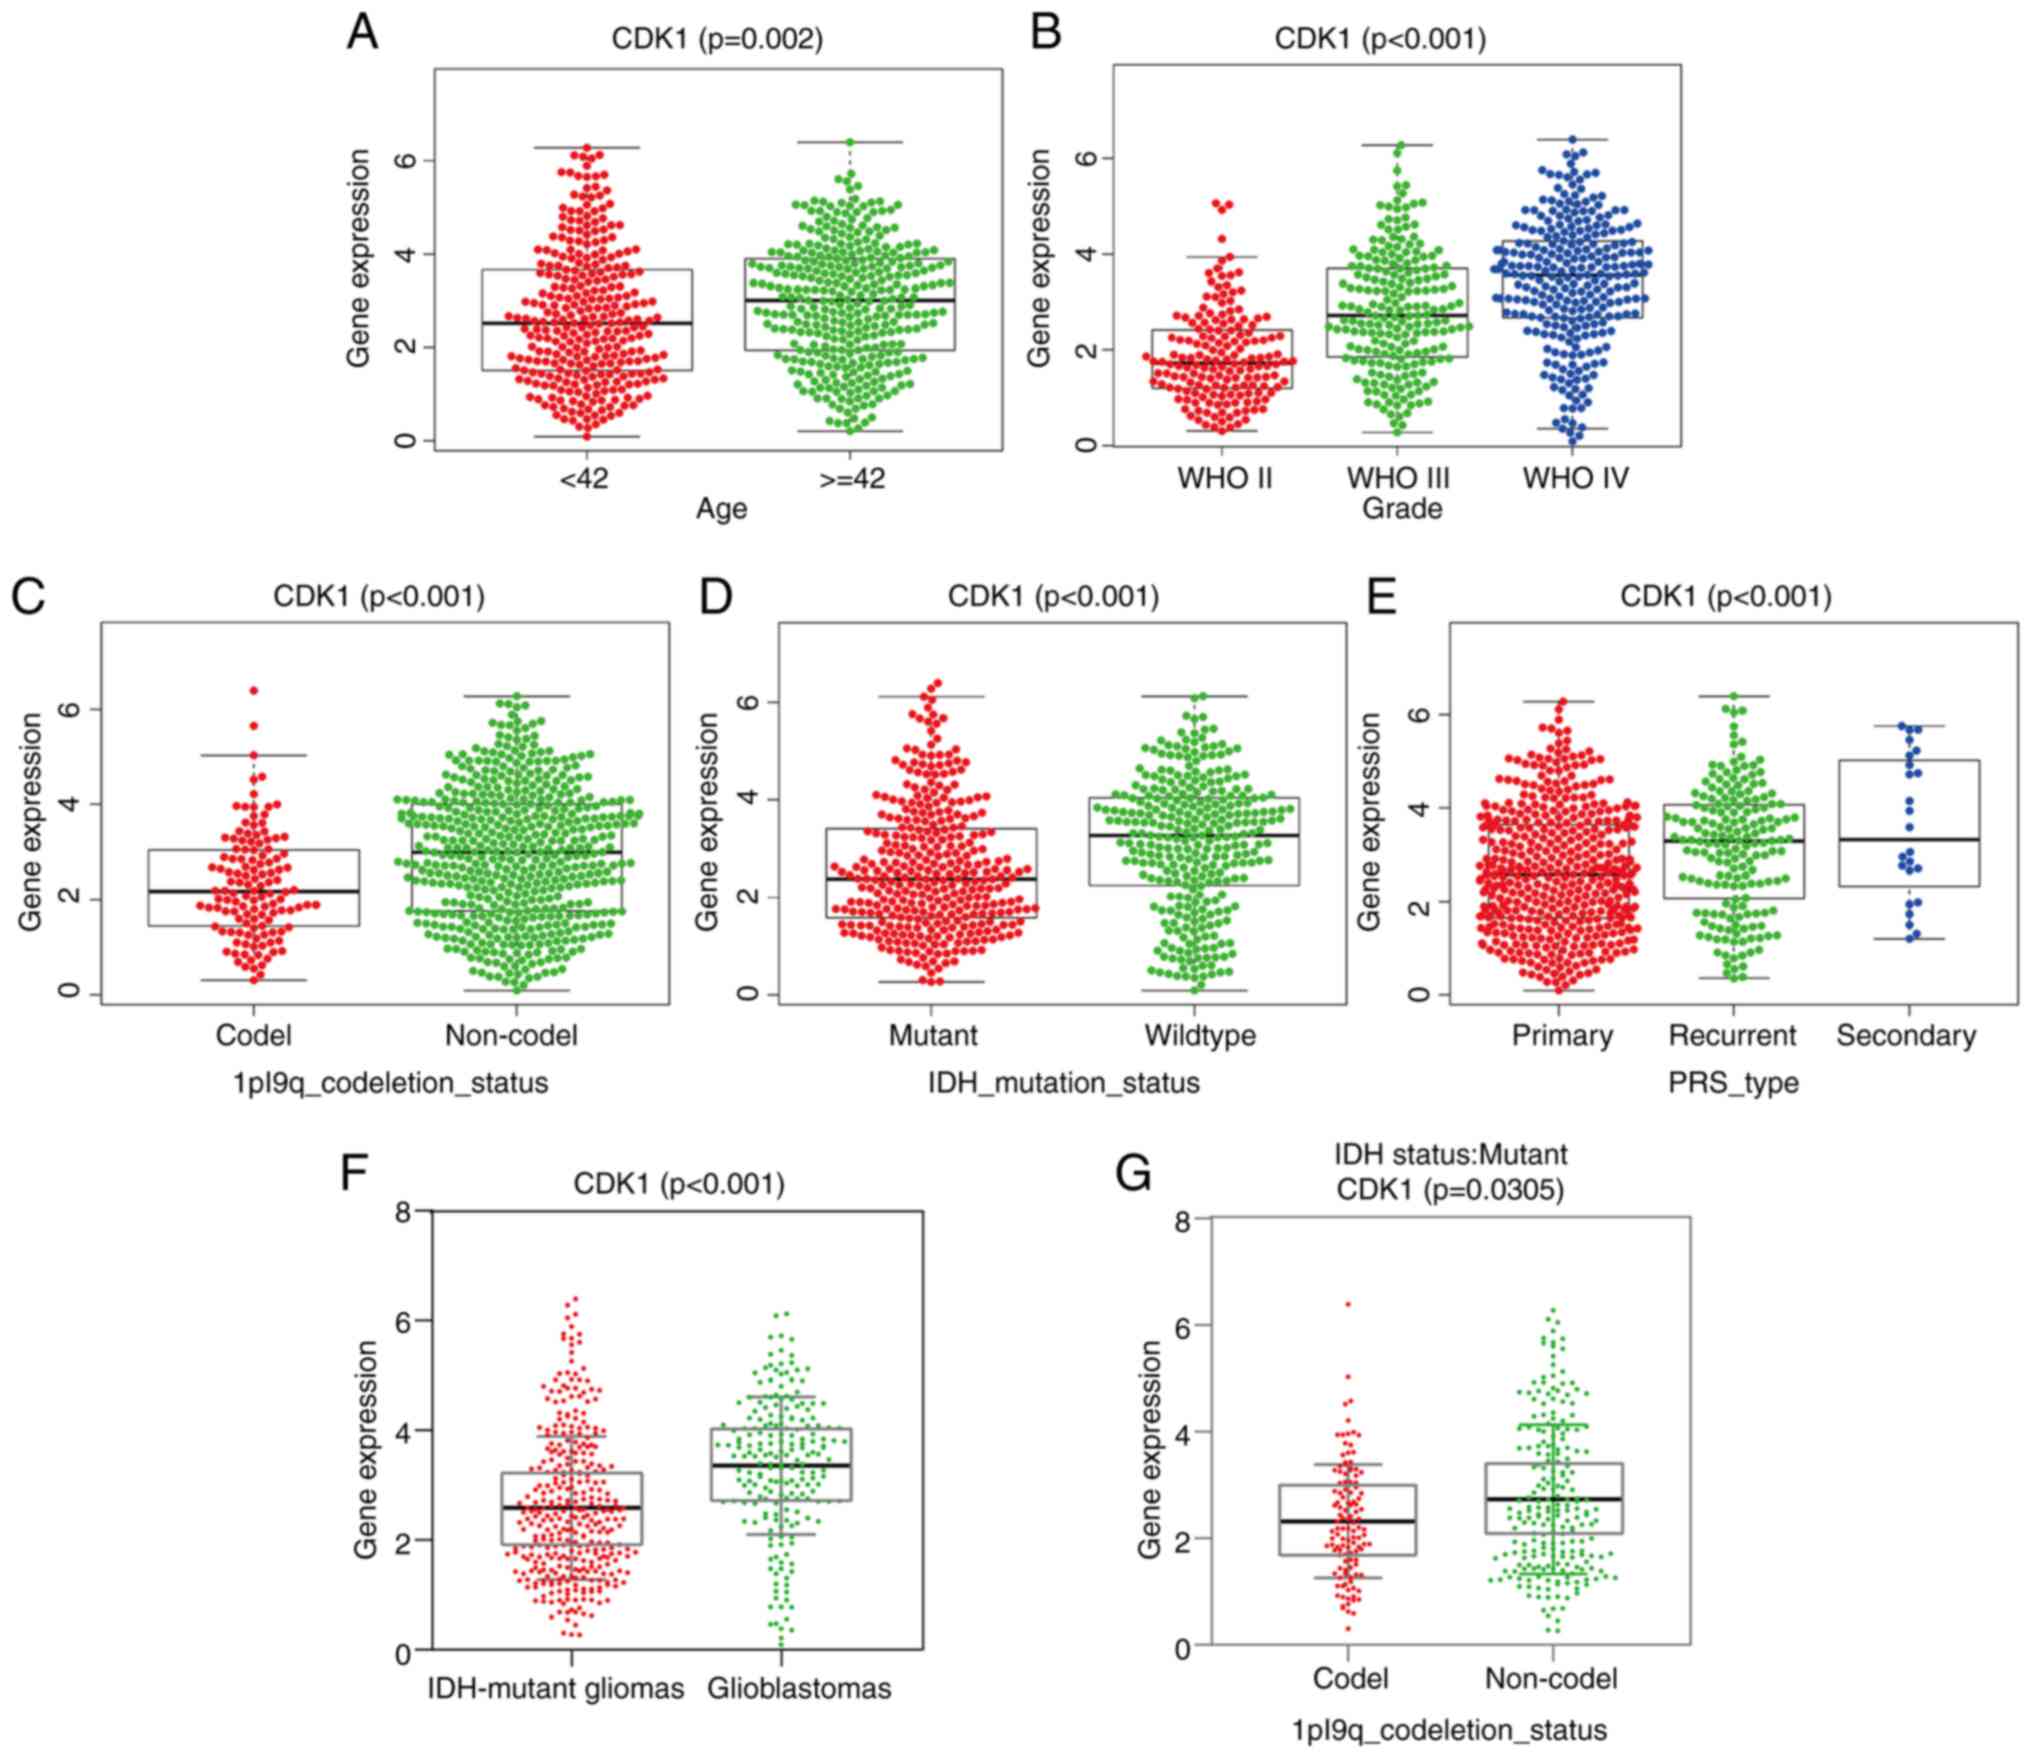
Relative analysis of CDK1 gene
expression and clinicopathological features based on the CGGA
dataset
CDK1 expression was significantly elevated in
patients >42 years (P=0.002; Fig.
4A) and increased progressively with tumor grade (P<0.001;
Fig. 4B). Conversely, significantly
lower CDK1 levels were observed in IDH-mutant and 1p/19q codeleted
gliomas (both P<0.001; Fig. 4C and
D). Recurrent and secondary gliomas exhibited significantly
higher CDK1 expression compared with primary tumors (P<0.001;
Fig. 4E). Stratification by
molecular subtype further revealed CDK1 upregulation in IDH-wild
type glioblastomas relative to IDH-mutant astrocytomas and
oligodendrogliomas (P<0.001; Fig.
4F). Within the IDH-mutant subgroup, astrocytomas (IDH-mutant,
1p/19q non-codel) displayed higher CDK1 expression than
oligodendrogliomas (IDH-mutant, 1p/19q codeleted) (P=0.0305;
Fig. 4G), underscoring its
subtype-specific regulation.
CDK1 facilitates the malignant
biological phenotypes of glioma cells
Construction of glioma cells line with CDK1
knockdown
To investigate CDK1 function, U251MG and LN229
glioma cell lines were transiently transfected with
sequence-specific CDK1 siRNA. Western blot analysis confirmed the
efficient knockdown of CDK1 protein expression in both the U251MG
and LN229 cell lines transfected with CDK1-siRNA, compared with the
Blank and negative control (NC) groups (P<0.05; Fig. 5A-D).
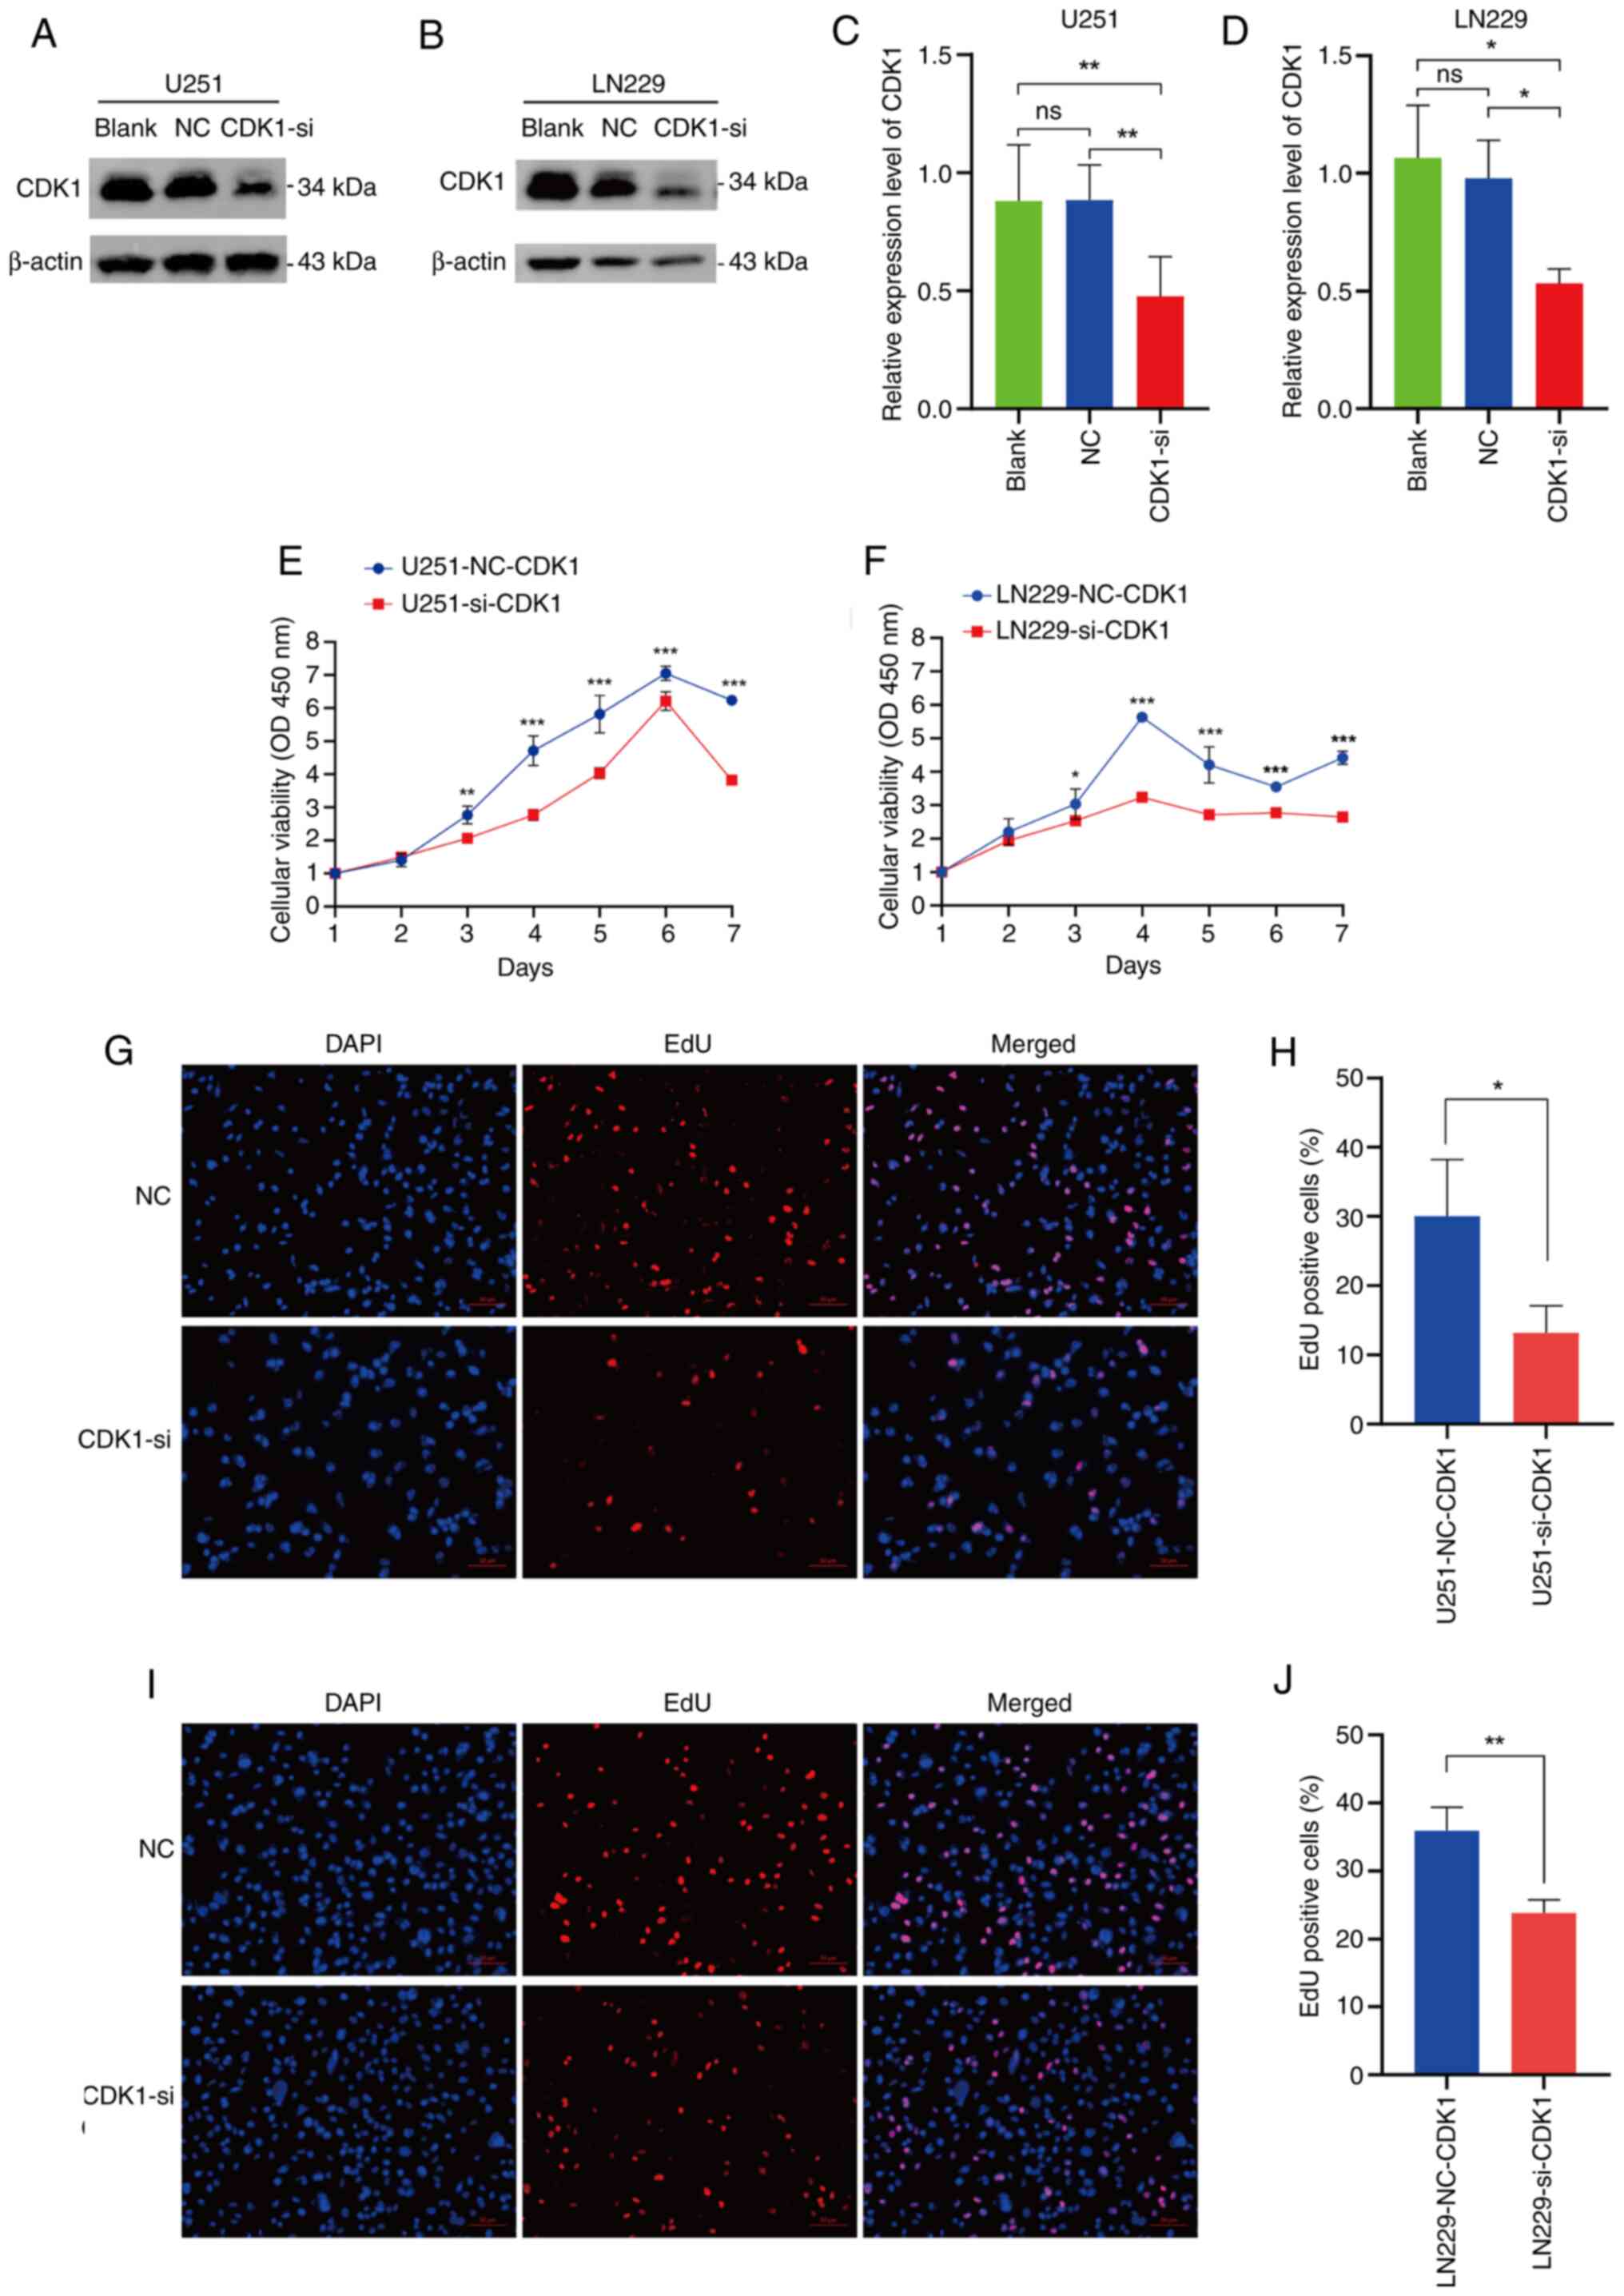 | Figure 5.Verification of CDK1 knockdown and
its role in the proliferative ability of glioma cells. Validation
of CDK1 knockdown was achieved through western blot analysis in the
(A) U251MG and (B) LN229 glioma cell lines. (C and D) Statistical
comparisons of the western blot data for the (C) U251MG (Blank vs.
NC, P=0.9992; Blank vs. CDK1-si, P=0.0057; NC vs. CDK1-si,
P=0.0053) and LN229 (Blank vs. NC, P=0.7960; Blank vs. CDK1-si,
P=0.0161; NC vs. CDK1-si, P=0.0343) cell lines (n=3, each group).
(E and F) Cell Counting Kit-8 cell viability assays demonstrated a
decrease in proliferation potential upon CDK1 knockdown in (E)
U251MG and (F) LN229 cells (n=4, each group). (G) Representative
images (magnification, ×10) and (H) quantitative analysis of the
EdU assay performed in the U251MG cell line (NC vs. CDK1-si,
P=0.0325; n=3, each group). (I) Representative images
(magnification, ×10) and (J) quantitative analysis of the EdU assay
performed in the LN229 cell line (NC vs. CDK1-si, P=0.0057; n=3,
each group). Data are presented as mean ± SD. Statistical
significance was calculated using one-way analysis of variance
followed by Tukey's multiple comparisons test, unpaired t-test or
one-way analysis of variance followed by Sidak's multiple
comparisons test. *P<0.05, **P<0.01, ***P<0.001. CDK1,
cyclin-dependent kinase 1; NC, negative control; si, small
interfering (RNA); OD, optical density. |
CDK1 positively regulates the cell
proliferative ability of glioma cells
CCK-8 assays demonstrated that CDK1 knockdown
significantly suppressed proliferation in both U251MG and LN229
cells (P<0.001; Fig. 5E and F).
EdU fluorescence staining confirmed that proliferation was
significantly reduced in the CDK1-siRNA group compared with the NC
(U251: P=0.0325; Fig. 5G and H)
(LN229: P=0.0057; Fig. 5I and J).
These results establish CDK1 as a potential promoter of glioma cell
proliferation.
CDK1 enhances the migration and
invasive abilities of glioma cells
Transwell migration assays revealed a significant
reduction in migrated cell counts following CDK1 knockdown (U251:
P<0.001; Fig. 6A and B) (LN229:
P=0.0002; Fig. 6C and D).
Similarly, Matrigel invasion assays demonstrated significant
suppression of invasive potential in CDK1-siRNA cells (U251:
P<0.001; Fig. 6E and F) (LN229:
P=0.0003; Fig. 6G and H). Scratch
wound healing assays in U251MG cells confirmed progressive
inhibition of migration at 48 and 72 h post-transfection (P=0.0027
and P<0.0001, respectively; Fig. 6I
and J). Collectively, these findings underscore the role of
CDK1 in driving glioma cell motility and invasiveness.
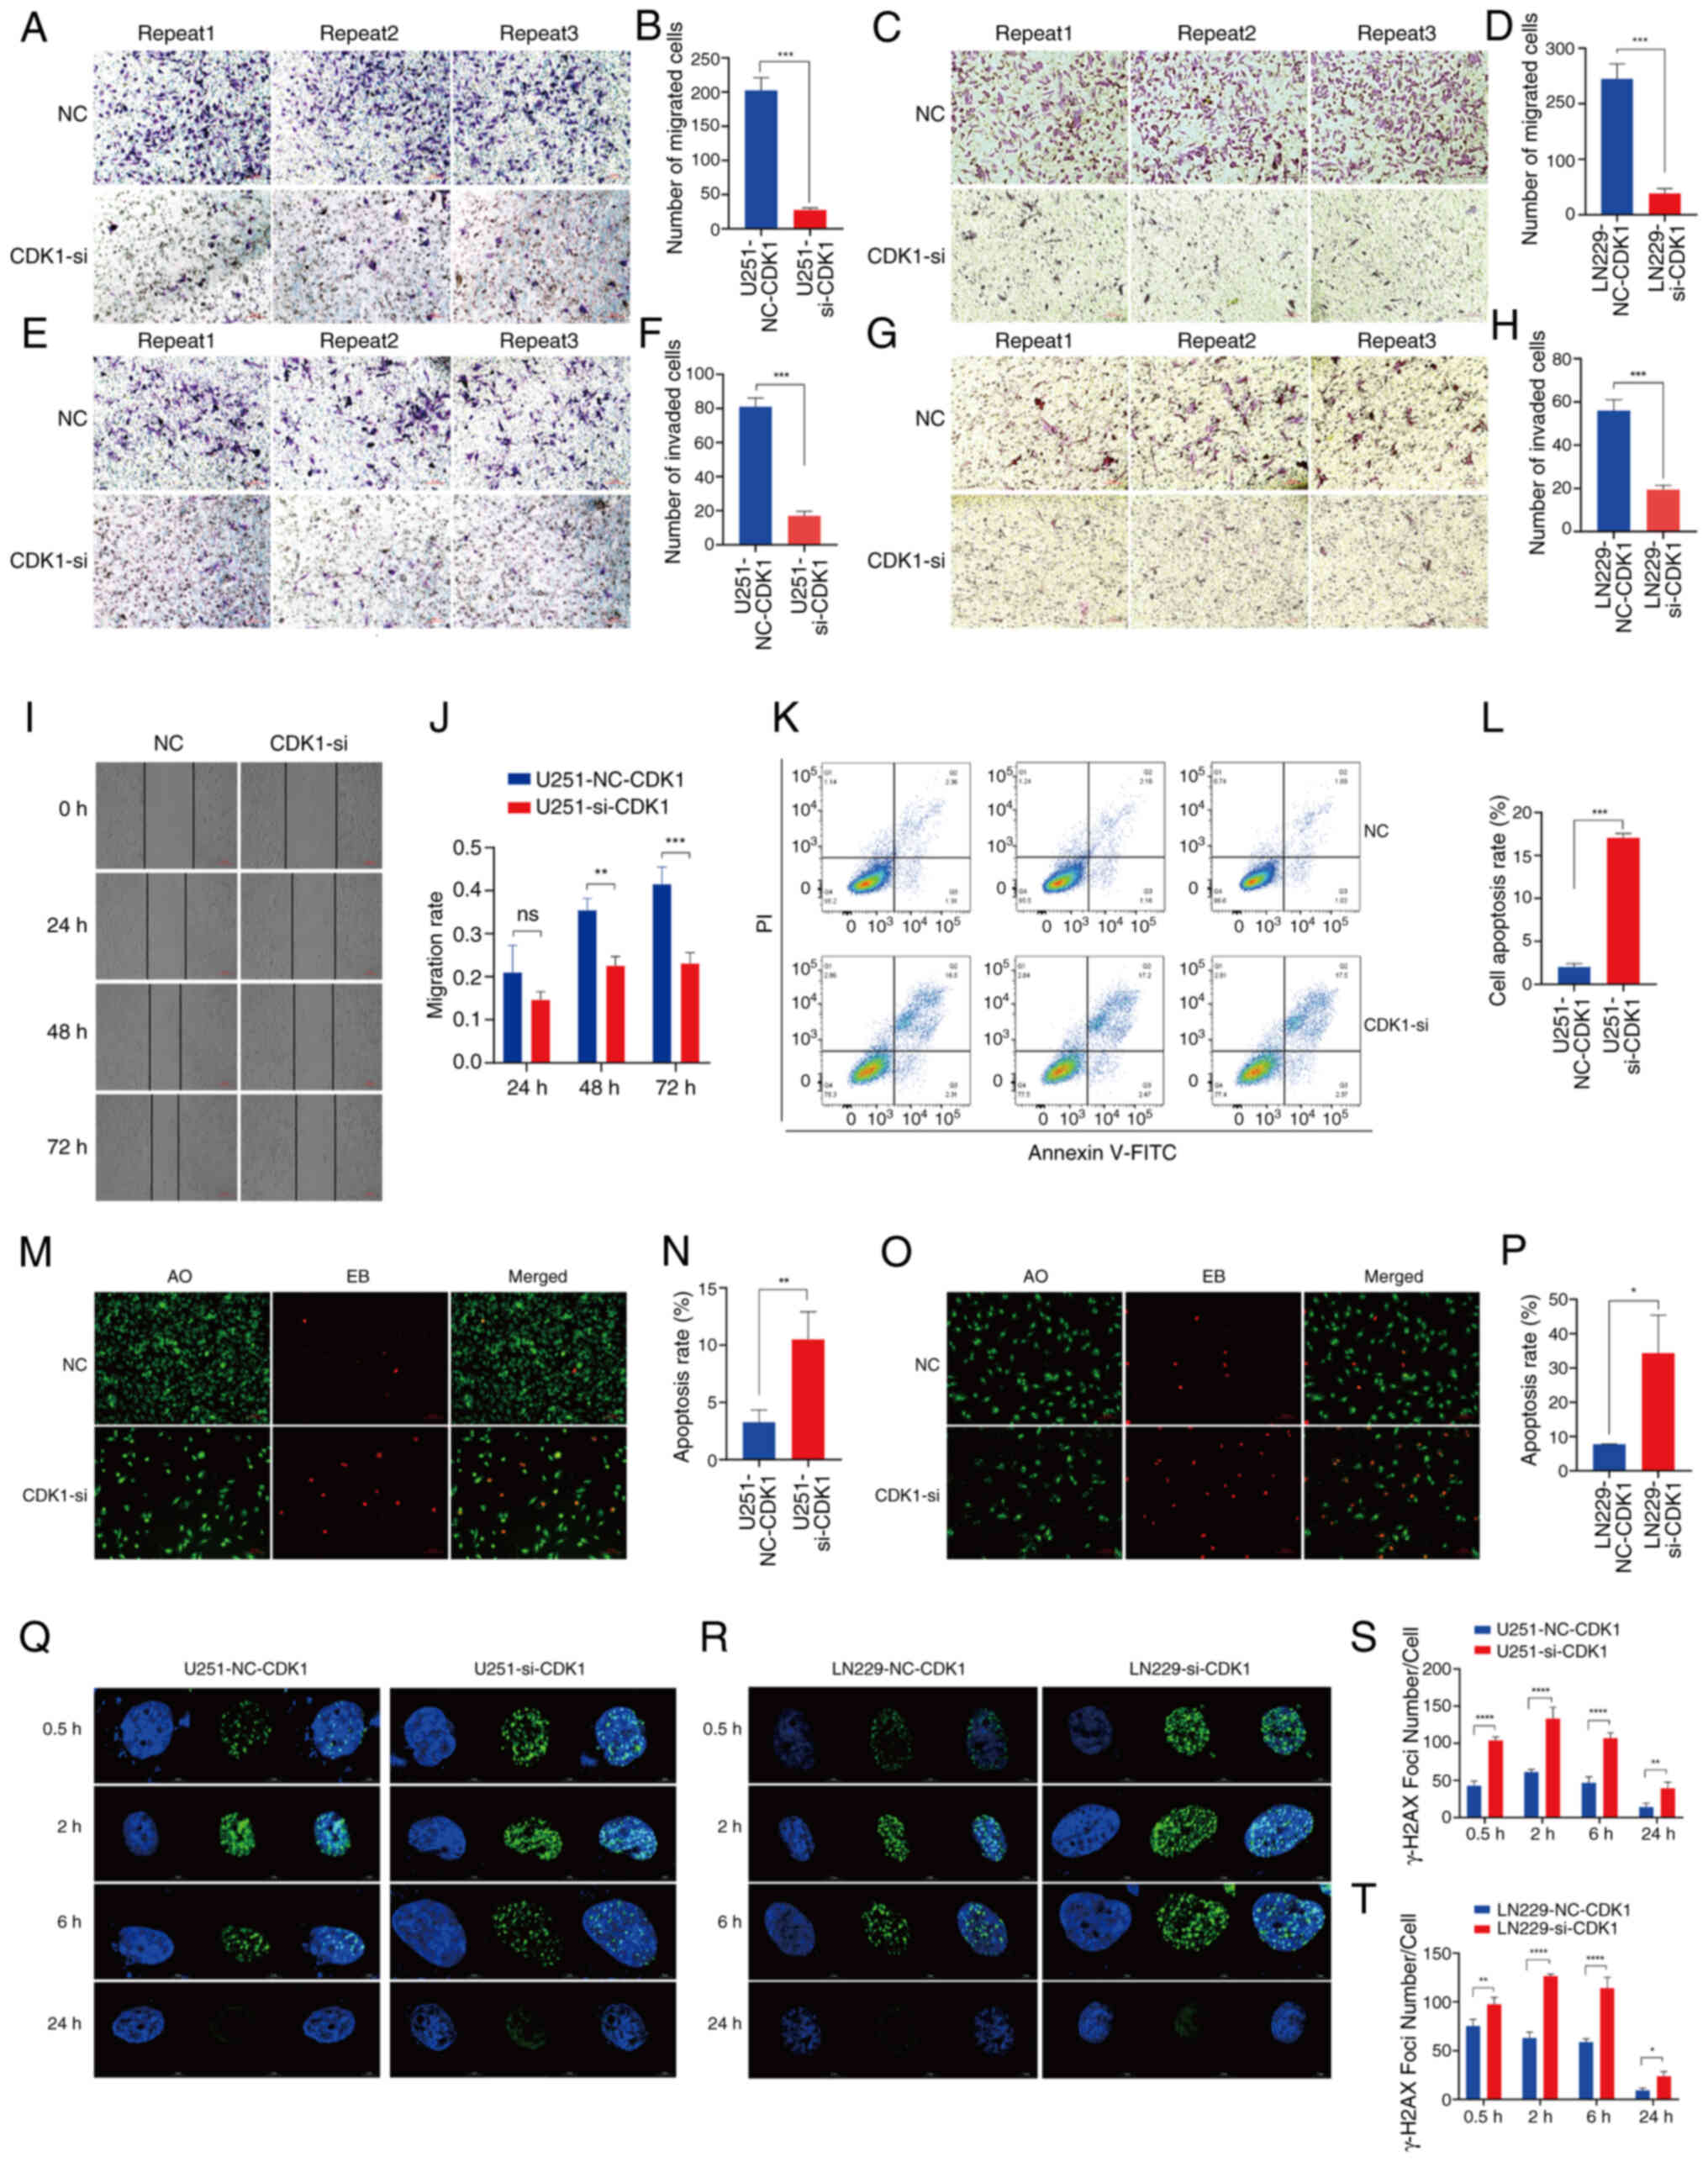 | Figure 6.Impact of CDK1 on the
migration/invasion capability and DNA damage repair ability of
glioma cells. (A) Representative images of the U251MG cell
Transwell migration assay (magnification, ×10) and the (B)
quantitative analysis of the number of migrated cells (NC vs.
CDK1-si, P<0.001; n=3). (C) Representative images of the LN229
cell Transwell migration assay (magnification, ×10) and the (D)
quantitative analysis of the number of migrated cells (NC vs.
CDK1-si, P=0.0002; n=3). (E) Representative images of the U251MG
cell Transwell invasion assay (magnification, ×10) and the (F)
quantitative analysis (NC vs. CDK1-si, P<0.001; n=3). (G)
Representative images of the LN229 cell Transwell invasion assay
(magnification, ×10) and the (H) quantitative analysis (NC vs.
CDK1-si, P=0.0003; n=3). (I) The assessment of cell migration via
scratch experiments demonstrated a significant effect of CDK1
knockdown on reducing glioma cell motility. (J) Statistical results
of the U251MG cell line migration assay (NC vs. CDK1-si, 24 h
P=0.1445; 48 h P=0.0027; 72 h P=0.0001; n=3). (K and L) Analysis of
apoptosis by flow cytometry using Annexin V-FITC and PI staining in
U251MG cells. (K) Representative dot plots and (L) quantitative
analysis (NC vs. CDK1-si, P<0.001; n=3). (M and N) Detection of
apoptosis by AO/EB fluorescence staining in U251MG cells. (M)
Representative fluorescence images (magnification, ×10) and the (N)
quantitative analysis (NC vs. CDK1-si, P=0.0089; n=3). (O and P)
Detection of apoptosis by AO/EB fluorescence staining in LN229
cells. (O) Representative fluorescence images (magnification, ×10)
and the (P) quantitative analysis (NC vs. CDK1-si, P=0.0143; n=3).
Images of γ-H2AX foci formed in (Q) U251MG and (R) LN229 cell lines
at 0.5, 2, 6 and 24 h after 5 Gy radiation. The statistical
analysis of γ-H2AX foci formed in (S) U251MG and (T) LN229 cell
lines (NC vs. CDK1-si; n=3). Data are presented as mean ± SD.
Statistical significance was calculated using unpaired t-test or
one-way analysis of variance followed by Sidak's multiple
comparisons test. *P<0.05, **P<0.01, ***P<0.001,
****P<0.0001. ns, not significant. CDK1, cyclin-dependent kinase
1; NC, negative control; si, small interfering (RNA); AO/EB,
acridine orange/ethidium bromide. |
CDK1 inhibits glioma cell
apoptosis
Flow cytometry analysis revealed that RNA
interference-mediated CDK1 knockdown resulted in a 7-fold increase
in apoptosis relative to the NC group (P<0.001; Fig. 6K and L). AO/EB staining, a
dual-fluorescence apoptosis assay, exploits the ability of AO to
permeate intact membranes, intercalate with nuclear DNA and emit
bright green fluorescence. By contrast, EB penetrates only cells
with compromised membranes, binds nuclear DNA and produces
orange-red fluorescence. Accordingly, apoptotic cells exhibit
uniform, condensed or fragmented red-orange fluorescent nuclei,
whereas viable cells display diffuse green fluorescence. AO/EB
staining of U251MG and LN229 glioma cells demonstrated
significantly increased red fluorescence in siRNA-treated groups,
corresponding to 3.2-fold and 4.4-fold elevations in apoptotic
rates, respectively (U251MG: P=0.0089; LN229: P=0.0143; Fig. 6M-P). These findings collectively
confirm that CDK1 suppression significantly enhanced apoptosis in
glioma cells.
CDK1 boosts DNA damage repair ability
in glioma cells
X-ray-induced DNA double-strand break (DSB) repair
following 5 Gy irradiation was evaluated using γ-H2AX
immunofluorescence (Fig. 6Q and R).
Quantitative analysis in U251MG cells (Fig. 6S) revealed that the siRNA group
displayed significantly slower kinetics of γ-H2AX foci
disappearance, indicative of impaired DSB repair, compared with the
NC group at all time points: 0.5 h (P<0.0001), 2 h
(P<0.0001), 6 h (P<0.0001) and 24 h (P=0.0065). The
resolution of the γ-H2AX signal primarily involves the
dephosphorylation of γ-H2AX and the disassembly of repair protein
complexes at the damage site, which occurs upon successful DSB
repair. Therefore, the prolonged presence of γ-H2AX foci in the
siRNA group suggests a deficiency in completing the repair process.
Consistent results were obtained in LN229 cells under identical
conditions (Fig. 6T): 0.5 h
(P=0.0017), 2 h (P<0.0001), 6 h (P<0.0001) and 24 h
(P=0.0470). CDK1 knockdown by siRNA significantly impaired DSB
repair fidelity, linking its role in cell cycle regulation to
enhanced DNA damage response and radiation resistance.
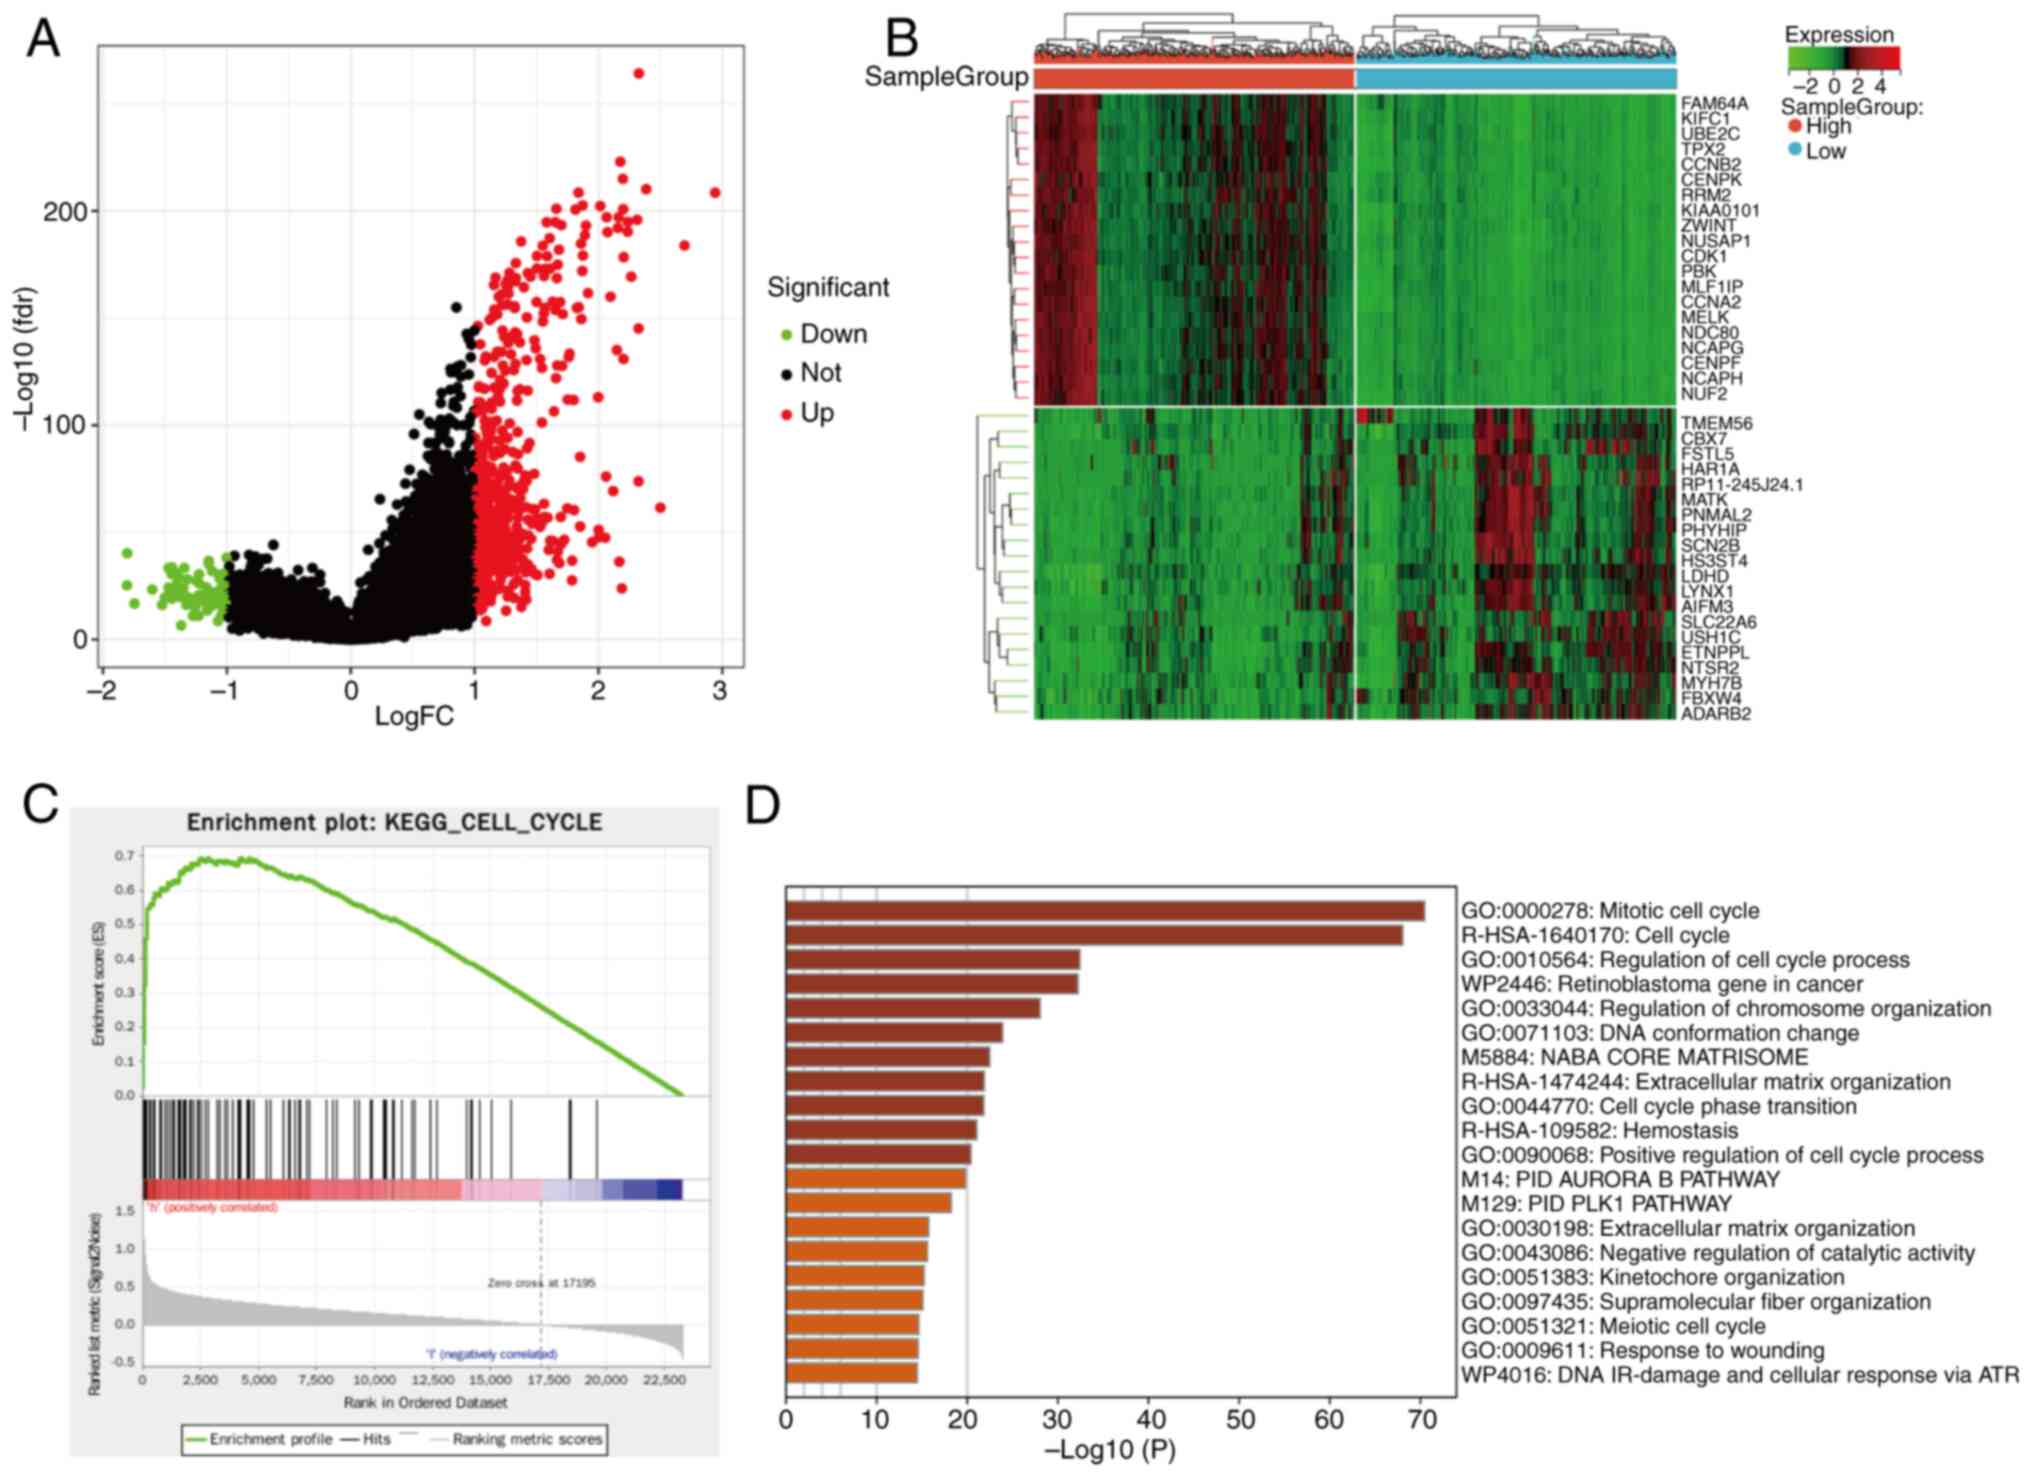
DEG analysis and signal pathway
enrichment analysis of the CDK1 gene
Using the median CDK1 expression value to stratify
samples into high- and low-expression groups, subsequent
differential expression analysis comparing these two groups yielded
638 DEGs, including 93 upregulated and 546 downregulated genes. A
volcano plot of DEGs was generated using R software (Fig. 7A), and a heatmap illustrated the
most significantly altered genes (Fig.
7B). KEGG pathway enrichment analysis revealed significant
enrichment of cell cycle-related pathways in the high-CDK1
expression group (NES=2.0351, normalized P<0.05, FDR=0.0101;
Fig. 7C). Consistently, Metascape
analysis indicated strong enrichment of DEGs in the ‘mitotic cell
cycle’ pathway (Fig. 7D).
Core genes highly associated with CDK1
and PPI network in the cell cycle pathway
Both GSEA and Metascape enrichment analyses
highlighted convergence on cell cycle-associated pathways. Venn
diagram intersection identified 29 overlapping genes from the two
analyses (Fig. 8A). To identify
core regulators associated with CDK1, these genes were uploaded to
STRING for PPI network analysis, which was visualized in Cytoscape.
In total, 8 hub proteins exhibiting strong co-expression with CDK1
(correlation >0.9) were identified: PCNA, MCM2, MCM3, MCM4,
MCM6, PLK1, TTK and MAD2L1 (Fig.
8B). STRING-based PPI analysis confirmed robust
interconnectivity among these proteins (Fig. 8C, top), and correlation analysis
further demonstrated strong positive associations between CDK1 and
the 8 hub genes (Fig. 8C, bottom),
corroborated by scatter plots (Fig.
8D-K). Univariate regression analysis revealed that all 8 genes
functioned as oncogenic drivers in glioma (P<0.001; Fig. 8L).
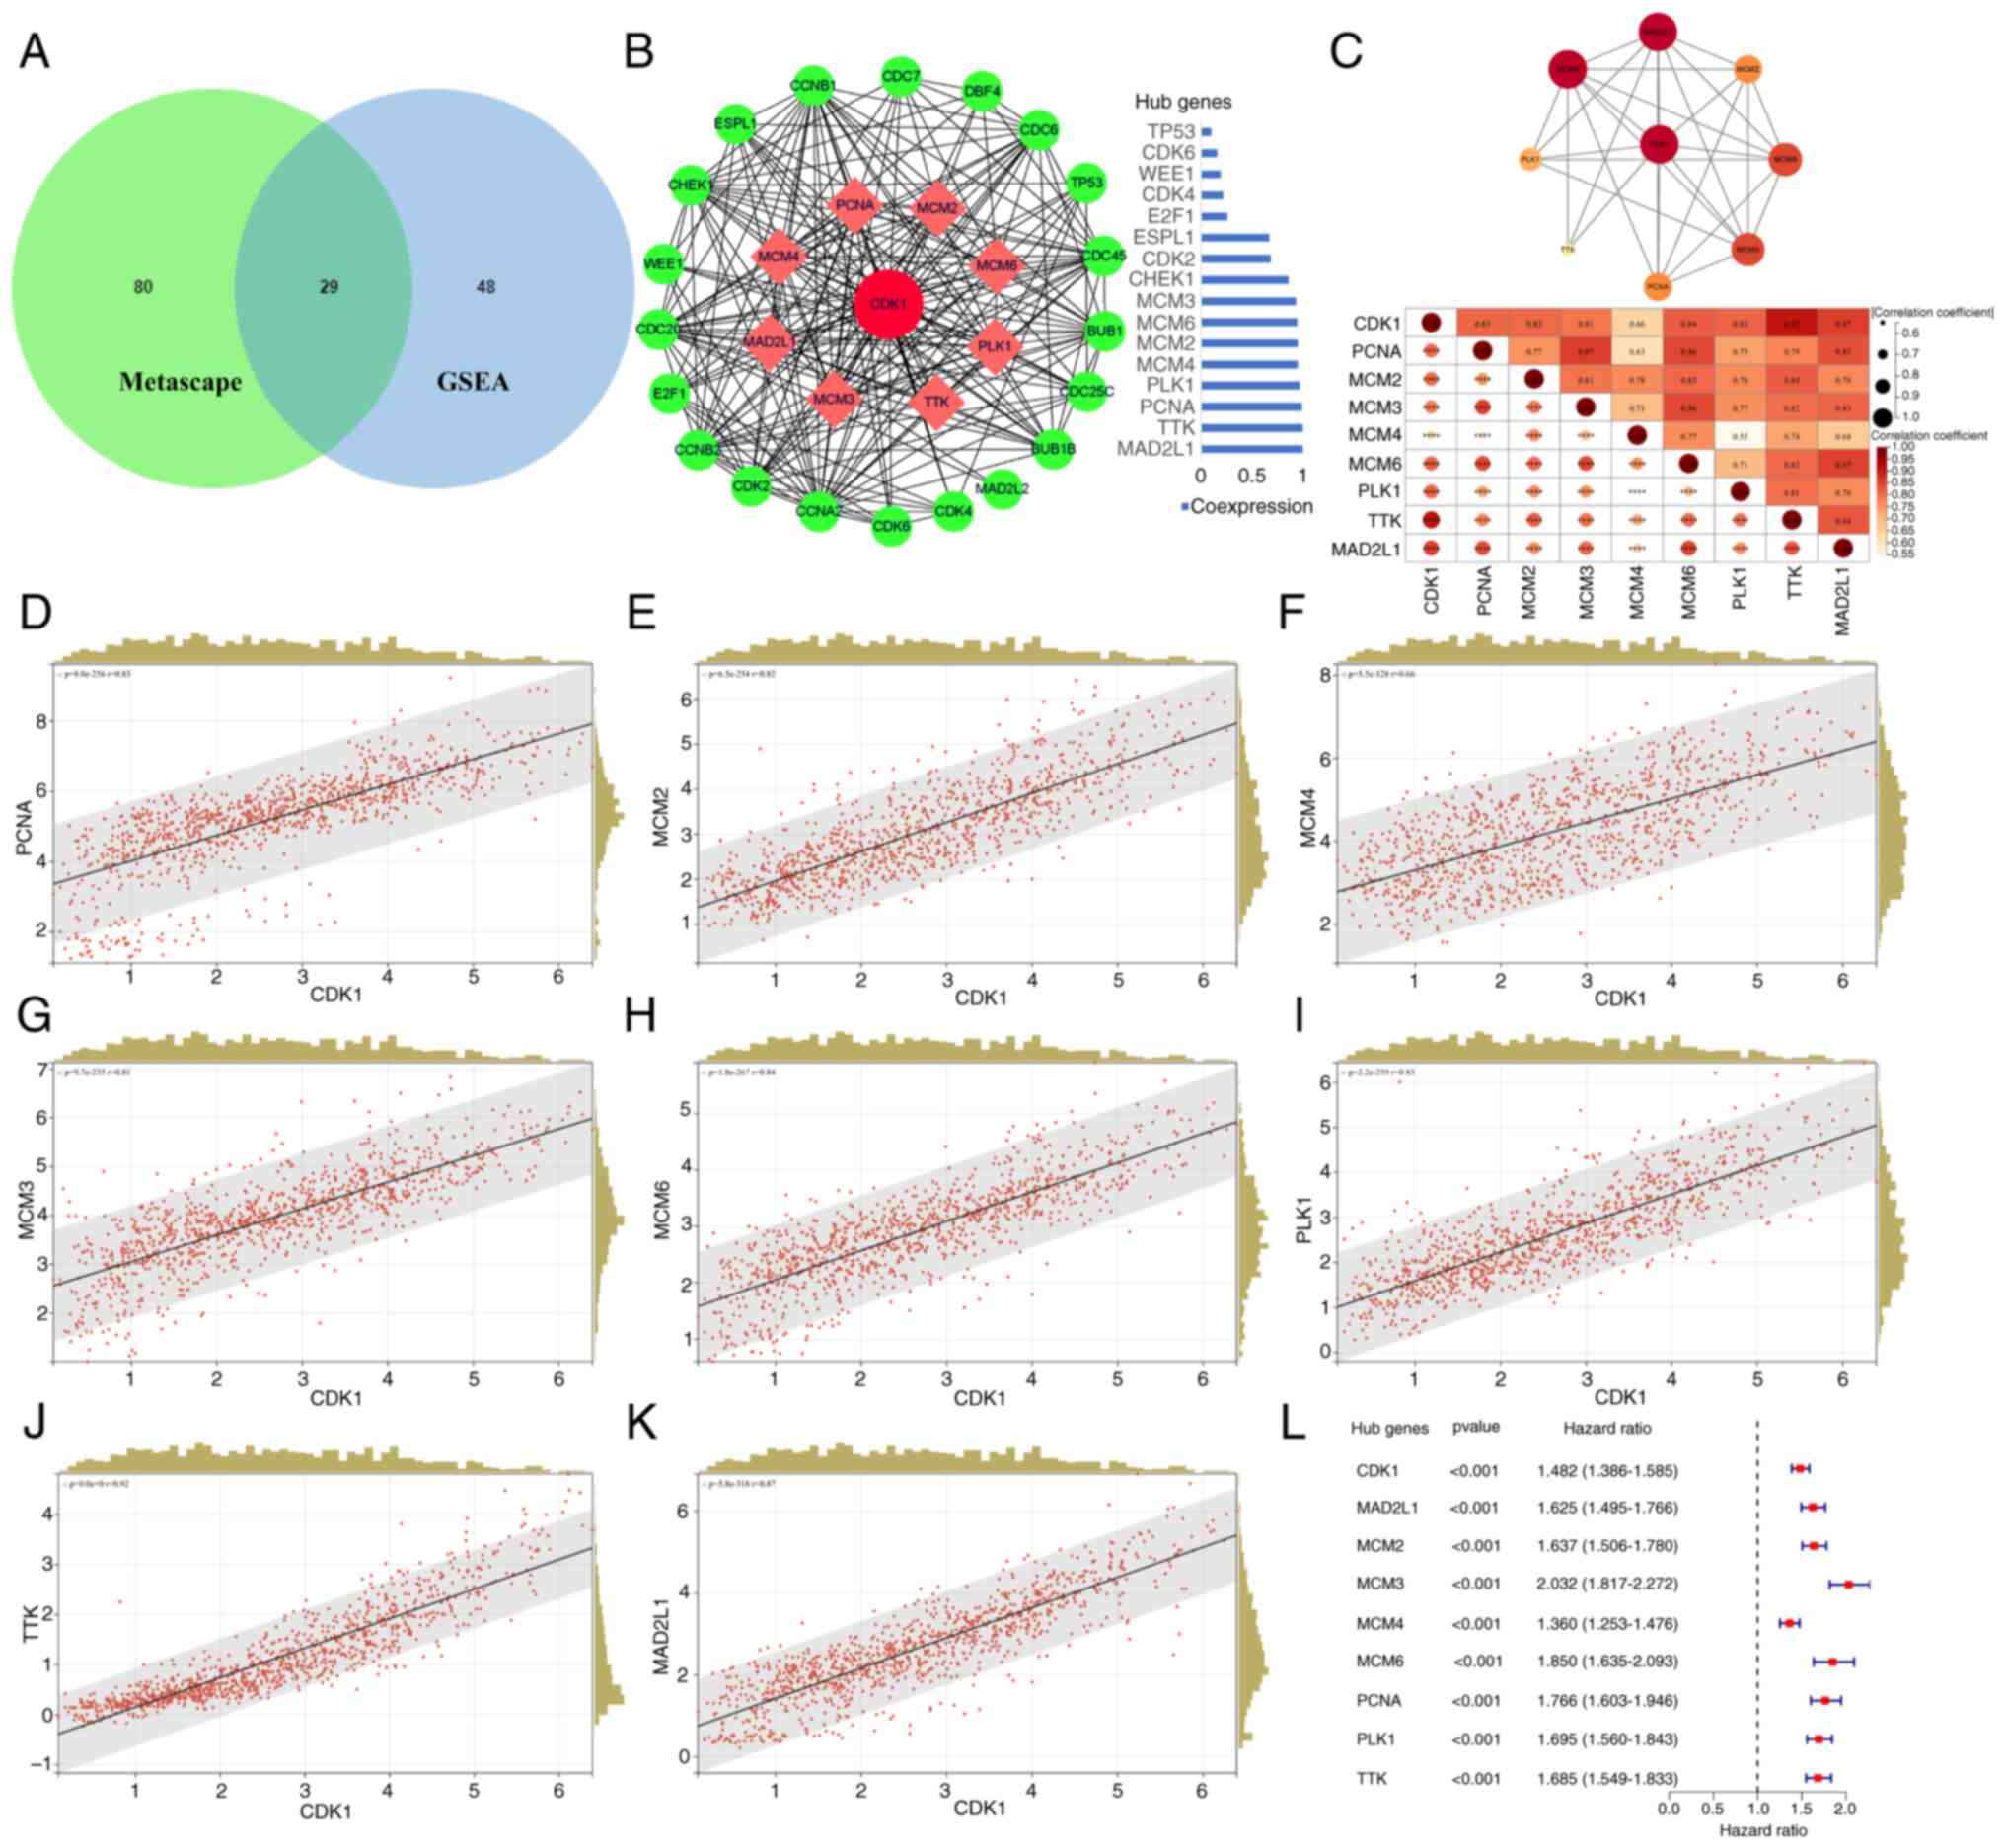 | Figure 8.Association analysis between CDK1 and
cell cycle hub genes. (A) Intersecting genes of the cell cycle
signaling pathway-related genes from Metascape analysis and GSEA
are displayed by the Venn diagram. (B) CDK1 PPI network was
constructed and the top 8 hub proteins with a co-expression value
of >0.9 were screened out based on the STRING website and
Cytoscape visualization software. (C) STRING-based PPI analysis
among the top 8 hub proteins (top). Matrix correlation analysis and
visualization of CDK1 and hub genes (bottom). Scatter plot analysis
of the correlation between CDK1 and hub genes expression: (D) PCNA,
(E) MCM2, (F) MCM4, (G) MCM3, (H) MCM6, (I) PLK1, (J) TTK and (K)
MAD2L1. (L) Univariate regression analysis of the top 8 Hub genes.
Statistical significance was calculated using Pearson's correlation
coefficient. CDK1, cyclin-dependent kinase 1; GSEA, Gene Set
Enrichment Analysis; PPI, protein-protein interaction; PCNA,
proliferating cell nuclear antigen; MCM2/3/4/6, minichromosome
maintenance complex component 2/3/4/6; PLK1, polo-like kinase 1;
MAD2L1, mitotic arrest deficient 2 like 1. |
Malignant phenotypes are promoted
through modulation of the cell cycle pathway via influencing CDK1
expression
Hub gene survival and prognosis analysis based on
TCGA dataset
In glioma tissues, expression levels of the
identified hub genes were significantly elevated relative to normal
tissues, and their upregulation was associated with a poor OS
(Fig. 9A-H).
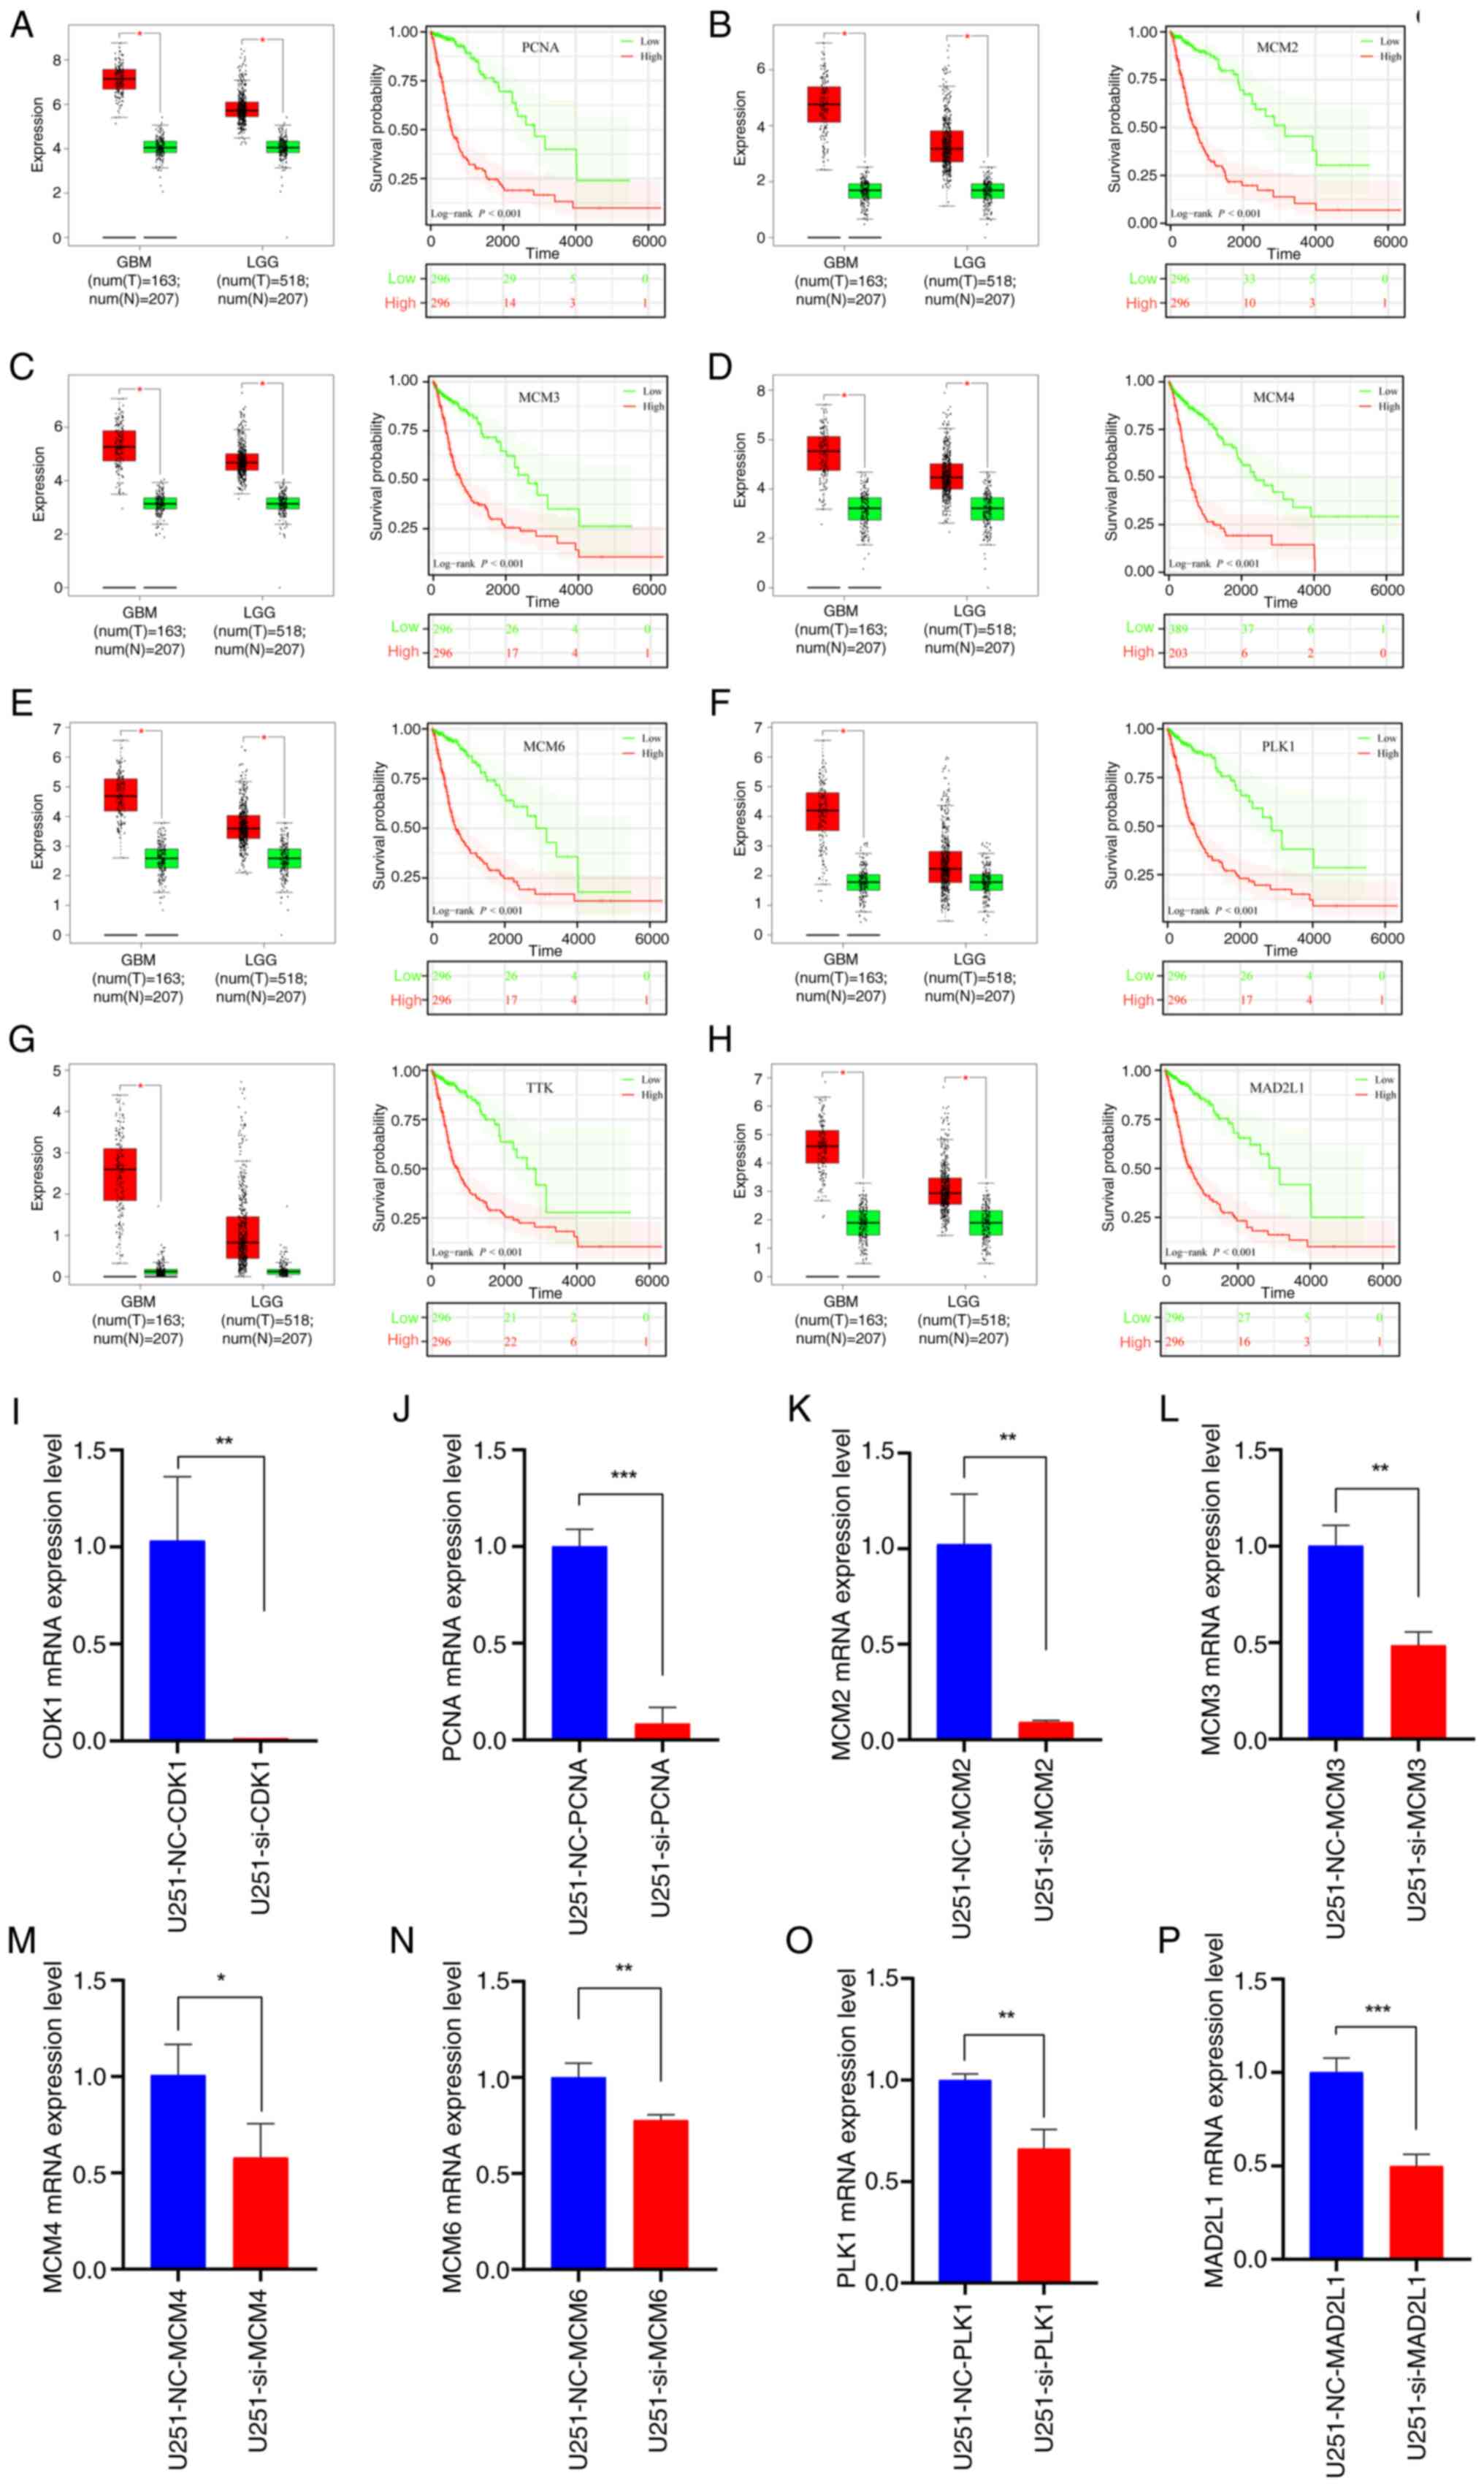 | Figure 9.Expression of the top 8 hub genes and
prognostic analysis. Expression level of the hub genes in glioma
and normal tissues based on the TCGA dataset alongside survival
analysis curves for (A) PCNA, (B) MCM2, (C) MCM3, (D) MCM4, (E)
MCM6, (F) PLK1, (G) TTK and (H) MAD2L1. (I-P) Quantitative PCR
results following CDK1 knock down (n=3) of (I) CDK1, (J) PCNA, (K)
MCM2, (L) MCM3, (M) MCM4, (N) MCM6, (O) PLK1 and (P) MAD2L1. Data
are presented as mean ± SD. Statistical significance was calculated
using log-rank test or Student's t-test. *P<0.05, **P<0.01,
***P<0.001. PCNA, proliferating cell nuclear antigen;
MCM2/3/4/6, minichromosome maintenance complex component 2/3/4/6;
PLK1, polo-like kinase 1; MAD2L1, mitotic arrest deficient 2 like
1; GBM, glioblastoma; LGG, low-grade glioma; NC, negative control;
si, small interfering (RNA); CDK1, cyclin-dependent kinase 1. |
Suppression of CDK1 expression can
inhibit the cell cycle pathway, thereby downregulating the
malignant phenotypes of tumors
qPCR confirmed that CDK1 knockdown suppressed the
expression of PCNA, MCM2, MCM3, MCM4, MCM6, PLK1 and MAD2L1,
providing mechanistic evidence that CDK1 inhibition disrupts cell
cycle progression (Fig. 9I-O).
Discussion
Glioma constitutes the most common primary malignant
tumor of the brain and is classified into localized and diffuse
subtypes (40). In contrast to
localized gliomas, which are often completely resectable and
potentially curable, diffuse gliomas are frequently incompletely
resectable due to their infiltrative growth and high malignancy,
properties that confer extreme aggressiveness, particularly in
high-grade forms (12). Among them,
GBM represents the most prevalent and lethal high-grade glioma,
accounting for 57% of all gliomas and 48% of primary CNS
malignancies (41). The standard
therapeutic regimen combines postoperative radiotherapy with
temozolomide-based chemotherapy. In recent years, alternating
current field therapy (TTF) has been incorporated into National
Comprehensive Cancer Network (NCCN) guidelines; however, patient
outcomes remain poor (42). The
evolving WHO classification of CNS tumors, from 2016 to 2021, has
integrated molecular biomarkers, revolutionizing glioma diagnostics
and therapeutic stratification (5,43).
This paradigm shift underscores the need for diagnostic strategies
that accurately capture tumor biology. In this context, serum
metabolic profiling has emerged as a promising liquid biopsy
approach for brain tumors. This method exploits the partial
permeability of the blood-brain barrier to small-molecule
metabolites, enabling non-invasive detection of tumor-derived
metabolic signatures. Among recent innovations,
nanoparticle-enhanced laser desorption/ionization mass spectrometry
(NPELDI-MS) represents a major advance. A study has demonstrated
its ability to characterize metabolic signatures in brainstem
gliomas with high diagnostic accuracy (AUC=0.933) and significant
prognostic value. Moreover, NPELDI-MS facilitates longitudinal
monitoring of treatment response through serial blood sampling,
offering a powerful adjunct to conventional imaging and
histopathology (44). Despite rapid
progress in immunotherapy and targeted therapy, most patients with
glioma remain unresponsive due to the complex biology of the tumor
and the unique microenvironment of the brain (11,45).
Consequently, the systematic identification of novel molecular
targets remains an urgent priority in glioma research.
The findings of the present study provide compelling
evidence that CDK1 acts as a critical driver of glioma progression.
Its upregulation is significantly associated with higher tumor
grades, poorer survival and unfavorable prognosis, aligning with
reports implicating CDK1 in oncogenic regulation of the cell cycle
(46,47). Notably, the present study
demonstrated that CDK1 expression was markedly elevated in
high-grade gliomas and in patients >42 years of age, suggesting
its potential as a biomarker for disease severity and progression.
This age-dependent upregulation may reflect the accumulation of
genetic and epigenetic alterations promoting CDK1 dysregulation,
consistent with emerging insights into age-related oncogenesis
(48). These findings emphasize the
importance of exploring age-specific molecular mechanisms in
glioma, which could reveal novel therapeutic opportunities for
older patients who typically experience poorer outcomes (49). In the present study, at the
molecular level, the reduced CDK1 expression observed in IDH-mutant
and 1p/19q codeleted gliomas highlights the heterogeneity of glioma
subtypes and their distinct molecular profiles. This pattern is
consistent with evidence that IDH mutations and 1p/19q codeletion
confer more favorable prognosis and altered cell cycle regulation
(5,50,51).
Conversely, the elevated CDK1 levels in recurrent and secondary
gliomas underscore its role in tumor relapse and progression,
possibly by enhancing proliferation, survival and therapy
resistance (52). This is
particularly significant given the paucity of effective treatments
for recurrent gliomas (53). In the
present study, functional assays, including CCK8, EdU, wound
healing, Transwell, AO/EB and flow cytometry, demonstrated that
CDK1 knockdown markedly inhibited glioma cell proliferation and
migration/invasion while promoting apoptosis. The suppression of
migration and invasion following CDK1 depletion may involve
modulation of epithelial-mesenchymal transition (EMT), a process
governed by transcription factors such as TWIST1 and SNAI2
(54). Although direct evidence
linking CDK1 to EMT regulation in glioma remains limited, a study
on head and neck squamous cell carcinomas indicates that CDK1 can
enhance EMT by modulating these key regulators (55). Therefore, we hypothesize that CDK1
knockdown may attenuate glioma cell invasiveness at least partly
through EMT inhibition, a hypothesis warranting further mechanistic
investigation (56). Collectively,
these results reinforce the established role of CDK1 in cell cycle
control and underscore its oncogenic potential (15).
In the present study, the dynamic attenuation of
γ-H2AX foci observed in U251MG and LN229 cell lines following 5 Gy
X-irradiation underscores the pivotal role of CDK1 in maintaining
DNA DSB repair fidelity. siRNA-mediated depletion of CDK1 markedly
delayed γ-H2AX signal resolution across sequential post-irradiation
intervals (0.5–24 h), indicating impaired DSB repair kinetics.
Conversely, the NC control group preserved rapid and precise
repair, demonstrating the contribution of basal CDK1 activity to
radiation resistance. These findings reinforce the established
paradigm that CDK1 orchestrates G2/M checkpoint activation and DNA
damage response signaling, primarily through phosphorylation of
homologous recombination mediators such as BRCA1 and
CtBP-interacting protein (CtIP) (57).
The molecular function of CDK1 extends beyond cell
cycle regulation to encompass a direct role in DSB repair. A study
has demonstrated preferential localization of CDK1-cyclin complexes
at DSB sites, where phosphorylation of resection mediators
(particularly CtIP and replication protein A 32 kDa subunit)
facilitates efficient homologous recombination-mediated repair
(57). This kinase activity is
essential for resolving replication-associated damage, as CDK1
inhibition disrupts replication fork progression and exacerbates
genomic instability (58). The
delayed γ-H2AX attenuation observed in CDK1-depleted cells likely
reflects defective homologous recombination-repair, consistent with
the requirement of CDK1-dependent phosphorylation of BRCA1 at
Ser1497 for effective RAD51 recruitment and strand invasion
(59).
In the present study, KEGG and GSEA pathway analyses
further revealed that CDK1 exerts its principal regulatory effects
through the cell cycle pathway, consistent with its established
role as a master regulator of mitosis and cell division (60). Notably, a CDK1-centered regulatory
network encompassing PCNA, minichromosome maintenance complex
components (MCM2/3/4/6), PLK1, TTK and MAD2L1 was delineated, which
are key effectors that collectively maintain DNA replication
fidelity, checkpoint integrity and chromosomal stability (61–63).
Concomitant upregulation of these effectors in gliomas is
significantly correlated with reduced OS, highlighting the
potential central pathogenetic role of CDK1 (64,65).
In the present study, qPCR validation confirmed marked
downregulation of these network components following CDK1
depletion, mechanistically linking CDK1 inhibition to cell cycle
disruption and revealing its therapeutic potential in glioma
management. This mechanistic insight is particularly noteworthy as
it not only substantiates the canonical function of CDK1 in cell
cycle control but also identifies downstream effectors that may
represent additional therapeutic targets. For example, the MCM
family, critical for DNA replication initiation and elongation, has
recently emerged as a promising target in cancer therapy (66). Likewise, PLK1, a key mitotic kinase
implicated in glioma progression, is currently undergoing
evaluation in clinical trials (67). Collectively, these findings
establish an integrated model of CDK1-centric regulatory topology
in gliomagenesis, advocating combinatorial therapeutic strategies
targeting multiple interconnected network nodes.
Previous research has consistently demonstrated that
activation of CDK family members critically drives tumor cell cycle
progression during oncogenesis. Several CDK inhibitors have already
received FDA approval (13). For
instance, CDK4/6 inhibitors selectively target CDK4 and CDK6 to
prevent retinoblastoma protein phosphorylation, thereby halting
G1-S transition through inhibition of E2F-dependent gene
transcription (68). These
inhibitors are now widely used to treat patients with metastatic,
hormone receptor-positive and HER2-negative breast cancer (69,70).
Similarly, CDK1 upregulation is correlated with a poor prognosis
across multiple malignancies (20,21).
Knockdown of CDK1 via short hairpin RNA has been shown to increase
apoptosis and enhance chemosensitivity in epithelial ovarian cancer
cells (21). Therefore, targeted
inhibition of CDK1 expression holds notable therapeutic promise for
tumor growth suppression, although the precise regulatory
mechanisms warrant further elucidation.
Several limitations of the present study merit
consideration. First, the analyses primarily relied on public
datasets (TCGA and CGGA) and in vitro models, necessitating
validation in vivo. Second, critical clinicopathological
covariates, such as MGMT promoter methylation status, were
unavailable in the referenced datasets, limiting comprehensive
prognostic interpretation. Finally, although several downstream
CDK1 effectors were identified, upstream regulatory mechanisms,
including the roles of specific cyclins and modulatory kinases such
as Wee1, and potential feedback loops governing CDK1 activity in
glioma remain undefined. Future studies aimed at elucidating these
upstream regulators are essential to construct a fully integrated
model of the CDK1 signaling network and to identify synergistic
intervention points for therapeutic development.
In conclusion, glioma remains a life-threatening
malignancy with a rising global incidence, particularly for diffuse
subtypes that pose formidable therapeutic challenges. Despite
advances in treatment modalities, OS has shown minimal improvement
(12,40). Therefore, identifying novel
molecular markers is essential to elucidate oncogenic mechanisms
and facilitate the development of targeted therapies. The present
study establishes CDK1 as a critical driver of glioma progression,
with its upregulation associated with higher tumor grades,
increased recurrence risk and poorer patient outcomes. The
age-dependent and subtype-specific expression patterns of CDK1
underscore its potential as both a prognostic biomarker and a
therapeutic target. Functional analyses confirmed that CDK1
promotes cell cycle dysregulation through predicted direct
interactions with core effectors such as PLK1 and the MCM complex,
providing a mechanistic rationale for CDK1-targeted glioma therapy.
Notably, the findings of the present study emphasize the importance
of dissecting age-specific molecular mechanisms in glioma and
delineate a CDK1-centric interactome (PCNAMCM/PLK1/TTK/MAD2L1) with
high co-targeting potential. Future investigations should focus on
the development of selective CDK1 inhibitors and their evaluation
in preclinical and clinical settings, particularly in combination
with other therapeutic modalities to overcome resistance and
improve clinical outcomes.
Supplementary Material
Supporting Data
Acknowledgements
Not applicable.
Funding
The project was supported by Hebei Natural Science Foundation
(grant nos. H2023206913 and J230003), Medical Science Research
Project of Hebei (grant no. 20230646) and Hebei Provincial
Government funded Clinical Medicine Excellent Talents Project
(grant no. ZF2025093).
Availability of data and materials
The data generated in the present study may be
requested from the corresponding author.
Authors' contributions
YW and HZ conceived and designed the experiments,
conducted the experiments, analyzed the data, prepared figures
and/or table and authored and/or verified drafts of manuscripts.
XH, DZ, LH, HL, TF and SL contributed to data analysis and revised
the manuscript. XX conceived and designed the experiments and
authored or reviewed drafts of the paper. YW and HZ confirm the
authenticity of all the raw data. All authors read and approved the
final version of the manuscript.
Ethics approval and consent to
participate
All procedures performed in the present study
involving human participants were in accordance with the ethical
standards of the institutional and/or national research committee
and with the 1964 Helsinki Declaration and its later amendments or
comparable ethical standards. The present study was approved by the
Ethics Committee of The Second Hospital of Hebei Medical University
(approval no. 2019-R191). Informed consent to participate was
obtained from all participants included in the present study.
Patient consent for publication
Not applicable.
Competing interests
The authors declare that they have no competing
interests.
Glossary
Abbreviations
Abbreviations:
|
GEO
|
Gene Expression Omnibus
|
|
DEGs
|
differentially expressed genes
|
|
PPI
|
protein-protein interaction
|
|
HPA
|
Human Protein Atlas
|
|
GEPIA
|
Gene Expression Profiling Interactive
Analysis
|
|
CGGA
|
Chinese Glioma Genome Atlas
|
|
TCGA
|
The Cancer Genome Atlas
|
|
GSEA
|
Gene Set Enrichment Analysis
|
|
CDK1
|
cyclin-dependent kinase 1
|
|
PCNA
|
proliferating cell nuclear
antigen
|
|
PLK1
|
polo-like kinase 1
|
|
MCM2/3/4/6
|
minichromosome maintenance complex
component 2/3/4/6
|
|
TTK
|
TTK protein kinase
|
|
MAD2L1
|
mitotic arrest deficient 2 like 1
|
|
IDH
|
isocitrate dehydrogenase
|
|
MGMT
|
O-6-methylguanine-DNA
methyltransferase
|
|
CDKN2A
|
cyclin dependent kinase inhibitor
2A
|
|
FDR
|
false discovery rate
|
|
NES
|
normalized enrichment score
|
|
EMT
|
epithelial-mesenchymal transition
|
|
DSB
|
double-strand break
|
|
CtIP
|
CtBP-interacting protein
|
|
OS
|
overall survival
|
|
ROC
|
receiver operating characteristic
|
|
AUC
|
area under the curve
|
|
WHO
|
World Health Organization
|
|
OD
|
optical density
|
|
NC
|
negative control
|
|
si
|
small interfering (RNA)
|
|
AO/EB
|
acridine orange/ethidium bromide
|
|
GBM
|
glioblastoma
|
|
LGG
|
low-grade glioma
|
References
|
1
|
Ostrom QT, Gittleman H, Truitt G, Boscia
A, Kruchko C and Barnholtz-Sloan JS: CBTRUS statistical report:
Primary brain and other central nervous system tumors diagnosed in
the United States in 2011–2015. Neuro Oncol. 20:iv1–iv86. 2018.
View Article : Google Scholar : PubMed/NCBI
|
|
2
|
Rong L, Li N and Zhang Z: Emerging
therapies for glioblastoma: Current state and future directions. J
Exp Clin Cancer Res. 41:1422022. View Article : Google Scholar : PubMed/NCBI
|
|
3
|
Yu MW and Quail DF: Immunotherapy for
glioblastoma: Current progress and challenges. Front Immunol.
12:6763012021. View Article : Google Scholar : PubMed/NCBI
|
|
4
|
Louis DN, Perry A, Reifenberger G, von
Deimling A, Figarella-Branger D, Cavenee WK, Ohgaki H, Wiestler OD,
Kleihues P and Ellison DW: The 2016 world health organization
classification of tumors of the central nervous system: A summary.
Acta Neuropathol. 131:803–820. 2016. View Article : Google Scholar : PubMed/NCBI
|
|
5
|
Louis DN, Perry A, Wesseling P, Brat DJ,
Cree IA, Figarella-Branger D, Hawkins C, Ng HK, Pfister SM,
Reifenberger G, et al: The 2021 WHO classification of tumors of the
central nervous system: A summary. Neuro Oncol. 23:1231–1251. 2021.
View Article : Google Scholar : PubMed/NCBI
|
|
6
|
Bruford EA, Braschi B, Denny P, Jones TEM,
Seal RL and Tweedie S: Guidelines for human gene nomenclature. Nat
Genet. 52:754–758. 2020. View Article : Google Scholar : PubMed/NCBI
|
|
7
|
Śledzińska P, Bebyn MG, Furtak J,
Kowalewski J and Lewandowska MA: Prognostic and predictive
biomarkers in gliomas. Int J Mol Sci. 22:103732021. View Article : Google Scholar : PubMed/NCBI
|
|
8
|
Qu S, Huang C, Zhu T, Wang K, Zhang H,
Wang L, Xu R, Zheng H, Yuan X, Liu G, et al: OLFML3, as a potential
predictor of prognosis and therapeutic target for glioma, is
closely related to immune cell infiltration. VIEW. 4:202200522023.
View Article : Google Scholar
|
|
9
|
Alleman K, Knecht E, Huang J, Zhang L, Lam
S and DeCuypere M: Multimodal deep learning-based prognostication
in glioma patients: A systematic review. Cancers (Basel).
15:5452023. View Article : Google Scholar : PubMed/NCBI
|
|
10
|
Yuan Y, Zhang X, Wang Y, Li H, Qi Z, Du Z,
Chu YH, Feng D, Hu J, Xie Q, et al: Multimodal data integration
using deep learning predicts overall survival of patients with
glioma. VIEW. 5:202400012024. View Article : Google Scholar
|
|
11
|
Xu S, Tang L, Li X, Fan F and Liu Z:
Immunotherapy for glioma: Current management and future
application. Cancer Lett. 476:1–12. 2020. View Article : Google Scholar : PubMed/NCBI
|
|
12
|
Yang K, Wu Z, Zhang H, Zhang N, Wu W, Wang
Z, Dai Z, Zhang X, Zhang L, Peng Y, et al: Glioma targeted therapy:
Insight into future of molecular approaches. Mol Cancer. 21:392022.
View Article : Google Scholar : PubMed/NCBI
|
|
13
|
Le Rhun E, Preusser M, Roth P, Reardon DA,
van den Bent M, Wen P, Reifenberger G and Weller M: Molecular
targeted therapy of glioblastoma. Cancer Treat Rev. 80:1018962019.
View Article : Google Scholar : PubMed/NCBI
|
|
14
|
Malumbres M: Cyclin-dependent kinases.
Genome Biol. 15:1222014. View
Article : Google Scholar : PubMed/NCBI
|
|
15
|
Malumbres M and Barbacid M: Cell cycle,
CDKs and cancer: A changing paradigm. Nat Rev Cancer. 9:153–166.
2009. View Article : Google Scholar : PubMed/NCBI
|
|
16
|
Han Z, Jia Q, Zhang J, Chen M, Wang L,
Tong K, He W, Zhang Y, Zhu W, Qin J, et al: Deubiquitylase YOD1
regulates CDK1 stability and drives triple-negative breast cancer
tumorigenesis. J Exp Clin Cancer Res. 42:2282023. View Article : Google Scholar : PubMed/NCBI
|
|
17
|
Zeng K, Li W, Wang Y, Zhang Z, Zhang L,
Zhang W, Xing Y and Zhou C: Inhibition of CDK1 overcomes
oxaliplatin resistance by regulating ACSL4-mediated ferroptosis in
colorectal cancer. Adv Sci (Weinh). 10:e23010882023. View Article : Google Scholar : PubMed/NCBI
|
|
18
|
Shen J, Gong X, Tan S, Zhang Y, Xia R, Xu
S, Wang S, Zhou H, Jiang Y, Zhao T, et al: CDK1 acts as a
prognostic biomarker associated with immune infiltration in
pan-cancer, especially in gastrointestinal tumors. Curr Med Chem.
32:4836–4857. 2024. View Article : Google Scholar : PubMed/NCBI
|
|
19
|
Xue J, Song Y, Xu W and Zhu Y: The
CDK1-related lncRNA and CXCL8 mediated immune resistance in lung
adenocarcinoma. Cells. 11:26882022. View Article : Google Scholar : PubMed/NCBI
|
|
20
|
Sung WW, Lin YM, Wu PR, Yen HH, Lai HW, Su
TC, Huang RH, Wen CK, Chen CY, Chen CJ and Yeh KT: High
nuclear/cytoplasmic ratio of Cdk1 expression predicts poor
prognosis in colorectal cancer patients. BMC Cancer. 14:9512014.
View Article : Google Scholar : PubMed/NCBI
|
|
21
|
Xi Q, Huang M, Wang Y, Zhong J, Liu R, Xu
G, Jiang L, Wang J, Fang Z and Yang S: The expression of CDK1 is
associated with proliferation and can be a prognostic factor in
epithelial ovarian cancer. Tumour Biol. 36:4939–4948. 2015.
View Article : Google Scholar : PubMed/NCBI
|
|
22
|
Zhang C, Elkahloun AG, Robertson M, Gills
JJ, Tsurutani J, Shih JH, Fukuoka J, Hollander MC, Harris CC,
Travis WD, et al: Loss of cytoplasmic CDK1 predicts poor survival
in human lung cancer and confers chemotherapeutic resistance. PLoS
One. 6:e238492011. View Article : Google Scholar : PubMed/NCBI
|
|
23
|
van Nes JG, Smit VT, Putter H, Kuppen PJ,
Kim SJ, Daito M, Ding J, Shibayama M, Numada S, Gohda K, et al:
Validation study of the prognostic value of cyclin-dependent kinase
(CDK)-based risk in Caucasian breast cancer patients. Br J Cancer.
100:494–500. 2009. View Article : Google Scholar : PubMed/NCBI
|
|
24
|
Piao J, Zhu L, Sun J, Li N, Dong B, Yang Y
and Chen L: High expression of CDK1 and BUB1 predicts poor
prognosis of pancreatic ductal adenocarcinoma. Gene. 701:15–22.
2019. View Article : Google Scholar : PubMed/NCBI
|
|
25
|
Jones MJ and Jones MC: Cell cycle control
by cell-matrix interactions. Curr Opin Cell Biol. 86:1022882024.
View Article : Google Scholar : PubMed/NCBI
|
|
26
|
Lemmens B, Hegarat N, Akopyan K,
Sala-Gaston J, Bartek J, Hochegger H and Lindqvist A: DNA
replication determines timing of mitosis by restricting CDK1 and
PLK1 activation. Mol Cell. 71:117–128.e113. 2018. View Article : Google Scholar : PubMed/NCBI
|
|
27
|
Ci M, Zhao G, Li C, Liu R, Hu X, Pan J,
Shen Y, Zhang G, Li Y, Zhang L, et al: OTUD4 promotes the
progression of glioblastoma by deubiquitinating CDK1 and activating
MAPK signaling pathway. Cell Death Dis. 15:1792024. View Article : Google Scholar : PubMed/NCBI
|
|
28
|
Shi YX, Zhu T, Zou T, Zhuo W, Chen YX,
Huang MS, Zheng W, Wang CJ, Li X, Mao XY, et al: Prognostic and
predictive values of CDK1 and MAD2L1 in lung adenocarcinoma.
Oncotarget. 7:85235–85243. 2016. View Article : Google Scholar : PubMed/NCBI
|
|
29
|
Faienza F, Polverino F, Rajendraprasad G,
Milletti G, Hu Z, Colella B, Gargano D, Strappazzon F, Rizza S,
Vistesen MV, et al: AMBRA1 phosphorylation by CDK1 and PLK1
regulates mitotic spindle orientation. Cell Mol Life Sci.
80:2512023. View Article : Google Scholar : PubMed/NCBI
|
|
30
|
Auvergne RM, Sim FJ, Wang S,
Chandler-Militello D, Burch J, Al Fanek Y, Davis D, Benraiss A,
Walter K, Achanta P, et al: Transcriptional differences between
normal and glioma-derived glial progenitor cells identify a core
set of dysregulated genes. Cell Rep. 3:2127–2141. 2013. View Article : Google Scholar : PubMed/NCBI
|
|
31
|
Sun L, Hui AM, Su Q, Vortmeyer A,
Kotliarov Y, Pastorino S, Passaniti A, Menon J, Walling J, Bailey
R, et al: Neuronal and glioma-derived stem cell factor induces
angiogenesis within the brain. Cancer Cell. 9:287–300. 2006.
View Article : Google Scholar : PubMed/NCBI
|
|
32
|
Griesinger AM, Birks DK, Donson AM, Amani
V, Hoffman LM, Waziri A, Wang M, Handler MH and Foreman NK:
Characterization of distinct immunophenotypes across pediatric
brain tumor types. J Immunol. 191:4880–4888. 2013. View Article : Google Scholar : PubMed/NCBI
|
|
33
|
Lambiv WL, Vassallo I, Delorenzi M, Shay
T, Diserens AC, Misra A, Feuerstein B, Murat A, Migliavacca E,
Hamou MF, et al: The Wnt inhibitory factor 1 (WIF1) is targeted in
glioblastoma and has a tumor suppressing function potentially by
induction of senescence. Neuro Oncol. 13:736–747. 2011. View Article : Google Scholar : PubMed/NCBI
|
|
34
|
Zhao Z, Zhang KN, Wang Q, Li G, Zeng F,
Zhang Y, Wu F, Chai R, Wang Z, Zhang C, et al: Chinese glioma
genome atlas (CGGA): A comprehensive resource with functional
genomic data from Chinese glioma patients. Genomics Proteomics
Bioinformatics. 19:1–12. 2021. View Article : Google Scholar : PubMed/NCBI
|
|
35
|
Cancer Genome Atlas Research Network, .
Comprehensive genomic characterization defines human glioblastoma
genes and core pathways. Nature. 455:1061–1068. 2008. View Article : Google Scholar : PubMed/NCBI
|
|
36
|
Brat DJ, Verhaak RG, Aldape KD, Yung WK,
Salama SR, Cooper LAD, Rheinbay E, Miller CR, Vitucci M, Morozova
O, et al: Comprehensive, integrative genomic analysis of diffuse
lower-grade gliomas. N Engl J Med. 372:2481–2498. 2015. View Article : Google Scholar : PubMed/NCBI
|
|
37
|
Ritchie ME, Phipson B, Wu D, Hu Y, Law CW,
Shi W and Smyth GK: Limma powers differential expression analyses
for RNA-sequencing and microarray studies. Nucleic Acids Res.
43:e472015. View Article : Google Scholar : PubMed/NCBI
|
|
38
|
Livak KJ and Schmittgen TD: Analysis of
relative gene expression data using real-time quantitative PCR and
the 2(−Delta Delta C(T)) method. Methods. 25:402–408. 2001.
View Article : Google Scholar : PubMed/NCBI
|
|
39
|
Zhou Y, Zhou B, Pache L, Chang M,
Khodabakhshi AH, Tanaseichuk O, Benner C and Chanda SK: Metascape
provides a biologist-oriented resource for the analysis of
systems-level datasets. Nat Commun. 10:15232019. View Article : Google Scholar : PubMed/NCBI
|
|
40
|
Wu L, Chai R, Zhao Z, Wang Q and Jiang T:
Role of the tumor microenvironment in shaping IDH-wildtype glioma
plasticity, and potential therapeutic strategies. Cancer Biol Med.
19:1423–1427. 2022. View Article : Google Scholar : PubMed/NCBI
|
|
41
|
Weller M and Le Rhun E: How did lomustine
become standard of care in recurrent glioblastoma? Cancer Treat
Rev. 87:1020292020. View Article : Google Scholar : PubMed/NCBI
|
|
42
|
Nabors LB, Portnow J, Ahluwalia M,
Baehring J, Brem H, Brem S, Butowski N, Campian JL, Clark SW,
Fabiano AJ, et al: Central nervous system cancers, Version 3.2020,
NCCN Clinical practice guidelines in oncology. J Natl Compr Canc
Netw. 18:1537–1570. 2020. View Article : Google Scholar : PubMed/NCBI
|
|
43
|
Humphrey PA, Moch H, Cubilla AL, Ulbright
TM and Reuter VE: The 2016 WHO classification of tumours of the
urinary system and male genital organs-part B: Prostate and bladder
tumours. Eur Urol. 70:106–119. 2016. View Article : Google Scholar : PubMed/NCBI
|
|
44
|
Li K, Wang R, Gu Z, Weng W, Liu W, Huang
Y, Wu J, Zhang Z, Yang S, Su J, et al: Serum metabolic profiling
enables diagnosis, prognosis, and monitoring for brainstem gliomas.
Nat Commun. 16:61082025. View Article : Google Scholar : PubMed/NCBI
|
|
45
|
Chen R, Smith-Cohn M, Cohen AL and Colman
H: Glioma subclassifications and their clinical significance.
Neurotherapeutics. 14:284–297. 2017. View Article : Google Scholar : PubMed/NCBI
|
|
46
|
Xie B, Wang S, Jiang N and Li JJ: Cyclin
B1/CDK1-regulated mitochondrial bioenergetics in cell cycle
progression and tumor resistance. Cancer Lett. 443:56–66. 2019.
View Article : Google Scholar : PubMed/NCBI
|
|
47
|
Guan T, Li M, Song Y, Chen J, Tang J,
Zhang C, Wen Y, Yang X, Huang L, Zhu Y, et al: Phosphorylation of
USP29 by CDK1 governs TWIST1 stability and oncogenic functions. Adv
Sci (Weinh). 10:e22058732023. View Article : Google Scholar : PubMed/NCBI
|
|
48
|
López-Otín C, Blasco MA, Partridge L,
Serrano M and Kroemer G: Hallmarks of aging: An expanding universe.
Cell. 186:243–278. 2023. View Article : Google Scholar : PubMed/NCBI
|
|
49
|
Chatsirisupachai K, Lesluyes T, Paraoan L,
Van Loo P and de Magalhães JP: An integrative analysis of the
age-associated multi-omic landscape across cancers. Nat Commun.
12:23452021. View Article : Google Scholar : PubMed/NCBI
|
|
50
|
Wang HY, Tang K, Liang TY, Zhang WZ, Li
JY, Wang W, Hu HM, Li MY, Wang HQ, He XZ, et al: The comparison of
clinical and biological characteristics between IDH1 and IDH2
mutations in gliomas. J Exp Clin Cancer Res. 35:862016. View Article : Google Scholar : PubMed/NCBI
|
|
51
|
Nambirajan A, Suri V, Kedia S, Goyal K,
Malgulwar PB, Khanna G, Panda PK, Gulati S, Garg A and Sharma MC:
Paediatric diffuse leptomeningeal tumor with glial and neuronal
differentiation harbouring chromosome 1p/19q co-deletion and H3.3
K27M mutation: Unusual molecular profile and its therapeutic
implications. Brain Tumor Pathol. 35:186–191. 2018. View Article : Google Scholar : PubMed/NCBI
|
|
52
|
Wang Q, Bode AM and Zhang T: Targeting
CDK1 in cancer: Mechanisms and implications. NPJ Precis Oncol.
7:582023. View Article : Google Scholar : PubMed/NCBI
|
|
53
|
Liu Y, Zhou F, Ali H, Lathia JD and Chen
P: Immunotherapy for glioblastoma: Current state, challenges, and
future perspectives. Cell Mol Immunol. 21:1354–1375. 2024.
View Article : Google Scholar : PubMed/NCBI
|
|
54
|
Pećina-Šlaus N, Zottel A, Škripek Ž,
Puljko B, Dumančić F, Bukovac A, Jovčevska I and Kafka A: In silico
analysis reveals distinct changes in markers of epithelial to
mesenchymal transition in glioma subtypes. Biomol Biomed.
25:2712–2736. 2025. View Article : Google Scholar : PubMed/NCBI
|
|
55
|
Chen H, Hu K, Xie Y, Qi Y, Li W, He Y, Fan
S, Liu W and Li C: CDK1 promotes epithelial-mesenchymal transition
and migration of head and neck squamous carcinoma cells by
repressing ∆Np63α-mediated transcriptional regulation. Int J Mol
Sci. 23:73852022. View Article : Google Scholar : PubMed/NCBI
|
|
56
|
Ren L, Yang Y, Li W, Zheng X, Liu J, Li S,
Yang H, Zhang Y, Ge B, Zhang S, et al: CDK1 serves as a therapeutic
target of adrenocortical carcinoma via regulating
epithelial-mesenchymal transition, G2/M phase transition, and
PANoptosis. J Transl Med. 20:4442022. View Article : Google Scholar : PubMed/NCBI
|
|
57
|
Ferretti LP, Lafranchi L and Sartori AA:
Controlling DNA-end resection: A new task for CDKs. Front Genet.
4:992013. View Article : Google Scholar : PubMed/NCBI
|
|
58
|
Tozaki Y, Aoki H, Kato R, Toriuchi K,
Arame S, Inoue Y, Hayashi H, Kubota E, Kataoka H and Aoyama M: The
combination of ATM and Chk1 inhibitors induces synthetic lethality
in colorectal cancer cells. Cancers (Basel). 15:7352023. View Article : Google Scholar : PubMed/NCBI
|
|
59
|
Liao H, Ji F, Geng X, Xing M, Li W, Chen
Z, Shen H and Ying S: CDK1 promotes nascent DNA synthesis and
induces resistance of cancer cells to DNA-damaging therapeutic
agents. Oncotarget. 8:90662–90673. 2017. View Article : Google Scholar : PubMed/NCBI
|
|
60
|
Suski JM, Braun M, Strmiska V and Sicinski
P: Targeting cell-cycle machinery in cancer. Cancer Cell.
39:759–778. 2021. View Article : Google Scholar : PubMed/NCBI
|
|
61
|
Masai H, Taniyama C, Ogino K, Matsui E,
Kakusho N, Matsumoto S, Kim JM, Ishii A, Tanaka T, Kobayashi T, et
al: Phosphorylation of MCM4 by Cdc7 kinase facilitates its
interaction with Cdc45 on the chromatin. J Biol Chem.
281:39249–39261. 2006. View Article : Google Scholar : PubMed/NCBI
|
|
62
|
de Cárcer G, Venkateswaran SV, Salgueiro
L, El Bakkali A, Somogyi K, Rowald K, Montañés P, Sanclemente M,
Escobar B, de Martino A, et al: Plk1 overexpression induces
chromosomal instability and suppresses tumor development. Nat
Commun. 9:30122018. View Article : Google Scholar : PubMed/NCBI
|
|
63
|
Pierantoni GM, Conte A, Rinaldo C,
Tornincasa M, Gerlini R, Valente D, Izzo A and Fusco A: Hmga1 null
mouse embryonic fibroblasts display downregulation of spindle
assembly checkpoint gene expression associated to nuclear and
karyotypic abnormalities. Cell Cycle. 15:812–818. 2016. View Article : Google Scholar : PubMed/NCBI
|
|
64
|
Yang S, Yuan Y, Ren W, Wang H, Zhao Z,
Zhao H, Zhao Q, Chen X, Jiang X and Zhang L: MCM4 is a novel
prognostic biomarker and promotes cancer cell growth in glioma.
Front Oncol. 12:10043242022. View Article : Google Scholar : PubMed/NCBI
|
|
65
|
Li X, Tao Z, Wang H, Deng Z, Zhou Y and Du
Z: Dual inhibition of Src and PLK1 regulate stemness and induce
apoptosis through Notch1-SOX2 signaling in EGFRvIII positive glioma
stem cells (GSCs). Exp Cell Res. 396:1122612020. View Article : Google Scholar : PubMed/NCBI
|
|
66
|
Deng S, Lu X, Wang X, Liang B, Xu H, Yang
D, Cui G, Yonemura A, Paine H, Zhou Y, et al: Overexpression of
TBX3 suppresses tumorigenesis in experimental and human
cholangiocarcinoma. Cell Death Dis. 15:4412024. View Article : Google Scholar : PubMed/NCBI
|
|
67
|
Reda M, Ngamcherdtrakul W, Nelson MA,
Siriwon N, Wang R, Zaidan HY, Bejan DS, Reda S, Hoang NH, Crumrine
NA, et al: Development of a nanoparticle-based immunotherapy
targeting PD-L1 and PLK1 for lung cancer treatment. Nat Commun.
13:42612022. View Article : Google Scholar : PubMed/NCBI
|
|
68
|
Roskoski R Jr: Cyclin-dependent protein
serine/threonine kinase inhibitors as anticancer drugs. Pharmacol
Res. 139:471–488. 2019. View Article : Google Scholar : PubMed/NCBI
|
|
69
|
Gao JJ, Cheng J, Bloomquist E, Sanchez J,
Wedam SB, Singh H, Amiri-Kordestani L, Ibrahim A, Sridhara R,
Goldberg KB, et al: CDK4/6 inhibitor treatment for patients with
hormone receptor-positive, HER2-negative, advanced or metastatic
breast cancer: A US food and drug administration pooled analysis.
Lancet Oncol. 21:250–260. 2020. View Article : Google Scholar : PubMed/NCBI
|
|
70
|
Curigliano G and Loibl S: CDK4/6
inhibitors in breast cancer: One more step towards reduced
mortality. Lancet Oncol. 21:191–192. 2020. View Article : Google Scholar : PubMed/NCBI
|