Introduction
Prostate cancer (PCa) ranks as the second most
prevalent solid tumor among men, and its incidence and mortality
rates are on the rise, particularly in developed countries. This
increase can be attributed to several factors, including an aging
population, improved screening practices and heightened awareness
of the disease (1,2). Treatment options are diverse and may
include active surveillance, chemotherapy, radiation therapy,
hormone therapy, surgical procedures and cryotherapy (3). Despite these approaches, the
development of hormone resistance remains a notable challenge
(4). However, the detailed
mechanism underlying the development of PCa, particularly
castration-resistant PCa (CRPC), remains elusive thus far.
Challenges persist in implementing chemotherapy, targeted therapy
and immunotherapy for high-risk PCa and CRPC (5–7).
Consequently, there is an immediate need to discover and validate
robust biomarkers for improved diagnostic applications.
The preservation of genomic integrity depends
largely on the accuracy and precision of DNA replication.
Nevertheless, this crucial process faces several internal and
external stresses that can greatly affect the overall stability of
the genome (8,9). DNA replication stress refers to a
range of challenges that hinder, obstruct or halt the process of
DNA replication (10,11). Tumor cells frequently experience
chronic replication stress as a result of a weakened replication
stress response, reduced activity of repair proteins and persistent
signaling for proliferation (12–15).
This greatly contributes to genomic instability and abnormal cell
growth in tumors (12,14). In addition, reproduction involves an
intricate process where DNA is accurately duplicated (11). DNA replication stress, which
disrupts this tightly controlled process, can lead to genomic
instability and may ultimately promote the onset and advancement of
tumor formation (11). Recent
research reported that DNA replication stress is a notable
characteristic of advanced PCa (16). Therefore, identifying prognostic
genes associated with this stress could enhance risk assessment and
inform treatment strategies for PCa (16).
Cancer cells must reprogram their metabolism to meet
the heightened energy demands and produce the building blocks
necessary for rapid tumor growth (17). In the case of PCa, cells often gain
energy through de novo lipid synthesis to produce fatty
acids. This metabolic shift towards a lipogenic phenotype is a
crucial turning point in the development of PCa (18,19).
The Warburg effect is characterized by a change in the preferred
energy production pathway. Unlike normal cells, which primarily
produce ATP through oxidative phosphorylation, cancer cells,
including PCa cells, preferentially undergo aerobic glycolysis to
generate ATP (20,21). For normal prostate epithelial cells,
utilizing glucose to produce citrate and releasing it as part of
the process is an unusual and inefficient way of energy metabolism.
During the transformation to PCa, cells shift from this inefficient
energy metabolism to a more efficient one (22,23).
AMP-activated protein kinase (AMPK), a heterotrimeric protein
complex, serves a vital role in regulating metabolism and energy
homeostasis (24). Under metabolic
stress conditions, AMPK can conserve cellular energy and viability
by modulating metabolism and key biological functions (24). Studies have reported that AMPK
activation provides strong protective effects against the
progression of PCa, both in the early and late stages of the
disease (25). Thus, energy
homeostasis is a critical factor in the progression of PCa.
In the present study, PCa-related datasets obtained
from public databases, as well as DNA replication stress-related
genes (DRGs) and energy homeostasis-related genes (EHRGs) were
utilized to explore the mechanisms of PCa. Differential expression
analysis, enrichment analyses were performed to explore potential
key mechanisms in PCa. In addition, biomarkers were identified by
expression validation. The genes were further transfected into PC-3
cells to regulate the expression of the biomarkers, and cancer cell
proliferation was evaluated using a Cell Counting Kit-8 (CCK-8)
assay. Furthermore, cancer cell migration was assessed using cell
scratch and Transwell migration assays to explore the prognostic
impact of the biomarkers. This comprehensive analysis provided new
targets for the diagnosis of PCa.
Materials and methods
Data collection
Transcriptomic data and corresponding clinical
features [including age, tumor (T) and node (N) stage, Gleason
grade and relapse-free survival (RFS)] for The Cancer Genome Atlas
(TCGA)-prostate adenocarcinoma (PRAD) were downloaded from the UCSC
Xena database (https://xenabrowser.net/datapages/), with a total of
551 samples. After screening, 532 samples were obtained, with
PCa:Control=481:51. A total of 409 of the PCa samples had survival
information and biochemical recurrence (BCR) information. GSE103512
(GPL13158), GSE21034 (GPL10264), GSE70770 (GPL10558) and GSE54460
(GPL11154) were obtained from the Gene Expression Omnibus database
(https://www.ncbi.nlm.nih.gov/geo/),
and each dataset was subjected to independent analysis. GSE103512
comprised 60 PCa samples along with seven control samples.
Similarly, GSE21034 and GSE70770 contained PCa:Control=150:29 and
PCa:Control=219:74, respectively, and GSE54460 contained 106 PCa
samples, of which 96 samples without a recurrence time 0 were
retained. The sample information of the five datasets are presented
in Table SI. In addition, 982 DRGs
were identified from the literature (26) and 78 EHRGs were obtained from the
Gene Ontology (GO) database (GO:0097009; R package org.hs.eg.db;
http://bioconductor.org/packages/org.Hs.eg.db/).
Identification and enrichment analysis
of differentially expressed genes (DEGs) in PCa
To identify DEGs between PCa and control samples in
the TCGA-PRAD dataset, the DESeq2 (v 1.36.0) package (https://bioconductor.org/packages/DESeq2/) was
employed (adj.P<0.05 and |Log2 fold change|>0.5).
Subsequently, the ggplot2 (v3.3.6; http://CRAN.R-project.org/package=ggplot2) and
pheatmap (v1.0.12) packages (https://CRAN.R-project.org/package=pheatmap) were
utilized to plot the volcano map and heatmap, respectively
(27). Finally, the clusterProfiler
(v4.7.1.001) package (https://bioconductor.org/packages/clusterProfiler/)
analyzed the biological functions for DEGs for GO and Kyoto
Encyclopedia of Genes and Genomes (KEGG) enrichment (P<0.05).
The results were then visualized using the GOplot (v1.0.2;
http://CRAN.R-project.org/package=GOplot) and
enrichplot (v1.16.2) (https://bioconductor.org/packages/enrichplot/)
packages.
Identification of biomarkers
Candidate biomarkers were identified from the
intersection between DEGs, DRGs and EHRGs using the ggvenn (v0.1.9)
package (https://CRAN.R-project.org/package=ggvenn).
Additionally, the Wilcoxon rank-sum test was used to assess the
expression level of candidate biomarkers between PCa and control
groups in the TCGA-PRAD, GSE103512, GSE21034 and GSE70770 datasets
(P<0.05). The mRNA expression and protein contents of candidate
biomarkers were determined using western blotting and reverse
transcription-quantitative (RT-q) PCR, respectively. Finally, genes
with consistent expression and significant difference in both four
datasets and experiments (western blotting and RT-qPCR) were
identified as biomarkers.
Survival difference and clinical
association analysis
According to the expression levels of biomarkers
among PCa samples in the TCGA-PRAD dataset, they were divided into
high- and low-expression groups, utilizing the optimal cut-off
value for expression as the boundary using the surv_cutpoint
function in the survminer (v0.4.9) package (https://CRAN.R-project.org/package=survminer).
Kaplan-Meier (KM) survival curves for the expression groups were
then plotted using the survminer (v0.4.9) package to determine the
difference in overall survival (OS), disease-specific survival
(DSS), disease-free interval (DFI) progression-free interval (PFI)
and RFS between the two expression groups. Meanwhile, the survival
difference between two expression groups was compared using the
log-rank test. Furthermore, the difference in biomarkers between
different subtypes of clinical characteristics were compared in the
TCGA-PRAD dataset and the results was visualized using a violin
plot using the ggplot2 (v3.3.6) package (P<0.05). Finally, the
χ2 test was used to assess the distribution of several
clinical features between two expression groups.
Gene set enrichment analysis (GSEA)
and gene set variation analysis (GSVA)
To elucidate the biological processes associated
with the identified biomarkers which were involved in PCa, the
c2.cp.kegg.v2023.2.Hs.symbols.gmt gene set was used as reference
gene set from the Molecular Signatures Database (MSigDB; http://www.gsea-msigdb.org/gsea/msigdb/human/collections.jsp)
using the clusterProfiler (v4.7.1.001) package. Spearman's
correlation analysis of the biomarkers with all genes in the
TCGA-PRAD dataset was performed and they were then ranked according
to the correlation coefficient. The ranked genes were then analyzed
for GSEA enrichment and the results of the top 5 pathways from
largest to smallest were visualized based on their |normalized
enrichment score (NES)| values (|NES|>1; P<0.05). To further
assess pathway changes between two expression groups in the
TCGA-PRAD dataset, and based on the
c2.cp.kegg.v2023.2.Hs.symbols.gmt gene set from the MSigDB, the
GSVA (v1.44.5; http://bioconductor.org/packages/GSVA/) and limma (v
3.52.4) packages (https://bioconductor.org/packages/limma/) were used to
calculate GSVA scores for each pathway and to compare the GSVA
score differences of all KEGG pathways between the two expression
groups (|t|>2; P<0.05).
Immune microenvironment analysis
To evaluate the changes in the immune
microenvironment of PCa, the content and relative infiltration
abundance of 22 immune infiltrating cells in the TCGA-PRAD dataset
were calculated utilizing the CIBERSORT (v1.03) algorithm
(https://cibersort.stanford.edu;
P<0.05) and visualized using the ggh4× (v4.2.2) package
(https://CRAN.R-project.org/package=ggh4×).
Additionally, the Wilcoxon rank-sum test (P<0.05) was used to
analyze the difference in immune cell infiltration between the two
expression groups, and the ggplot2 (v 3.4.1) package was used to
depict the data in a box plot.
Mutation analysis
The maftools (v 2.12.0) package (https://bioconductor.org/packages/maftools/) was used
to analyze two patient cohorts with mutation data to assess the
genetic differences between the two expression groups in the
TCGA-PRAD dataset.
Prediction of immunotherapy response
and drug sensitivity
To predict immunotherapy response in patients with
PCa, the tumor immune dysfunction and exclusion (TIDE) score was
used to evaluate the response to immunotherapy in the Tumor Immune
Dysfunction and Exclusion (TIDE) database (http://tide.dfci.harvard.edu/). Differences between
expression groups was assessed utilizing the Wilcoxon rank-sum test
(P<0.05). A higher TIDE score indicates a greater immune escape
of tumor cells. Subsequently, Spearman's correlation analysis was
utilized to determine the correlation between biomarkers and TIDE
score.
Furthermore, using the TCGA-PRAD dataset, the
estimate (v1.0.13) package (https://R-Forge.R-project.org/projects/estimate/)
was utilized to calculate the StromalScore, ImmuneScore and
EstimateScore of biomarkers in the expression groups, and the
differences in these groups were compared using the Wilcoxon
rank-sum test (P<0.05). Lastly, the immune subtypes of disease
samples were divided according to the gene expression of immune
cells in tumors using the ImmuneSubtypeClassifier (v0.1.0) package
(https://github.com/CRI-iAtlas/ImmuneSubtypeClassifier),
and the differences among immune subtypes were then compared using
the Wilcoxon rank-sum test (P<0.05).
Subsequently, using the oncoPredict (v0.2) package
(28), the 50% inhibitory
concentration (IC50) values of 198 chemotherapeutic
drugs were determined according to the Genomics of Drug Sensitivity
in Cancer (GDSC; http://www.cancerrxgene.org/), and the IC50
values of each chemotherapeutic drug were compared between the
expression groups using the Wilcoxon rank-sum test (P<0.05).
RT-qPCR
PCa and adjacent non-cancerous tissues were obtained
from the First Hospital of Shanxi Medical University (Taiyuan,
China). A total of 6 cancer tissues and 6 adjacent non-cancerous
tissue were collected from the pathological specimens of 6 patients
after radical prostatectomy. All the participants were male, and
the age range of patients was 60–75 years, with an average age of
68±5 years. Ethical approval was granted by the hospital Ethics
Committee (approval no. KYLL-2024-100). All participants provided
written informed consent to participate in the present study.
Total RNA was extracted using the TRIzol®
method (Invitrogen; Thermo Fisher Scientific, Inc), and cDNA was
synthesized following the instructions of the
PrimeScript™ RT reagent Kit (cat. no. RR047A; Takara
Bio, Inc.). For RT-qPCR, the reactions were performed using an
Applied Biosystems 7300 Real-Time PCR machine (Thermo Fisher
Scientific, Inc). The reaction mixture consisted of 10 µl 2X SYBR
Green qPCR MasterMixII (Universal; Saiwen Innovation (Beijing)
Biotechnology Co., Ltd), 2 µl cDNA, 0.4 µl each of upstream and
downstream primers and ddH2O to a final volume of 20 µl.
The specific reaction conditions were the pre-denaturation in the
first stage: 95°C, 3 min. The second stage of denaturation,
annealing and extension: 95°C, 5 sec; 60°C, 30 sec; 60°C, 30 sec,
respectively (40 cycles). Final extension of the third stage: 60°C,
5 min. A total of 12 samples were collected and each sample was
tested three times. GAPDH served as the internal control, and the
data were analyzed using the 2−ΔΔCq method (29). The primers used are listed in
Table SII.
Western blot analysis
Protein was extracted from PCa tissues using RIPA
lysis buffer (cat. no. P0013B; Beyotime Biotechnology). The
bicinchoninic acid protein assay was used to determine protein
concentration. The percentage of gel was 10%, 30 µg of the sample
was added to each well and was then subjected to SDS-PAGE and
transferred to a PVDF membrane (cat. no. 0000279048;
MilliporeSigma). To block nonspecific binding, the membranes were
incubated with 5% skimmed milk (cat. no. GC310001-100g; Wuhan
Servicebio Technology Co., Ltd.) and 0.1% Tween-20 (cat. no.
GC204002-100 ml; Wuhan Servicebio Technology Co., Ltd.) in Tris
buffer at room temperature for 30 min. RMI1 primary antibodies
(cat. no. 14630-1-AP; Proteintech Group, Inc.) were diluted with
antibody dilution buffer (1:1,000; cat. no. P0023A; Beyotime
Biotechnology) and incubated overnight with the membrane at 4°C,
followed by three washes with TBST. Subsequently, the appropriate
goat anti-rabbit IgG (H+L) secondary antibodies (cat. no. 31460;
Invitrogen; Thermo Fisher Scientific, Inc.) was diluted with 1X
TBST (1:3,000) and incubated at room temperature for 1 h. Protein
bands were visualized using an ultra-sensitive ECL
chemiluminescence kit (cat. no. PK10003-100 ml; Proteintech Group,
Inc.), and images were captured using an imaging system (Bio-Rad
Laboratories, Inc.). The relative gray values of the protein bands
were measured by ImageJ (v2.16.0; National Institutes of Health),
using tubulin as the internal control. The molecular weights of
RMI1, GAPDH and tubulin are 75, 36 and 55 kDa, respectively.
Cell culture and transfection
Human PCa cells PC-3 were purchased from Immocell
(Xiamen Yimo Biotechnology Co., Ltd.; cat. no. IM-H075; http://www.immocell.com/?ryxbx/1680.html). The PC-3
cell line was verified using short tandem repeat profiling and
passaged in the laboratory for <6 months.
Knockdown in the present study was performed using
RNA silencing. The plasmids used in the experiment were constructed
by our research group independently. The plasmid concentrations of
the short hairpin negative control (shNC) and RMl1-shRNA-1,
RMl1-shRNA-2, and RMl1-shRNA-3 were 524, 465, 369, and 350 ng/µl,
respectively. Transfection was performed at 37°C for 24 h using the
jetPRIME® transfection reagent (cat. no. 101000025;
Polyplus-transfection SA). The medium was replaced, followed by
continuous culture for 48 h. Subsequent functional experiments were
performed when the cells reached confluence. RT-qPCR and western
blotting were used to assess the silencing efficiency of short
hairpin (sh)RNA-transfected cells. The targeted sequences of shRNA
and the shNC sequence were shown in Table SIII.
CCK-8 assay
Transfected cell suspensions were added to 96-well
plates at a volume of 100 µl per well and subsequently incubated
with 10 µl CCK-8 solution (Beyotime Biotechnology) for 4 h at 37°C.
Absorbance was then measured at 450 nm using a microplate reader
(Feyond-A300; Hangzhou Allsheng Instruments Co., Ltd.).
Cell scratch test
In the scratch assay, cells in the logarithmic
growth phase were digested and plated at a designated density into
6-well culture plates. The seeding process aimed to achieve 100%
confluence following overnight incubation, using a final medium
volume of 2 ml per well. After 24 h of incubation at 37°C with 5%
CO2, the cells were scored perpendicular to the bottom
of the wells using a 200 µl pipette tip, with the lid or ruler of
the 6-well plate serving as a reference. Subsequently, the cells
were washed three times with PBS to eliminate debris, and
serum-free medium was added. Images were captured under a ×4
magnification though an inverted fluorescence microscope (cat. no.
MF52-N; Mshot) to ensure that the scratch was centered and
perpendicular with a consistent background. Test samples of
different concentration gradients were added. Samples were taken at
0 and 40 h and images were captured. Results were analyzed using
ImageJ software (v1.4.3.67; National Institutes of Health). In the
scratched area, 6–8 horizontal lines were randomly drawn, and the
average distance between cells was measured to determine the cell
migration rate.
Transwell migration assay
The Transwell migration assay was performed using a
Transwell chamber. After 24 h of cell culture, a serum-free
suspension of 1×10⁵ cells (100 µl) was added to the
upper Transwell chamber, while 600 µl complete medium supplemented
with 30% FBS (Thermo Fisher Scientific, Inc.) was added to the
lower chamber. Following 24 h of incubation at 37°C, a wet cotton
swab was used to carefully remove the non-migratory cells from the
upper membrane surface, whilst crystal violet was used to stain the
migrating cells on the bottom surface at room temperature for 10
min. After another 24-h incubation at 37°C, the process was
repeated to ensure thorough staining. The migrating cells were then
observed and images were captured under an inverted fluorescence
microscope (cat. no. MF52-N; Mshot). Cell counts were performed in
three randomly selected fields, and the average number of migrating
cells was calculated to assess cell migration capability.
Statistical analysis
All analyses were performed using R version 4.2.2
(The R Foundation) and GraphPad Prism 9 (Dotmatics). For
comparisons between groups, the Wilcoxon rank-sum test, log-rank
test and unpaired two-tailed Student's t-test were used. For group
comparisons of three or more groups, the Wilcoxon rank-sum test for
pairwise comparisons and then adjusted the significance levels
using Bonferroni correction was used. Data values were presented as
mean ± standard deviation (SD) in the experimental analyses.
Statistical analysis of the experimental section employed unpaired
two-tailed Student's t-tests and one-way analysis of variance
(ANOVA), followed by the least significant difference test. For the
comparison of the three sets of data involved in the experiment
section, Tukey's test was used for statistical analysis. The
experimental data were analyzed using SPSS software (version 26;
IBM Corp.). P<0.05 was considered to indicate a statistically
significant difference.
Results
Functional characteristics of DEGs in
PCa
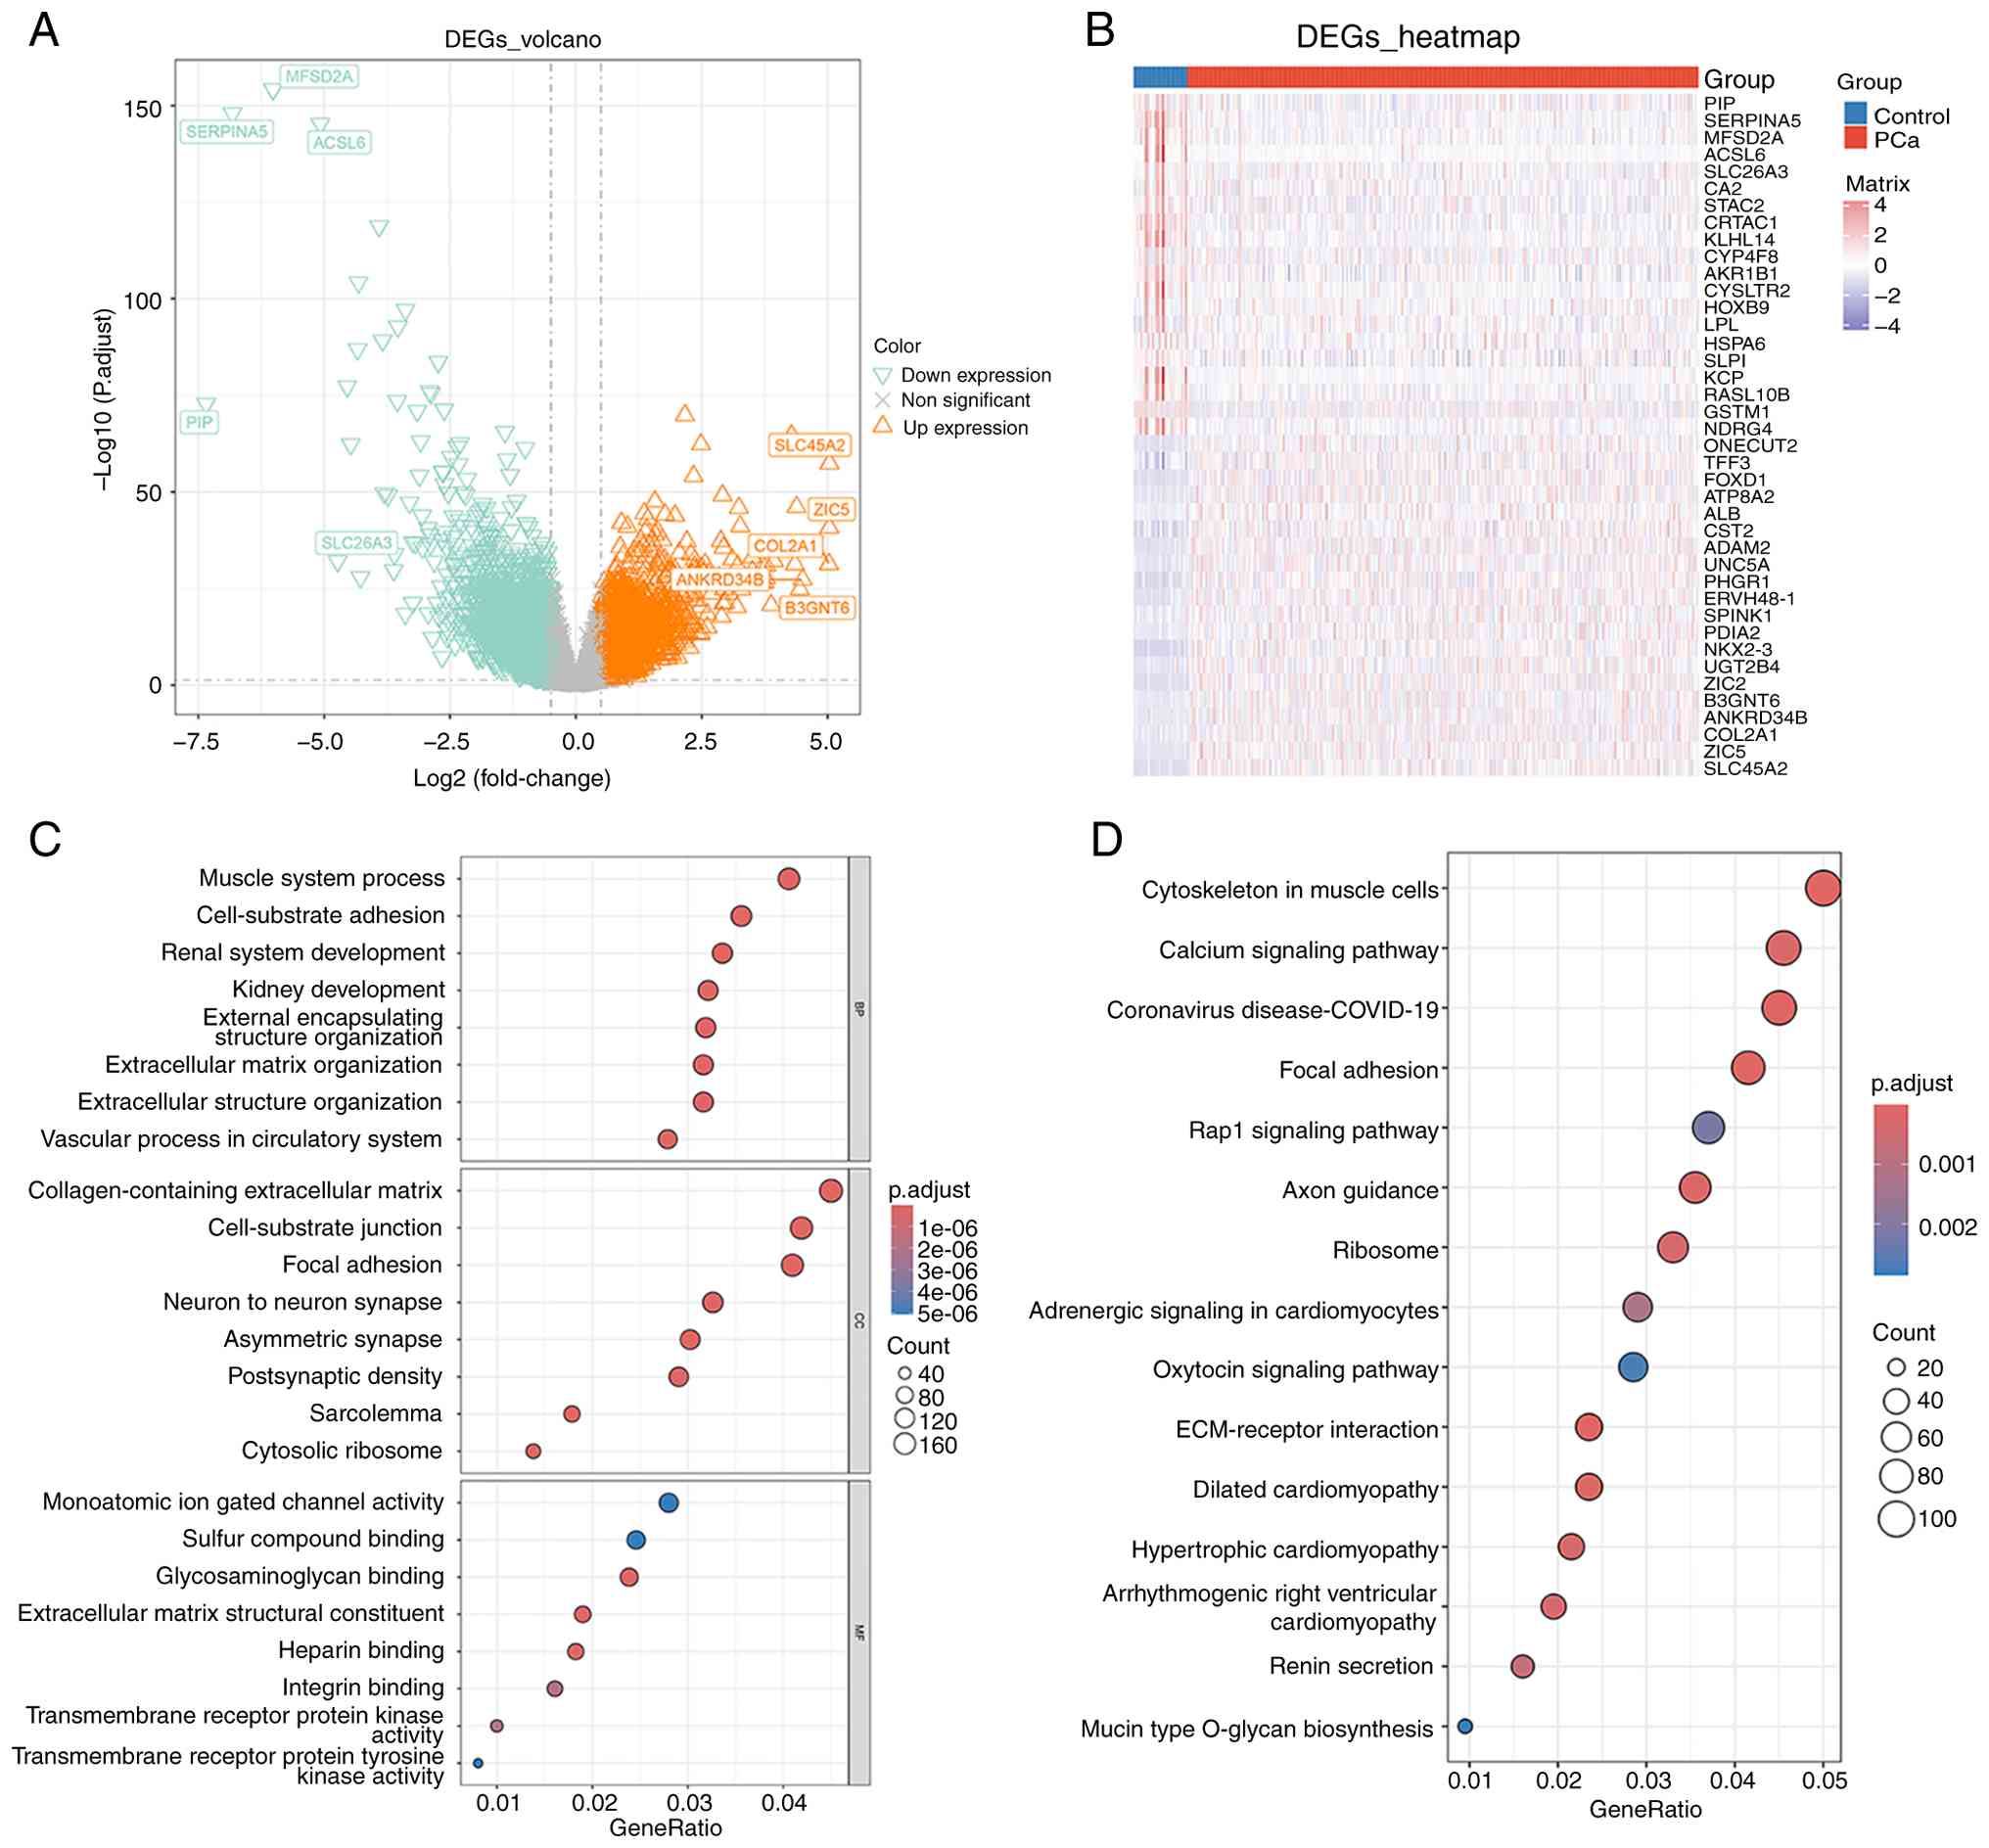
The gene expression levels of DEGs between PCa and
control samples were assessed. This analysis identified a total of
4,395 DEGs, comprising 2,039 genes that were upregulated and 2,356
genes that were downregulated. The volcano plot and heatmap are
presented in Fig. 1A and B. In
addition, according to the results of GO analysis, 1,075 biological
processes, 102 cellular components and 93 molecular functions were
enriched by DEGs. They were mostly engaged in ‘positive regulation
of DNA-binding transcription factor activity’, ‘ribosomal subunit’
and ‘regulation of stress-activated protein kinase signaling
cascade’ (Fig. 1C). Furthermore, 39
KEGG pathways were enriched by DEGs, such as ‘regulation of actin
cytoskeleton’, ‘ribosome’, ‘adrenergic signaling in
cardiomyocytes’, ‘MAPK signaling pathway’ and ‘cAMP signaling
pathway’ (Fig. 1D). These analyses
suggested that the identified DEGs may be involved in a wide range
of biological mechanisms underlying PCa development.
RMI1 identified as a biomarker
Through Venn diagram analysis, it was revealed that
growth differentiation factor 15 (GDF15) and RMI1 were jointly
screened out at the intersection of DEGs, DRGs and EHRGs (Fig. 2A). The research on the GDF15 gene in
the field of PCa has been relatively in-depth, with a number of
studies exploring its functions and mechanisms of action (30–34).
Therefore, RMI1, whose biological functions in PCa have not yet
been fully elucidated, was chosen as the key research target.
Further analysis demonstrated that the expression trends of RMI1
were consistent and significant across four datasets, and were
revealed to be highly expressed in the PCa group compared to the
control group based on the Wilcoxon test results (Fig. 2B-E). Additionally, RMI1 expression
demonstrated consistent and significant differences (P<0.05) in
both RT-qPCR and western blot analyses, establishing it as a robust
biomarker (Fig. 2F and G). The
consistent and statistically significant expression patterns of
RMI1 observed across multiple datasets and experimental validations
suggest that RMI1 might serve a pivotal role in the progression of
PCa.
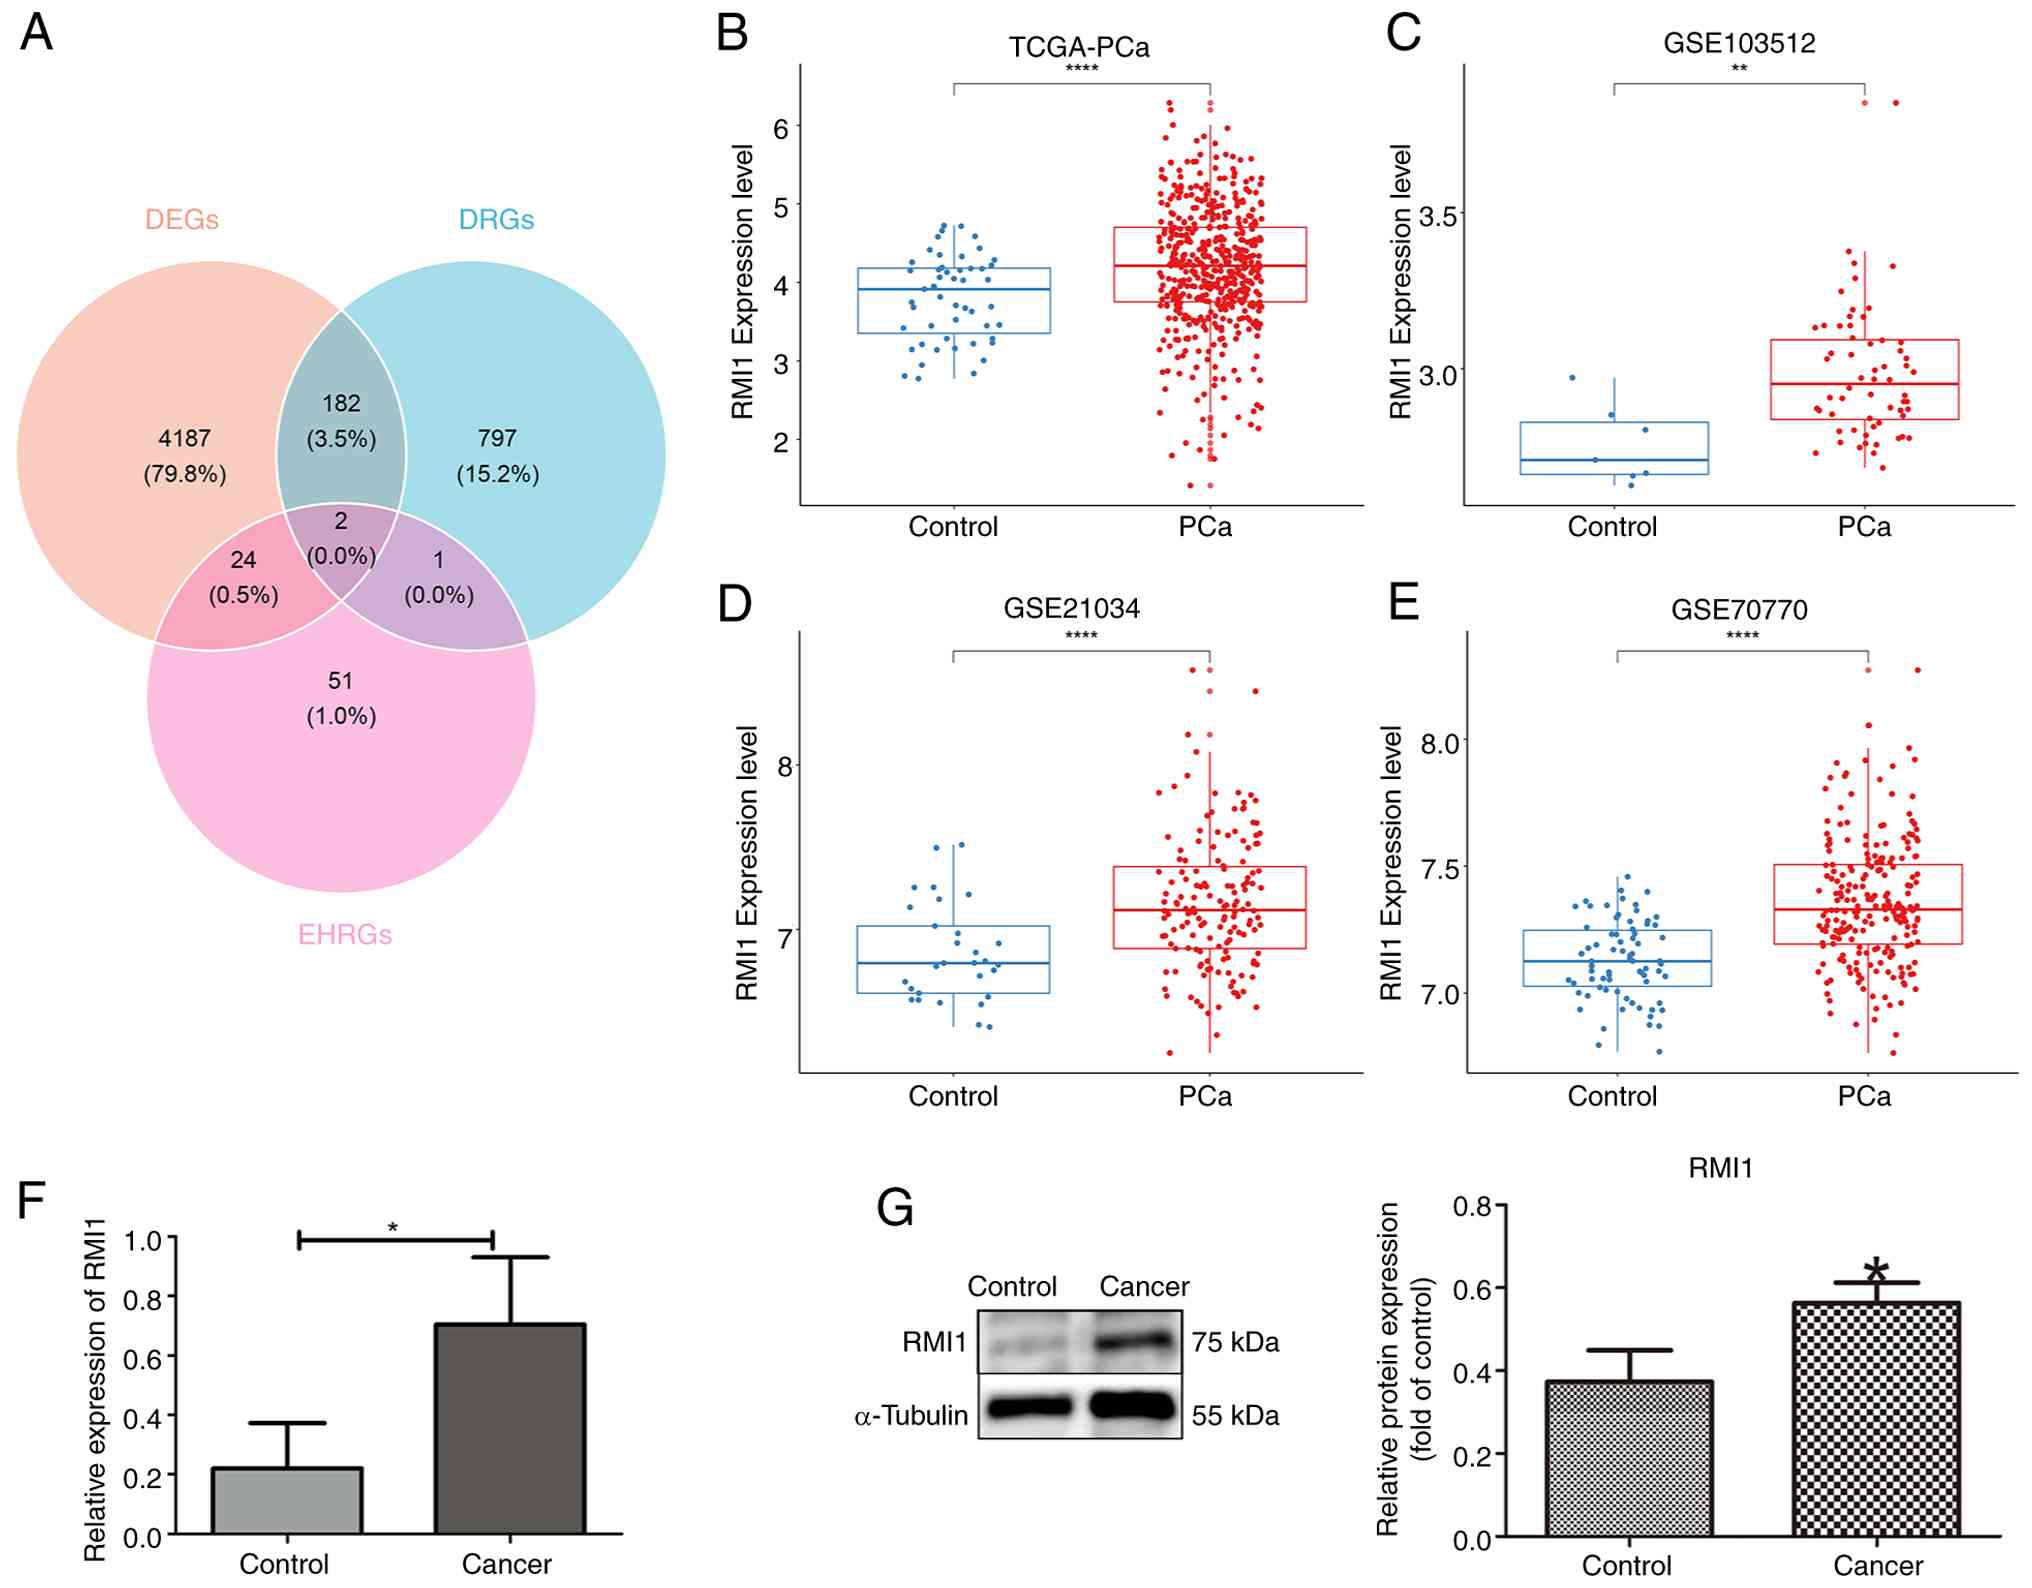 | Figure 2.Screening of biomarkers. (A) GDF15
and RMI1 were obtained from the intersection of DEGs, DRGs and
EHRGs. (B-E) A total of four datasets validated the expression of
RMI1, (B) TCGA-PCa, (C) GSE103512 dataset (D) GSE21034 dataset (E)
GSE70770 dataset. (F) RT-qPCR box plot of RMI1. (G) Protein
differential expressions of RMI1. *P<0.05,
**P<0.01, ****P<0.0001. GDF15, growth
differentiation factor 15; RMI1, RecQ mediated genome instability
1; DEGs, differentially expressed genes; DRGs, DNA replication
stress-related genes; EHRGs, energy homeostasis-related genes;
TCGA, The Cancer Genome Atlas; PCa, prostate cancer; RT-qPCR,
reverse transcription-quantitative PCR. |
Analysis of survival difference
between the expression groups
To evaluate the effect of RMI1 expression on patient
survival, patients were categorized into high and low expression
groups according to their levels of RMI1 expression. Survival
outcomes were then compared, including OS, DSS, DFI, PFI and RFS,
between these groups. The analysis indicated notable differences in
OS, DSS and PFI between patients with high and low levels of RMI1
expression in the TCGA-PRAD dataset (Fig. 3A-C). However, this dataset did not
show any significant differences in DFI and RFS (Fig. S1A and B). In addition, although the
difference in RFS did not reach statistical significance in the
TCGA-PRAD dataset (despite there being a trend towards a lower
recurrence-free rate noted in the high expression group with
P<0.1), significant differences in RFS were demonstrated in
other datasets, specifically GSE70770 and GSE54460 (Fig. 3D-E). This suggested that RMI1 may
influence BCR in PCa. Furthermore, notable variations in RMI1
expression levels were observed across different subgroups based on
Gleason grading, T-staging and N-staging (Fig. 3F). Furthermore, the χ2
test results indicated a significant difference in T-staging among
patients with varying levels of RMI1 expression (Fig. 3G).
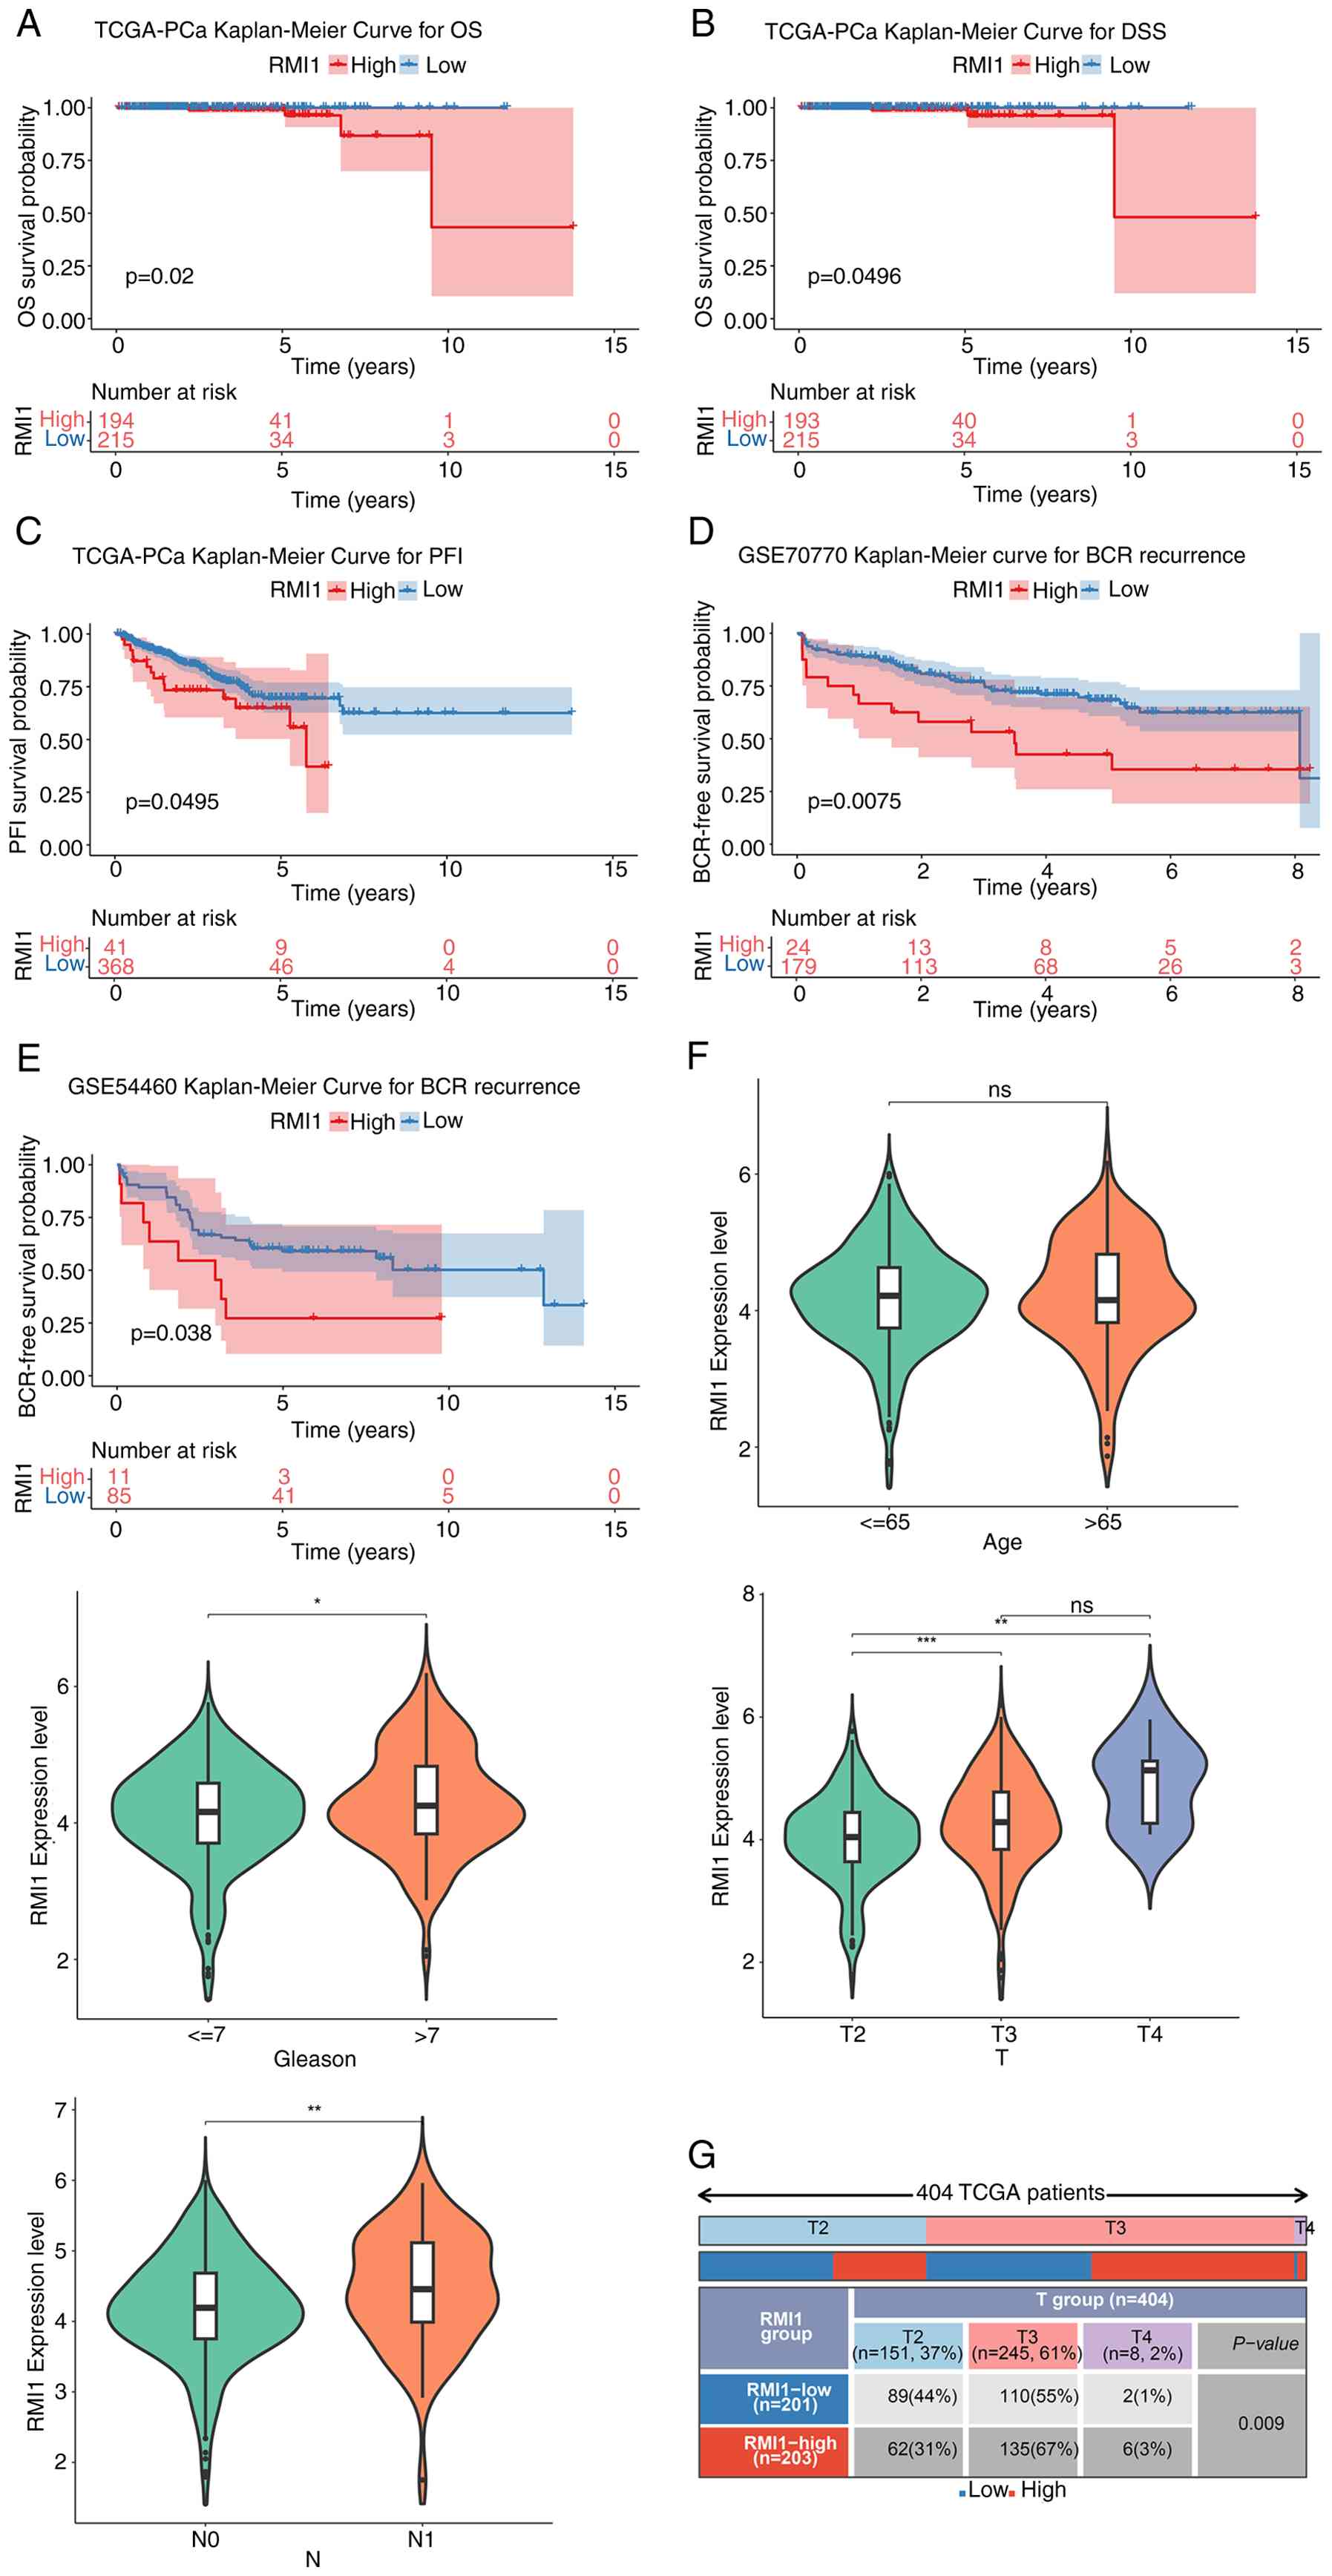 | Figure 3.Analysis of survival difference
between RMI1 high- and low-expression group. KM curves of (A) OS,
(B) DSS and (C) PFI between high and low expression groups. KM
curve for BCR recurrence in (D) GSE70770 and (E) GSE54460. (F)
Violin maps of differential RMI1 expression in subgroups with
different clinical characteristics. (G) Statistical map of the
percentage of subtypes with clinical features in the high and low
expression groups of the RMI1. *P<0.05, **P<0.01,
***P<0.001. ns, not significant. RMI1, RecQ mediated genome
instability 1; KM, Kaplan-Meier; OS, overall survival; DSS,
disease-specific survival; PFI, progression-free interval; BCR,
biochemical recurrence. |
Enrichment analysis and mutation
analysis
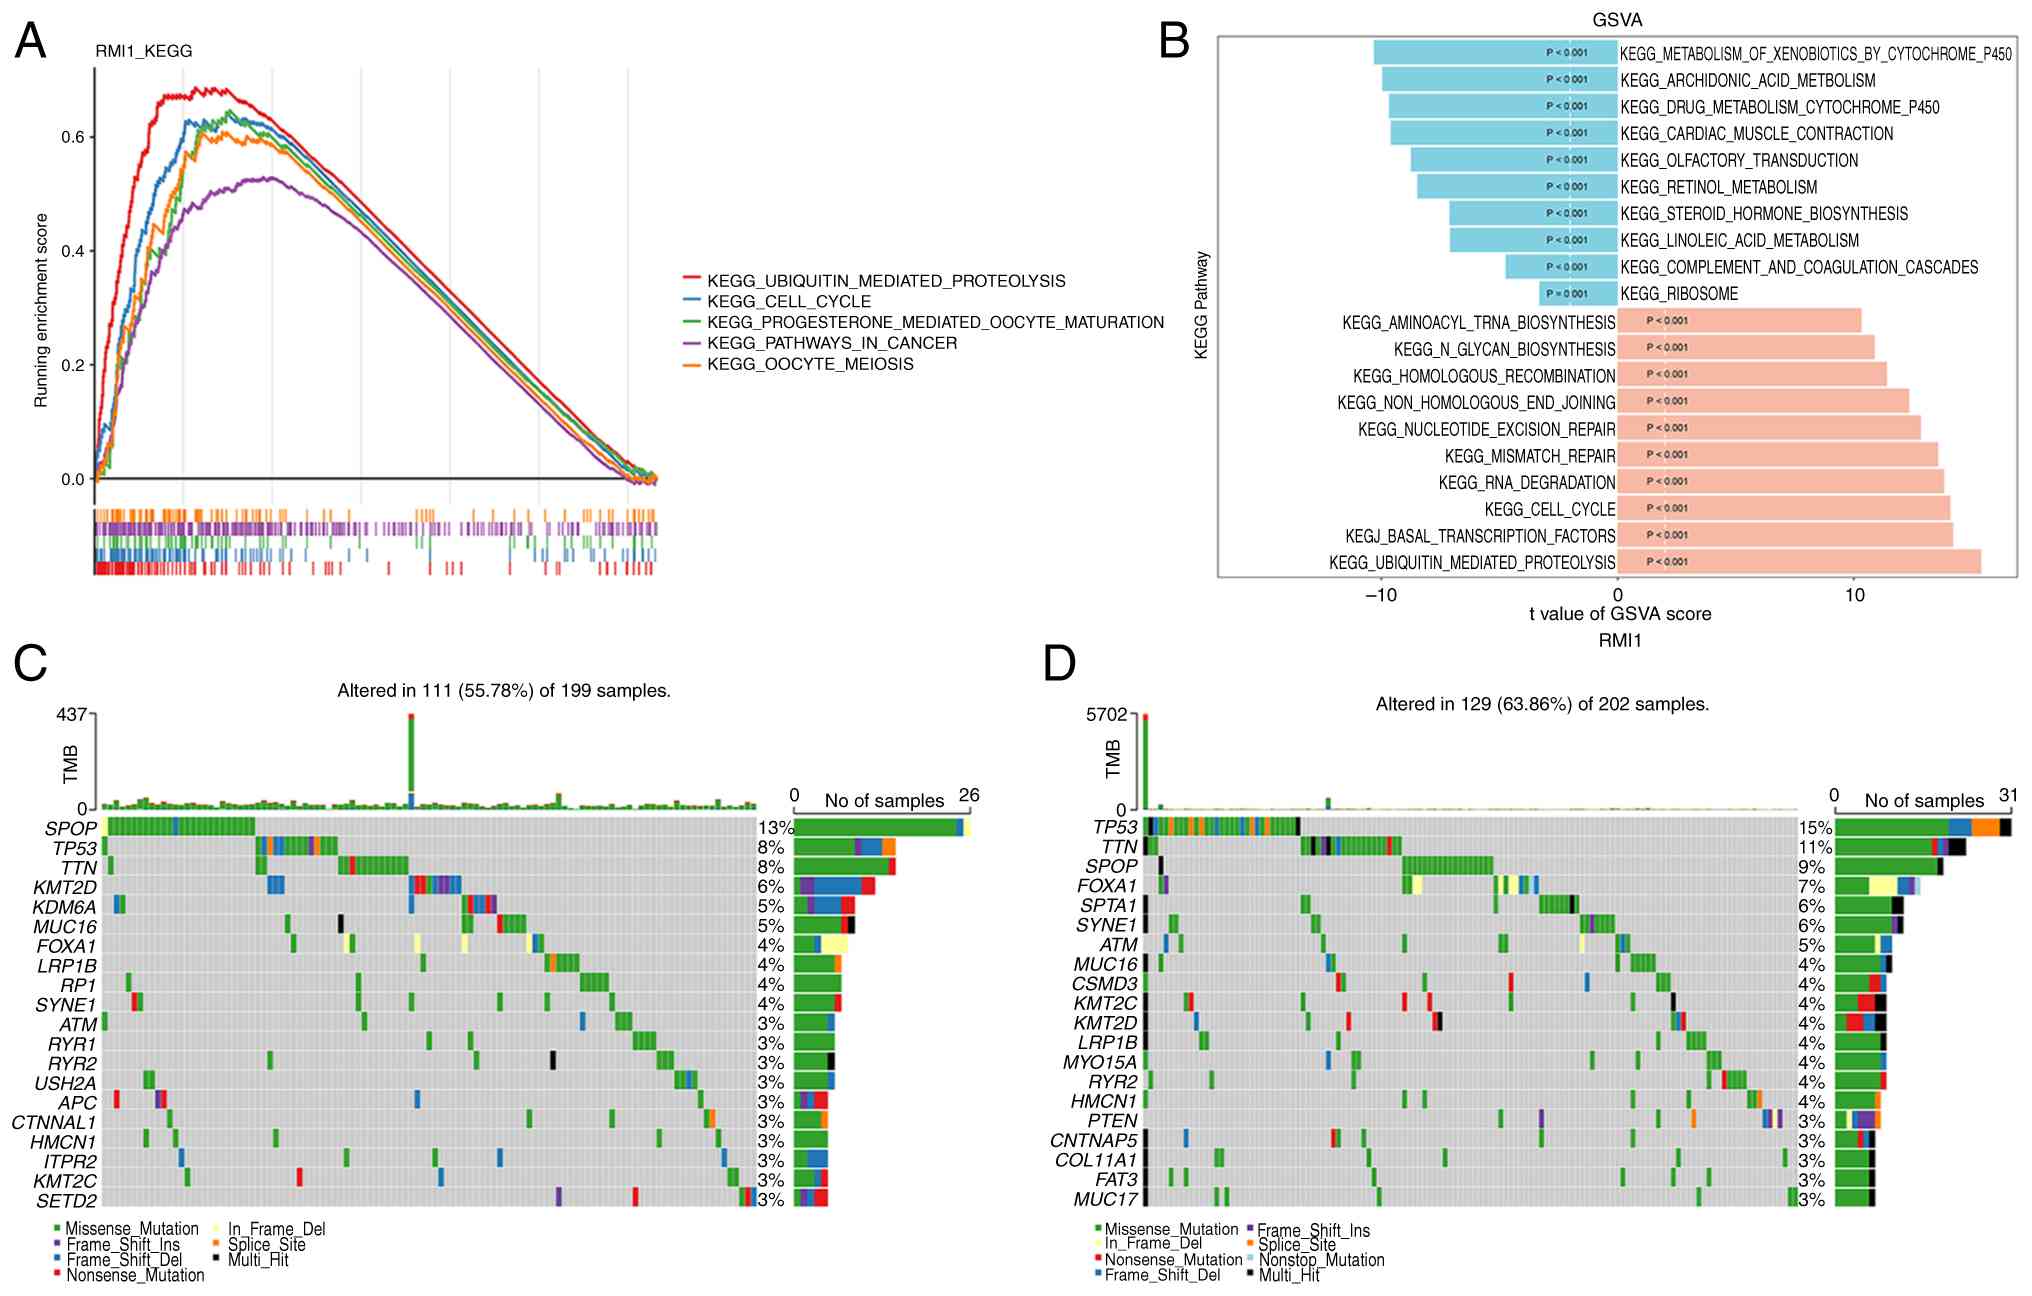
Enrichment analysis was used to delve deeper into
the functions of RMI1. GSEA demonstrated that RMI1 is involved in
71 KEGG pathways, primarily associated with the cell cycle, oocyte
meiosis and cancer-related pathways (Fig. 4A). In addition, GSVA revealed
significant differences in 143 pathways between the groups with
high and low RMI1 expression. Specifically, pathways related to the
metabolism of xenobiotics by cytochrome P450 were activated in the
low expression group, whilst pathways such as aminoacyl-tRNA
biosynthesis were activated in the high expression group (Fig. 4B). Additionally, the role of somatic
cell mutations on PCa was assessed using the mutated landscapes.
According to the waterfall plot, the low-expression group had the
highest frequency of speckle type POZ protein (SPOP) gene mutations
(13%), whilst the high-expression group had the highest frequency
of TP53 mutations (15%). SPOP and TP53 were both missense mutations
(Fig. 4C and D).
Analysis of RMI1 expression in immune
cell infiltration and drug sensitivity
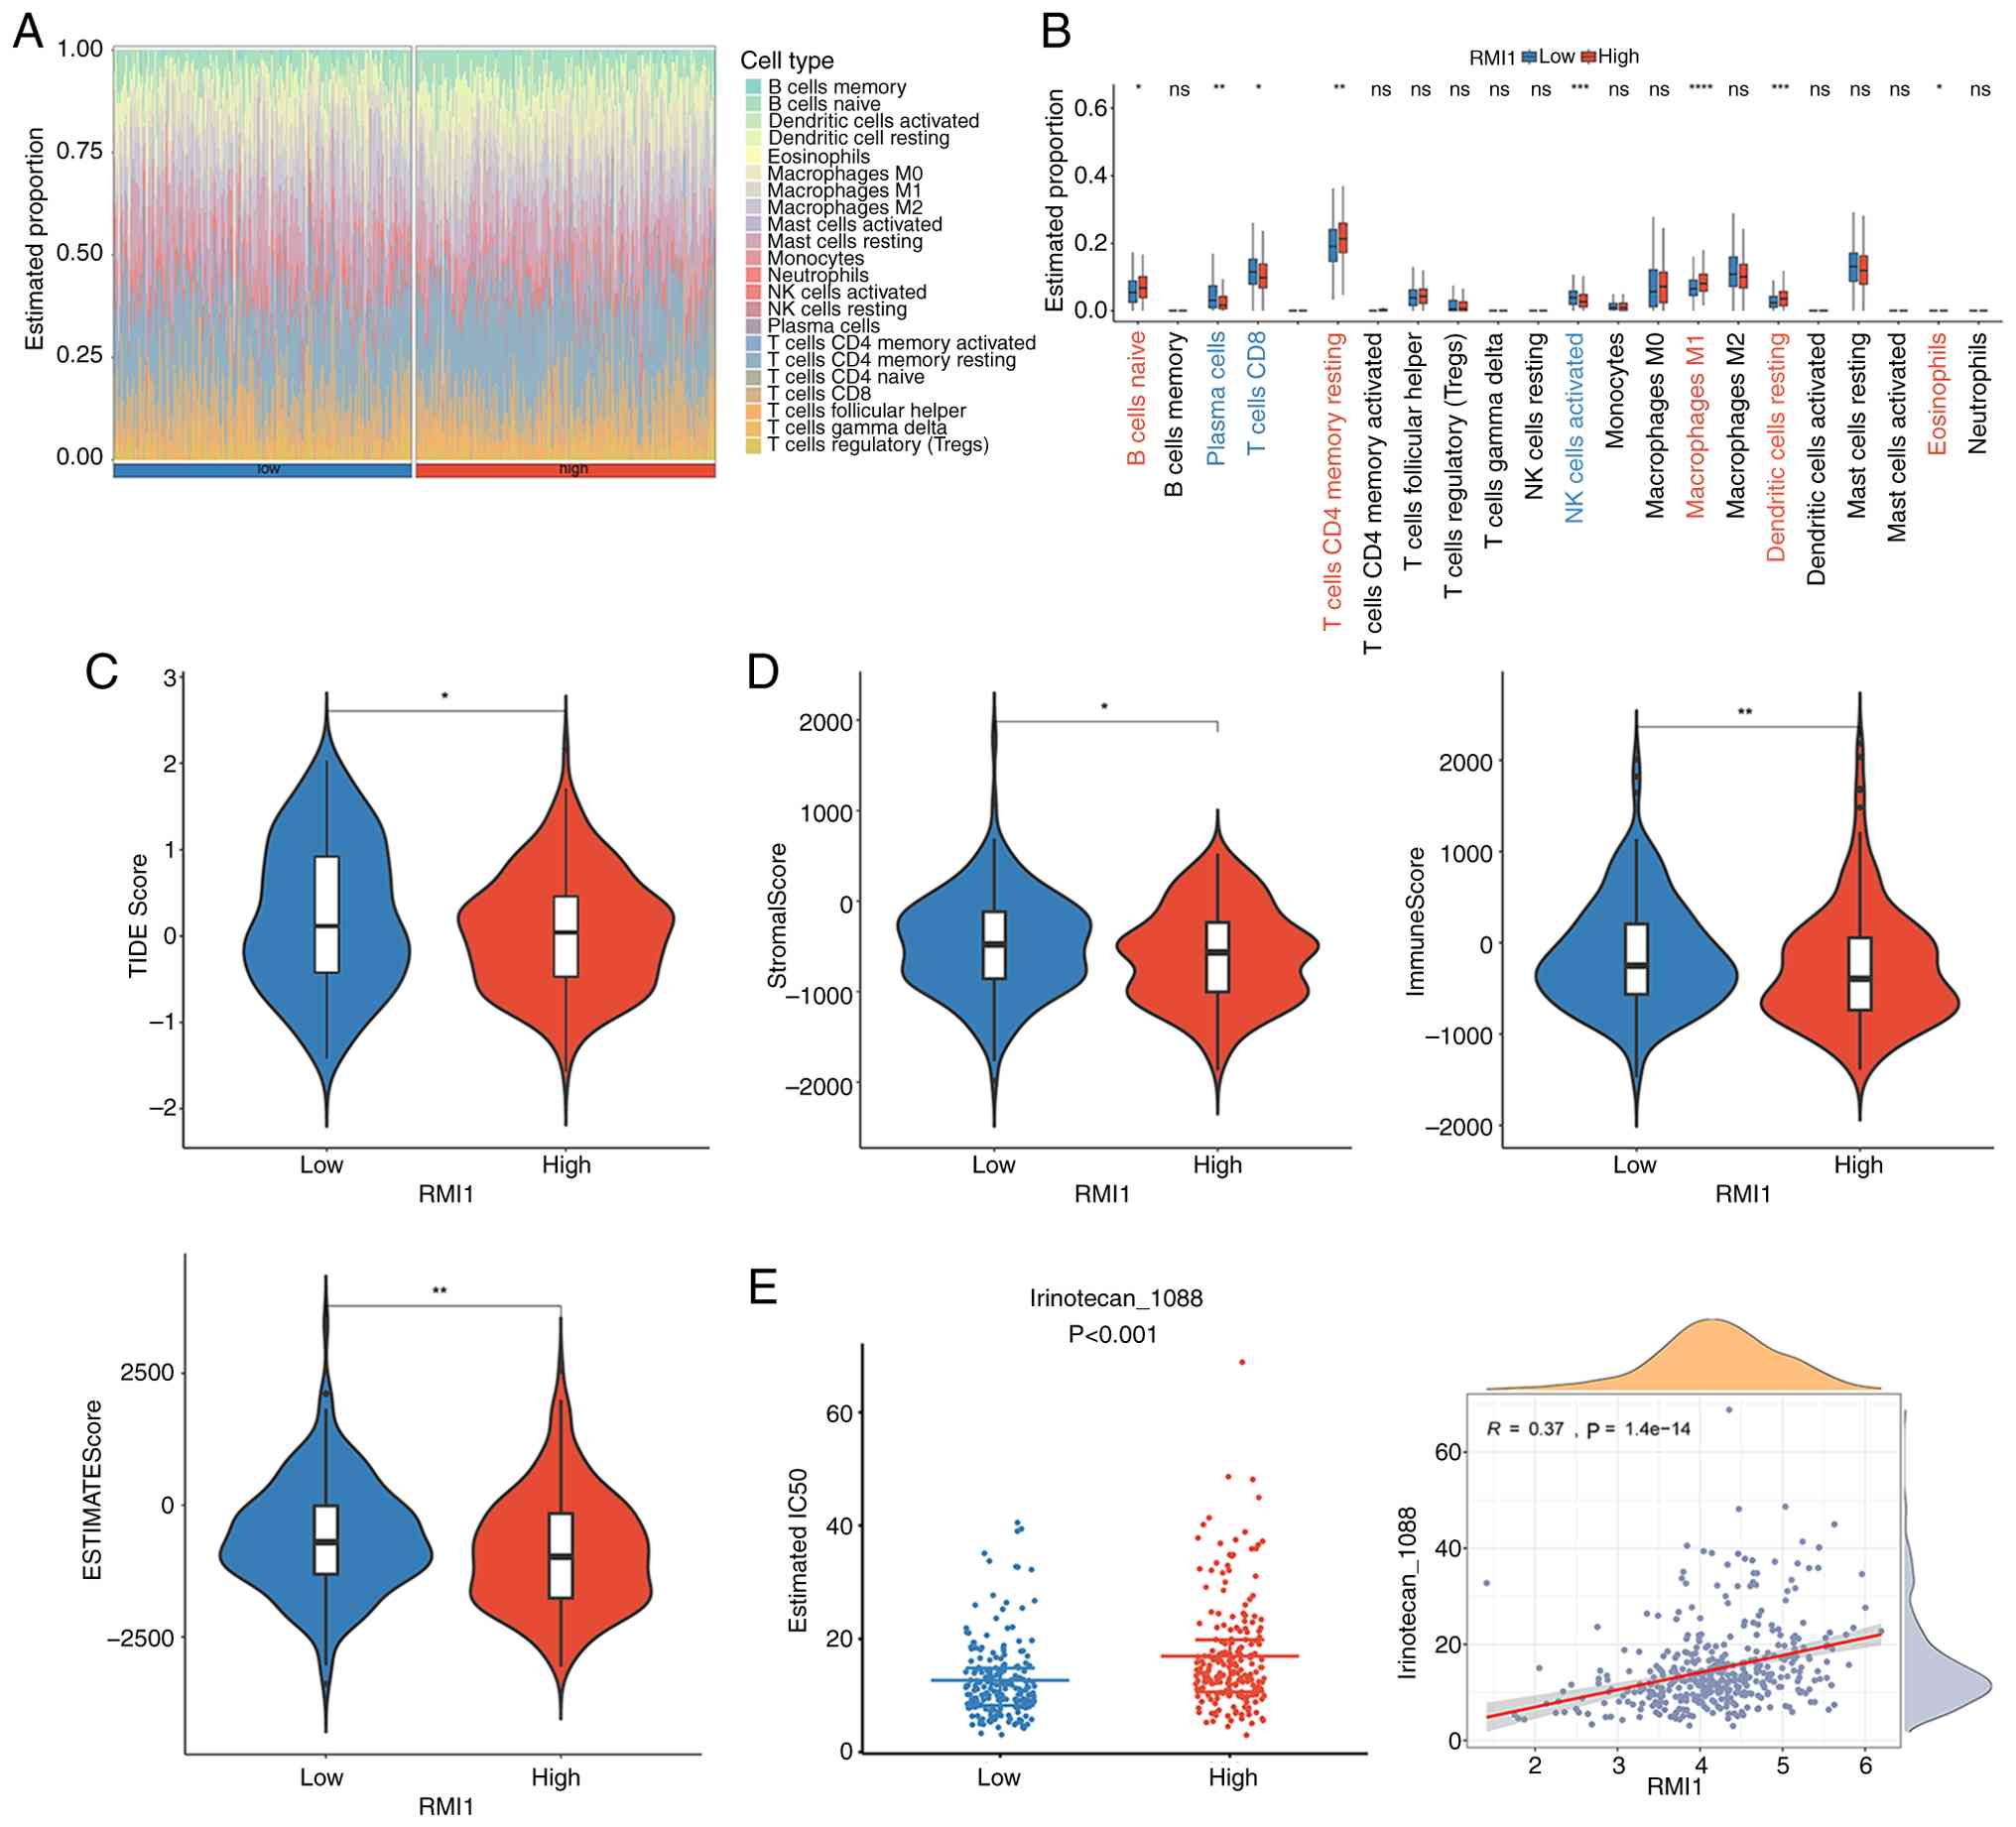
The results of immune cell infiltration are
presented in Fig. 5A. A total of
eight differential immunity cells were identified, such as naive B
cells, plasma cells and CD8 T cells (P<0.05; Fig. 5B). At the same time, the TIDE score
was markedly greater in the high-expression group (P<0.05;
Fig. 5C). In addition, the
StromalScore, ImmuneScore and EstimateScore of the high-expression
group were all markedly higher than those of the low-expression
group (P<0.05; Fig. 5D). This
suggests that high levels of the RMI1 may be associated with immune
escape and poor prognosis.
Furthermore, based on the 198 chemotherapy/targeted
therapy drugs provided by GDSC, 164 drugs with significant
differences in their IC50 values were identified in
different expression groups. In the boxplot demonstrating
differences in IC50 between the expression groups for
three common chemotherapy drugs for PCa (5-fluorouracil,
oxaliplatin and irinotecan), only irinotecan showed a significant
difference between the two expression groups (P<0.001) and had a
positive correction with RMI1 (cor=0.37) (Fig. 5E).
Effect of RMI1 expression on PCa cell
proliferation and migration
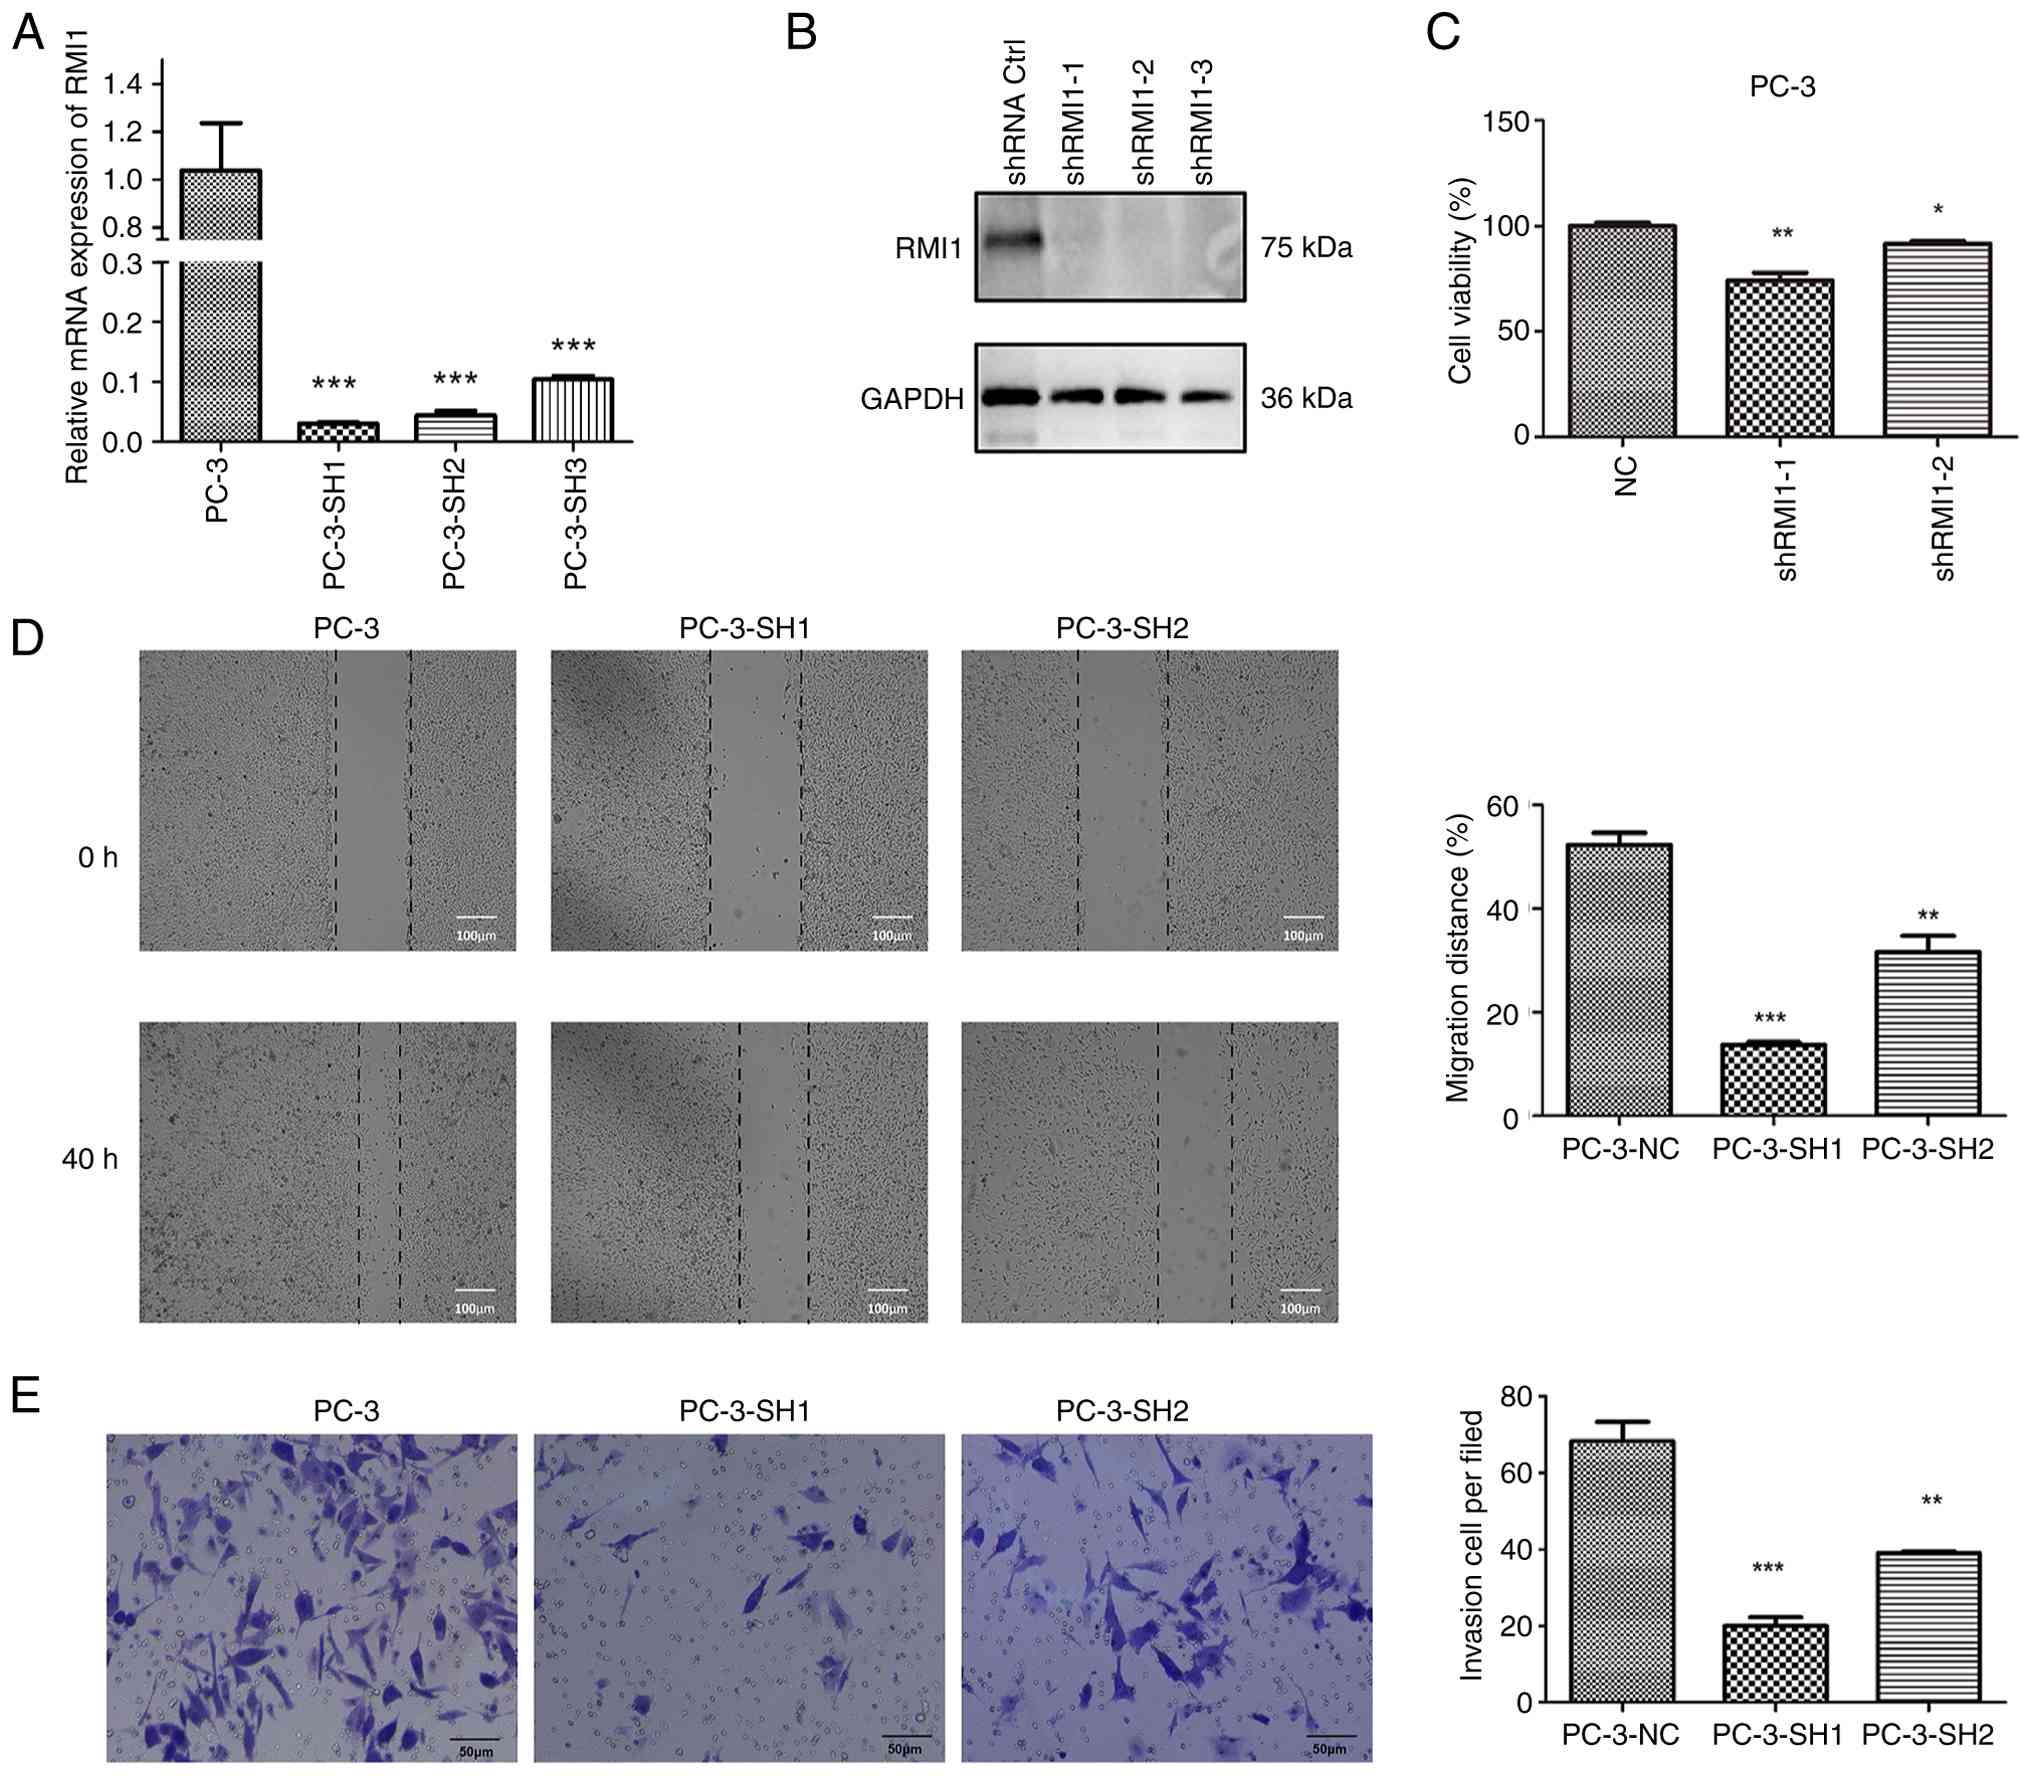
KM survival analysis indicated that higher RMI1
expression was associated with a worse prognosis in patients with
PCa. As a result, PC-3 cells with an improved prognosis were
constructed by transfecting sh-RMI1. The mRNA and protein
expression levels of the transfected cells confirmed that the
transfection was successful (Fig. 6A
and B). Furthermore, the CCK-8 assay results indicated a
significant reduction in cell viability for sh-RMI1 cells with
decreased RMI1 expression (P<0.05; Fig. 6C), suggesting that lowering RMI1
levels can inhibit the proliferation of PCa cells. Furthermore, the
findings from the scratch assay (Fig.
6D) and the Transwell migration assay (Fig. 6E) revealed that cells with reduced
RMI1 expression demonstrated markedly decreased migration
(P<0.05). These experiments suggested that RMI1 may serve a role
in enhancing the proliferation and migration of PCa cells. A
reduction in RMI1 expression led to decreased proliferation and
migration in these cells, indicating that RMI1 could be crucial for
the progression and metastasis of PCa.
Discussion
The therapeutic landscape for PCa is varied,
encompassing active monitoring, chemotherapy, radiation therapy,
hormone therapy, surgery and cryotherapy (35). Despite these options, the
near-universal development of hormone resistance among initially
responsive patients with PCa presents a formidable challenge, which
poses great difficulties for the treatment of PCa (36). Chemotherapy and immunotherapy may
become to be the efficiency treatments to extend survival of
PCa.
DNA replication stress is the main driving factor
for genomic instability and is considered a specific vulnerability
of cancer cells, which can be therapeutically exploitable in PCa
(14,37). Due to the notable heterogeneity
among patients with PCa, there is an urgent need for a dependable
approach to assess replication stress in this population.
Furthermore, to maintain homeostasis, each cell must constantly
monitor its energy levels and appropriately adjust the rate of
energy production in the form of ATP according to metabolic
demands. The continuous fulfillment of this energy demand relies on
the ability of the cell to sense, metabolize nutrients and convert
them into chemical energy (38).
The activation of AMPK enhances ATP production activity to restore
energy homeostasis, which may have beneficial effects on the
treatment of PCa (39). Therefore,
integrating DNA replication stress and energy homeostasis to
investigate their roles in PCa may lead to the identification of
new diagnostic biomarkers.
In the present study, two candidate biomarkers were
identified: GDF15 and RMI1. RMI1 became the focus of research due
to the lack of existing studies on it in PCa. Using four datasets
and performing RT-qPCR and western blotting, it was demonstrated
that the expression levels of RMI1 was notably higher in PCa
tissues than in the control tissues, thus indicating a potential
new biomarker for the diagnosis of PCa.
RMI1 has been reported to be markedly associated
with prognosis across several diseases (40,41).
Research indicates that the expression level of RMI1 remains
unchanged during the G1, S and G2 phases of
the cell cycle, yet it notably increases in the M phase. In
addition, RMI1 undergoes phosphorylation during mitosis.
Particularly under the influence of mitotic microtubule interfering
agents, RMI1 is mainly phosphorylated at serine residues 284 and
292 (42). RMI1 is essential for
DNA repair and is closely associated with several human diseases,
including cancer and obesity (43,44).
Research indicates that RMI1 is markedly involved in the
progression of gliomas (45). In
addition, RMI1 has been identified as a novel regulator of energy
homeostasis, suggesting that RMI1 modulators could improve the
prognosis of several diseases associated with energy homeostasis,
such as obesity (46). However,
there is a lack of data on the role of the RMI1 in PCa, and further
research is needed. The present study silenced RMI1 expression to
further explore its role in PCa progression, focusing on cell
proliferation, migration and invasion. The findings indicated that
knocking down RMI1 markedly decreased cell proliferation and
hindered both migration and invasion. Additionally, clinical data
revealed that elevated RMI1 expression was associated with poor
patient outcomes, including advanced tumor stages and lower
survival rates. These results implied that RMI1 is a key factor in
the progression of PCa, as it promotes tumor growth and metastasis.
Given its dual role in enhancing aggressive tumor behavior and its
association with negative clinical outcomes, RMI1 may be a valuable
biomarker for risk assessment and a potential therapeutic target
for preventing the advancement and spread of PCa.
PCa is generally considered a ‘cold’ tumor,
characterized by relatively few immune cell infiltrations in its
tumor microenvironment (TME) (35,47).
In the present study, immunoinfiltration analysis was performed on
several RMI1 expression groups to elucidate the role of RMI1 in
PCa. The results revealed significant differences in eight types of
immune cells between the groups, including CD8+ T cells
and M1 macrophages. The antitumor immune response in PCa primarily
relies on CD8+ T cells (48). However, the presence of
CD8+ T cells in the PCa microenvironment is limited, and
a large proportion of these cells are exhausted (49). In addition, macrophages are a
crucial component of the TME. Macrophages generated from bone
marrow are essential for preserving tissue homeostasis, regulating
inflammatory responses, encouraging tissue repair and thwarting
infections (50). M1-type
macrophages serve an essential part in the PCa TME by generating
several pro-inflammatory cytokines and chemokines (51). In summary, the immune
microenvironment of PCa is complex and has unique characteristics,
and RMI1 may serve a vital role in regulating immune cell
infiltration and function. However, its specific mechanisms and
role in the progression of PCa require further research.
To further explore the underlying biological
mechanisms of RMI1, the present study performed GSEA. The results
revealed that the top five pathways were
‘KEGG_UBIQUITIN_MEDIATED_PROTEOLYSIS’, ‘KEGG_CELL_CYCLE’,
‘KEGG_PROGESTERONE_MEDIATED_OOCYTE_MATURATION’,
‘KEGG_PATHWAYS_IN_CANCER’ and ‘KEGG_OOCYTE_MEIOSIS’: The
‘KEGG_UBIQUITIN_MEDIATED_PROTEOLYSIS’ pathway is crucial for
protein degradation and may regulate the stability and abundance of
RMI1; the ‘KEGG_CELL_CYCLE’ pathway controls the orderly
progression of the cell cycle, and RMI1 likely participates in it,
especially during mitosis; the
‘KEGG_PROGESTERONE_MEDIATED_OOCYTE_MATURATION'pathway is associated
with reproductive processes, yet might have potential intersections
with the functions of RMI1; the ‘KEGG_PATHWAYS_IN_CANCER’ pathway
reflects several aspects of cancer development, and RMI1 may serve
a notable role in it to promote PCa progression; and the
‘KEGG_OOCYTE_MEIOSIS’ pathway is vital for genetic material
distribution in reproductive cells and could also be associated
with the function of RMI1 in maintaining genomic stability.
However, its connection with PCa requires further exploration.
Overall, these pathways may all have different degrees of
association with RMI1 and are worthy of further in-depth study to
improve the understanding of the role of RMI1 in PCa
development.
The present study utilized a diverse range of
bioinformatics techniques, such as enrichment analysis, survival
analysis, immune infiltration assessment and predictions for
chemotherapeutic drugs, to uncover biomarkers associated with DNA
replication stress and energy homeostasis in PCa. Additionally,
functional and molecular mechanism analyses were performed,
revealing that RMI1 may facilitate the progression of PCa. However,
the present study has certain limitations: Although the findings
demonstrated the key role of RMI1 in the proliferation and
migration of PCa cells, the underlying molecular mechanisms remain
incompletely understood. Although bioinformatics analyses such as
GSEA and GSVA indicated the possible molecular pathways involved
(such as cell cycle and oocyte meiosis), these predictive results
lacked direct experimental evidence to support them. Future
research should perform transient transfection of the RMI1 plasmid
in PC-3 cells transfected with sh-RMI1 to detect whether the cell
proliferation and migration abilities are restored. Furthermore,
future studies should investigate whether the expression and
activity of direct downstream effector molecules change in key
pathways such as the cell cycle, to further elucidate the mechanism
of action of RMI1. Finally, due to the limited sample size from a
single center, additional validation studies are necessary to
evaluate the impact of this gene on PCa cell biology.
In conclusion, the present study identified RMI1, a
biomarker associated with DNA replication stress and energy
homeostasis in PCa, and revealed that it has a marked effect in the
development of PCa. These findings may have profound implications
for PCa risk stratification and therapeutic guidance, and provide a
foundation for future research.
Supplementary Material
Supporting Data
Supporting Data
Acknowledgements
Not applicable.
Funding
The present study received support from the Shanxi Provincial
Higher Education Institutions Scientific and Technological
Innovation Program (grant number: 2024-83), the Health Commission
of Shanxi Province Fund (grant number: 2020087) and the Academy
Youth Foundation of First Hospital of Shanxi Medical University
(grant number: YQ1504).
Availability of data and materials
The data generated in the present study may be
requested from the corresponding author.
Authors' contributions
Conceptualization was by XC and BW. Methodology was
by PS. Software was by XW. Validation was by PS, XW and XY. Formal
analysis was by HD. Investigation was by XC. Resources was by BW.
Data curation was by PS. Writing and original draft preparation was
by PS. Writing-review and editing was by XW and HD. Visualization
was by XY. Supervision was by B.W. Project administration was by
XC. Funding acquisition was by PS and XC. PS and XC confirm the
authenticity of all the raw data.
All authors read and approved the final
manuscript.
Ethics approval and consent to
participate
The present study was conducted in accordance with
the Declaration of Helsinki, and approved by the Ethics Committee
of First Hospital of Shanxi Medical University (ethics approval no.
KYLL-2024-100). The participants provided their written informed
consent to participate in this study.
Patient consent for publication
Not applicable.
Competing interests
The authors declare that they have no competing
interests.
References
|
1
|
Rawla P: Epidemiology of prostate cancer.
World J Oncol. 10:63–89. 2019. View Article : Google Scholar : PubMed/NCBI
|
|
2
|
Graham LS, Lin JK, Lage DE, Kessler ER,
Parikh RB and Morgans AK: Management of prostate cancer in older
adults. Am Soc Clin Oncol Educ Book. 43:e3903962023. View Article : Google Scholar : PubMed/NCBI
|
|
3
|
Sekhoacha M, Riet K, Motloung P, Gumenku
L, Adegoke A and Mashele S: Prostate cancer review: Genetics,
diagnosis, treatment options, and alternative approaches.
Molecules. 27:57302022. View Article : Google Scholar : PubMed/NCBI
|
|
4
|
Shen P, Sun J, Xu G, Zhang L, Yang Z, Xia
S, Wang Y, Liu Y and Shi G: KLF9, a transcription factor induced in
flutamide-caused cell apoptosis, inhibits AKT activation and
suppresses tumor growth of prostate cancer cells: KLF9 inhibits
tumor growth of prostate cancer cells. Prostate. 74:946–958. 2014.
View Article : Google Scholar : PubMed/NCBI
|
|
5
|
Yao K, Zhang R, Li L, Liu M, Feng S, Yan
H, Zhang Z and Xie D: The signature of cuproptosis-related immune
genes predicts the tumor microenvironment and prognosis of prostate
adenocarcinoma. Front Immunol. 14:11813702023. View Article : Google Scholar : PubMed/NCBI
|
|
6
|
Altwaijry N, Somani S and Dufès C:
Targeted nonviral gene therapy in prostate cancer. Int J
Nanomedicine. 13:5753–5767. 2018. View Article : Google Scholar : PubMed/NCBI
|
|
7
|
Ziaran S, Varchulova Novakova Z, Bohmer D
and Danisovic L: Biomarkers for determination prostate cancer:
Implication for diagnosis and prognosis. Neoplasma. 62:683–691.
2015. View Article : Google Scholar : PubMed/NCBI
|
|
8
|
Saxena S and Zou L: Hallmarks of DNA
replication stress. Mol Cell. 82:2298–2314. 2022. View Article : Google Scholar : PubMed/NCBI
|
|
9
|
Bowry A, Kelly RDW and Petermann E:
Hypertranscription and replication stress in cancer. Trends Cancer.
7:863–877. 2021. View Article : Google Scholar : PubMed/NCBI
|
|
10
|
Gaillard H, García-Muse T and Aguilera A:
Replication stress and cancer. Nat Rev Cancer. 15:276–89. 2015.
View Article : Google Scholar : PubMed/NCBI
|
|
11
|
Maiorano D, El Etri J, Franchet C and
Hoffmann JS: Translesion synthesis or repair by specialized DNA
polymerases limits excessive genomic instability upon replication
stress. Int J Mol Sci. 22:39242021. View Article : Google Scholar : PubMed/NCBI
|
|
12
|
Ubhi T and Brown GW: Exploiting DNA
replication stress for cancer treatment. Cancer Res. 79:1730–1739.
2019. View Article : Google Scholar : PubMed/NCBI
|
|
13
|
Bai G, Smolka MB and Schimenti JC: Chronic
DNA Replication stress reduces replicative lifespan of cells by
TRP53-Dependent, microRNA-Assisted MCM2-7 downregulation. PLoS
Genet. 12:e10057872016. View Article : Google Scholar : PubMed/NCBI
|
|
14
|
Macheret M and Halazonetis TD: DNA
replication stress as a hallmark of cancer. Annu Rev Pathol.
10:425–448. 2015. View Article : Google Scholar : PubMed/NCBI
|
|
15
|
Yang Y, Gao Y, Mutter-Rottmayer L,
Zlatanou A, Durando M, Ding W, Wyatt D, Ramsden D, Tanoue Y,
Tateishi S and Vaziri C: DNA repair factor RAD18 and DNA polymerase
Polκ confer tolerance of oncogenic DNA replication stress. J Cell
Biol. 216:3097–3115. 2017. View Article : Google Scholar : PubMed/NCBI
|
|
16
|
Huang RH, Hong YK, Du H, Ke WQ, Lin BB and
Li YL: A machine learning framework develops a DNA replication
stress model for predicting clinical outcomes and therapeutic
vulnerability in primary prostate cancer. J Transl Med. 21:202023.
View Article : Google Scholar : PubMed/NCBI
|
|
17
|
Lin C, Salzillo TC, Bader DA, Wilkenfeld
SR, Awad D, Pulliam TL, Dutta P, Pudakalakatti S, Titus M, McGuire
SE, et al: Prostate cancer energetics and biosynthesis. Adv Exp Med
Biol. 1210:185–237. 2019. View Article : Google Scholar : PubMed/NCBI
|
|
18
|
Eidelman E, Twum-Ampofo J, Ansari J and
Siddiqui MM: The metabolic phenotype of prostate cancer. Front
Oncol. 7:1312017. View Article : Google Scholar : PubMed/NCBI
|
|
19
|
Griffin JE: Androgen resistance-the
clinical and molecular spectrum. N Engl J Med. 326:611–618. 1992.
View Article : Google Scholar : PubMed/NCBI
|
|
20
|
Lima AR, Pinto J, Amaro F, Bastos ML,
Carvalho M and Guedes de Pinho P: Advances and perspectives in
prostate cancer biomarker discovery in the last 5 years through
tissue and urine metabolomics. Metabolites. 11:1812021. View Article : Google Scholar : PubMed/NCBI
|
|
21
|
Kwon H, Oh S, Jin X, An YJ and Park S:
Cancer metabolomics in basic science perspective. Arch Pharm Res.
38:372–380. 2015. View Article : Google Scholar : PubMed/NCBI
|
|
22
|
Green SM, Mostaghel EA and Nelson PS:
Androgen action and metabolism in prostate cancer. Mol Cell
Endocrinol. 360:3–13. 2012. View Article : Google Scholar : PubMed/NCBI
|
|
23
|
Cardoso HJ, Carvalho TMA, Fonseca LRS,
Figueira MI, Vaz CV and Socorro S: Revisiting prostate cancer
metabolism: From metabolites to disease and therapy. Med Res Rev.
41:1499–1538. 2021. View Article : Google Scholar : PubMed/NCBI
|
|
24
|
Hardie DG: AMP-activated protein kinase:
An energy sensor that regulates all aspects of cell function. Genes
Dev. 25:1895–1908. 2011. View Article : Google Scholar : PubMed/NCBI
|
|
25
|
Penfold L, Woods A, Pollard AE, Arizanova
J, Pascual-Navarro E, Muckett PJ, Dore MH, Montoya A, Whilding C,
Fets L, et al: AMPK activation protects against prostate cancer by
inducing a catabolic cellular state. Cell Rep. 42:1123962023.
View Article : Google Scholar : PubMed/NCBI
|
|
26
|
Shi S, Wen G, Lei C, Chang J, Yin X, Liu X
and Huang S: A DNA replication Stress-based prognostic model for
lung adenocarcinoma. Acta Naturae. 15:100–110. 2023. View Article : Google Scholar : PubMed/NCBI
|
|
27
|
R: The R Project for Statistical
Computing.
|
|
28
|
Xu Q, Ma L, Streuer A, Altrock E, Schmitt
N, Rapp F, Klär A, Nowak V, Obländer J, Weimer N, et al: Machine
learning-based in-silico analysis identifies signatures of lysyl
oxidases for prognostic and therapeutic response prediction in
cancer. Cell Commun Signal. 23:1692025. View Article : Google Scholar : PubMed/NCBI
|
|
29
|
Livak KJ and Schmittgen TD: Analysis of
relative gene expression data using real-time quantitative PCR and
the 2(−Delta Delta C(T)) method. Methods. 25:402–408. 2001.
View Article : Google Scholar : PubMed/NCBI
|
|
30
|
Siddiqui JA, Seshacharyulu P, Muniyan S,
Pothuraju R, Khan P, Vengoji R, Chaudhary S, Maurya SK, Lele SM,
Jain M, et al: GDF15 promotes prostate cancer bone metastasis and
colonization through osteoblastic CCL2 and RANKL activation. Bone
Res. 10:62022. View Article : Google Scholar : PubMed/NCBI
|
|
31
|
Mahon KL, Sutherland SI, Lin HM, Stockler
MR, Gurney H, Mallesara G, Briscoe K, Marx G, Higano CS, de Bono
JS, et al: Clinical validation of circulating GDF15/MIC-1 as a
marker of response to docetaxel and survival in men with metastatic
castration-resistant prostate cancer. Prostate. 84:747–755. 2024.
View Article : Google Scholar : PubMed/NCBI
|
|
32
|
Yamamichi G, Kato T, Arakawa N, Ino Y,
Ujike T, Nakano K, Koh Y, Motoyama Y, Outani H, Myoba S, et al:
GDF15 propeptide promotes bone metastasis of castration-resistant
prostate cancer by augmenting the bone microenvironment. Biomark
Res. 12:1472024. View Article : Google Scholar : PubMed/NCBI
|
|
33
|
Zhang W, Hu C, Wang X, Bai S, Cao S,
Kobelski M, Lambert JR, Gu J and Zhan Y: Role of GDF15 in
methylseleninic acid-mediated inhibition of cell proliferation and
induction of apoptosis in prostate cancer cells. PLoS One.
14:e02228122019. View Article : Google Scholar : PubMed/NCBI
|
|
34
|
Wang W, Yang X, Dai J, Lu Y, Zhang J and
Keller ET: Prostate cancer promotes a vicious cycle of bone
metastasis progression through inducing osteocytes to secrete GDF15
that stimulates prostate cancer growth and invasion. Oncogene.
38:4540–4559. 2019. View Article : Google Scholar : PubMed/NCBI
|
|
35
|
Teo MY, Rathkopf DE and Kantoff P:
Treatment of advanced prostate cancer. Annu Rev Med. 70:479–499.
2019. View Article : Google Scholar : PubMed/NCBI
|
|
36
|
Linxweiler J, Hajili T, Saar M, Maßmann C,
Junker K and Stöckle M: Influence of local treatment on the biology
of advanced prostate cancer : Treatment of the primary tumor may
delay hormone resistance of metastases. Urologe A. 61:518–525.
2022.(In German). View Article : Google Scholar : PubMed/NCBI
|
|
37
|
Dreyer SB, Upstill-Goddard R, Paulus-Hock
V, Paris C, Lampraki EM, Dray E, Serrels B, Caligiuri G, Rebus S,
Plenker D, et al: Targeting DNA damage response and replication
stress in pancreatic cancer. Gastroenterology. 160:362–377.e13.
2021. View Article : Google Scholar : PubMed/NCBI
|
|
38
|
Yu SB and Pekkurnaz G: Mechanisms
orchestrating mitochondrial dynamics for energy homeostasis. J Mol
Biol. 430:3922–3941. 2018. View Article : Google Scholar : PubMed/NCBI
|
|
39
|
Zadra G, Priolo C, Patnaik A and Loda M:
New strategies in prostate cancer: Targeting lipogenic pathways and
the energy sensor AMPK. Clin Cancer Res. 16:3322–3328. 2010.
View Article : Google Scholar : PubMed/NCBI
|
|
40
|
Li Y, He X, Zhang X, Xu Y, Chen W, Liu X
and Xu X: RMI2 is a prognostic biomarker and promotes tumor growth
in hepatocellular carcinoma. Clin Exp Med. 22:229–243. 2022.
View Article : Google Scholar : PubMed/NCBI
|
|
41
|
Chen S, Liu W and Huang Y: Identification
and external validation of a prognostic signature associated with
DNA repair genes in gastric cancer. Sci Rep. 11:71412021.
View Article : Google Scholar : PubMed/NCBI
|
|
42
|
Xu C, Wang Y, Wang L, Wang Q, Du LQ, Fan
S, Liu Q and Li L: Accumulation and phosphorylation of
RecQ-mediated genome instability protein 1 (RMI1) at Serine 284 and
Serine 292 during Mitosis. Int J Mol Sci. 16:26395–405. 2015.
View Article : Google Scholar : PubMed/NCBI
|
|
43
|
Chen H, You MJ, Jiang Y, Wang W and Li L:
RMI1 attenuates tumor development and is essential for early
embryonic survival: RMI1 and Tumor Development. Mol Carcinog.
50:80–88. 2011. View Article : Google Scholar : PubMed/NCBI
|
|
44
|
Suwa A, Kurama T and Shimokawa T:
Adipocyte hyperplasia and RMI1 in the treatment of obesity:
Adipocyte hyperplasia and RMI1. FEBS J. 278:565–569. 2011.
View Article : Google Scholar : PubMed/NCBI
|
|
45
|
Qian J, Xu Y, Xu X, Tao Z, Luo Y, Xu Y,
Zhang Y and Qian C: Hsa_circ_0091581 promotes glioma progression by
regulating RMI1 via sponging miR-1243-5p. J Cancer. 12:3249–3256.
2021. View Article : Google Scholar : PubMed/NCBI
|
|
46
|
Suwa A, Yoshino M, Yamazaki C, Naitou M,
Fujikawa R, Matsumoto S, Kurama T, Shimokawa T and Aramori I: RMI1
deficiency in mice protects from diet and Genetic-induced obesity.
FEBS J. 277:677–686. 2010. View Article : Google Scholar : PubMed/NCBI
|
|
47
|
Isaacsson Velho P and Antonarakis ES:
PD-1/PD-L1 pathway inhibitors in advanced prostate cancer. Expert
Rev Clin Pharmacol. 11:475–486. 2018. View Article : Google Scholar : PubMed/NCBI
|
|
48
|
Zhang Q, Helfand BT, Carneiro BA, Qin W,
Yang XJ, Lee C, Zhang W, Giles FJ, Cristofanilli M and Kuzel TM:
Efficacy against human prostate cancer by prostate-specific
membrane antigen-specific, transforming growth Factor-β insensitive
genetically targeted CD8+ T-cells derived from patients with
metastatic Castrate-resistant disease. Eur Urol. 73:648–652. 2018.
View Article : Google Scholar : PubMed/NCBI
|
|
49
|
Bian X, Wang W, Abudurexiti M, Zhang X, Ma
W, Shi G, Du L, Xu M, Wang X, Tan C, et al: Integration analysis of
single-cell multi-omics reveals prostate cancer heterogeneity. Adv
Sci (Weinh). 11:e23057242024. View Article : Google Scholar : PubMed/NCBI
|
|
50
|
Wang N, Wang S, Wang X, Zheng Y, Yang B,
Zhang J, Pan B, Gao J and Wang Z: Research trends in
pharmacological modulation of tumor-associated macrophages. Clin
Transl Med. 11:e2882021. View Article : Google Scholar : PubMed/NCBI
|
|
51
|
Gu Q, Qi A, Wang N, Zhou Z and Zhou X:
Macrophage dynamics in prostate cancer: Molecular to therapeutic
insights. Biomed Pharmacother. 177:1170022024. View Article : Google Scholar : PubMed/NCBI
|