Introduction
Lung adenocarcinoma (LUAD) is the main subtype of
non-small cell lung cancer (NSCLC), accounting for ~50% of all lung
malignancies and being a leading cause of cancer-related mortality
worldwide (1). Despite advancements
in treatment strategies, including surgical resection,
chemotherapy, targeted therapy and immunotherapy, the prognosis of
patients with LUAD remains unsatisfactory, with the 5-year survival
rate of advanced patients being <20% (2). Current clinical challenges stem from
tumor heterogeneity, limited biomarkers for early diagnosis and
variable responses to immunotherapy. In addition, the traditional
Tumor-Node-Metastasis (TNM) staging system cannot adequately
predict individual prognosis (3).
Therefore, there is a need for novel molecular markers to improve
prognostic stratification and guide personalized treatment.
Fatty acid metabolism (FAM) serves a crucial role in
tumor biology by facilitating membrane synthesis, energy
production, and key signaling pathways for tumor proliferation and
metastasis (4–7). Emerging evidence (8) has indicated that LUAD cells exhibit
metabolic reprogramming, characterized by enhanced fatty acid
uptake, synthesis and storage, to maintain their invasive
phenotype. In addition, studies have reported that FAM-related
genes (such as FABP5 and PDK1) and long non-coding RNAs (such as
CCAT1 and FAM83A-AS1) are key regulators of LUAD progression,
associated with poor prognosis and chemotherapy resistance
(9–12). Notably, the dysregulated FAM pathway
is related to the formation of an immunosuppressive tumor
microenvironment and affects the efficacy of immunotherapy
(13,14). However, the functional role of
specific FAM genes, particularly ACSBG1, in the pathogenesis and
clinical outcomes of LUAD remains insufficiently explored.
The present study aimed to systematically identify
FAM-related prognostic biomarkers in LUAD and to elucidate the
functional role of ACSBG1. By integrating transcriptomics data from
The Cancer Genome Atlas (TCGA) and Gene Expression Omnibus (GEO)
databases, differentially expressed FAM genes were screened, and
Least Absolute Shrinkage and Selection Operator (LASSO) regression,
combined with Shapley Additive Explanations (SHAP) interpretable
analysis, was applied to prioritize ACSBG1 as a key prognostic
determinant. Subsequently, clinical correlation analysis and in
vitro functional analysis were conducted to verify the
tumor-suppressive effect of ACSBG1.
Materials and methods
Data acquisition
LUAD RNA-sequencing data were extracted from TCGA
(n=298) (https://portal.gdc.cancer.gov/), including 274 tumor
tissues and 24 adjacent tissues. In addition, the GSE13213
(15) dataset (n=117) was obtained
from the GEO database (https://www.ncbi.nlm.nih.gov/geo/) as a validation
set. The inclusion criteria for data to be included in the present
study were: i) Pathological diagnosis of LUAD; ii) complete
prognostic information, whereas the exclusion criteria comprised:
i) Postoperative follow-up period of <1 month or death within 1
month after surgery; ii) concurrent presence of other malignant
tumors.
The R software (version 4.4.2; http://cran.r-project.org/) package ‘limma’ (version
3.6.9; http://bioinf.wehi.edu.au/limma) was used to conduct a
differential expression analysis on the tumor tissues and adjacent
tissues in TCGA dataset. The differentially expressed genes (DEGs)
that met the criteria of |Log2FC|>1 and P<0.05 were selected.
FAM-related genes were manually curated from the Kyoto Encyclopedia
of Genes and Genomes (KEGG) (https://www.kegg.jp/kegg/kegg1.html) and
GeneCards® (https://www.genecards.org/) gene sets (Table SI).
Gene Ontology (GO) and KEGG enrichment
analyses
The GO analysis process is a commonly used research
method in functional enrichment studies, involving large-scale
functional enrichment. Gene functions encompass three categories:
Molecular function (MF), biological process (BP) and cellular
component (CC). KEGG pathway exploration is also widely applied in
bioinformatics analysis, as it integrates extensive data on
genomes, BPs and diseases. Using R packages ‘limma’ (16) and ‘clusterProfiler’ (version 4.18.4;
https://bioconductor.org/packages/release/bioc/html/clusterProfiler.html),
enrichment analyses and visualization of FAM-related DEGs were
conducted.
Construction of prognostic models and
screening of key genes
By integrating LUAD survival information from TCGA,
univariate Cox regression analysis was performed on the screened
FAM-related DEGs. Using the R package ‘glmnet’ (17) (version 4.1–10; http://cran.r-project.org/web/packages/glmnet/index.html)
for LASSO regression analysis, seven FAM-related genes
significantly associated with tumor overall survival (OS) were
identified. Subsequently, SHAP interpretable analysis (18) was applied to interpret the
performance of the prognostic model and its outputs, highlighting
the features with the greatest contribution to the prognostic
model. This analysis was carried out using the ‘kernelshap’
(version 0.9.1; http://github.com/ModelOriented/kernelshap) R
package.
Diagnostic value of the biomarkers in
LUAD
To evaluate the predictive value of the established
biomarkers, univariate and multivariate Cox regression analyses
were performed to identify risk factors. The prognostic value of
the signature genes was assessed using Kaplan-Meier and receiver
operating characteristic (ROC) curve analyses. The GEO dataset
GSE13213 was utilized to validate the prognostic signature. Based
on clinicopathological parameters, a χ2 test was
conducted to examine the association between the risk score and
clinical characteristics, and a nomogram was constructed. The R
package ‘rms’ (version 6.8–1; http://CRAN.R-project.org/package=rms) (19) was employed to generate the nomogram,
and calibration plots were introduced to compare the concordance
between predicted and actual probabilities of 1-, 3- and 5-year
survival rates.
Immune infiltration analysis of ACSBG1
in LUAD
The present study utilized the TIMER2.0 database
(https://compbio.cn/timer2/) to analyze
the correlation between the ACSBG1 gene and immune cells. By
adjusting tumor purity to eliminate confounding effects, immune
infiltration analysis of ACSBG1 with CD4+ T cells,
CD8+ T cells, B cells, macrophages, natural killer (NK)
cells and cancer-associated fibroblasts was analyzed using the
Pearson method.
Cell culture and infection
The human LUAD cell line A549 [cat. no. SCSP-503;
China Center for Type Culture Collection (CCTCC)] was cultured with
F-12K medium (Gibco; Thermo Fisher Scientific, Inc.), supplemented
with 10% fetal bovine serum (FBS; HyClone; Cytiva) and 1%
penicillin/streptomycin (Gibco; Thermo Fisher Scientific, Inc.).
The LUAD cell line H1299 (cat. no. SCSP-589; CCTCC) was cultured in
RPMI-1640 medium (Gibco; Thermo Fisher Scientific, Inc.)
supplemented with 10% FBS and 1% penicillin/streptomycin. Both cell
lines were maintained under standard culture conditions (37°C, 5%
CO2). For ACSBG1 overexpression (OE) and knockdown (KD),
the pLenti-CMV-Puro vector (VectorBuilder Inc.) was used. The
third-generation lentiviral packaging system was employed,
consisting of the packaging plasmid psPAX2 and the envelope plasmid
pMD2.G (Addgene, Inc.). Lentiviral particles were produced by
co-transfecting 293T cells (CRL-3216™; American Type Culture
Collection) using Lipofectamine® 3000 (Invitrogen;
Thermo Fisher Scientific, Inc.). In each 10-cm dish, a total of 20
µg plasmid DNA was transfected in a ratio of 2:1.5:1 (lentiviral
vector:psPAX2:pMD2.G). Transfection was performed at 37°C in a 5%
CO2 incubator for 48 h. Lentiviral supernatants were
collected at 48 and 72 h post-transfection, filtered through a
0.45-µm membrane, and concentrated by ultracentrifugation (100,000
× g, 4°C, 2 h). Prior to formal experiments, the optimal
multiplicity of infection (MOI) and puromycin concentration were
determined for each cell line via kill curve assays. Based on the
results, A549 cells were infected at an MOI of 8, whereas H1299
cells were infected at a higher MOI of 15, both in the presence of
8 µg/ml polybrene. After 24 h of transduction, the medium was
replaced with fresh complete medium. To establish stable polyclonal
populations, the cells were subjected to puromycin selection: A549
cells were treated with 1.5 µg/ml puromycin (MilliporeSigma) for 6
days, and H1299 cells were treated with 2.5 µg/ml puromycin for 8
days. Subsequently, the cells were maintained in medium containing
a reduced concentration of puromycin (0.5 µg/ml for A549 and 1.0
µg/ml for H1299) for ongoing culture. All functional assays were
performed ≥14 days after the completion of antibiotic selection to
ensure stable gene expression and to avoid transient effects.
Ultimately, two distinct experimental groups were
established for comparative analysis: An OE group and a KD group.
For the OE group, cells were transduced with either the empty
pLenti-CMV-Puro vector (OE-Control) or the same vector containing
the full-length human ACSBG1 coding sequence (OE-ACSBG1). For the
KD group, cells were transduced with lentivirus expressing either a
non-targeting control shRNA (Sh-Ctrl) or a specific shRNA targeting
ACSBG1 (Sh-ACSBG1). The shRNA target sequence for ACSBG1 was
5′-GCGCCTCAAAGAATTAATCAT-3′, and the non-targeting control sequence
was 5′-TTCTCCGAACGTGTCACGT-3′.
Reverse transcription-quantitative PCR
(RT-qPCR) analysis
Total RNA was isolated from LUAD cells with Trizol
reagent (cat. no. R0016; Beyotime Biotechnology) following the
manufacturer's protocol. First-strand cDNA synthesis was performed
using the PrimeScript™ Reverse Transcriptase Kit (cat. no. 6210A;
Takara Bio, Inc.), according to the thermal cycling conditions
recommended for RT. qPCR was performed with the Accurate Genomics
Fast SYBR Green qPCR Master Mix (2X) (cat. no. AG11701; Hunan
Accurate Bio-Medical Technology Co., Ltd.) on a QuantStudio 5
Real-Time PCR System (Thermo Fisher Scientific, Inc.), The reaction
protocol consisted of an initial denaturation at 95°C for 30 sec,
followed by 40 cycles at 95°C for 5 sec and 60°C for 30 sec. A
melt-curve analysis was added at the end of the cycling program
(95°C for 15 sec, 60°C for 1 min and 95°C for 15 sec) to confirm
amplification specificity. Relative gene expression was calculated
using 2−ΔΔCq method (20). The primer sequences were as follows:
ACSBG1 gene (human), forward (5′-3′) GCACAGTATTTGCAGGTGGC, reverse
(5′-3′) CCATGATGACATTGGCGCAG; and GAPDH (housekeeping gene; human),
forward (5′-3′) GATTCCACCCATGGCAAATTC, and reverse (5′-3′)
CTGGAAGATGGTGATGGGATT. Five independent biological replicates were
assessed.
Western blot analysis
Total cellular proteins were extracted from cultured
LUAD cells using RIPA lysis buffer (cat. no. P0013B; Beyotime
Biotechnology) supplemented with 1X protease inhibitor cocktail
(cat. no. P1005; Beyotime Biotechnology). The protein concentration
was determined using a BCA Protein Assay Kit (cat. no. P0010S;
Beyotime Biotechnology) according to the manufacturer's
instructions. Protein lysates were mixed with 5X SDS loading buffer
(cat. no. P0015; Beyotime Biotechnology) and denatured at 95°C for
10 min. Equal amounts of protein (20 µg/lane) were separated by
SDS-PAGE on 4–20% gradient gels and subsequently transferred onto
0.22-µm PVDF membranes (MilliporeSigma). The membranes were blocked
with 5% skim milk in TBS-0.1% Tween for 1 h at room temperature,
followed by incubation overnight at 4°C with the following primary
antibodies: Rabbit polyclonal anti-ACSBG1 (1:1,000; cat. no.
16077-1-AP; Proteintech Group, Inc.) and rabbit monoclonal
anti-vinculin (1:1,000; cat. no. ab129002; Abcam). After washing,
the membranes were incubated for 1 h at room temperature with a
DyLight® 800-conjugated goat anti-rabbit secondary
antibody (1:15,000; cat. no. A23620; Abbkine Scientific Co., Ltd.).
The blots were then washed and visualized using an Odyssey DLx
Imaging System (LI-COR Biosciences). Protein band intensities were
semi-quantified using the integrated Image Studio™ Lite software
(version 5.2; LI-COR Biosciences).
Cell proliferation assays
Cell counting kit (CCK)-8
A549 and H1299 cells were seeded in a 96-well plate
(6,000 cells/well), with five replicate wells per cell line. The
plate was incubated under standard culture conditions (37°C and 5%
CO2) for 5 consecutive days. CCK8 assays were performed
on days 1–5. Subsequently, 10 µl CCK-8 reagent (cat. no. C0037;
Beyotime Biotechnology) was added to each well and the cells were
further incubated for 1 h under standard conditions. Finally, the
optical density was measured at 450 nm using a microplate reader
for analysis.
EdU assay
Cell proliferation was assessed using the BeyoClick™
EdU Cell Proliferation Kit (cat. no. C0078S; Beyotime
Biotechnology). The two LUAD cell lines were seeded in 6-well
plates with a seeding density of 50% and incubated with
EdU-containing medium (10 µM) for 2 h to allow EdU incorporation
into replicating DNA. Cells were then fixed with 4%
paraformaldehyde for 30 min and permeabilized with 0.5% Triton
X-100 for 10 min at room temperature. After washing with PBS, the
cells were incubated with Click reaction buffer containing Alexa
Fluor 594 azide for 30 min in the dark, followed by nuclear
counterstaining with Hoechst 33342 at room temperature for 20 min.
EdU-positive cells exhibiting red fluorescence were quantified
under fluorescence microscopy to determine the proliferation rate.
This method utilizes click chemistry technology, offering high
sensitivity and experimental efficiency for cell proliferation
analysis.
Colony formation assay
For the colony formation assay, cells were
quantified using a hemocytometer and plated at a density of 1,000
cells/well in 6-well plates containing complete growth medium
supplemented with 10% FBS. Following a 14-day incubation period
under standard culture conditions (37°C, 5% CO2), cell
colonies were fixed with 4% paraformaldehyde for 30 min at room
temperature and subsequently stained with 0.1% crystal violet
solution (cat. no. G1062; Beijing Solarbio Science & Technology
Co., Ltd.) for 20 min at room temperature. Colony quantification
was performed by capturing high-resolution images using an M7000
inverted phase-contrast light microscope (×40 magnification) and
manually counting colonies in three randomly selected fields per
well, with colonies defined as cell clusters containing ≥50 cells.
The colony formation efficiency (%) was calculated as: (number of
colonies/number of cells seeded) ×100.
Transwell migration and invasion
assays
Migration assay
The cell migration assay was performed in 24-well
plates using Transwell chambers (pore size, 8 µm; cat. no. 3395;
Corning, Inc.). For each treatment group, three chambers were used
according to the manufacturer's protocol. Briefly, 5×10³
LUAD cells/well in serum-free medium were seeded into the upper
chamber, whereas complete medium supplemented with 20% FBS was
added to the lower chamber as a chemoattractant. After 24 h
incubation at 37°C with 5% CO2, non-migrated cells on
the upper membrane surface were removed with a cotton swab.
Migrated cells on the lower surface were fixed with 4%
paraformaldehyde for 15 min at room temperature and stained with
0.1% crystal violet for 15 min at room temperature. Quantitative
analysis was performed by counting migrated cells in three randomly
selected fields under an M7000 optical microscope (×200
magnification), with results expressed as the mean number of
migrated cells per field.
Invasion assay
Matrigel (cat. no. 354230; Corning, Inc.) was mixed
with basal medium at a 1:7 ratio and used to uniformly coat the
upper chamber surface at 37°° for 30 min. LUAD cells (10,000
cells/well) were seeded into the same upper chamber, where
hydrolytic enzymes secreted by the cells facilitated detachment
from the Matrigel, enabling migration through the membrane pores.
Following a 48-h incubation under standard culture conditions
(37°C, 5% CO2), the chambers were retrieved, and
residual non-invasive cells on the upper surface were removed by
washing with PBS and mechanical swab abrasion. Invasive cells on
the lower membrane were then fixed with 4% paraformaldehyde for 30
min at room temperature and stained with 0.01% crystal violet for
20 min in the dark at room temperature. Images of three randomly
selected fields per chamber were captured and analyzed using an
M7000 inverted light microscope (×20 objective) to quantify cell
invasion activity.
Wound healing assay
A549 and H1299 cells were cultured in 6-well plates
until they reached ~95% confluence. A sterile 100-µl pipette tip
was then vertically aligned to the plate surface to generate
uniform linear scratches through the cell monolayers. To eliminate
confounding effects of cellular proliferation on wound closure,
cells were incubated at 37°C (5% CO2) in serum-free
medium supplemented with 1 µg/ml mitomycin C (cat. no. M5353;
MilliporeSigma). Migration dynamics were monitored at 0, 12, 24 and
36 h post-scratching using phase-contrast light microscopy (×10
magnification). Quantitative analysis of wound width was performed
via ImageJ software (version 1.5.4; National Institutes of Health),
with closure rates calculated based on the temporal reduction of
the denuded area. Wound closure rate
(%)=[(A0-At)/A0]x100;
A0 represents the cell-free scratch area immediately
after scratching (0 h); At represents the remaining
cell-free scratch area measured at a specific time point.
Flow cytometric analysis of
apoptosis
Flow cytometric analysis of apoptosis was performed
using a commercial Annexin V-FITC/PI apoptosis detection kit (cat.
no. C1062S; Beyotime Biotechnology). For each experimental group,
the assay was performed in triplicate. Approximately
1×10⁶ cells were resuspended in binding buffer and
underwent dual staining with FITC-conjugated Annexin V and PI for
15 min under light-protected conditions at 25°C. Flow cytometric
quantification was conducted using an Agilent NovoCyte Advanteon Dx
VBR system (IVD-CE certified; Agilent Technologies, Inc.) coupled
with NovoExpress software (v1.6.2; Agilent Technologies, Inc.),
with fluorescence compensation adjusted according to unstained and
single-stained controls. Quantitative analysis of apoptotic
subpopulations (viable: Annexin V−/PI−; early
apoptotic: Annexin V+/PI−; late
apoptotic/necrotic: Annexin V+/PI+) was
achieved using threshold parameters optimized for Annexin V/PI
signal discrimination.
Statistical analysis
Continuous variables were compared using the
Wilcoxon rank-sum test (for non-normally distributed data) or
unpaired Student's t-test (for normally distributed data). Survival
curve divergences in Kaplan-Meier analyses were evaluated using a
two-sided log-rank test. All statistical analyses and graphical
visualizations were performed using R software version 4.4.1 and
GraphPad Prism 10.1 (Dotmatics). All experiments were independently
repeated at least three times, unless otherwise stated. P<0.05
was considered to indicate a statistically significant
difference.
Results
Screening and functional enrichment
analysis of FAM-related DEGs
RNA expression data from 298 cases in the LUAD group
were collected from TCGA database. After intersecting with
FAM-related genes, 35 DEGs were screened out (Fig. 1A), including 19 upregulated genes
and 16 downregulated genes (Fig.
1B). GO functional and KEGG pathway enrichment analyses were
performed on the aforementioned DEGs.
The results of GO functional enrichment analysis
showed that in the BP category, the DEGs were mainly involved in
‘fatty acid metabolic process’, ‘organic acid biosynthetic
process’, ‘carboxylic acid biosynthetic process’, ‘sulfur compound
metabolic process’ and ‘fatty acid biosynthetic process’. In the CC
category, the DEGs were mainly related to the ‘mitochondrial
matrix’, ‘peroxisome’ and ‘microbody’. In the MF category, the DEGs
were mainly associated with ‘lyase activity’, ‘carbon-oxygen lyase
activity’ and ‘oxidoreductase activity, acting on the CH-CH group
of donors’ (Fig. 1C). The KEGG
signaling pathways were mainly concentrated in the ‘PPAR signaling
pathway’, ‘fatty acid degradation’, ‘fatty acid metabolism’,
‘glycolysis/gluconeogenesis’ and ‘adipocytokine signaling pathway’
(Fig. 1D).
Construction and evaluation of a
prognostic risk model
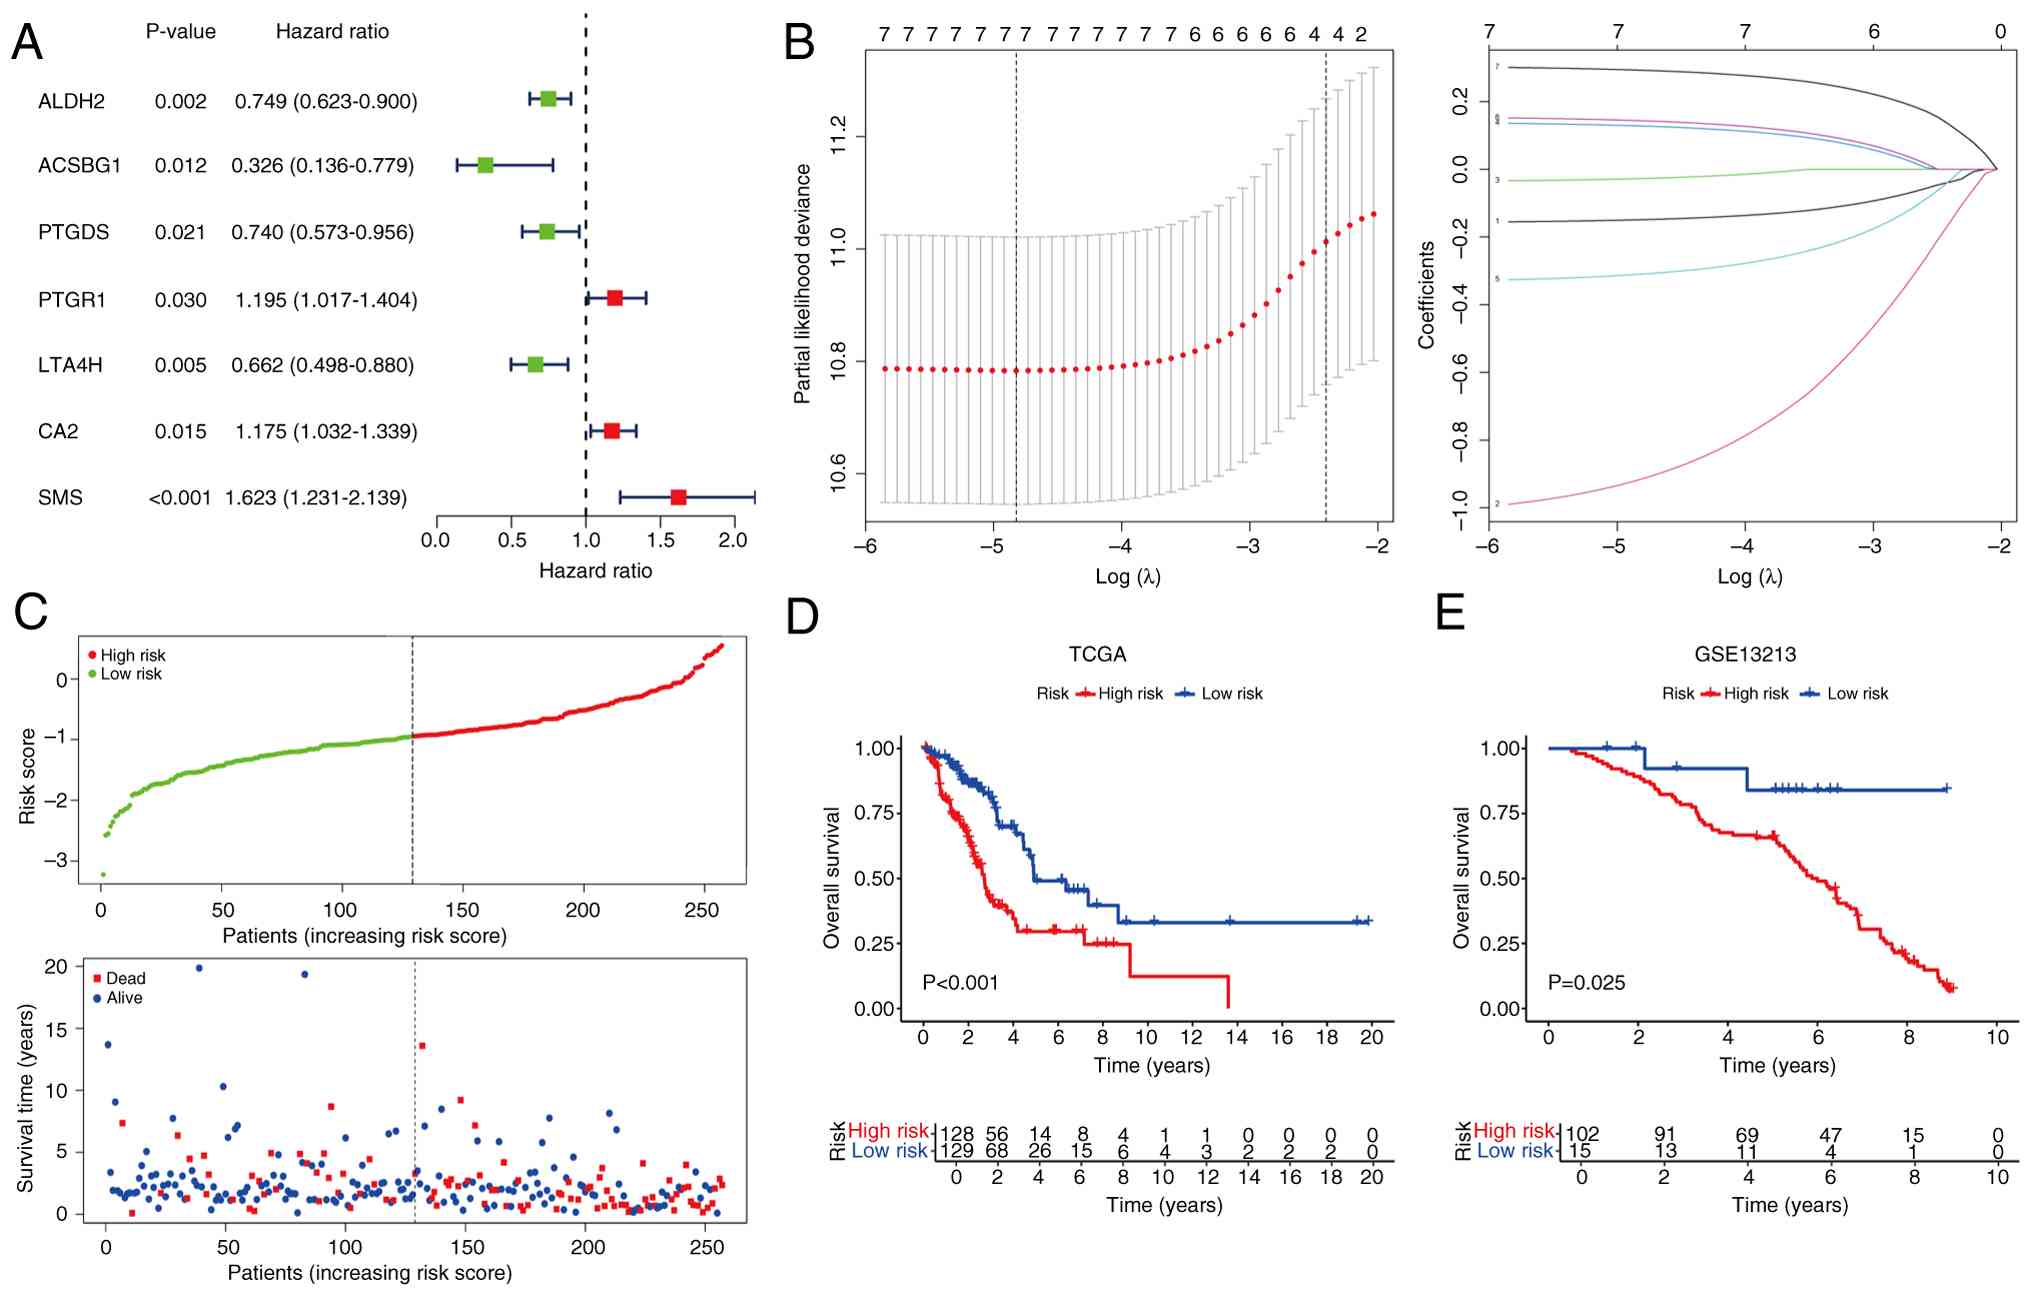
Univariate Cox analysis showed that seven
FAM-related genes were significantly associated with the prognosis
of patients with LUAD (Fig. 2A).
After further LASSO regression analysis, a prognostic risk model
for LUAD was constructed (Fig. 2B).
After integrating the seven genes and weighting their multivariate
Cox regression coefficients, the risk score formula was obtained:
Risk score=(−0.149 × ALDH2 exp) + (−0.916 × ACSBG1 exp) + (−0.028 ×
PTGDS exp) + (0.128 × PTGR1 exp) + (−0.310 × LTA4H exp) + (0.143 ×
CA2 exp) + (0.293 × SMS exp). Using the median risk value as the
cut-off, patients were divided into high-risk and low-risk groups
(Fig. 2C). The Kaplan-Meier
survival curves in both the training set (TCGA) and test set
(GSE13213) showed that the survival rate of patients in the
high-risk group was significantly lower than that in the low-risk
group (P<0.05; Fig. 2D and E).
The time-dependent ROC curve was used to evaluate the predictive
performance of the prognostic model for the 1-, 3- and 5-year
prognosis of patients. The area under the curve (AUC) values for 1,
3 and 5 years were 0.767, 0.769 and 0.700, respectively (Fig. 3C). The aforementioned evaluation
results indicate that the risk score model has good sensitivity and
specificity in predicting the prognosis of LUAD.
 | Figure 3.Verification of the accuracy of the
prognostic scoring model. (A) Univariate and (B) multivariate
independent prognostic analyses. (C) ROC curves for 1-, 3- and
5-year OS. (D) ROC curves for clinical characteristics and risk
scores. (E) Heat map of clinically relevant features. *P<0.05,
**P<0.01, ***P<0.001. (F) Nomogram integrates multiple
clinicopathological characteristics, including sex, age, T stage
and risk grade, to provide individualized predictions of patient
survival probability at different time points. (G) Calibration plot
predicting the agreement between observed and predicted rates of OS
at 1, 3 and 5 years. AUC, area under the curve; OS, overall
survival; ROC, receiver operating characteristic. |
Analysis of the association between
the independent prognostic risk model and clinical
characteristics
The risk scores of the seven model genes were
combined with the clinical data (age, sex, stage and grade) of LUAD
samples from TCGA. Univariate Cox analysis showed that stage and
risk score were risk factors for the prognosis of patients with
LUAD (P<0.05; Fig. 3A).
Multivariate Cox analysis also revealed that stage and risk score
were reliable independent prognostic factors for LUAD (P<0.05;
Fig. 3B). The ROC curve indicated
that stage (AUC=0.774) and risk score (AUC=0.767) had good
predictive values for the prognosis of LUAD (Fig. 3D). Furthermore, the χ2
test demonstrated that there were differences in the distribution
of tumor stage, T stage, N stage and survival status between the
high- and low-risk groups (Fig.
3E). Subsequently, a nomogram was constructed that incorporated
age, sex, pathological grade, as well as T and N stages (Fig. 3F). The calibration curves for 1-, 3-
and 5-year survival indicated that the nomogram could accurately
predict the OS of patients with LUAD (Fig. 3G).
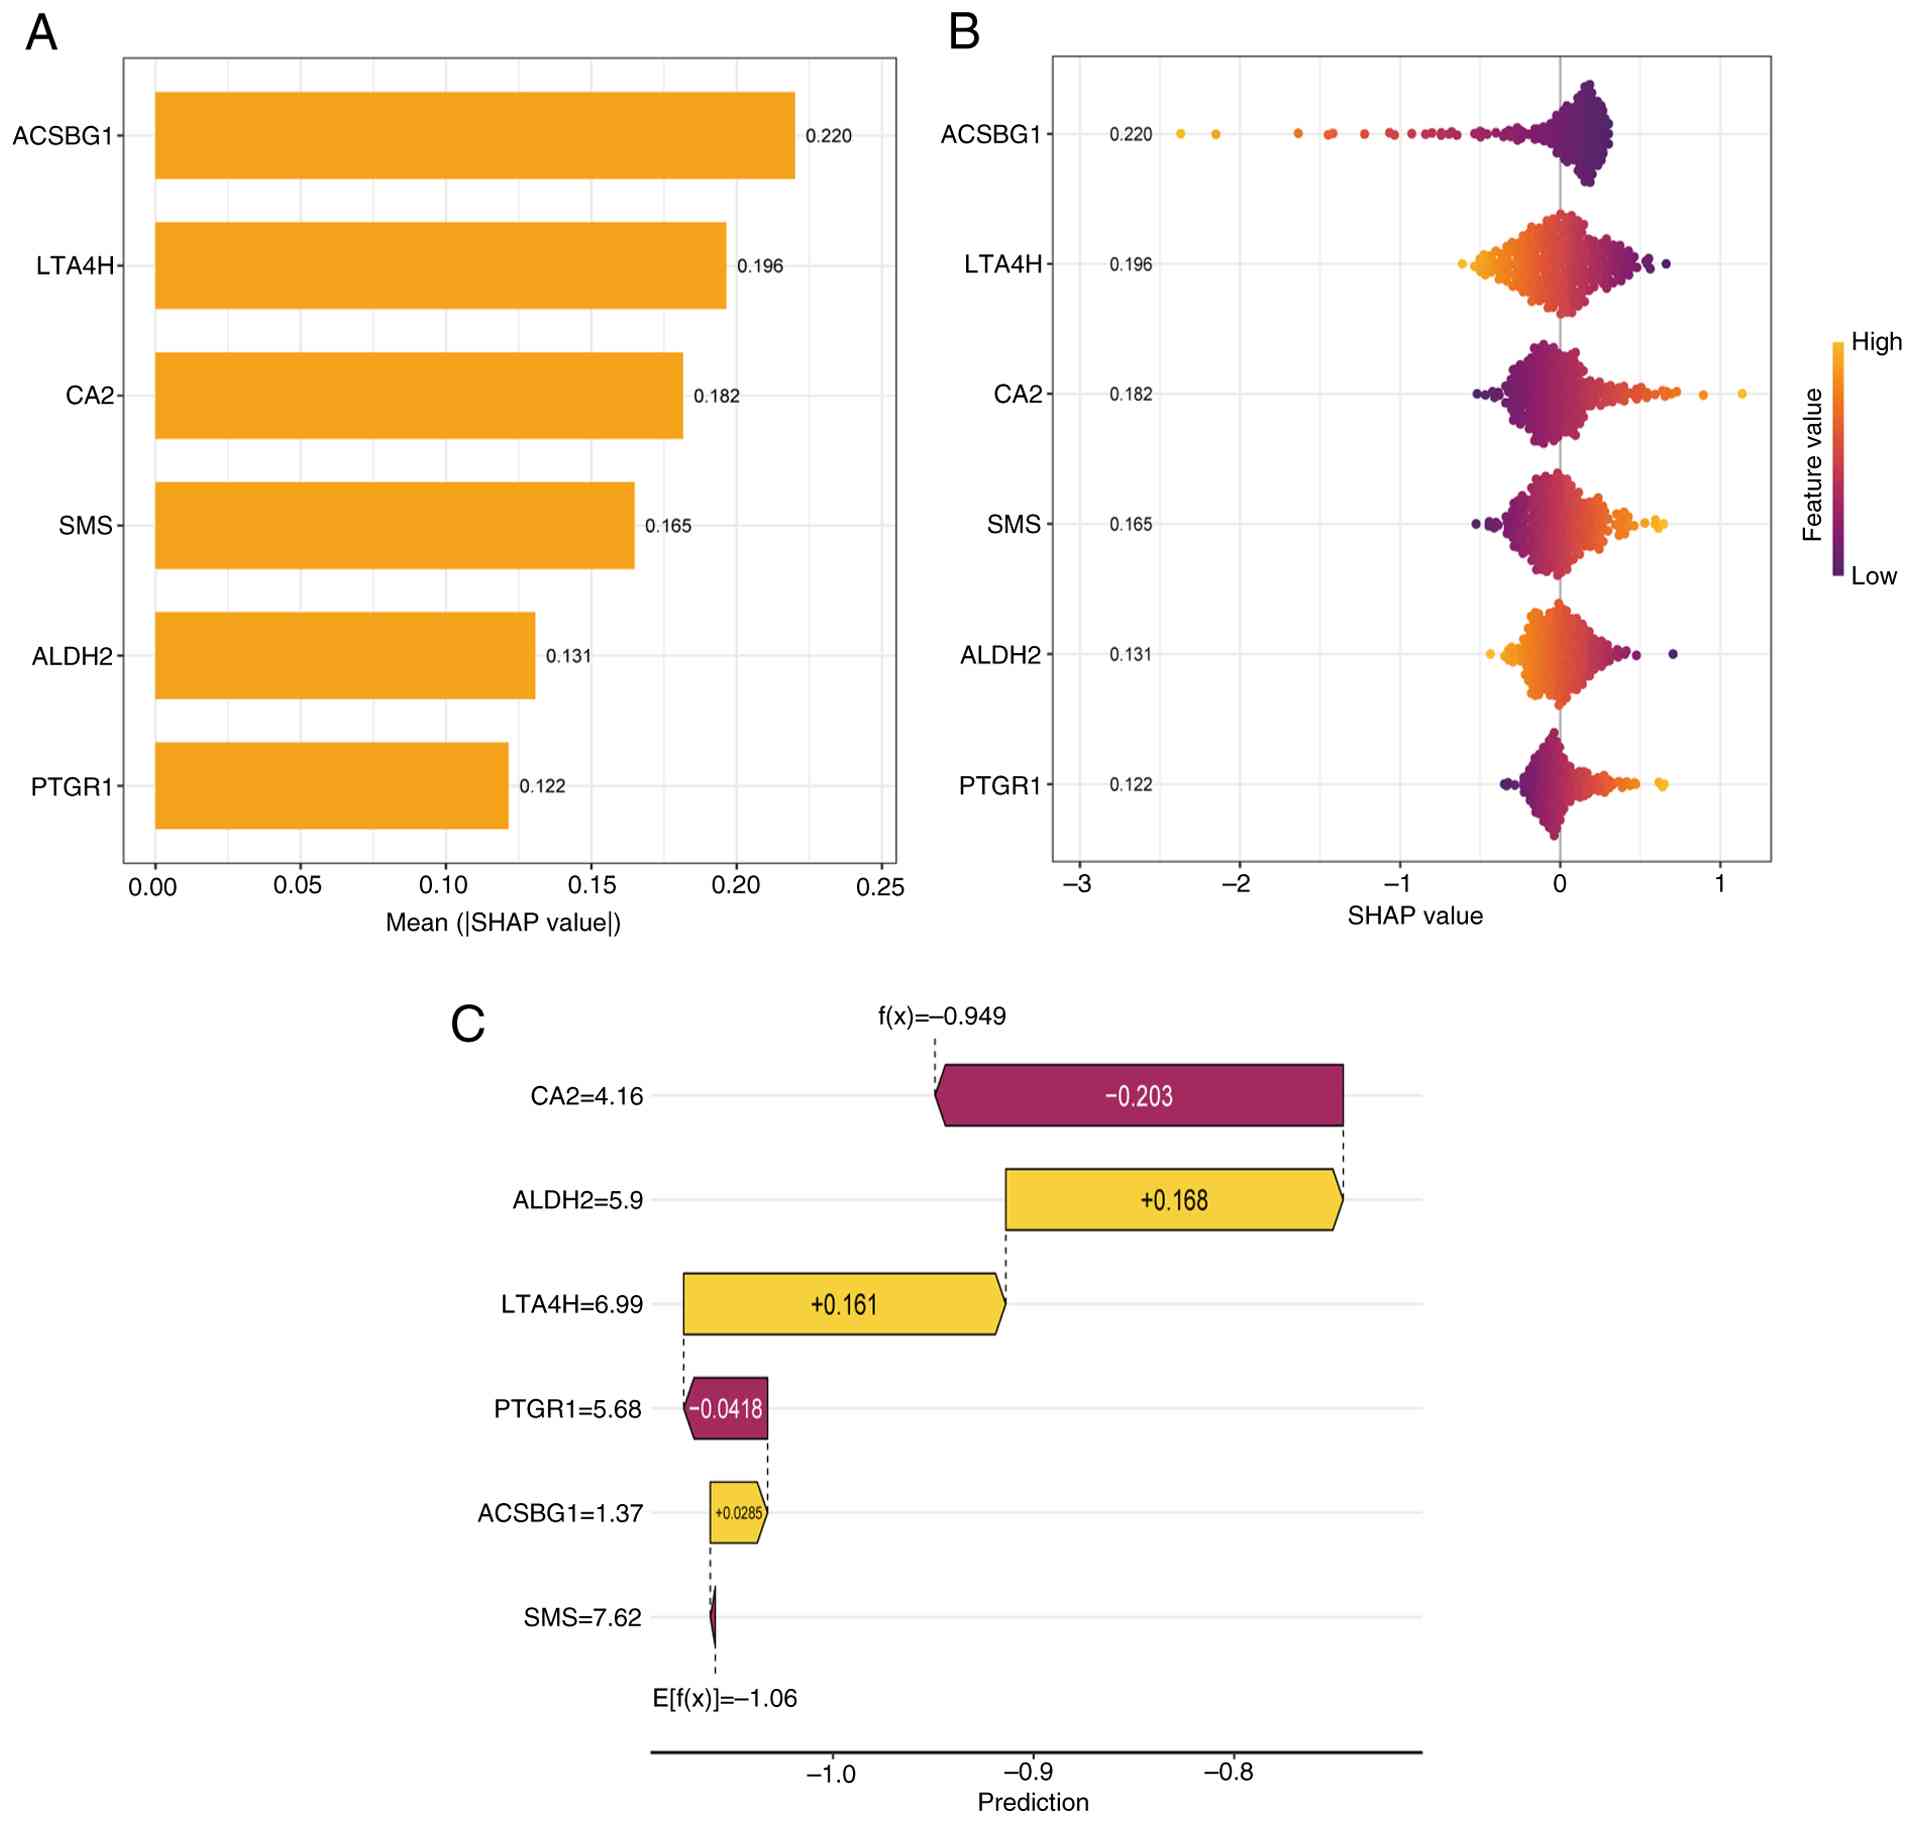
Interpretation of the prognostic model
and screening of the prominent contributing features using SHAP
analysis
The SHAP algorithm is used to determine the
importance of each variable on the prediction results of a
prognostic model. The importance of each variable in descending
order is shown in Fig. 4A. ACSBG1
had the strongest predictive value across all prediction levels,
followed by LTA4H, CA2, SMS, ALDH2 and PTGR1.
In addition, in order to detect the positive and
negative associations between the predicted values and the target
results, SHAP analysis was employed to reveal the proportion of
risk factors in the prognostic model. As shown in Fig. 4B, the horizontal position indicates
whether the influence of the value is associated with higher or
lower predictions, and the color represents the gene expression
level, with purple indicating low expression and orange
representing high expression. As the SHAP value of ACSBG1
increased, the gene expression decreased, suggesting that this gene
is a protective factor.
In Fig. 4C, the
ordinate represents the gene expression level, and the abscissa
represents the prediction value of the feature. Ef(x) denotes the
baseline prediction value. It can be observed that CA2, PTGR1 and
SMS are classified into the low-risk group, whereas the predicted
values of ACSBG1, LTA4H and ALDH2 were higher than the baseline
levels; therefore, these genes were classified as the high-risk
group.
Immune-related analysis
The results of immune-related analysis revealed that
the expression of ACSBG1 was correlated with the infiltration of
CD4+ T cells, CD8+ T cells, B cells, M2
macrophages, cancer-associated fibroblasts and NK cells (Fig. 5). However, it is worth noting that
the correlation between these immune cells and ACSBG1 was
relatively weak.
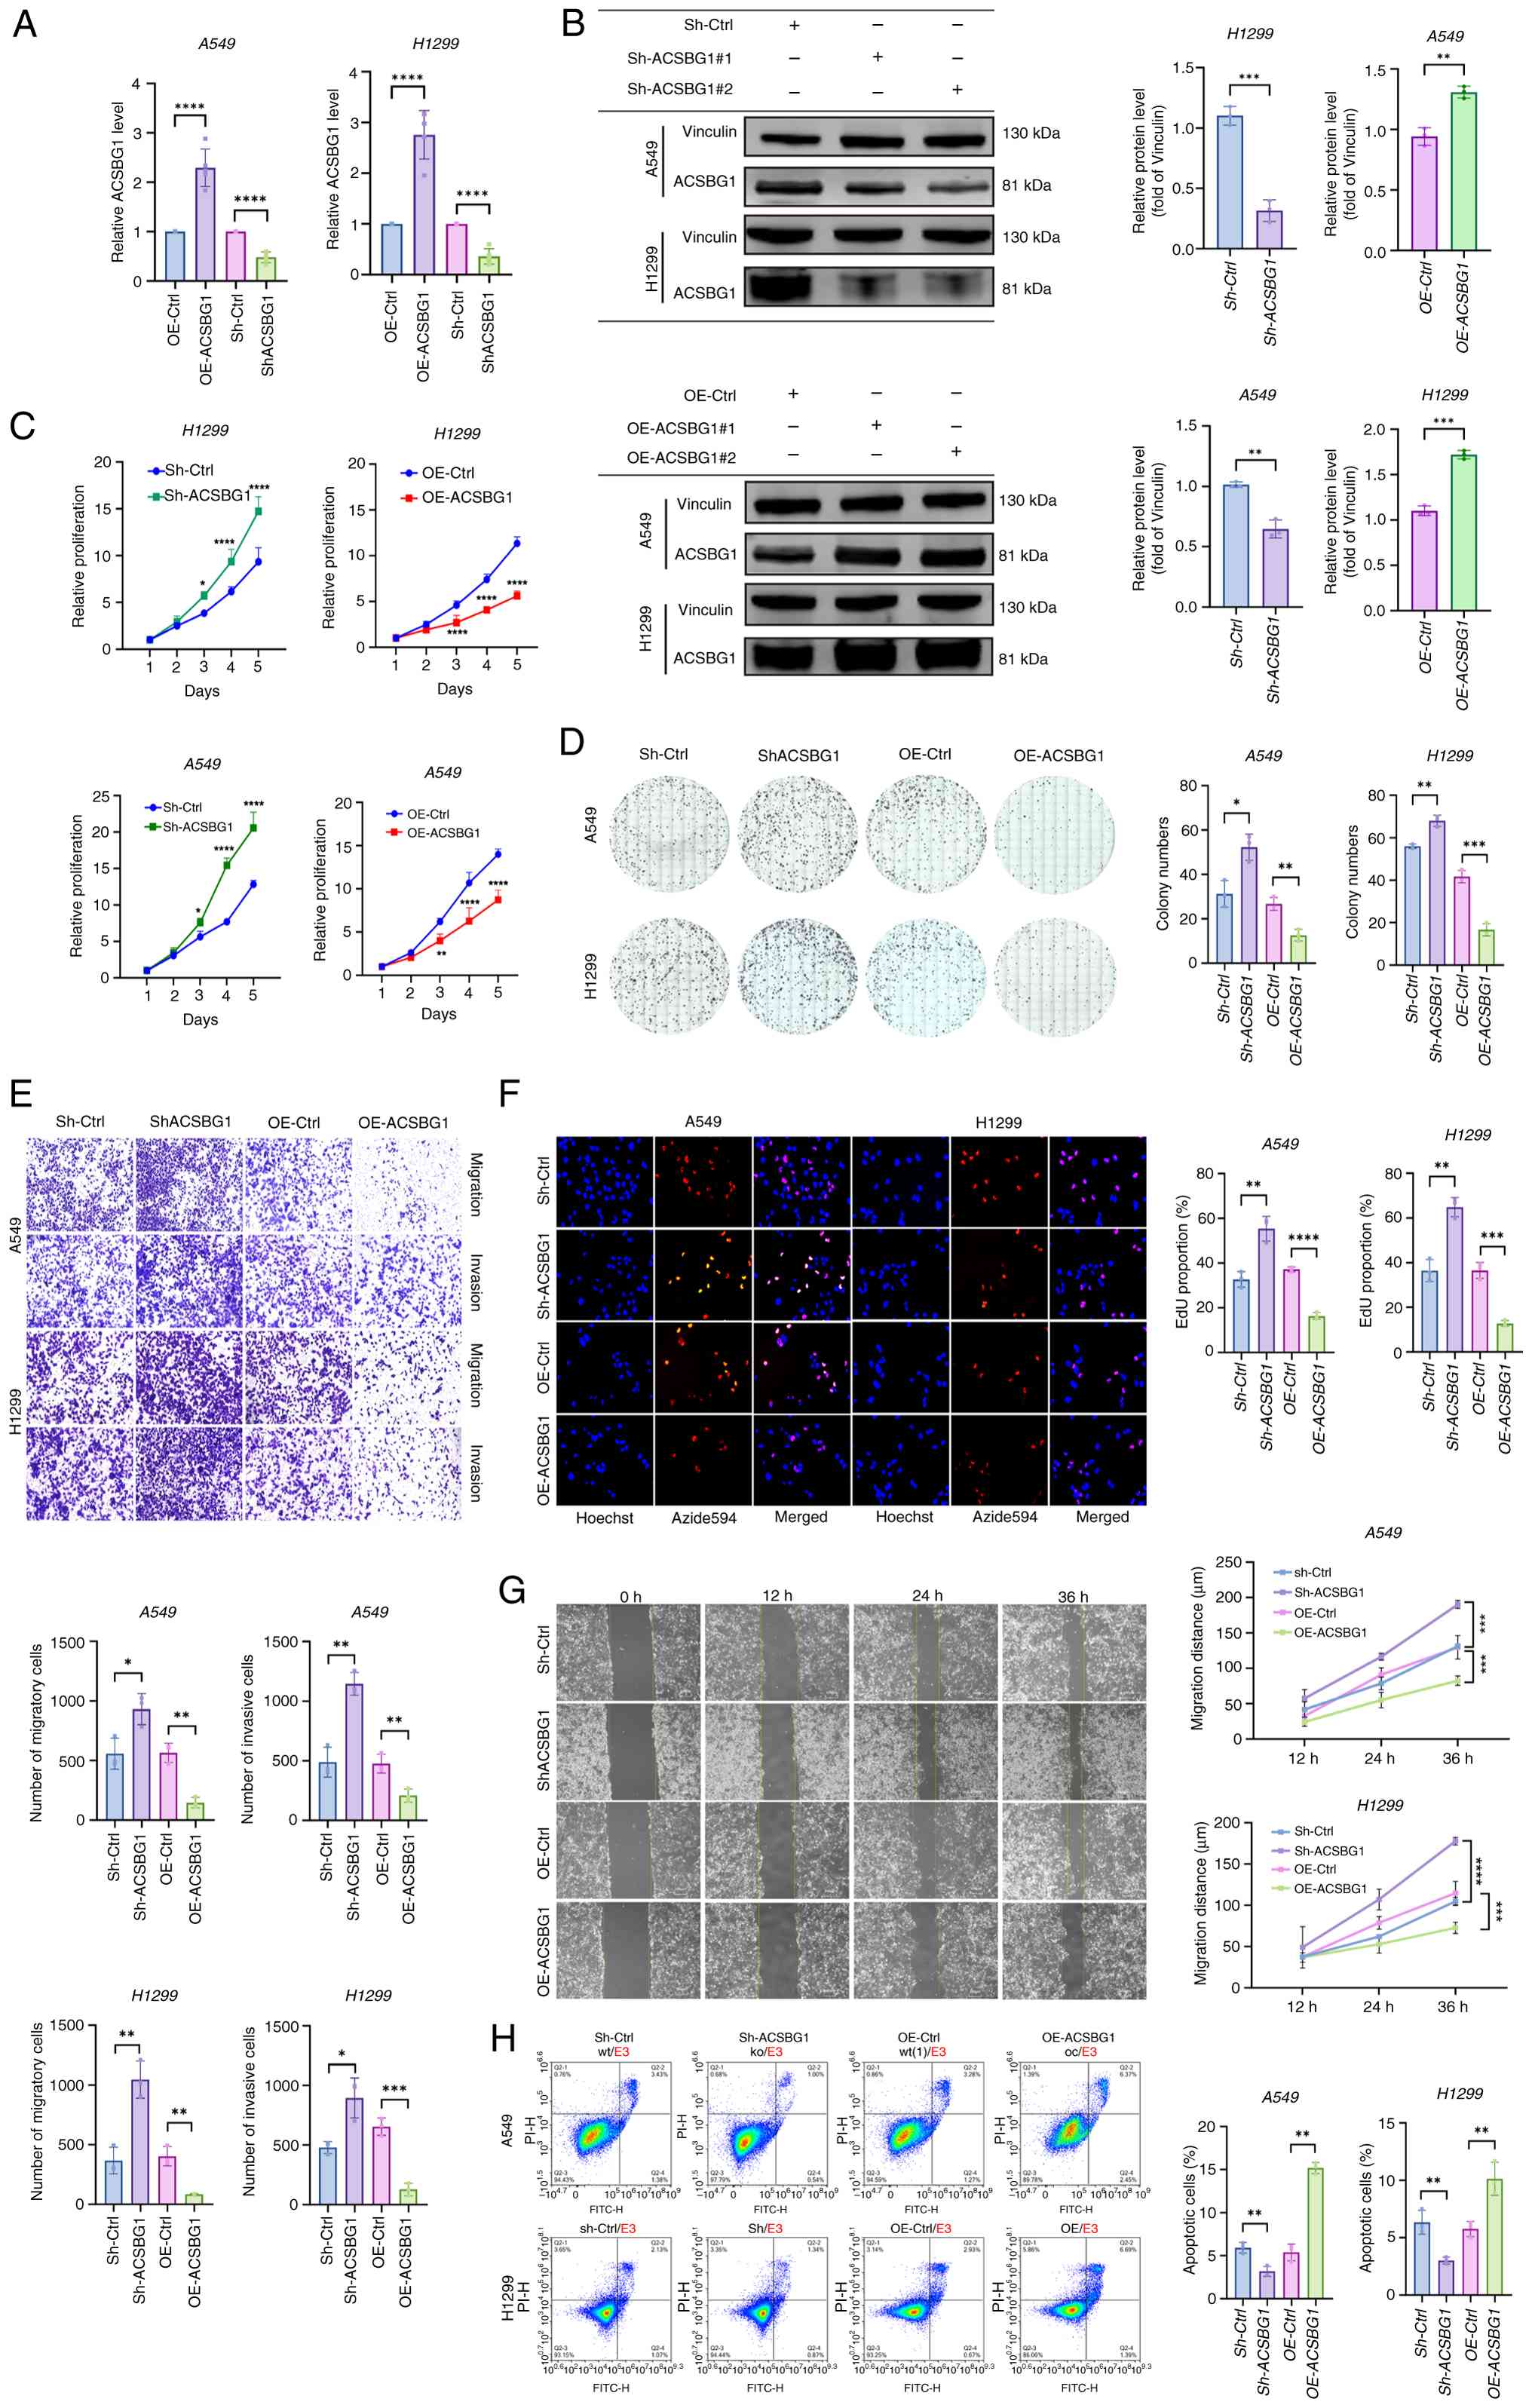
Cell infection and validation
After lentiviral transduction, stable cell lines
were established via puromycin selection for 4 weeks, including the
OE-Ctrl, OE-ACSBG1, Sh-Ctrl and Sh-ACSBG1 groups. RT-qPCR and
western blot analysis were performed to determine the mRNA and
protein expression levels of ACSBG1 in A549 and H1299 LUAD cell
lines. The experimental results clearly demonstrated that, compared
with in their respective control groups (OE-Ctrl or Sh-Ctrl), both
the mRNA and protein levels of ACSBG1 were significantly
upregulated in the OE-ACSBG1 group and downregulated in the
Sh-ACSBG1 group (Fig. 6A and B).
According to the experimental results, shACSBG1# and OE-ACSBG1#
were selected for use in further experiments.
ACSBG1 inhibits the proliferation of
LUAD cells in vitro
As determined by CCK-8 assay, the OE of ACSBG1
suppressed the proliferation of A549 and H1299 LUAD cells, whereas
its KD promoted cell proliferation (Fig. 6C). The experimental results showed
that statistically significant differences between the
OE-ACSBG1/OE-Ctrl groups and the Sh-ACSBG1/Sh-Ctrl groups regarding
cell proliferation rates were only observed after 72 h of
culture.
By co-labeling live cells with blue Hoechst dye and
proliferating cells with red Alexa Fluor 594 azide, the
proliferative status of cells within the field of view can be
visualized. Fig. 6F shows
representative images of the proliferation process in A549 and
H1299 cells. OE of ACSBG1 significantly suppressed the
proliferation of LUAD cells compared with that in OE-Ctrl cells,
whereas KD of ACSBG1 led to a marked increase in their
proliferation rate compared with in the sh-Ctrl group.
Validation of colony-forming
ability
The colony formation assay reflects the
proliferation capacity of tumor cells. In A549 and H1299 cell
lines, compared with in the Sh-Ctrl group, the Sh-ACSBG1 group
exhibited significantly enhanced colony-forming ability, whereas
the OE-ACSBG1 group showed a significant reduction in colony
formation compared with that in the OE-Ctrl group (Fig. 6D). These results are consistent with
those from CCK-8 and EdU assays.
Validation of cell migration and
invasion
The current study evaluated the impact of ACSBG1 on
the migratory and invasive phenotypes of LUAD cells using Transwell
invasion and migration assays. Compared with in their respective
control groups (OE-Ctrl or Sh-Ctrl), OE of ACSBG1 significantly
inhibited the migratory and invasive capacities of LUAD cells,
whereas KD of ACSBG1 markedly promoted these phenotypes (Fig. 6E). The wound healing assay indicated
statistically significant differences in wound healing capacity at
the 36-h time point, with the expression level of ACSBG1 exhibiting
an inverse associated with the wound healing capacity of LUAD cells
(Fig. 6G).
Validation of apoptosis rate
In LUAD cells, the Sh-ACSBG1 group exhibited
significantly reduced apoptosis rates compared with those in the
Sh-Ctrl group (quadrants 2 and 4 represent the early and late
apoptosis rates), whereas the OE-ACSBG1 group exhibited
significantly increased apoptosis rates compared with those in the
OE-Ctrl group (Fig. 6H).
Discussion
LUAD, as the main subtype of NSCLC, has long
presented a marked challenge in clinical treatment due to its high
early recurrence rate and poor prognosis (21–25).
Studies have shown that fatty acid metabolic reprogramming serves a
crucial role in the occurrence, development and treatment
resistance of LUAD. Tumor cells create a metabolic microenvironment
conducive to their own proliferation and metastasis by upregulating
fatty acid synthesis pathways [such as the acetyl-CoA conversion
process, which is mediated by genes such as fatty acid synthase
(FASN) and acetyl-CoA carboxylase], enhancing lipid uptake and
inhibiting fatty acid oxidation (26–28).
In EGFR-mutated LUAD, FASN-mediated palmitoylation modification
promotes resistance to targeted therapy, whereas stearoyl-CoA
desaturase 1 inhibitors can reverse gefitinib resistance (29). Moreover, abnormal lipid metabolism
is closely associated with the immunosuppressive microenvironment.
High lipid accumulation can markedly affect the therapeutic
efficacy of immune checkpoint inhibitors by regulating the fatty
acid oxidation of tumor-associated macrophages and the infiltration
of CD8+ T cells (30–33).
This indicates that constructing a prognostic model related to FAM
is not only biologically reasonable but also holds promise for
providing new targets for personalized treatment.
In the present study, a prognostic risk model based
on FAM genes was successfully constructed, and ACSBG1 was screened
as the core regulatory factor. This risk scoring model demonstrated
stable predictive performance in both the training set and the
independent validation set (AUC values for 1/3/5 years were
>0.7). SHAP interpretability analysis revealed that ACSBG1 made
the highest contribution to prognostic prediction. Clinical cohort
analysis showed that the high-risk group was significantly
associated with TNM stage, stage classification and shortened OS.
Downregulation of its expression may lead to defects in lipid
antigen presentation, thereby creating an immunosuppressive
microenvironment. These findings provide a novel perspective for an
in-depth understanding of the interaction between metabolic
reprogramming and tumor immune escape.
Given the importance of ACSBG1, the current study
further investigated the role of this gene in LUAD. As a member of
the acyl-CoA synthetase family, the ACSBG1 gene serves a vital role
in the activation of long-chain fatty acids. It catalyzes the
combination of fatty acids with coenzyme A to generate acyl-CoA,
providing substrates for β-oxidation and phospholipid synthesis
(34). Notably, it has been shown
that the abnormal expression of ACSBG1 is closely related to
metabolic reprogramming in cancer (35). For example, in breast cancer, low
expression of ACSBG1 is associated with increased lipid
accumulation and poor prognosis (35). It has been demonstrated that breast
cancer cells with ACSBG1 OE acquire proliferative advantages in
nutrient-deprived microenvironments by enhancing fatty acid uptake
and oxidation. This metabolic reprogramming provides substantial
acetyl-CoA to the tricarboxylic acid cycle, thereby promoting the
synthesis of ATP and phosphocreatine (35). However, the function of ACSBG1 in
LUAD remains controversial. Although an earlier study suggested
that it may limit tumor growth by maintaining lipid homeostasis,
direct experimental evidence is lacking (36). In the current study, lentiviral
plasmid infection technology was used in LUAD cells to induce
ACSBG1 OE and KD, and functional experiments were conducted to
verify ACSBG1 as a tumor suppressor gene inhibiting the progression
of LUAD. The experimental results showed that the expression levels
of ACSBG1 were negatively associated with the progression of LUAD,
which was highly consistent with the tumor suppressor phenotype
observed clinically.
It is worth noting that although the present study
comprehensively analyzed the role of ACSBG1 in LUAD, there are
still some limitations to be addressed. Specifically, the observed
correlations between ACSBG1 expression and immune cell infiltration
do not establish causality. The analysis was based on
bioinformatics associations from public databases and lacks
experimental validation of direct mechanistic links between ACSBG1
and immune modulation. Further studies, such as co-culture assays
or in vivo models, are needed to confirm whether ACSBG1
directly influences immune cell recruitment or function. In-depth
exploration of the potential molecular mechanisms and downstream
signaling pathways affected by ACSBG1 will also contribute to a
more comprehensive understanding of its clinical relevance and
potential therapeutic targets. In addition, more internal clinical
samples are required to validate the results.
In conclusion, by integrating the transcriptome data
of LUAD from TCGA and GEO databases, 35 FAM-related DEGs were
screened out, and a prognostic risk model based on seven key genes
was constructed. Through LASSO regression and SHAP interpretability
analyses, ACSBG1 was revealed to be the most predictive protective
factor in the model. Experimental verification showed that high
expression of ACSBG1 significantly inhibited the proliferation,
migration and invasion of LUAD cells, and promoted cell apoptosis.
Furthermore, the low expression of ACSBG1 was weakly correlated
with a reduction in CD4+ and CD8+ T-cell
infiltration, suggesting that it may affect the prognosis of
patients by regulating the tumor immune microenvironment. Clinical
analysis confirmed that the 5-year survival rate of patients in the
high-risk group was significantly lower than that in the low-risk
group, and the risk score was independently associated with TNM
staging. To the best of our knowledge, the present study is the
first to reveal the molecular mechanism of ACSBG1 as a novel tumor
suppressor gene, providing metabolism-related biomarkers and
potential therapeutic targets for the prognostic stratification and
targeted therapy of LUAD.
Supplementary Material
Supporting Data
Acknowledgements
Not applicable.
Funding
Funding: No funding was received.
Availability of data and materials
The data generated in the present study may be
requested from the corresponding author.
Authors' contributions
AL conceptualized the study, reviewed and edited the
manuscript, conducted data collection, wrote the original draft of
the manuscript and investigated the research background. PH
developed the methodology, performed formal analysis, conducted
project administration and supervised the study. AL and PH confirm
the authenticity of all the raw data. All authors read and approved
the final manuscript.
Ethics approval and consent to
participate
Not applicable.
Patient consent for publication
Not applicable.
Competing interests
The authors declare that they have no competing
interests.
References
|
1
|
Dubey AK, Gupta U and Jain S: Epidemiology
of lung cancer and approaches for its prediction: A systematic
review and analysis. Chin J Cancer. 35:712016. View Article : Google Scholar : PubMed/NCBI
|
|
2
|
Yang D, Liu Y, Bai C, Wang X and Powell
CA: Epidemiology of lung cancer and lung cancer screening programs
in China and the United States. Cancer Lett. 468:82–87. 2020.
View Article : Google Scholar : PubMed/NCBI
|
|
3
|
Zhou J, Liu B, Li Z, Li Y, Chen X, Ma Y,
Yan S, Yang X, Zhong L and Wu N: Proteomic analyses identify
differentially expressed proteins and pathways between Low-risk and
High-risk subtypes of Early-stage lung adenocarcinoma and their
prognostic impacts. Mol Cell Proteomics. 20:1000152021. View Article : Google Scholar : PubMed/NCBI
|
|
4
|
Röhrig F and Schulze A: The multifaceted
roles of fatty acid synthesis in cancer. Nat Rev Cancer.
16:732–749. 2016. View Article : Google Scholar : PubMed/NCBI
|
|
5
|
Santos CR and Schulze A: Lipid metabolism
in cancer. FEBS J. 279:2610–2623. 2012. View Article : Google Scholar : PubMed/NCBI
|
|
6
|
Winkelkotte AM, Al-Shami K, Chaves-Filho
AB, Vogel FCE and Schulze A: Interactions of fatty acid and
cholesterol metabolism with cellular stress response pathways in
cancer. Cold Spring Harb Perspect Med. 15:a0415482025. View Article : Google Scholar : PubMed/NCBI
|
|
7
|
Angeles-Lopez QD, Rodriguez-Lopez J,
Agudelo Garcia P, Calyeca J, Álvarez D, Bueno M, Tu LN,
Salazar-Terreros M, Vanegas-Avendaño N, Krull JE, et al: Regulation
of lung progenitor plasticity and repair by fatty acid oxidation.
JCI Insight. 10:e1658372025. View Article : Google Scholar : PubMed/NCBI
|
|
8
|
Zhang L, Liu X, Liu Y, Yan F, Zeng Y, Song
Y, Fang H, Song D and Wang X: Lysophosphatidylcholine inhibits lung
cancer cell proliferation by regulating fatty acid metabolism
enzyme long-chain acyl-coenzyme A synthase 5. Clin Transl Med.
13:e11802023. View Article : Google Scholar : PubMed/NCBI
|
|
9
|
Chen Z, Gong Y, Chen F, Lee HJ, Qian J,
Zhao J, Zhang W, Li Y, Zhou Y, Xu Q, et al: Orchestrated
desaturation reprogramming from stearoyl-CoA desaturase to fatty
acid desaturase 2 in cancer epithelial-mesenchymal transition and
metastasis. Cancer Commun (Lond). 45:245–280. 2025. View Article : Google Scholar : PubMed/NCBI
|
|
10
|
Li H, Sun J, Hu H and Wang Y:
Transcription factor E2F8 activates PDK1-Mediated DNA damage repair
to enhance cisplatin resistance in lung adenocarcinoma.
Pharmacology. 109:341–356. 2024.PubMed/NCBI
|
|
11
|
Chen J, Alduais Y, Zhang K, Zhu X and Chen
B: CCAT1/FABP5 promotes tumour progression through mediating fatty
acid metabolism and stabilizing PI3K/AKT/mTOR signalling in lung
adenocarcinoma. J Cell Mol Med. 25:9199–9213. 2021. View Article : Google Scholar : PubMed/NCBI
|
|
12
|
Chen Z, Hu Z, Sui Q, Huang Y, Zhao M, Li
M, Liang J, Lu T, Zhan C, Lin Z, et al: LncRNA FAM83A-AS1
facilitates tumor proliferation and the migration via the
HIF-1α/glycolysis axis in lung adenocarcinoma. Int J Biol Sci.
18:522–535. 2022. View Article : Google Scholar : PubMed/NCBI
|
|
13
|
Binnewies M, Roberts EW, Kersten K, Chan
V, Fearon DF, Merad M, Coussens LM, Gabrilovich DI,
Ostrand-Rosenberg S, Hedrick CC, et al: Understanding the tumor
immune microenvironment (TIME) for effective therapy. Nat Med.
24:541–550. 2018. View Article : Google Scholar : PubMed/NCBI
|
|
14
|
Luo Y, Wang H, Liu B and Wei J: Fatty acid
metabolism and cancer immunotherapy. Curr Oncol Rep. 24:659–670.
2022. View Article : Google Scholar : PubMed/NCBI
|
|
15
|
Tomida S, Takeuchi T, Shimada Y, Arima C,
Matsuo K, Mitsudomi T, Yatabe Y and Takahashi T: Relapse-related
molecular signature in lung adenocarcinomas identifies patients
with dismal prognosis. J Clin Oncol. 27:2793–2799. 2009. View Article : Google Scholar : PubMed/NCBI
|
|
16
|
Ritchie ME, Phipson B, Wu D, Hu Y, Law CW,
Shi W and Smyth GK: limma powers differential expression analyses
for RNA-sequencing and microarray studies. Nucleic Acids Res.
43:e472015. View Article : Google Scholar : PubMed/NCBI
|
|
17
|
Friedman J, Hastie T and Tibshirani R:
Regularization paths for generalized linear models via coordinate
descent. J Stat Softw. 33:1–22. 2010. View Article : Google Scholar : PubMed/NCBI
|
|
18
|
Lee BK, Mayhew EJ, Sanchez-Lengeling B,
Wei JN, Qian WW, Little KA, Andres M, Nguyen BB, Moloy T, Yasonik
J, et al: A principal odor map unifies diverse tasks in olfactory
perception. Science. 381:999–1006. 2023. View Article : Google Scholar : PubMed/NCBI
|
|
19
|
Helmreich JE: Regression modeling
strategies with applications to linear models, logistic and ordinal
regression and survival analysis (2nd edition). J Statistical
Software Book Rev. 70:1–3. 2016.
|
|
20
|
Livak KJ and Schmittgen TD: Analysis of
relative gene expression data using real-time quantitative PCR and
the 2(−Delta Delta C(T)) method. Methods. 25:402–408. 2001.
View Article : Google Scholar : PubMed/NCBI
|
|
21
|
Koundouros N and Poulogiannis G:
Reprogramming of fatty acid metabolism in cancer. Br J Cancer.
122:4–22. 2020. View Article : Google Scholar : PubMed/NCBI
|
|
22
|
Eltayeb K, La Monica S, Tiseo M, Alfieri R
and Fumarola C: Reprogramming of lipid metabolism in lung cancer:
An overview with focus on EGFR-Mutated Non-small cell lung cancer.
Cells. 11:4132022. View Article : Google Scholar : PubMed/NCBI
|
|
23
|
Petiti J, Arpinati L, Menga A and Carrà G:
The influence of fatty acid metabolism on T cell function in lung
cancer. FEBS J. 292:3596–3615. 2025. View Article : Google Scholar : PubMed/NCBI
|
|
24
|
Lu S, Pan X, Volckova E, Shinde A, Fuller
SR, Egan R, Ma J, Kung J, Ott CJ, Hata AN, et al: Targeting
monounsaturated fatty acid metabolism for radiosensitization of
KRAS mutant 3D lung cancer models. Mol Cancer Ther. 24:920–930.
2025. View Article : Google Scholar : PubMed/NCBI
|
|
25
|
Relat J, Blancafort A, Oliveras G, Cufí S,
Haro D, Marrero PF and Puig T: Different fatty acid metabolism
effects of (−)-epigallocatechin-3-gallate and C75 in adenocarcinoma
lung cancer. BMC Cancer. 12:2802012. View Article : Google Scholar : PubMed/NCBI
|
|
26
|
Huang D, Tang E, Zhang T and Xu G:
Characteristics of fatty acid metabolism in lung adenocarcinoma to
guide clinical treatment. Front Immunol. 13:9162842022. View Article : Google Scholar : PubMed/NCBI
|
|
27
|
Fang X, Li J, Pang H, Zheng H, Shi X, Feng
L, Hu K and Zhou T: Xingxiao pills suppresses lung adenocarcinoma
progression by modulating lipid metabolism and inhibiting the
PLA2G4A-GLI1-SOX2 Axis. Phytomedicine. 143:1568262025. View Article : Google Scholar : PubMed/NCBI
|
|
28
|
Zhang J, Song Y, Shi Q and Fu L: Research
progress on FASN and MGLL in the regulation of abnormal lipid
metabolism and the relationship between tumor invasion and
metastasis. Front Med. 15:649–656. 2021. View Article : Google Scholar : PubMed/NCBI
|
|
29
|
Ali A, Levantini E, Teo JT, Goggi J,
Clohessy JG, Wu CS, Chen L, Yang H, Krishnan I, Kocher O, et al:
Fatty acid synthase mediates EGFR palmitoylation in EGFR mutated
non-small cell lung cancer. EMBO Mol Med. 10:e83132018. View Article : Google Scholar : PubMed/NCBI
|
|
30
|
Vitale I, Manic G, Coussens LM, Kroemer G
and Galluzzi L: Macrophages and metabolism in the tumor
microenvironment. Cell Metab. 30:36–50. 2019. View Article : Google Scholar : PubMed/NCBI
|
|
31
|
Wu L, Zhang X, Zheng L, Zhao H, Yan G,
Zhang Q, Zhou Y, Lei J, Zhang J, Wang J, et al: RIPK3 orchestrates
fatty acid metabolism in Tumor-associated macrophages and
hepatocarcinogenesis. Cancer Immunol Res. 8:710–721. 2020.
View Article : Google Scholar : PubMed/NCBI
|
|
32
|
Chen Y, Zhou Y, Ren R, Chen Y, Lei J and
Li Y: Harnessing lipid metabolism modulation for improved
immunotherapy outcomes in lung adenocarcinoma. J Immunother Cancer.
12:e0088112024. View Article : Google Scholar : PubMed/NCBI
|
|
33
|
Zhu M, Zeng Q, Fan T, Lei Y, Wang F, Zheng
S, Wang X, Zeng H, Tan F, Sun N, et al: Clinical significance and
immunometabolism landscapes of a novel Recurrence-associated lipid
metabolism signature in Early-stage lung adenocarcinoma: A
comprehensive analysis. Front Immunol. 13:7834952022. View Article : Google Scholar : PubMed/NCBI
|
|
34
|
Kanno T, Nakajima T, Kawashima Y, Yokoyama
S, Asou HK, Sasamoto S, Hayashizaki K, Kinjo Y, Ohara O, Nakayama T
and Endo Y: Acsbg1-dependent mitochondrial fitness is a metabolic
checkpoint for tissue Treg cell homeostasis. Cell Rep.
37:1099212021. View Article : Google Scholar : PubMed/NCBI
|
|
35
|
Maguire OA, Ackerman SE, Szwed SK, Maganti
AV, Marchildon F, Huang X, Kramer DJ, Rosas-Villegas A, Gelfer RG,
Turner LE, et al: Creatine-mediated crosstalk between adipocytes
and cancer cells regulates obesity-driven breast cancer. Cell
Metab. 33:499–512.e6. 2021. View Article : Google Scholar : PubMed/NCBI
|
|
36
|
Zhou S, Sung E, Prakosa A, Aronis KN,
Chrispin J, Tandri H, AbdelWahab A, Horáček BM, Sapp JL and
Trayanova NA: Feasibility study shows concordance between
image-based virtual-heart ablation targets and predicted ECG-based
arrhythmia exit-sites. Pacing Clin Electrophysiol. 44:432–441.
2021. View Article : Google Scholar : PubMed/NCBI
|