Introduction
Gastric cancer (GC), a malignant tumor originating
from the gastric mucosal epithelium, occurs owing to a disruption
in the dynamic balance between the proliferation and apoptosis of
epithelial cells under the influence of various carcinogenic
factors (1,2). GC is the fifth most common cancer
worldwide and exhibits particularly high incidence rates of ~23.0
per 100,000 in males and ~9.7 per 100,000 in females in East Asian
countries such as China, Japan, and South Korea (3,4).
Despite advances in molecular targeted therapy and immunotherapy,
the overall 5-year survival rate of patients with advanced GC
remains <50% (5,6). Moreover, highly sensitive and specific
biomarkers that can be used for early screening, treatment
monitoring, and personalized therapy in GC are lacking (7).
Numerous studies have shown that the initiation and
progression of GC are closely associated with molecular alterations
in key biological processes, such as the proliferation and
apoptosis of malignant epithelial cells and epithelial-mesenchymal
transition (EMT) (8–10). Therefore, elucidating the functional
heterogeneity, molecular alterations, and the mechanisms driving
these alterations in malignant gastric epithelial cells is
necessary for identifying novel biomarkers and therapeutic targets
with clinical translational potential, which is a key research
focus in the field of precision medicine for GC.
During rapid proliferation, malignant gastric
epithelial cells often exhibit increased genomic instability
accompanied by extensive DNA damage (11). These cells typically activate DNA
damage response (DDR) pathways to repair damaged DNA, preserve
genomic integrity, and ensure continuous proliferation (12,13).
In various DNA repair pathways, such as double-strand break (DSB)
repair, base excision repair (BER), and homologous recombination
(HR) repair, deoxyribonucleotide triphosphates (dNTPs) serve as the
essential building blocks for DNA synthesis (14). Insufficient dNTP pools impair DNA
repair, resulting in chromosome breakage and cell death (15). dNTP synthesis is tightly regulated
by the rate-limiting enzyme ribonucleotide reductase (RNR), which
contains a catalytic subunit, ribonucleotide reductase M1(RRM1),
and a regulatory subunit, ribonucleotide reductase M2 (RRM2)
(16).
Recent studies have identified RRM2 as a crucial
regulator of tumor progression in multiple cancer types (17,18).
In lung adenocarcinoma, RRM2 has been associated with enhanced
tumor cell proliferation and invasion. In hepatocellular and breast
cancers, RRM2 has been reported to contribute to DNA repair,
metastasis, and treatment resistance. Through analysis of data from
The Cancer Genome Atlas (TCGA) (https://portal.gdc.cancer.gov/) and the
Genotype-Tissue Expression (GTEx) project (https://www.gtexportal.org/), it was revealed that
RRM2 may play a potential oncogenic role in hepatocellular
carcinoma (19). A total of 2,509
breast cancer samples were downloaded from the METABRIC database
(https://www.cbioportal.org/study?id=brca_metabric).
Among patients with luminal A and normal breast cancer, as well as
those with stage 1 and 2 breast cancer, patients with high RRM2
expression exhibited poorer overall survival (OS) and distant
metastasis-free survival (20).
Additionally, in a study involving 200 patients with breast cancer
from the histopathology laboratory at the Oncology Center of
Mansoura University (Mansoura Egypt), it was found that among the
estrogen receptor-positive group, RRM2 expression was associated
with a shorter disease-free survival period (21). These findings highlight the diverse
regulatory roles of RRM2 in various tumors. However, its specific
role and mechanisms in GC remain unclear. In the present study,
single-cell transcriptomic data, bulk RNA-sequencing data, and
in vitro functional experiments were integrated to
characterize RRM2 expression and investigate its functional role in
GC progression. The findings provide theoretical insights and
experimental evidence supporting the potential of RRM2 as a
therapeutic target for GC.
Materials and methods
Gastric cancer cell culture
The GC cell lines AGS and HGC-27 were purchased from
Procell Life Science & Technology Co., Ltd. Both cell lines
were cultured in RMPI-1640 medium (cat. no. SH30809.01; HyClone;
Cytiva) supplemented with 10% fetal bovine serum (cat. no.
10099141; Gibco; Thermo Fisher Scientific, Inc.) and 1%
penicillin-streptomycin (cat. no. C0222; Beyotime Institute of
Biotechnology) at 37°C in an atmosphere containing 5% carbon
dioxide. Mycoplasma contamination was assessed every 2 weeks using
a Mycoplasma staining detection kit (cat. no. C0296; Beyotime
Institute of Biotechnology).
Data sources and preprocessing
The gene expression data and clinical follow-up data
of 370 patients with GC were obtained from TCGA database (TCGA-STAD
dataset). The GSE66229 (22),
GSE84433 (23) and GSE163558
(24) datasets were downloaded from
the Gene Expression Omnibus (GEO) database. The data in these
datasets were analyzed using the GPL570 HG-U133_Plus_2 Affymetrix
Human Genome U133 Plus 2.0 Array (https://www.ncbi.nlm.nih.gov/geo/query/acc.cgi?acc=GPL570)
and the GPL6947 Illumina HumanHT-12 V3.0 expression beadchip
(https://www.ncbi.nlm.nih.gov/geo/query/acc.cgi?acc=GPL6947),
respectively. The gene expression data and clinical follow-up data
of 300 and 357 patients with GC were retained from the two
datasets, respectively. Bioinformatics analyses were conducted
using the following public databases: Tumor Immune Dysfunction and
Exclusion (TIDE; http://tide.dfci.harvard.edu/) for predicting immune
checkpoint inhibitor response; Tumor IMmune Estimation Resource
(TIMER2.0; http://cistrome.shinyapps.io/timer/) for evaluating
immune cell infiltration; TCGA (https://portal.gdc.cancer.gov/) for acquiring
multi-omics GC data; GEO (https://www.ncbi.nlm.nih.gov/geo/) for validating
differential gene expression; Kyoto Encyclopedia of Genes and
Genomes (KEGG; http://www.kegg.jp/) for pathway
enrichment analysis of differentially expressed genes; and Gene
Ontology (GO; http://geneontology.org/) for functional annotation of
gene sets.
Data analysis
Single-cell and transcriptome-wide sequencing were
performed using the R software (version 4.5.1; http://www.r-project.org/). For single-cell RNA
sequencing (scRNA seq), cell-level QC thresholds were applied as
follows: cells with nCount-RNA between 1,000 and 60,000 and those
with 500–7,000 genes (nFeature-RNA) were retained, whereas cells
with a mitochondrial gene percentage of >20% were excluded. For
gene-level QC thresholds, genes expressed in ≥5 cells were
retained, and batch effects were corrected using the Harmony
package (version 1.2.3; http://cran.r-project.org/web/packages/harmony/).
Batch effects in expression data were corrected through quantile
normalization using the normalizeBetweenArrays function in the
limma package (version 3.46.0; http://bioconductor.org/packages/release/bioc/html/limma.html).
Data reliability was validated through principal component analysis
(PCA) implemented using the FactoMineR package (version 2.12;
http://cran.r-project.org/web/packages/FactoMineR/),
and PCA plots were generated using the ggplot2 package (version
3.5.2; http://cran.r-project.org/web/packages/ggplot2/).
Differential expression analysis was performed using the limma or
DESeq2 package (version 1.49.4; http://bioconductor.org/packages/release/bioc/html/DESeq2.html);
prognostic analysis was performed using the survival (version
3.8–3; http://cran.r-project.org/web/packages/survival/)
and survminer (version 0.5.0; http://cran.r-project.org/web/packages/survminer/)
packages; weighted gene co-expression network analysis (WGCNA) was
performed using the WGCNA package (version 1.73; http://cran.r-project.org/web/packages/WGCNA/);
cell-cell communication was analyzed using CellChat (version 2.1.2;
http://github.com/jinworks/CellChat);
pseudotime series analysis was performed using Monocle2 (version
2.36.0; bioconductor.org); and copy number variations (CNVs) were
analyzed using the inferCNV package (version 1.24.0; http://bioconductor.org/packages/release/bioc/html/infercnv.html).
Data were visualized using the ggplot2, ComplexHeatmap (version
2.25.2; bioconductor.org), and Seurat packages (version 5.3.1;
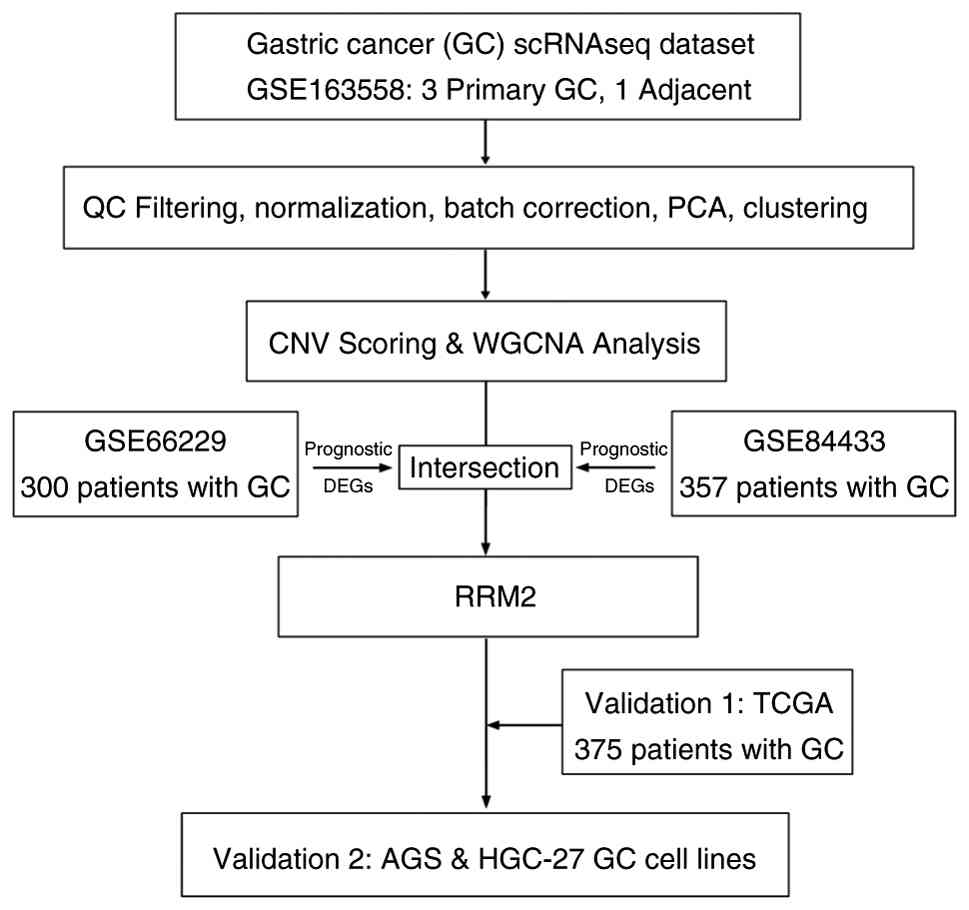
cran.r-project.org). A flowchart demonstrating the detailed data
processing protocol is shown in Fig.
1. scRNA QC parameters included nCount-RNA, nFeature-RNA,
mitochondrial gene percentage and the number of genes expressed per
cell.
siRNA cell transfection
AGS and HGC-27 cells in the logarithmic growth phase
were seeded in 24-well plates and transfected when the cell density
reached 80%. A total of 1.25 µl of 20 µM RRM2 siRNA (a negative
control siRNA was included in the same kit; cat. no. HY-RS12286;
MedChemExpress) was diluted with serum-free medium to a final
volume of 50 µl, gently mixed, and incubated at room temperature
for 5 min (solution A). Subsequently, 2.5 µl of siRNA/miRNA
transfection reagent (cat. no. HY-K2017; MedChemExpress) was
diluted with serum-free medium to a final volume of 50 µl, mixed
gently and incubated at room temperature for 5 min (solution B).
Solution B was gradually added dropwise to solution A, mixed gently
and incubated at room temperature for 20 min to form a transfection
complex (this mixture was used within 60 min). After the cell
culture medium was removed, 400 µl of serum-free medium and 100 µl
of the transfection complex were sequentially added and gently
mixed. After 6 h, the medium was replaced with a complete medium
containing serum, and incubation was continued. Protein extraction
and western blotting were performed to assess RRM2 knockdown
efficiency.
Colony formation assay
Cells in the logarithmic growth phase were seeded in
a 6-well plate at a density of 500–1,000 cells/well, mixed evenly,
and cultured for 14 days at 37°C. After colonies were visible, the
medium was removed, and the plates were washed twice with
phosphate-buffered saline (PBS). Thereafter, the cells were fixed
with 4% paraformaldehyde (cat. no. P0099-3L; Beyotime Insitute of
Biotechnology) for 20 min at room temperature and stained with 0.1%
crystal violet (cat. no. Y268091; Beyotime Insitute of
Biotechnology) for 20 min at room temperature. After rinsing and
air-drying, the cells were imaged and counted using the ImageJ
software (version 2.14.0; National Institutes of Health).
Cell apoptosis assay
Cells (3×10⁵) in the logarithmic growth
phase were harvested, and the culture supernatant and digested
cells were centrifuged separately at 300 × g for 5 min at 4°C. The
supernatants were discarded, and the pellets were combined,
resuspended in binding buffer, and incubated with Annexin V-FITC
and PI (cat. no. C1062M; Beyotime Insitute of Biotechnology) at 4°C
for 15 min in the dark. Flow cytometry (BD FACSVerse; BD
Biosciences) was used to calculate the proportion of early
apoptotic cells in the lower right quadrant (Annexin
V-FITC+ and PI−), and the data were analyzed
with FlowJo 10.4 (BD Biosciences).
Transwell assay
Transwell inserts (cat. no. 3422; Corning, Inc.)
were purchased in advance. Logarithmically growing cells were
digested and resuspended in serum-free medium. A total of 2,000
cells were counted and seeded into the upper chamber. The lower
chamber was filled with complete medium containing 10% FBS. After
24 h of culture at 37°C, the inserts were removed, washed twice
with FBS, fixed with 4% paraformaldehyde for 20 min at room
temperature and stained with crystal violet for 20 min at room
temperature. Non-migrated cells were removed with a cotton swab,
allowed to dry, and images were captured under a fluorescence
microscope (Olympus IX73; Olympus Corporation). Cell counting and
analysis were performed using ImageJ (version 2.14.0) software.
Wound healing assay
Logarithmically growing cells were seeded in a
6-well plate. When the cell confluence reached above 95%, a
straight scratch was made in the cell layer using a sterile pipette
tip. The scratched surface was gently rinsed with PBS. After
imaging, 4% FBS-reduced serum medium was added and cultured for
another 24 h (25). The supernatant
was discarded, the cells were gently rinsed with PBS and images
were obtained again. All images were captured under a fluorescence
microscope (Olympus IX73; Olympus Corporation). The width of the
scratch was measured and analyzed using ImageJ software (version
2.14.0).
Alkaline comet electrophoresis
Using the Comet Electrophoresis Kit (cat. no.
C2041S; Beyotime Institute of Biotechnology), approximately
1×10⁴ to 5×10⁴ cells in the logarithmic
growth phase were mixed with 0.7% low-melting-point agarose and
dropped onto pretreated slides. The mixture was incubated at 4°C
for 10 min. After the agarose solidified, the slides were placed in
lysis buffer at 4°C in the dark for at least 1 h. The slides were
then denatured in alkaline electrophoresis buffer (300 mM NaOH, 1
mM EDTA, pH 13) for 60 min. Subsequently, electrophoresis was
performed at 25 V for 30 min in the dark at 4°C. Following
electrophoresis, the cells were neutralized, stained with PI at 2
µg/ml for 10 min in the dark at room temperature, and observed
under a fluorescence microscope (Olympus IX73; Olympus Corporation)
and images were obtained.
Immunofluorescence
Using an immunofluorescence kit (cat. no. C2037S;
Beyotime Institute of Biotechnology), cells in the logarithmically
growing phase were seeded onto slides, removed from the slides,
gently rinsed twice with PBS, fixed with 4% paraformaldehyde for 15
min at room temperature, permeabilized with 0.1% Triton X-100 (cat.
no. NG1031A; Beyotime Insitute of Biotechnology) for 10 min,
blocked with 5% BSA (cat. no. A8806; Sigma-Aldrich; Merck KGaA) for
1 h at 37°C and incubated overnight at 4°C with a dropwise diluted
(1:500) primary antibody (γH2AX; cat. no. 9718S; Cell Signaling
Technology, Inc.). The cells were rinsed twice with PBS, and
diluted (1:100) fluorescently labeled (Alexa Fluor 488) donkey
anti-rabbit IgG secondary antibodies (cat. no. ab150061; Abcam)
were added for 1 h at room temperature. Cell nuclei were
counterstained with DAPI for 10 min at room temperature, then
mounted and observed and photographed under a fluorescence
microscope.
Western blot analyses
Cells in the logarithmically growing phase were
centrifuged at 300 × g for 5 min at room temperature, the
supernatant discarded, and the pellet added to lysis buffer (cat.
no. P0013B; Beyotime Insitute of Biotechnology). Total cellular
protein was extracted and quantified using the BCA assay (cat. no.
P0010; Beyotime Biotechnology). A total of 20 µg extracted proteins
were subjected to 10% SDS-PAGE electrophoresis (60 V for 30 min and
then transferred to 120 V for 60 min). After cutting the gel, the
membrane was transferred to a PVDF membrane (300 mA for 100 min)
and blocked with 5% skim milk for 2 h at room temperature. The
membrane was then incubated with the primary antibody at 4°C
overnight, washed three times with TBST (including 0.1% Tween-20),
and incubated with the diluted (1:1,000) secondary antibody
(anti-rabbit IgG, HRP-linked antibody; cat. no. 7074; and
anti-mouse IgG, HRP-linked antibody; cat. no. 7076; both from Cell
Signaling Technology, Inc.) at room temperature for 2 h. After
washing the membrane three times with TBST, the membrane was
developed and photographed using ECL luminescent solution (NCM
Biotech; Suzhou Xinsaimei Biotechnology Co., Ltd.), and the
grayscale value of the bands was analyzed using ImageJ software
(version 2.14.0). The primary antibodies used were as follows:
Poly(ADP-ribose) polymerase 1 (PARP-1; cat. no. 9532T; Cell
Signaling Technology, Inc.; diluted 1:1,000), X-ray repair
cross-complementing protein 1 (XRCC1; cat. no. ET1704-01; Huabio;
diluted 1:1,000), phosphorylated tumor protein p53 (p-p53; cat. no.
HA722761; Huabio; diluted 1:2,000), RRM2 (cat. no. ET1705-62;
Huabio; diluted 1:1,000), RAD51 recombinase (RAD51; cat. no.
ET1705-96; Huabio; diluted 1:5,000), phosphorylated histone H2AX
(γH2AX; cat. no. 9718S; Cell Signaling Technology, Inc.; diluted
1:1,000), GAPDH (cat. no. 2118S; Cell Signaling Technology, Inc.;
diluted 1:1,000).
Statistical analysis
Each experiment was performed in triplicate or more.
Data are presented as the mean ± standard deviation (SD).
Statistical analyses and figure creation were conducted using
GraphPad Prism 10 (Dotmatics). Comparisons between two groups
(Figs. 5 and 6) were conducted using Student's t-test.
One-way ANOVA was used for comparisons among mutliple groups
(Fig. 4C and H). When a significant
main effect (P<0.05) was found, pairwise comparisons between
groups were further assessed using Tukey's post-hoc test. A
P<0.05 was considered to indicate a statistically significant
difference. The following significance levels were applied:
P<0.05, P<0.01, P<0.001.
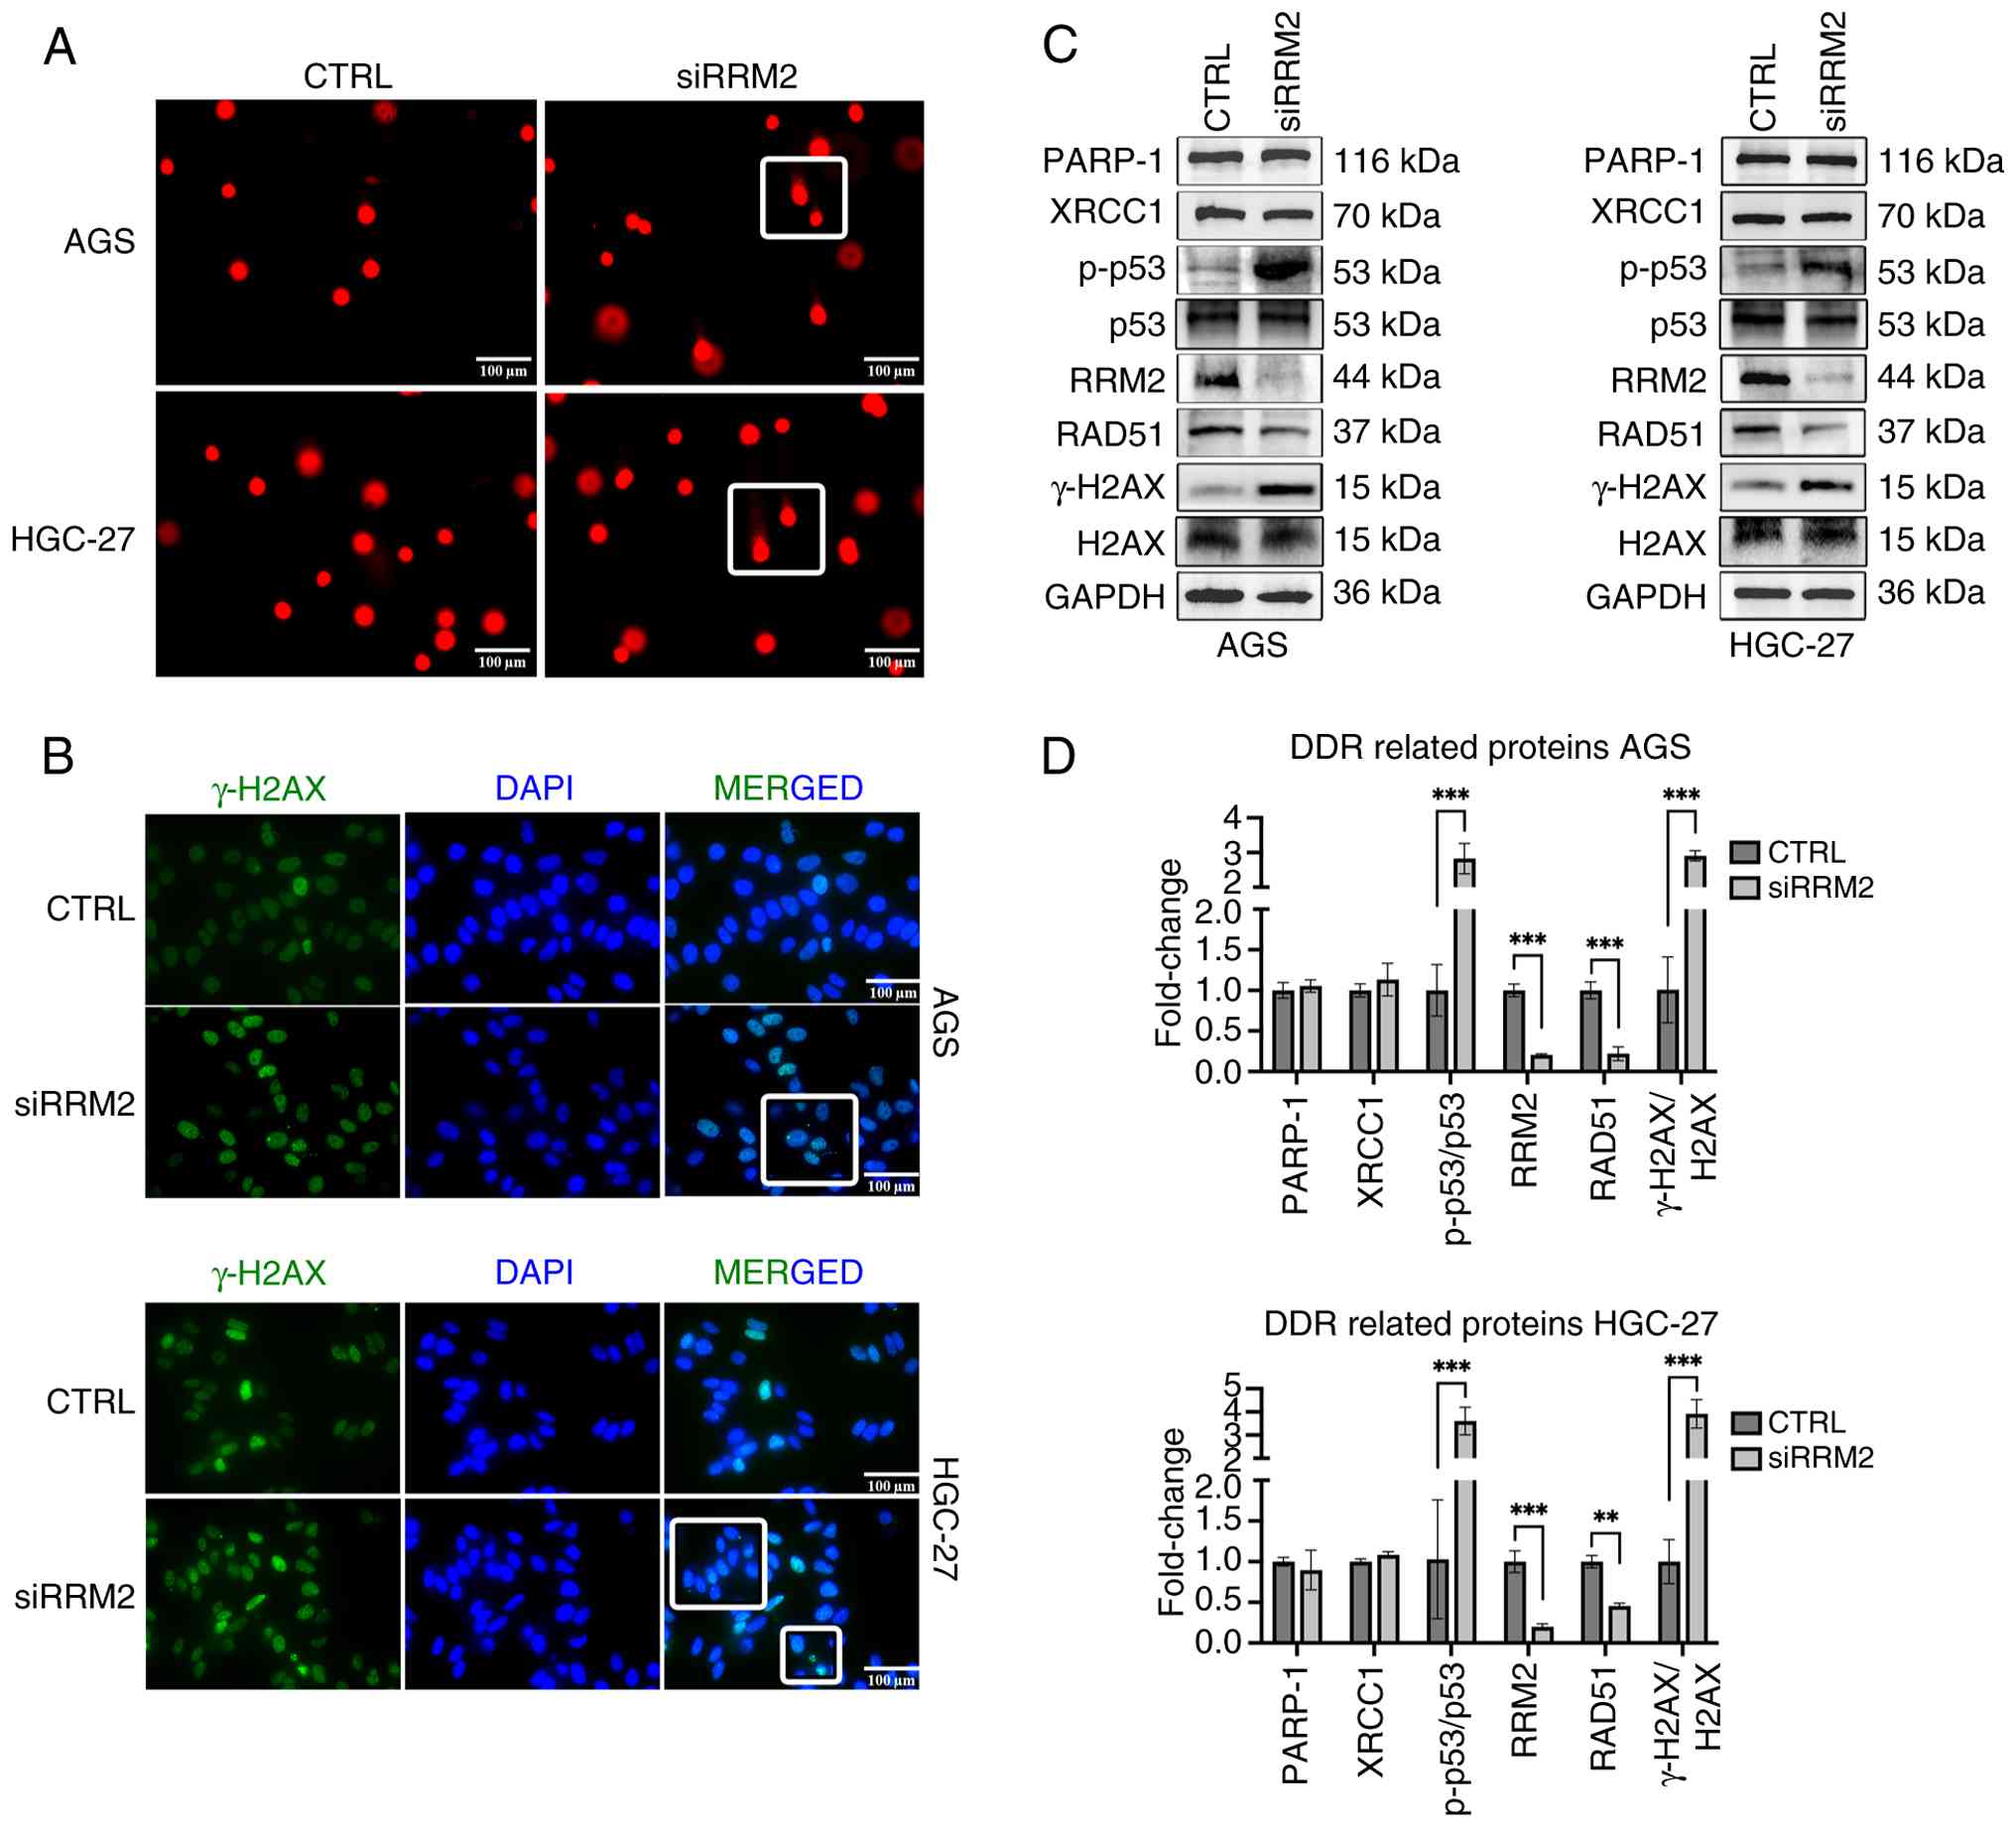 | Figure 6.RRM2 induces DNA damage and impairs
DNA repair capacity in GC cells. (A) Compared with the CTRL group,
the siRRM2 group showed pronounced comet tails and an increased
tail DNA content. Scale bar, 100 µm. (B) RRM2 knockdown markedly
increased γH2AX expression in GC cells. Scale bar, 100 µm. (C and
D) Compared with the CTRL group, the siRRM2 group showed
significantly higher expression levels of γH2AX and p-p53 and lower
expression levels of RAD51. No significant changes were observed in
PARP-1 and XRCC1 expression. In these experiments, each condition
consisted of n=3 biological replicates, with each replicate
analyzed in technical triplicate. RRM2, ribonucleotide reductase
regulatory subunit M2; GC, gastric cancer; CTRL, control; siRRM2,
RRM2-targeting siRNA; γH2AX, phosphorylated histone H2AX; p-p53,
phosphorylated tumor protein p53; RAD51, RAD51 recombinase; PARP-1,
poly(ADP-ribose) polymerase 1; XRCC1, X-ray repair
cross-complementing protein 1. **P<0.01, ***P<0.001. |
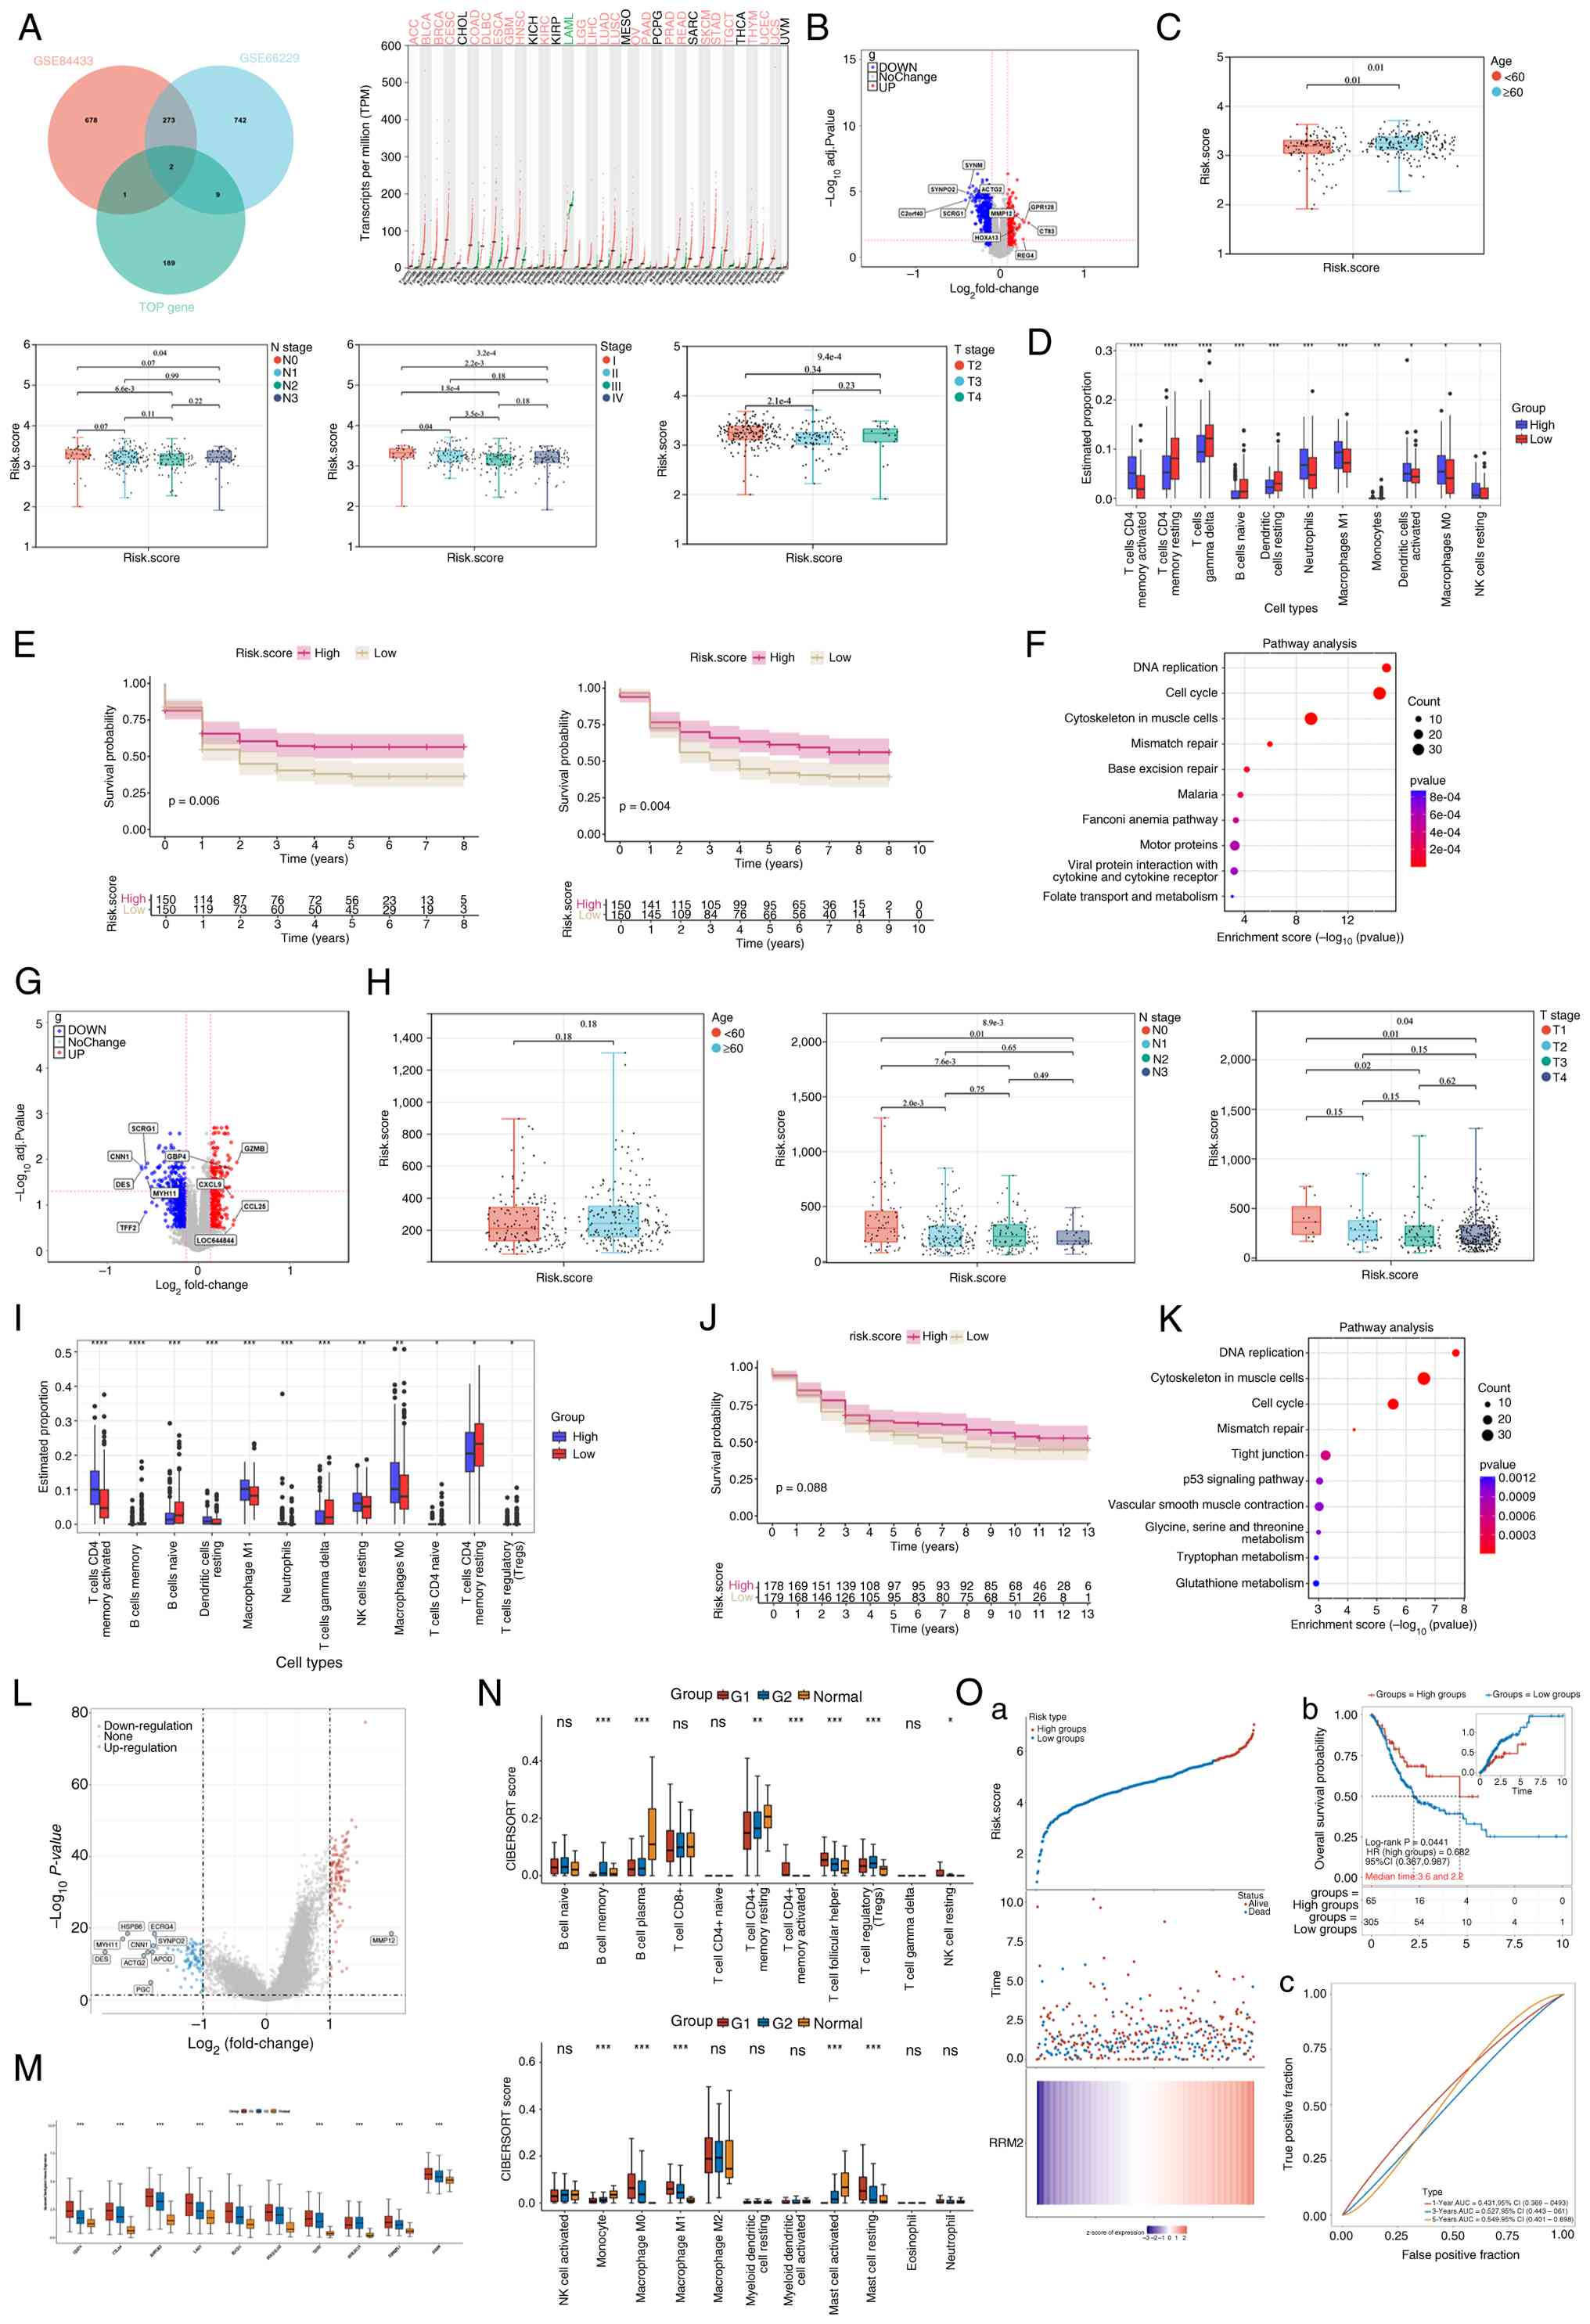 | Figure 4.Identification of RRM2 as a key
molecular target in GC based on transcriptomic data. (A) RRM2 was
identified as a hub gene by intersecting prognosis-related DEGs
from the GSE66229 and GSE84433 datasets with WGCNA-derived module
genes. Its expression in tumor versus adjacent normal tissues
across pan-cancer datasets is shown. (B, G and L) DEGs between the
high- and low-RRM2-expression groups in the GSE66229, GSE84433, and
TCGA-STAD datasets. (C and H) Association of RRM2 expression with
age and TNM stage. (D, I and N) Association between RRM2 expression
and immune cell infiltration. (E, J and O) Kaplan-Meier survival
analyses indicating the prognostic significance of RRM2 in GC. (F
and K) KEGG enrichment analysis showing RRM2-related pathways in
GC. (M) Association between the expression of RRM2 and immune
checkpoint genes. RRM2, ribonucleotide reductase regulatory subunit
M2; GC, gastric cancer; DEGs, differentially expressed genes;
WGCNA, Weighted Gene Co-expression Network Analysis; TCGA, The
Cancer Genome Atlas; STAD, stomach adenocarcinoma; KEGG, Kyoto
Encyclopedia of Genes and Genomes. *P<0.05, **p<0.01,
***P<0.001, ****P<0.0001. |
Results
Single-cell analysis indicates the key
role of epithelial cells in GC progression
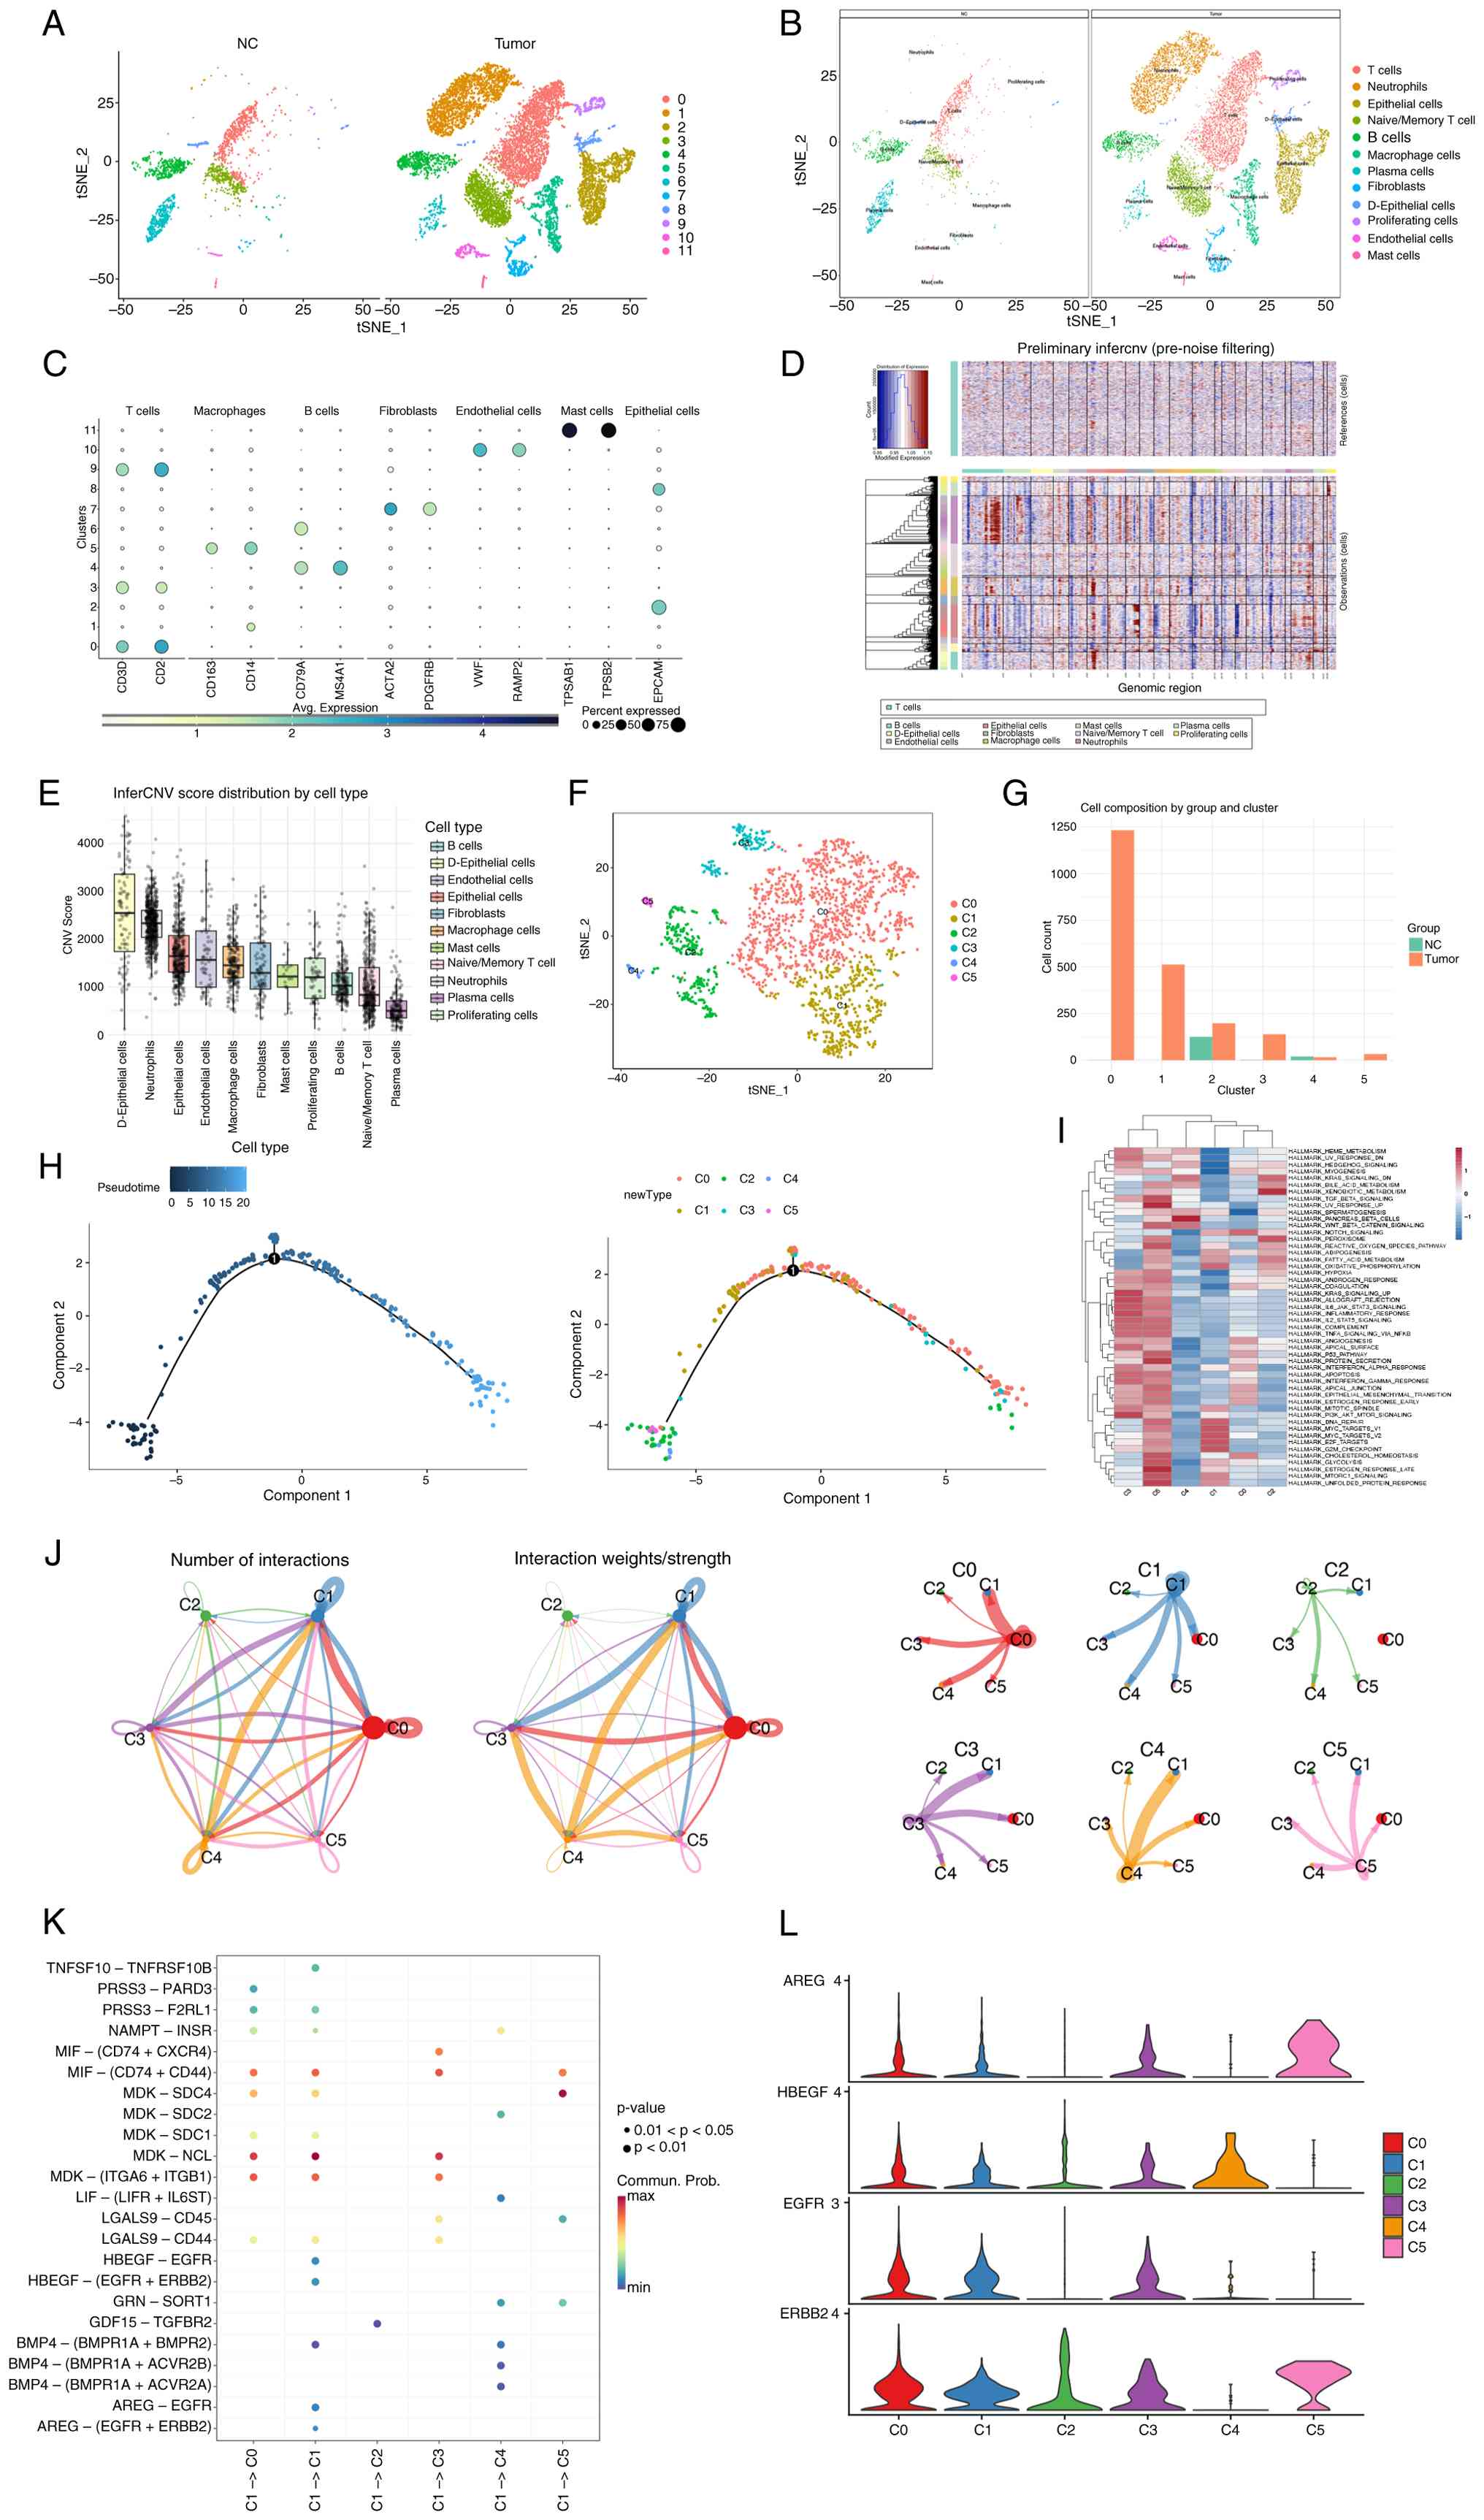
The scRNA-seq data of patients with GC were
subjected to quality-control analysis and highly variable genes
were selected (Fig. S1A-C). Cell
populations were compared between tumor and normal tissues, and
each cell cluster was annotated (Fig.
2A-C). The inferCNV algorithm was used to analyze CNVs across
different cell populations. The results revealed that D-epithelial
cells and general epithelial cell clusters exhibited a
significantly high number of CNVs (Fig.
2D and E).
These two epithelial cell populations were
subdivided into six clusters for further analysis. Among them,
clusters 0 (C0) and 1 (C1) accounted for the largest proportions
and were present only in tumor tissues (Fig. 2F and G). C0 (including genes such as
KRT19, GABRP, GPRC5A, TMC5, CYP3A5, CD55, MYH14, S100P, KRT8 and
ANXA2) exhibited an epithelial cell subtype with
secretory/metabolic function in tumors. C1 (including genes such as
TOP2A, MKI67, BIRC5, PBK, RRM2, CDC20, ASPM, CEP55, TPX2 and
KIF20B) contained highly proliferating epithelial cells. To
identify potential clinical molecular targets, analysis focused on
the more abundant tumor epithelial cell subpopulation. Pseudotime
trajectory analysis revealed that C1 cells were more primitive than
C0 cells (Fig. 2H). Gene set
enrichment analysis (GSEA) indicated that C1 cells were primarily
enriched in DNA repair and MYC target-related pathways (Fig. 2I). Intercellular communication
analysis revealed that both C0 and C1 cells strongly interacted
with other epithelial cell populations (Fig. 2J). Except for C0 and C1, C2
represents a differentiated cell group with some characteristics of
stem/progenitor cells from epithelial origin (including genes such
as PGC, ALDH1A1, FAM3B, CXCL17, OLFM4, MT1M, REG1A, TCEAL9, CDKN2A
and EID1). The C3 group corresponds to activated/effector T cells
associated with epithelial cells (including genes such as CD2,
FYB1, PTPRC, SAMSN1, WIPF1, SRGN, LCP1, CD52, LSP1 and SLA), while
C4 comprises neuroendocrine-like epithelial cells (including genes
such as RIMBP2, ST18, SCG5, HEPACAM2, SCG3, INSM1, RFX6, ARX, FGF14
and PCSK1). Finally, the C5 group represents an
inflammatory/stress-responsive epithelial subpopulation (including
genes such as NPPB, TNF, CYP2E1, CXCL5, HLA-DQA2, LY6K, CDKN2A,
MYL9, TAGLN, PNMA5) (Table
SI).
As shown in Fig. 2K,
C1 cells were involved in extensive ligand-receptor interactions
with other clusters. In addition, pathway enrichment analysis
revealed activated EGFR, WNT, and BMP signaling in C1 (Figs. 2L and S1D).
Definition and identification of major
effector cell subpopulations within epithelial cell clusters
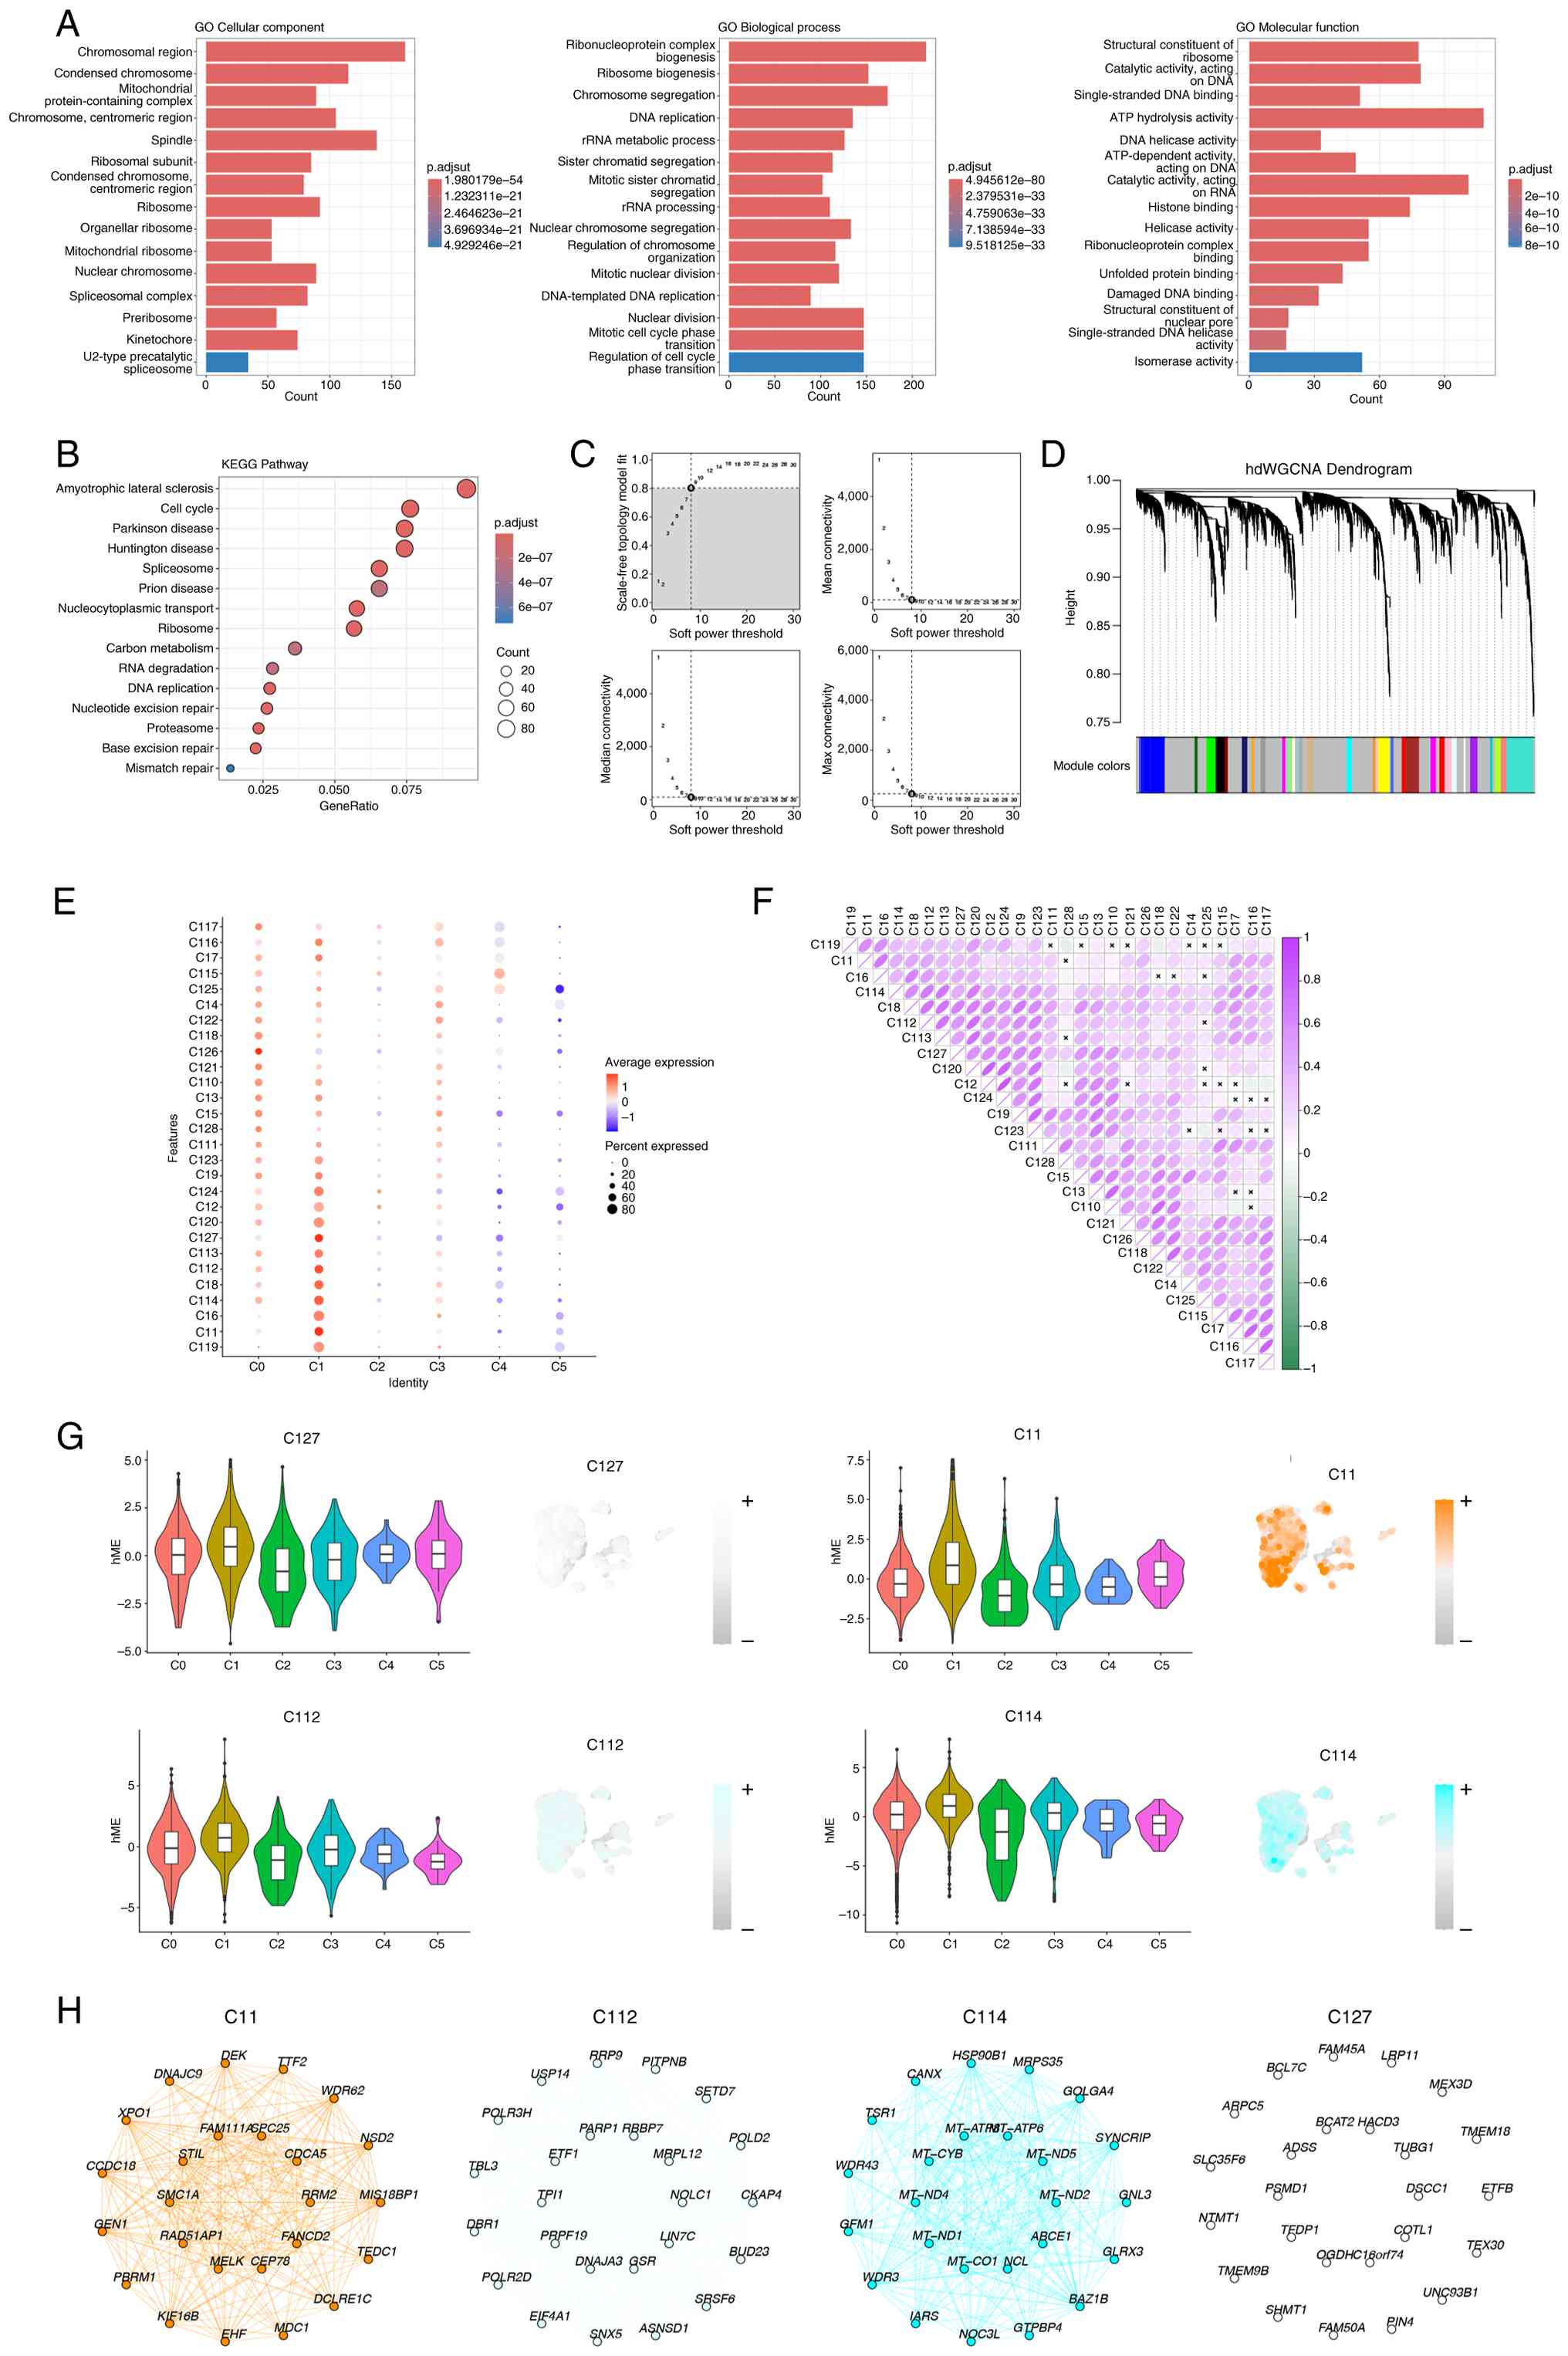
GO and KEGG analyses revealed that C1 cells were
predominantly enriched in the ‘chromosomal region’,
‘ribonucleoprotein complex biogenesis’, and ‘ATP hydrolysis
activity’ and were closely associated with the ‘cell cycle’ and
‘DNA replication’-related processes (Fig. 3A and B). Furthermore, WGCNA was
performed on C1 cells, selecting a soft-threshold power of 8, and
divided C1 into 28 subgroups (Fig. 3C
and D). The associations among these subgroups are presented in
Fig. 3E and F. Among the 28 modules
identified by WGCNA, their associatons with the C0-C5 cell
subpopulations (Fig. 3E) were
systematically evaluated. In the association study between module
28 and subpopulation C1, four subclusters (C11, C127, C112, and
C114) exhibited significantly higher average expression levels
compared with other subclusters. Based on this observation, these
four subclusters were selected for subsequent functional validation
experiments (Fig. 3G). The key
genes expressed in these subpopulations are shown in Fig. 3H.
Identification of RRM2 as a key
molecular target through integrated transcriptomic analysis
GC-specific transcriptomic datasets GSE66229 and
GSE84433 were obtained from GEO, and batch effects were removed.
Differentially expressed genes (DEGs) associated with GC prognosis
were identified based on survival analysis (Fig. S2A-D). Core genes from the four key
malignant epithelial cell subclusters (C11, C112, C114, and C127)
were intersected with the DEGs, resulting in the identification of
two overlapping genes, RRM2 and PRNP. GO and KEGG enrichment
analyses showed that RRM2 was strongly associated with ‘DNA
replication’; therefore, it was selected as the primary candidate
molecular target for GC. Pan-cancer analysis revealed that RRM2
expression was significantly higher in tumor tissues than in
adjacent normal tissues in various cancer types (Fig. 4A). In both GSE66229 and GSE84433
datasets, patients with GC were stratified into high- and
low-RRM2-expression groups. Expression trend analysis showed that
RRM2 expression gradually decreased with disease progression
(Fig. 4B, C, G and H).
RRM2 expression was positively associated with the
abundances of activated memory CD4+ T cells, M0 and M1
macrophages, and resting NK cells (Fig.
4D and I). Using the TIMER database, it was found that high
RRM2 expression in GC was associated with increased infiltration of
CD8+ T cells, CD8+ naive T cells, cytotoxic
lymphocytes (CTLs) and cytotoxic cells (Fig. S1E). The TIDE scores between two GEO
GC datasets (GSE66229 and GSE84433) were compared. A high TIDE
score indicates an increased risk of immune evasion by the tumor
and is assoicated with a poorer prognosis for patients. Both
datasets showed that the TIDE scores in the high-RRM2-expression
group were lower than those in the low-RRM2-expression group, with
statistically significant differences observed in GSE84433 dataset.
These findings suggest that patients with GC with higher RRM2
expression may exhibit reduced immune evasion and potentially an
improved response to immune checkpoint blockade therapy (Fig. S2E). The associations between RRM2
expression and prognosis across three datasets (GSE66229, GSE84433
and TCGA) are shown in Fig. 4E, J, and
O. Notably, statistically significant differences are shown in
Fig. 4E and O. In Fig. 4J, although P=0.088, a consistent
trend is observed in which higher RRM2 expression is associated
with longer survival time. It is hypothesized that if the GSE84433
dataset in Fig. 4J were expanded
with additional data, it would likely achieve a P<0.05. KEGG
analysis showed that RRM2 was enriched in ‘DNA replication’ and
‘cell cycle’ pathways (Fig. 4F and
K). To validate these findings, patients with GC in the
TCGA-STAD dataset were divided into RRM2-high (G1) and RRM2-low
(G2) groups (Fig. 4L). G1 exhibited
higher abundances of activated memory CD4+ T cells, M0
and M1 macrophages and resting NK cells, as well as significantly
higher expression levels of immune checkpoint genes such as LAG3,
PDCD1, and CTLA4 (Fig. 4M and N).
The results of GO and KEGG enrichment analyses in the TCGA-STAD
dataset were consistent with those observed in the GSE66229 and
GSE84433 datasets (Fig.
S2G-I).
Functional validation of RRM2 in GC
cells
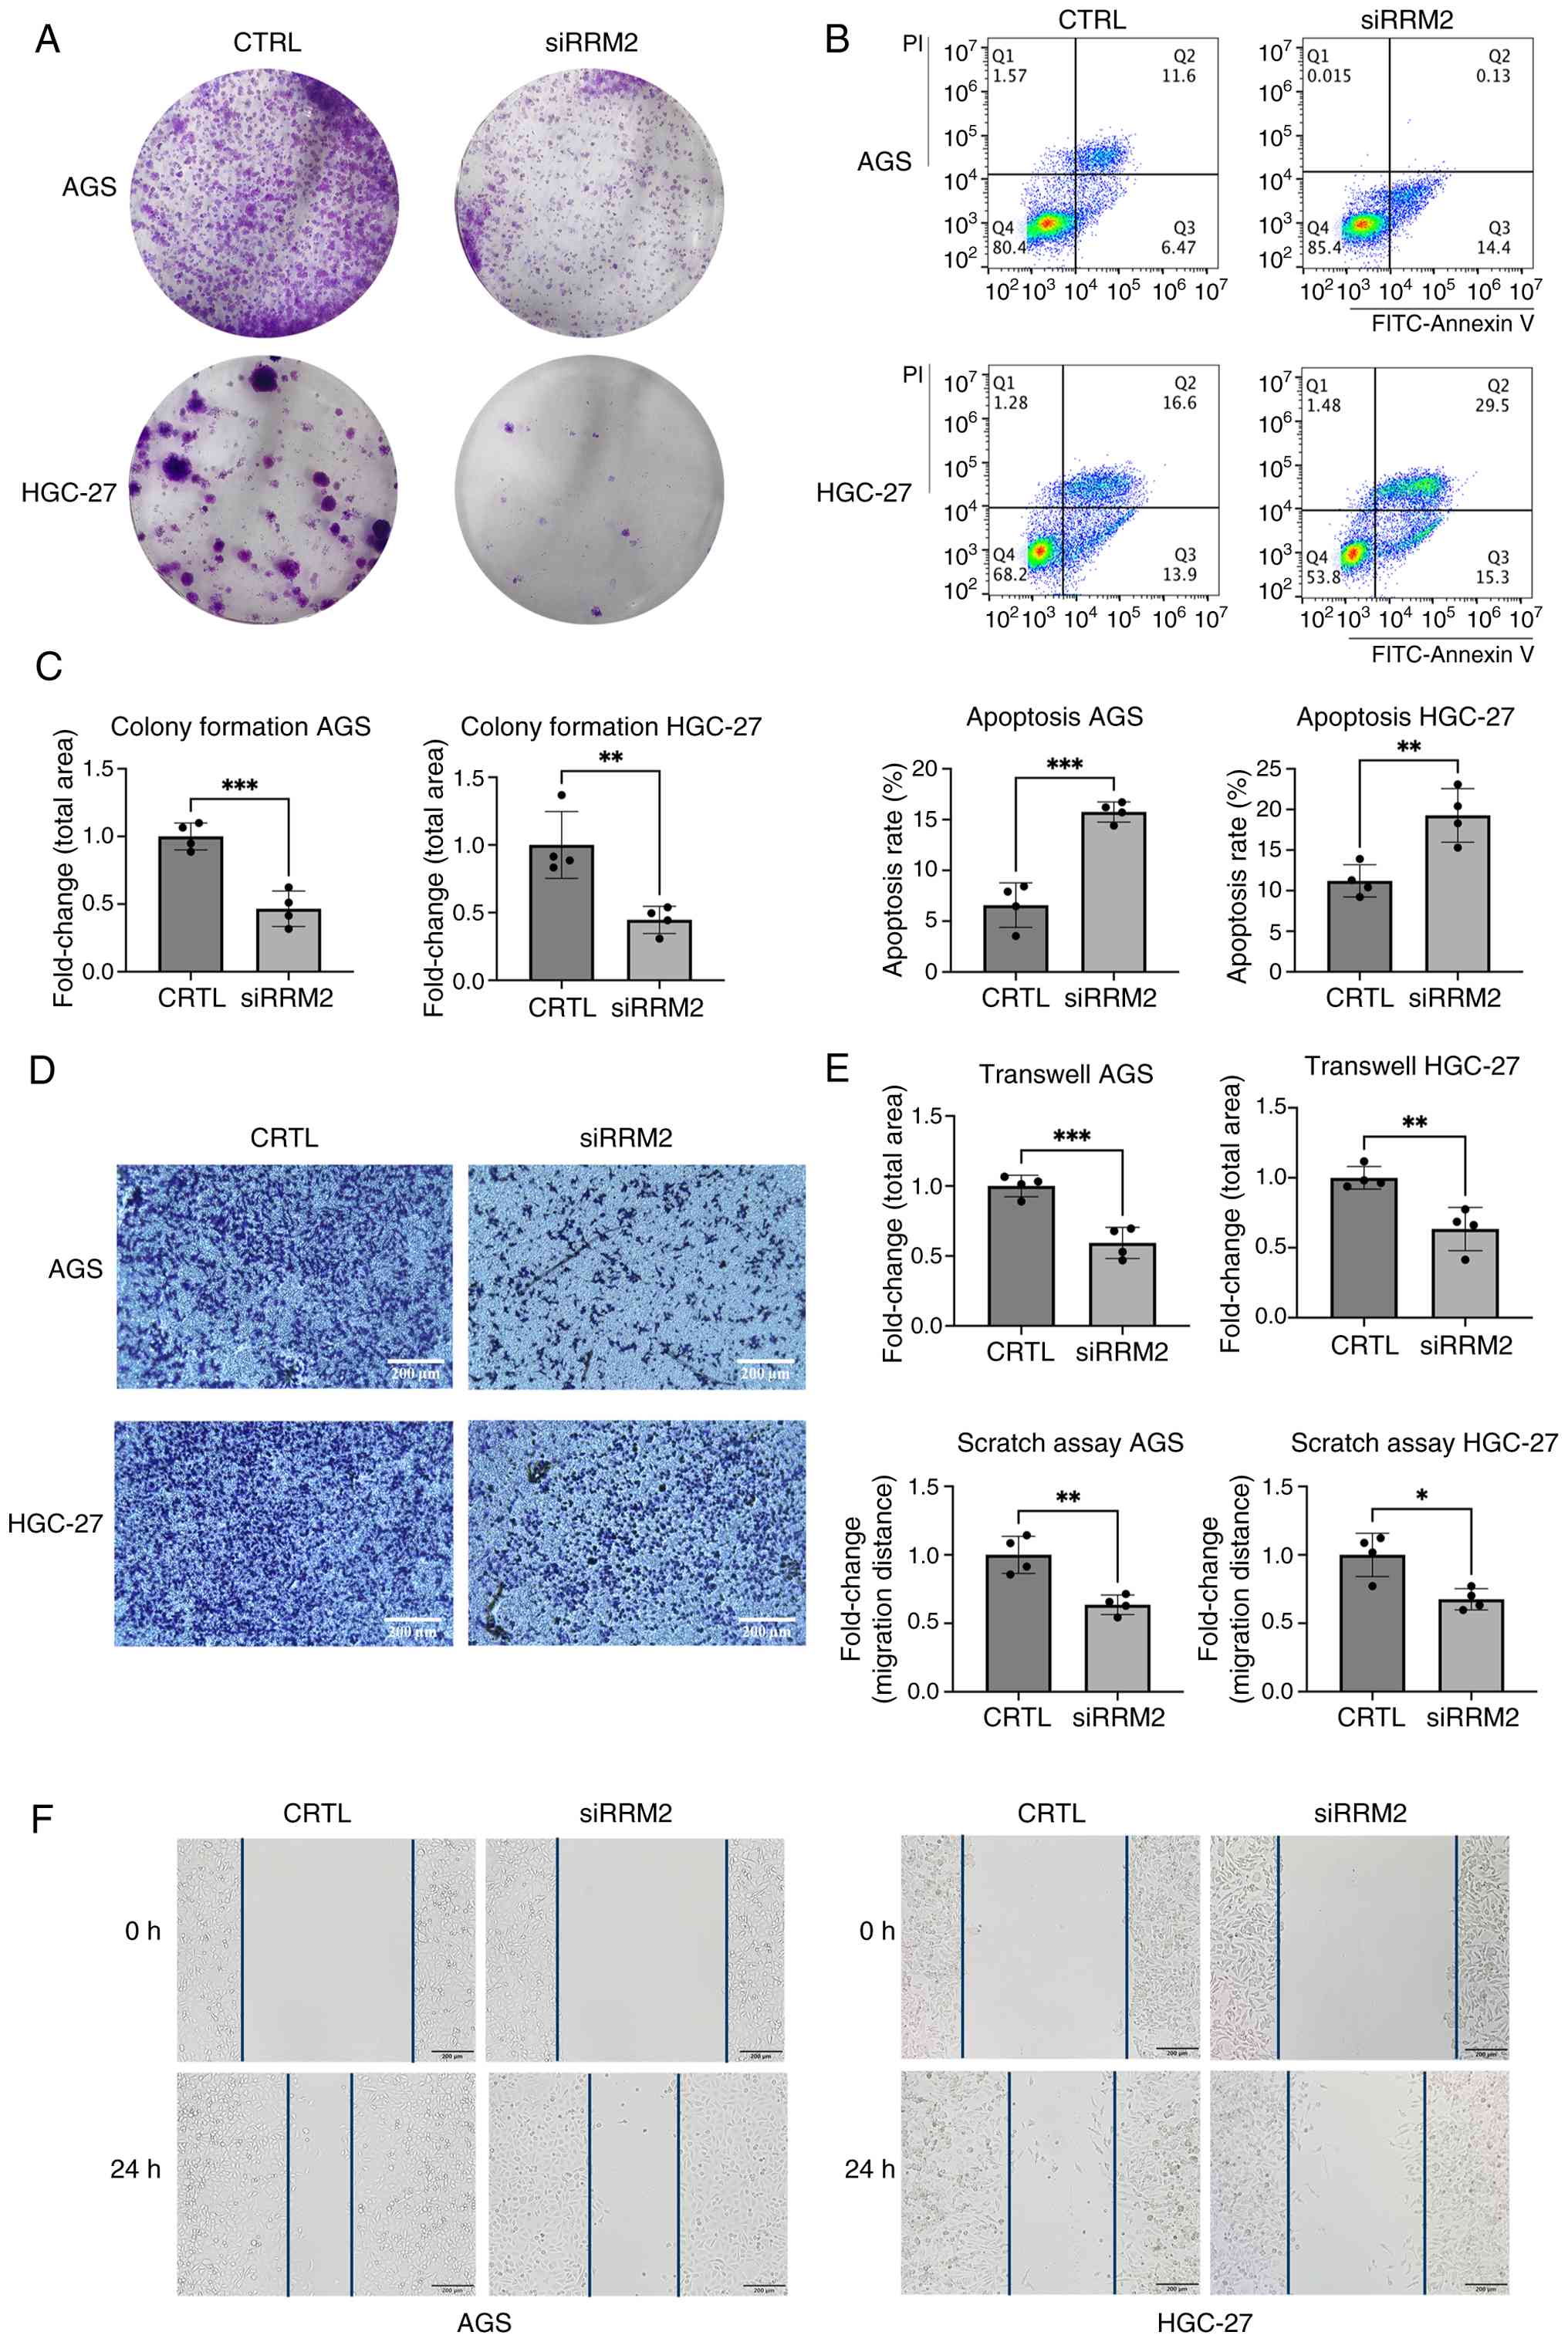
To assess the role of RRM2 in GC progression, it was
knocked down in two GC cell lines, AGS and HGC-27. Colony formation
assay showed that RRM2 knockdown significantly suppressed colony
formation in both cell lines (Fig. 5A
and C), suggesting that RRM2 contributes to GC cell
proliferation. In addition, RRM2 knockdown led to an increase in
the number of apoptotic cells (Fig. 5B
and C).
Transwell and wound healing assays showed that RRM2
knockdown reduced the number of GC cells migrating through the
Transwell membrane and impaired the wound closure ability of the
cells. These results suggest that RRM2 regulates the migratory
abilities of GC cells (Fig.
5D-F).
RRM2 induces DNA damage and impairs
DNA repair capacity in GC cells
Analysis of GC datasets from the GEO and TCGA
databases indicated a strong association between RRM2 expression
and DNA replication in GC. To validate this association, a comet
assay was performed using GC cells transfected with control siRNA
(CTRL group) or RRM2-targeting siRNA (siRRM2 group). The siRRM2
group exhibited pronounced comet tails and an increased tail DNA
content, suggesting a significantly high proportion of DNA strand
breaks (Fig. 6A). Consistently,
γH2AX expression was markedly higher in the siRRM2 group than in
the CTRL group, indicating substantial DNA damage upon RRM2
knockdown (Fig. 6B).
To examine the underlying mechanisms, the expression
levels of proteins associated with DNA damage and repair were
assessed. Western blotting revealed that RRM2 knockdown increased
the protein expression levels of the DDR markers γH2AX and p-p53
but significantly downregulated the HR repair marker RAD51.
Conversely, the expression levels of PARP-1, a key protein in
single-strand break (SSB) repair, and XRCC1, a key protein in BER,
remained unchanged. These findings suggest that RRM2 depletion
induces DNA damage and is associated with HR repair in GC cells
(Fig. 6C and D).
Discussion
Recent studies have shown that RRM2 is highly
expressed in various solid tumors and is closely associated with a
poor prognosis and chemoresistance (26,27).
Through scRNA-seq analysis of GC datasets, a subset of malignant
epithelial cells specifically enriched within GC tissues were
identified. Further analysis revealed that RRM2 played a functional
role in the dominant effector cell subpopulations of malignant
epithelial cells in GC. Numerous studies have confirmed that RRM2
acts as an oncogene in various cancers. In lung adenocarcinoma,
RRM2 was shown to be associated with enhanced tumor cell
proliferation and invasion (28).
In head and neck cancers, RRM2 was revealed to contribute to
apoptosis resistance by regulating Bcl-2. RRM2 promoted EMT in
nasopharyngeal carcinoma by suppressing E-cadherin (29). In addition, RRM2 overexpression has
been been shown to be associated with therapeutic resistance in
pancreatic cancer and glioblastoma (26,30,31).
Consistently, the present study showed that RRM2 knockdown
significantly suppressed the proliferation and migration of GC
cells while promoting apoptosis. These results suggest that RRM2
plays a crucial role in maintaining the malignant phenotype of GC
cells and acts as a key regulator of tumor cell fate during GC
progression.
In several cancer types, including breast, lung,
cervical, and prostate cancers, higher RRM2 expression is typically
associated with shorter OS and progression-free survival,
indicating its potential role as a negative prognostic indicator
(32–34). However, in the present study,
integrated analysis of three independent GC datasets (GSE66229,
GSE84433, and TCGA-STAD) revealed a contrasting trend: Patients
with GC with higher RRM2 expression exhibited improved survival
outcomes. This trend was consistent across all three datasets.
Moreover, it was found that RRM2 expression was lower in patients
with advanced GC than in those with early-stage GC. These results
contradicted the findings of in vitro experiments; however,
subsequent immune infiltration analysis provided a potential
explanation. Immune infiltration analysis revealed that patients
with GC with higher RRM2 expression exhibited a more active immune
microenvironment, characterized by increased abundances of
activated CD4 memory T cells, M0 and M1 macrophages, and resting NK
cells and upregulated expression of immune checkpoint genes such as
LAG3, PDCD1, and CTLA4. TIMER database prediction showed that
patients with high RRM2 expression expressed higher levels of
CD8+ T cells, CD8+ naive T cells, CTL and
cytotoxic cells. Additionally, GC cells with low RRM2 expression
exhibited high TIDE scores, suggesting a reduced likelihood of
patient response to immune checkpoint inhibitor therapy. These
findings suggest that tumors with high RRM2 expression exhibit
greater immunogenicity and can be more readily recognized and
targeted by the host immune system. Consistently, previous studies
have reported that patients with high RRM2 expression often have
high immune scores and are more likely to respond favorably to
immunotherapy (19,35,36).
Multi-cancer pan-analysis demonstrated that high expression of RRM2
was positively correlated with immune checkpoint genes (including
PD-1, PD-L1, CTLA4), tumor mutational burden, and T-cell
inflammatory signatures, suggesting its potential as a biomarker
for a more immunogenic tumor subtype (37). Research has revealed that RRM2 can
upregulate PD-L1 expression via the ANXA1/AKT or ERK pathways,
thereby influencing immune evasion and sensitivity to
immunotherapy. However, contradictory findings in different cancer
types indicate that high RRM2 expression is correlated with reduced
CD8+T-cell infiltration and poorer prognosis,
highlighting its tissue- and context-dependent immunological
implications (38). Based on these
findings, it is surmised that high RRM2 expression in malignant
gastric epithelial cells promotes tumor cell proliferation while
enhancing antitumor immune responses, consequently contributing to
improved survival outcomes in patients with GC. This paradoxical
role highlights the potential of RRM2 not only as a driver of
tumorigenesis but also as a biomarker for predicting immunotherapy
response, offering valuable insights for the development of
personalized therapeutic strategies for GC.
RRM2 is a crucial rate-limiting enzyme subunit in
DNA synthesis and repair (39). Its
downregulation has been shown to significantly suppress the
proliferative and invasive abilities of GC cell lines such as
MKN-1, MKN-7, and SNU-719 (40).
Moreover, it was also revealed that high RRM2 expression is closely
associated with advanced TNM stages in patients with GC. RRM2
expression has been shown to be markedly upregulated during the S
phase of the cell cycle to meet the increased demand for dNTPs
during DNA replication (41,42).
In the present study, RRM2 knockdown led to the accumulation of DNA
DSBs in GC cells, as evidenced by elevated γH2AX expression and
pronounced comet tails. These changes were accompanied by a
significant reduction in the expression of RAD51, a key component
in the HR repair pathway. Conversely, the expression levels of
PARP-1, which is involved in SSB, and XRCC1, which is involved in
BER repair, remained unchanged. These findings suggest that RRM2 is
involved in maintaining genomic stability in GC cells. The observed
downregulation of RAD51 and accumulation of γH2AX are consistent
with impaired HR repair; however, direct functional assays are
warranted to confirm HR deficiency. Although the unchanged PARP-1
and XRCC1 expression levels suggest that BER and SSB repair
pathways were not markedly affected by RRM2 knockdown, potential
defects cannot be excluded in other repair pathways, such as
non-homologous end joining, mismatch repair, and replication fork
stabilization. Similar associations between RRM2 expression and DNA
repair fidelity have been reported in atypical teratoid rhabdoid
tumors. After treatment with the inhibitor of RRM2, the DNA repair
signaling signatures were downregulated in atypical teratoid
rhabdoid tumor cells, and DNA breaks were induced in the cells.
Notably, the HR repair pathway experienced a more pronounced
suppression (43). Based on these
observations, it was surmised that patients with GC with high RRM2
expression exhibit more efficient DNA repair, which can contribute
to improved genomic stability and partially explain the superior
survival outcomes observed in these patients.
Compared with previous research (41), the present study redefined the
driver population of GC by focusing on malignant epithelial cells,
thereby establishing a biologically grounded framework for
understanding tumor progression. Through the integration of
single-cell transcriptomic data and large clinical cohorts
(TCGA/GEO), it was revealed that although RRM2 expression is
elevated in GC, its high expression unexpectedly predicts favorable
prognosis. Functional assays, including alkaline comet and γH2AX
staining, further demonstrated that RRM2 modulates DNA damage
accumulation and HR repair, and its expression is associated with
an active immune microenvironment. These findings collectively
provide novel perspectives that differ fundamentally from prior
research (44). However, the
present study has several limitations. Multivariate Cox regression
could not be performed because only limited clinical variables
(sex, age, and TNM stage) were available, while key factors such as
differentiation grade, treatment, and molecular subtype were
missing. This limitation may reduce the ability of the model to
account for confounding effects. Although the present study
indicates that RRM2 is transcriptionally upregulated in GC,
protein-level validation was not performed owing to the limited
availability of matched proteomic data. Future studies
incorporating proteomic analysis are warranted to confirm the
regulatory functions of RRM2 in GC. Moreover, concurrent mRNA-level
validation of RAD51 downregulation should be prioritized in future
studies. This would not only corroborate the observed protein-level
changes but also clarify whether RAD51 suppression occurs through
transcriptional repression or post-translational mechanisms such as
ubiquitin-mediated degradation. Elevated γH2AX signals DNA damage
accumulation, but cannot differentiate its source, such as
replication stress, nucleotide depletion, or oxidative stress.
Therefore, additional studies are needed to pinpoint the exact
cause after RRM2 knockdown. The lack of in vivo models
limits the ability to fully validate the role of RRM2 in tumor
progression within the complex tumor immune microenvironment of GC.
Moreover, the mechanistic relationship between RRM2 expression and
improved prognosis remains speculative, as direct functional
evidence, particularly concerning immune activation and
immunotherapy response, remains lacking. In addition, the findings
require validation in larger, multi-center clinical cohorts to
ensure their generalizability. To address these gaps, future
studies should focus on generating RRM2 gene-edited GC mouse models
to investigate the effects of RRM2 on tumor growth, metastasis, and
immune modulation in vivo. Incorporating functional HR
experiments, such as DR-GFP assay or sensitivity analysis of PARP
inhibitors, should be the focus of follow-up studies. The DR-GFP
reporter assay directly measures HR repair efficiency post-DNA
double-strand break induction (45), assessing whether RRM2 knockdown
compromises HR-mediated DNA repair. HR-deficient cells accumulate
unrepaired DNA damage, becoming hypersensitive to PARP inhibition
(46). The present study evaluated
whether RRM2 depletion enhances cellular sensitivity to PARP
inhibitors. Prospective clinical studies with larger sample sizes
are planeed to elucidate the clinical relevance of RRM2 in
personalized treatment strategies for GC. In conclusion, through
integrated multi-omic analysis, the present study elucidated the
expression profile and functional role of RRM2 in GC, highlighting
its potential as a key driver of malignant progression and a
promising target for immunotherapy in GC. Future studies
incorporating animal models and clinical specimens are warranted to
promote the clinical application of RRM2 in the early detection and
precise treatment of GC.
Supplementary Material
Supporting Data
Supporting Data
Acknowledgements
Not applicable.
Funding
Funding: No funding was received.
Availability of data and materials
The data generated in the present study may be
requested from the corresponding author.
Authors' contributions
YH, DZ and MW conceived the present study. XC and MW
performed the methodology, formal analysis, investigation, and
visualization. XC wrote and prepared the original draft. YH and TM
wrote reviewed and edited the manuscript. TM performed the data
analysis and interpretation. XC and TM confirm the authenticity of
all the raw data. All authors read and approved the final
manuscript.
Ethics approval and consent to
participate
Not applicable.
Patient consent for publication
Not applicable.
Competing interests
The authors declare that they have no competing
interests.
Use of artificial intelligence tools
During the preparation of this work, artificial
intelligence tools were used to improve the readability and
language of the manuscript or to generate images, and subsequently,
the authors revised and edited the content produced by the
artificial intelligence tools as necessary, taking full
responsibility for the ultimate content of the present
manuscript.
Glossary
Abbreviations
Abbreviations:
|
GC
|
gastric cancer
|
|
dNTP
|
deoxynucleotide triphosphate
|
|
RRM2
|
ribonucleotide reductase regulatory
subunit M2
|
|
WGCNA
|
weighted gene co-expression network
analysis
|
|
DDR
|
DNA damage response
|
|
OS
|
overall survival
|
|
DSB
|
DNA double-strand breaks
|
|
HR
|
homologous recombination
|
|
BER
|
base excision repair
|
|
SSB
|
single-strand break
|
|
CNV
|
copy number variations
|
|
GSEA
|
gene set enrichment analysis
|
|
p-p53
|
phosphorylated tumor protein p53
|
References
|
1
|
Sundar R, Nakayama I, Markar SR, Shitara
K, van Laarhoven HWM, Janjigian YY and Smyth EC: Gastric cancer.
Lancet. 405:2087–2102. 2025. View Article : Google Scholar : PubMed/NCBI
|
|
2
|
Yang X, Zhang J, Ma J, Huang J, Wang Y,
Wang P, Wang F and Tang X: GPER governs the immune infiltration of
gastric cancer and activates the NF-κB/ROS/Apoptosis pathway in
gastric mucosal epithelium. Int Immunopharmacol. 122:1106412023.
View Article : Google Scholar : PubMed/NCBI
|
|
3
|
Bray F, Laversanne M, Sung H, Ferlay J,
Siegel RL, Soerjomataram I and Jemal A: Global cancer statistics
2022: GLOBOCAN estimates of incidence and mortality worldwide for
36 cancers in 185 countries. CA Cancer J Clin. 74:229–263.
2024.PubMed/NCBI
|
|
4
|
Lordick F, Carneiro F, Cascinu S, Fleitas
T, Haustermans K, Piessen G, Vogel A and Smyth EC; ESMO Guidelines
Committee. Electronic address, : simpleclinicalguidelines@esmo.org:
Gastric cancer: ESMO clinical practice guideline for diagnosis,
treatment and follow-up. Ann Oncol. 33:1005–1020. 2022. View Article : Google Scholar : PubMed/NCBI
|
|
5
|
Zhao L, Huang H, Zhang C, Luan X, Niu P,
Zhu Y, Xiong Y, Wang W, Han X, Huang D, et al: Temporospatial
variation in environmental risk factors and related gastric cancer
incidence: A registry-based study in an area with the largest
gastric cancer burden in China. J Glob Health. 15:040832025.
View Article : Google Scholar : PubMed/NCBI
|
|
6
|
Zhou L, Han B, Yuan Y, Dong Z, Shi Y and
Zheng R: The global burden of stomach cancer and its risk factors
from 1990 to 2021: Findings from the global burden of disease study
2021. BMC Public Health. 25:26782025. View Article : Google Scholar : PubMed/NCBI
|
|
7
|
Petrillo A and Smyth EC: Biomarkers for
precision treatment in gastric cancer. Visc Med. 36:364–372. 2020.
View Article : Google Scholar : PubMed/NCBI
|
|
8
|
Gao YX, Guo XJ, Lin B, Huang XB, Tu RH,
Lin M, Cao LL, Chen QY, Wang JB, Xie JW, et al: Targeting LHPP in
neoadjuvant chemotherapy resistance of gastric cancer: Insights
from single-cell and multi-omics data on tumor immune
microenvironment and stemness characteristics. Cell Death Dis.
16:3062025. View Article : Google Scholar : PubMed/NCBI
|
|
9
|
Zhou J, Li J, Chen J, Lan X, Ai Y, Liu P,
Peng J, Pan X, Zhang Y, Zhang H, et al: Decoding inflammatory
mediators in the Correa's cascade: From chronic gastritis to
carcinogenesis and targeted therapies. Int Immunopharmacol.
162:1151912025. View Article : Google Scholar : PubMed/NCBI
|
|
10
|
Shi Y, Jia E, Wu X and Wang F:
Upregulation of MFAP5 enhances COL1A1 expression, promoting
epithelial-mesenchymal transition in gastric cancer cells. Discov
Med. 36:2079–2087. 2024. View Article : Google Scholar : PubMed/NCBI
|
|
11
|
Coorens THH, Collord G, Jung H, Wang Y,
Moore L, Hooks Y, Mahbubani K, Law SYK, Yan HHN, Yuen ST, et al:
The somatic mutation landscape of normal gastric epithelium.
Nature. 640:418–426. 2025. View Article : Google Scholar : PubMed/NCBI
|
|
12
|
Liu B, Liu H, Ren F, Liu H, Bukhari I, Fu
Y, Wu W, Zhao M, Zhu S, Mo H, et al: cGAS regulates the DNA damage
response to maintain proliferative signaling in gastric cancer
cells. Oncol Res. 29:87–103. 2021. View Article : Google Scholar : PubMed/NCBI
|
|
13
|
Hu H, Yang H, Fan S, Jia X, Zhao Y and Li
H: LncRNA HOTAIR promotes DNA damage repair and radioresistance by
targeting ATR in colorectal cancer. Oncol Res. 32:1335–1346. 2024.
View Article : Google Scholar : PubMed/NCBI
|
|
14
|
Kaiser L, Ondrus M, Slavetinska LP,
Raindlova V and Hocek M: Polymerase synthesis of hypermodified DNA
displaying a combination of thiol, hydroxyl, carboxylate, and
imidazole functional groups in the major groove. Chemistry.
31:e2025010342025. View Article : Google Scholar : PubMed/NCBI
|
|
15
|
Garzon J, Rodriguez R, Kong Z, Chabes A,
Rodriguez-Acebes S, Mendez J, Moreno S and García-Higuera I:
Shortage of dNTPs underlies altered replication dynamics and DNA
breakage in the absence of the APC/C cofactor Cdh1. Oncogene.
36:5808–5818. 2017. View Article : Google Scholar : PubMed/NCBI
|
|
16
|
Long MJC, Van Hall-Beauvais A and Aye Y:
The more the merrier: How homo-oligomerization alters the
interactome and function of ribonucleotide reductase. Curr Opin
Chem Biol. 54:10–18. 2020. View Article : Google Scholar : PubMed/NCBI
|
|
17
|
Guo L, Zhao Y, Bai X, Wang X, Tuoheti K,
Cao Y, Zuo Y, Zhang X and Liu T: RRM2 is a putative biomarker and
promotes bladder cancer progression via PI3K/AKT/mTOR pathway. J
Cell Physiol. 240:e315012025. View Article : Google Scholar : PubMed/NCBI
|
|
18
|
Liu K, Wang L, Lou Z, Guo L, Xu Y, Qi H,
Fang Z, Mei L, Chen X, Zhang X, et al: E2F8 exerts cancer-promoting
effects by transcriptionally activating RRM2 and E2F8 knockdown
synergizes with WEE1 inhibition in suppressing lung adenocarcinoma.
Biochem Pharmacol. 218:1158542023. View Article : Google Scholar : PubMed/NCBI
|
|
19
|
Mao G, Li L, Shan C, Liang B, Ma L and
Zhang S: High expression of RRM2 mediated by non-coding RNAs
correlates with poor prognosis and tumor immune infiltration of
hepatocellular carcinoma. Front Med (Lausanne). 9:8333012022.
View Article : Google Scholar : PubMed/NCBI
|
|
20
|
Shi SC, Zhang Y and Wang T: High RRM2
expression has poor prognosis in specific types of breast cancer.
PLoS One. 17:e02651952022. View Article : Google Scholar : PubMed/NCBI
|
|
21
|
Abdel-Rahman MA, Mahfouz M and Habashy HO:
RRM2 expression in different molecular subtypes of breast cancer
and its prognostic significance. Diagn Pathol. 17:12022. View Article : Google Scholar : PubMed/NCBI
|
|
22
|
Oh SC, Sohn BH, Cheong JH, Kim SB, Lee JE,
Park KC, Lee SH, Park JL, Park YY, Lee HS, et al: Clinical and
genomic landscape of gastric cancer with a mesenchymal phenotype.
Nat Commun. 9:17772018. View Article : Google Scholar : PubMed/NCBI
|
|
23
|
Cheong JH, Yang HK, Kim H, Kim WH, Kim YW,
Kook MC, Park YK, Kim HH, Lee HS, Lee KH, et al: Predictive test
for chemotherapy response in resectable gastric cancer: A
multi-cohort, retrospective analysis. Lancet Oncol. 19:629–638.
2018. View Article : Google Scholar : PubMed/NCBI
|
|
24
|
Jiang H, Yu D, Yang P, Guo R, Kong M, Gao
Y, Yu X, Lu X and Fan X: Revealing the transcriptional
heterogeneity of organ-specific metastasis in human gastric cancer
using single-cell RNA Sequencing. Clin Transl Med. 12:e7302022.
View Article : Google Scholar : PubMed/NCBI
|
|
25
|
Liang CC, Park AY and Guan JL: In vitro
scratch assay: A convenient and inexpensive method for analysis of
cell migration in vitro. Nat Protoc. 2:329–333. 2007. View Article : Google Scholar : PubMed/NCBI
|
|
26
|
Zhan Y, Jiang L, Jin X, Ying S, Wu Z, Wang
L, Yu W, Tong J, Zhang L, Lou Y and Qiu Y: Inhibiting RRM2 to
enhance the anticancer activity of chemotherapy. Biomed
Pharmacother. 133:1109962021. View Article : Google Scholar : PubMed/NCBI
|
|
27
|
Zuo Z, Zhou Z, Chang Y, Liu Y, Shen Y, Li
Q and Zhang L: Ribonucleotide reductase M2 (RRM2): Regulation,
function and targeting strategy in human cancer. Genes Dis.
11:218–233. 2024. View Article : Google Scholar : PubMed/NCBI
|
|
28
|
Wang XJ, Huo YX, Yang PJ, Gao J and Hu WD:
Significance of ribonucleoside-diphosphate reductase subunit M2 in
lung adenocarcinoma. Curr Gene Ther. 25:136–156. 2025. View Article : Google Scholar : PubMed/NCBI
|
|
29
|
Han P, Chen RH, Wang F, Zeng JY, Yu ST, Xu
LH, Cai Q, Liang FY, Xia TL, Lin ZR, et al: Novel chimeric
transcript RRM2-c2orf48 promotes metastasis in nasopharyngeal
carcinoma. Cell Death Dis. 8:e30472017. View Article : Google Scholar : PubMed/NCBI
|
|
30
|
Liu Q, Song C, Li J, Liu M, Fu L, Jiang J,
Zeng Z and Zhu H: E2F2 enhances the chemoresistance of pancreatic
cancer to gemcitabine by regulating the cell cycle and upregulating
the expression of RRM2. Med Oncol. 39:1242022. View Article : Google Scholar : PubMed/NCBI
|
|
31
|
Perrault EN, Shireman JM, Ali ES, Lin P,
Preddy I, Park C, Budhiraja S, Baisiwala S, Dixit K, James CD, et
al: Ribonucleotide reductase regulatory subunit M2 drives
glioblastoma TMZ resistance through modulation of dNTP production.
Sci Adv. 9:eade72362023. View Article : Google Scholar : PubMed/NCBI
|
|
32
|
Ma C, Luo H, Cao J, Gao C, Fa X and Wang
G: Independent prognostic implications of RRM2 in lung
adenocarcinoma. J Cancer. 11:7009–7022. 2020. View Article : Google Scholar : PubMed/NCBI
|
|
33
|
Wang J, Yi Y, Chen Y, Xiong Y and Zhang W:
Potential mechanism of RRM2 for promoting cervical cancer based on
weighted gene co-expression network analysis. Int J Med Sci.
17:2362–2372. 2020. View Article : Google Scholar : PubMed/NCBI
|
|
34
|
Cheng B, Li L, Wu Y, Luo T, Tang C, Wang
Q, Zhou Q, Wu J, Lai Y, Zhu D, et al: The key cellular senescence
related molecule RRM2 regulates prostate cancer progression and
resistance to docetaxel treatment. Cell Biosci. 13:2112023.
View Article : Google Scholar : PubMed/NCBI
|
|
35
|
Zhou Z, Song Q, Yang Y, Wang L and Wu Z:
Comprehensive landscape of RRM2 with immune infiltration in
pan-cancer. Cancers (Basel). 14:29382022. View Article : Google Scholar : PubMed/NCBI
|
|
36
|
Lee SK, Hwang Y, Han JH, Haam S, Lee HW
and Koh YW: Characteristics of the immune microenvironment
associated with RRM2 expression and its application to PD-L1/PD-1
inhibitors in lung adenocarcinoma. Am J Cancer Res. 13:5443–5454.
2023.PubMed/NCBI
|
|
37
|
Wu L, Yin L, Ma L, Yang J, Yang F, Sun B
and Nianzeng X: Comprehensive bioinformatics analysis of
ribonucleoside diphosphate reductase subunit M2(RRM2) gene
correlates with prognosis and tumor immunotherapy in pan-cancer.
Aging (Albany NY). 14:7890–7905. 2022. View Article : Google Scholar : PubMed/NCBI
|
|
38
|
Wang Y, Chen R, Zhang J and Zeng P: A
comprehensive analysis of ribonucleotide reductase subunit M2 for
carcinogenesis in pan-cancer. PLoS One. 19:e02999492024. View Article : Google Scholar : PubMed/NCBI
|
|
39
|
Tan J, Wang W, Liu X, Xu J, Che Y, Liu Y,
Hu J, Hu L, Li J and Zhou Q: C11orf54 promotes DNA repair via
blocking CMA-mediated degradation of HIF1A. Commun Biol. 6:6062023.
View Article : Google Scholar : PubMed/NCBI
|
|
40
|
Morikawa T, Hino R, Uozaki H, Maeda D,
Ushiku T, Shinozaki A, Sakatani T and Fukayama M: Expression of
ribonucleotide reductase M2 subunit in gastric cancer and effects
of RRM2 inhibition in vitro. Hum Pathol. 41:1742–1748. 2010.
View Article : Google Scholar : PubMed/NCBI
|
|
41
|
Ping S, Jia X and Tian Y: Integration of
scRNA-seq and ST-seq identifies hyperproliferative RRM2+ cells
features and therapeutic targets in gastric cancer. J Transl Med.
23:7952025. View Article : Google Scholar : PubMed/NCBI
|
|
42
|
Sun X, Duan K, Shen X, Dong C, Zhou Y,
Chen T, Li W, Li P, Wang P, Li D and Zhou J: Construction and
validation of a nomogram model for predicting peritoneal metastasis
in gastric cancer based on ferroptosis-relate genes and
clinicopathological features. J Gastrointest Oncol. 16:264–280.
2025. View Article : Google Scholar : PubMed/NCBI
|
|
43
|
Giang LH, Wu KS, Lee WC, Chu SS, Do AD,
Huang MH, Lin YL, Hsieh CL, Sung SY, Yen Y, et al: RRM2 inhibition
alters cell cycle through ATM/Rb/E2F1 pathway in atypical teratoid
rhabdoid tumor. Neoplasia. 58:1010752024. View Article : Google Scholar : PubMed/NCBI
|
|
44
|
Luo XJ, Lu YX, Wang Y, Huang R, Liu J, Jin
Y, Liu ZK, Liu ZX, Huang QT, Pu HY, et al: M6A-modified lncRNA
FAM83H-AS1 promotes colorectal cancer progression through PTBP1.
Cancer Lett. 598:2170852024. View Article : Google Scholar : PubMed/NCBI
|
|
45
|
Vriend LE, Jasin M and Krawczyk PM:
Assaying break and nick-induced homologous recombination in
mammalian cells using the DR-GFP reporter and Cas9 nucleases.
Methods Enzymol. 546:175–191. 2014. View Article : Google Scholar : PubMed/NCBI
|
|
46
|
Zhang N, Tian YN, Zhou LN, Li MZ, Chen HD,
Song SS, Huan XJ, Bao XB, Zhang A, Miao ZH and He JX: Glycogen
synthase kinase 3beta inhibition synergizes with PARP inhibitors
through the induction of homologous recombination deficiency in
colorectal cancer. Cell Death Dis. 12:1832021. View Article : Google Scholar : PubMed/NCBI
|