Introduction
Lung cancer is the most commonly diagnosed
malignancy worldwide and the leading cause of cancer-related death,
accounting for ~2.6 million new cases and ~1.9 million deaths,
representing 12.8% of all new cancer cases and 19.1% of all cancer
deaths globally in 2024 (1).
Globally, non-small cell lung cancer (NSCLC) accounts for >85%
of lung cancer cases, with lung squamous cell carcinoma (LUSC)
representing the second most common subtype, accounting for 30% of
NSCLC cases (2,3). Despite notable advancements in
diagnostic techniques and therapeutic approaches for LUSC, patient
prognoses continue to be unfavorable, due to the lack of identified
driver targets and efficient targeted treatments (4). Furthermore, multiple cases are
identified at advanced stages, and the restricted availability of
systemic therapy alternatives exacerbates elevated mortality rates.
Therefore, the identification and validation of novel key genes in
LUSC are key to enhancing early diagnosis and long-term prognosis
(5,6).
Mitochondria, which are organelles present in
eukaryotic cells, produce adenosine triphosphate by oxidative
phosphorylation, serving a key role in energy generation (7). Mitochondria are key to numerous
biological processes, including redox equilibrium, calcium
homeostasis, metabolism and apoptosis (8,9). The
effective operation of these systems is maintained by various
stress response mechanisms, including alterations in mitochondrial
dynamics (10), selective autophagy
(11) and the mitochondrial
unfolded protein response (UPRmt) (12). UPRmt denotes the
transcriptional response initiated by the regulation of nuclear
gene expression in the context of mitochondrial dysfunction, with
the objective of restoring mitochondrial function and network
integrity to facilitate cellular survival and adaptation (13). This reaction inhibits the buildup of
misfolded proteins in mitochondria by facilitating proper protein
folding and destruction, hence preserving cellular protein
homeostasis (14). Previous studies
have indicated that the UPRmt is associated with
multiple diseases, including cancer and neurological disorders
(15,16). Bueno and Rojas (17) identified that in idiopathic
pulmonary fibrosis, the compromised clearance of mitochondrial and
endoplasmic reticulum stress by alveolar type II epithelial cells
resulted in the simultaneous activation of both UPRmt
and endoplasmic reticulum UPR, subsequently triggering apoptosis,
fibrosis and inflammation. Furthermore, Jiang et al
(18) revealed that activating
transcription factor 4 intensifies UPRmt in the lungs,
increasing pulmonary inflammation. These findings underscored the
pivotal function of the UPRmt in the genesis and
progression of pulmonary illnesses. The aim of the present study
was to identify key genes associated with the UPRmt in
LUSC to potentially identify novel therapeutic targets for LUSC
treatment in the future.
The present study employed bioinformatics techniques
to identify key genes associated with the UPRmt in LUSC
using public datasets. Functional enrichment analysis was performed
on these genes to investigate their potential biological functions.
The LUSC samples were subsequently categorized into high- and
low-expression groups according to key gene expression levels.
Analyses of the immunological microenvironment and mutations were
conducted to compare the disparities between these two groups. Cell
lines with knockdown (KD) or overexpression (OE) of the key genes
were constructed. Proliferation, migration and invasion experiments
were performed to assess the functions of key genes in LUSC and
their impact on key pathways were subsequently examined using
western blotting (WB). These analyses were performed to obtain
theoretical insights for the identification of novel treatment
targets for patients with LUSC.
Materials and methods
Data sources
A total of 496 LUSC (486 with survival information)
and 51 control samples in The Cancer Genome Atlas (TCGA)-LUSC
dataset (training set) were obtained from the University of
California, Santa Cruz Xena Browser (https://xena.ucsc.edu/; dataset/project search terms:
‘TCGA-LUSC’ or ‘Lung Squamous Cell Carcinoma’; Genomic Data Commons
project ID: TCGA-LUSC). The validation sets, including GSE19188,
GSE157010, GSE37745, GSE50081 and GSE29013 were all downloaded from
the Gene Expression Omnibus (GEO) database (http://www.ncbi.nlm.nih.gov/geo/) and sequenced using
the GPL570 platform ([HG-U133_Plus_2] Affymetrix Human Genome U133
Plus 2.0 Array; version 2.0; Affymetrix, Inc.; http://www.ncbi.nlm.nih.gov/geo/query/acc.cgi?acc=GPL570).
The GSE19188 dataset, including the 27 LUSC and 65 control samples
(19), the GSE157010 dataset with
235 LUSC samples (20), the
GSE37745 dataset with 66 LUSC samples (21), the GSE50081 dataset with 42 LUSC
samples (22) and the GSE29013 with
25 LUSC samples (23). Furthermore,
35 UPRmt-related genes (UPRmt−RGs) were
acquired from the published literature (Table SI) (24).
Identification of key genes in LUSC
samples
Expression levels of UPRmt-RGs were
compared between LUSC and control samples, with the results
visualized via boxplot generated by ‘ggplot2’ package (version
3.3.6) (25). Differentially
expressed UPRmt-RGs (DE-UPRmt-RGs) were
obtained based on P<0.05. To identify genes associated with LUSC
survival, univariate Cox regression analysis was conducted using
‘survival’ package (version 3.4–0) (https://cran.r-project.org/package=survival),
selecting genes with hazard ratio (HR)≠1 and P<0.05. For data
integration and normalization in four validation sets (excluding
GSE19188), the ‘sva’ package (26)
was utilized, resulting in 368 LUSC samples for survival analysis.
Using ‘surv_cutpoint’ function in the ‘survminer’ package (version
0.4.9) (https://cran.r-project.org/package=survminer), the
optimal gene-specific expression cut-off value was determined using
maximally selected rank statistics, with minprop set to 0.3 to
ensure that each resulting expression group contained at least 30%
of the total samples. Based on the gene-specific cut-off values,
LUSC samples in both training and merged validation sets were
categorized into high- and low-expression groups. Survival
differences across two groups were assessed using log-rank test
(P<0.05) and HR was calculated. Genes exhibiting consistent HR
direction and significant differences were designated as candidate
key genes for subsequent analysis. In conjunction with a review of
the existing literature (6,27), genes with strong associations to
LUSC were ultimately identified as key genes.
Differential expression and enrichment
analysis between different expression groups of key genes
To identify differentially expressed genes (DEGs)
across different key gene expression groups, the ‘limma’ package
(version 3.52.4) (28) was used,
setting the criteria as |log2 fold change| >0.5 and
adjusted P<0.05. Subsequently, a volcano plot depicting these
DEGs was generated using the ‘ggplot2’ package. In order to further
explore molecular functions and underlying mechanisms associated
with these DEGs, Gene Ontology (GO) and Kyoto Encyclopedia of Genes
and Genomes (KEGG) enrichment analyses were carried out using the
‘clusterProfiler’ package (version 4.7.1.001) (29), with a significance threshold set at
adjusted P<0.05.
Gene set enrichment analysis (GSEA)
and gene set variation analysis (GSVA)
To identify key gene functions in LUSC, GSEA was
conducted through the ‘clusterProfiler’ package. The correlation
between key genes and all genes was evaluated using Spearman's rank
correlation analysis. GSEA was performed using normalized
enrichment score |(NES)|>1 and P<0.05. Furthermore, to
identify the divergent pathways associated with distinct expression
groups of key genes, GSVA was implemented to identify enriched
pathways. Differential expression analysis was then conducted using
the ‘limma’ package to identify differentially expressed pathways
between different expression groups, using the criteria |t| >2
and P<0.05. Background gene set for both GSEA and GSVA was
‘c2.cp.kegg.v2023.2.Hs.symbols.gmt’, which was obtained from
Molecular Signatures Database (https://www.gsea-msigdb.org/).
Evaluation of immune
microenvironment
To investigate the immune landscape of LUSC samples,
the quantity of immune cell infiltration in both expression groups
was evaluated using the ‘CIBERSORT’ package (version 1.03)
(30). The differences in immune
cell composition across these groups were assessed using the
Wilcoxon rank-sum test, with P<0.05. Furthermore, the tumor
immune dysfunction and exclusion (TIDE) score was calculated using
the TIDE website (http://tide.dfci.harvard.edu/) (31) and differences in TIDE score between
two expression groups of key genes were compared using the Wilcoxon
rank-sum test (P<0.05). The correlation between key gene
expression and TIDE score was evaluated using Spearman's rank
correlation analysis. Furthermore, to analyze the differences in
immune, stromal and Estimation of STromal and Immune cells in
MAlignant Tumors using Expression data (ESTIMATE) scores between
two expression groups, ‘estimate’ package (version 1.0.13)
(https://r-forge.r-project.org/projects/estimate/)
was used to calculate the corresponding scores. The Wilcoxon
rank-sum test was used to compare these scores between the groups
(P<0.05). The ‘ImmuneSubtypeClassifier’ package (version 0.1.0)
(https://github.com/CRI-iAtlas/ImmuneSubtypeClassifier)
(32) was used to divide LUSC
samples into different immune subtypes. The expression levels of
key genes in these subtypes were further explored using the
Wilcoxon rank-sum test (P<0.05).
Mutation analysis
To investigate the mutation profiles across groups
with varying expression levels of key genes, ‘maftools’ package
(version 2.12.0) (33) was used. A
waterfall plot was generated to highlight the top 20 most
frequently mutated genes.
Drug sensitivity analysis
The ‘oncoPredict’ package (version 0.2) (34) was used to determine the
IC50 of 198 chemotherapeutic/targeted therapy drugs. The
IC50 value for these drugs was compared between groups
with diverse expression levels of key genes using the Wilcoxon
rank-sum test (P<0.05).
Cell culture, lentiviral vector
construction and transfection
Human LUSC cells (NCI-H520 and SK-MES-1) were
cultured in a medium consisting of 90% RPMI-1640, 10% FBS (Gibco;
Thermo Fisher Scientific, Inc.) and 1% penicillin/streptomycin.
These cells were incubated in an atmosphere of 5% CO2 at
37°C.
293T cells (cat. no. IM-H222; Xiamen Yimo
Biotechnology Co., Ltd.) were cultured and seeded onto a 6-well
plate at a density of 6×10⁴ cells per well in a final
volume of 2 µl medium per well, and transfection was carried out
when cell confluence reached 60–80%. The transfection was performed
using the jetPRIME® reagent (Polyplus-transfection SA).
Briefly, 2 µg target plasmid (PINK1-targeting short hairpin
(sh)RNA-expressing pLKO.1-puro plasmid for PINK1 KD or PINK1 OE
plasmid based on the pLVX–IRES-Hyg backbone for PINK1 OE), 0.25 µg
pMD2.G (cat. no. HG-VMA0648; HonorGene) and 0.75 µg psPAX2 (cat.
no. HG-VMA0649; HonorGene) were diluted in 200 µl jetPRIME buffer
and vortexed thoroughly. Subsequently, 4 µl jetPRIME was
centrifuged at 1,360 × g for 5 sec at room temperature before being
added to the diluted DNA solution. The resulting transfection
mixture was then centrifuged at 1,360 × g for 10 sec at room
temperature. The transfection mixture was incubated at room
temperature for 10 min and 200 µl of the resulting transfection
complexes was added dropwise to each well. Plates were gently
rocked horizontally and incubated at 37°C, and the medium was
replaced with fresh medium after 4–6 h of transfection. A total of
48 h post-transfection, the viral supernatant was collected,
filtered through a 0.22-µm filter, aliquoted (1 µl per tube) and
stored at −80°C. The filtered supernatant was then used to infect
NCI-H520 and SK-MES-1 cells.
NCI-H520 cell lines with key gene OE and SK-MES-1
cell lines with key gene KD (sh-key gene) were established and
validated in 293T cells. Empty plasmids pLVX–IRES-Hyg (cat. no.
V010432; NovoPro Bioscience Inc.) and pLKO.1-puro (cat. no.
V010450; NovoPro Bioscience Inc.) were used as the negative
controls for OE (OE-NC) and KD (empty pLKO.1-puro), respectively.
All sequences for OE-key gene and sh-key gene are provided in
Table SII. The effects of focal
adhesion kinase (FAK) inhibitor GSK-2256098 (cat. no. HY-100498A;
MedChemExpress) on NCI-H520 cells were assessed at concentrations
of 0.2, 1.0, 5.0, 7.5, 15.0, 20.0 and 50.0 µM and an optimal
concentration was determined (35).
Reverse transcription-quantitative
polymerase chain reaction (RT-qPCR)
Total RNA was extracted from cells using FastPure
Complex Tissue/Cell Total RNA Isolation Kit (Vazyme Biotech Co.,
Ltd.), according to the manufacturer's instructions. Isolated RNA
was then reverse transcribed into complementary DNA (cDNA) using
ABScript III RT Master Mix for RT-qPCR with genomic DNA (gDNA)
Remover (ABclonal Biotech Co., Ltd.). The reverse transcription
reaction mixture consisted of 4 µl 5X ABScript III RT Mix, 1 µl 20X
gDNA Remover Mix, 500 ng total RNA and nuclease-free H2O
added to a final volume of 20 µl. The reverse transcription
conditions were 37°C for 2 min, 55°C for 15 min, 85°C for 5 min,
followed by a 4°C hold. Subsequently, qPCR was performed using an
Archimed R4 real-time qPCR system (Beijing Kunpeng Gene Technology
Co., Ltd.) and Genious 2X SYBR® Green Fast RT-qPCR Mix
containing SYBR Green as the fluorescent dye (ABclonal Biotech Co.,
Ltd.). The RT-qPCR reaction mixture consisted of 10 µl Genious 2X
SYBR® Green Fast RT-qPCR Mix (NoX), 2 µl DNA template
(cDNA), 0.4 µl forward primer (10 µM), 0.4 µl reverse primer (10
µM) and double-distilled H2O added to a final volume of
20 µl. The RT-qPCR cycling conditions were as follows: Initial
denaturation at 95°C for 3 min, followed by 40–45 cycles of 95°C
for 5 sec and 60°C for 30 sec. Gene expression levels were
quantified using the 2−ΔΔCq method, as described by
Livak and Schmittgen (36), with
mRNA levels normalized to GAPDH (sequences are provided in Table SIII).
WB analysis
Proteins were extracted from aforementioned cell
samples using radioimmunoprecipitation assay buffer lysis buffer
(cat. no. P0013B; Beyotime Biotechnology) and their concentrations
were measured through the bicinchoninic acid assay (cat. no. P0010;
Beyotime Biotechnology). Equal amounts of total protein (30
µg/lane) were separated by SDS-PAGE on 10% gels and transferred to
a PVDF membrane. The membrane was blocked with 5% skim milk for 30
min at room temperature. Primary antibodies were incubated
overnight at 4°C, followed by incubation with secondary antibodies
for 30 min at room temperature. Protein bands were visualized using
Immobilon Western chemiluminescent HRP substrate (cat. no.
WBULS0500; MilliporeSigma) and the images were analyzed with ImageJ
software (version 1.42q; National Institutes of Health). The
following primary antibodies were used in the present study:
Anti-FAK (cat. no. A11131; 1:500) and anti-phosphorylated (p)-FAK
(Y397) (cat. no. AP1447; 1:2,000) were obtained from ABclonal
Biotech Co., Ltd., anti-protein kinase B (AKT; cat. no. CY5561;
1:1,000), anti-p-AKT1 (cat. no. CY6569; 1:1,000), anti-Ras homolog
family member A (RhoA; cat. no. CY5640; 1:1,000) and anti-vinculin
B (cat. no. CY5164; 1:1,000) were all purchased from Shanghai
Abways Biotechnology Co., Ltd. GAPDH antibody (cat. no. 81640-5-RR;
1:5,000; Proteintech Group, Inc.) was used as the reference protein
antibody. The secondary antibody [goat anti-rabbit IgG (H+L),
HRP-conjugated; cat. no 31460; 1:5,000] was obtained from Thermo
Fisher Scientific, Inc.
Cell proliferation assays
To evaluate cell proliferation, Cell Counting Kit-8
(CCK-8) and colony formation assays were conducted. For the CCK-8
assay, a CCK-8 kit (cat. no. G1613-1ML; Wuhan Servicebio Technology
Co., Ltd.) was used. NCI-H520 cells were seeded into a 96-well
plate. At 0, 24, 48 and 72 h, 10 µl CCK-8 solution was added into
each well and incubated for 1 h. The optical density value of each
well was measured at 450 nm. For colony formation assay, cells were
precisely counted and plated into 6-well culture plates at a
density of 2,000 cells/well. Where indicated, cells were treated
with 20 µM GSK-2256098. Cells were cultured continuously for 14
days or until the majority of individual colonies contained >50
cells. Following colony formation, 700 µl of 4% paraformaldehyde
was added to each well for fixation at room temperature for 30 min,
followed by staining with 700 µl of 0.1% crystal violet solution at
37°C for 20 min. Plates were air-dried at room temperature, and
images were captured using a mobile phone and quantitatively
analyzed using ImageJ software (version 1.42q) (35).
Transwell assay
To assess migratory and invasive capabilities of
cells under various treatments, Transwell analysis was conducted.
The steps of the Transwell invasion assay were as follows: In ice,
Matrigel and serum-free medium were diluted at a ratio of 1:8. A 60
µl mixture was applied to the membrane of the Transwell insert and
incubated at 37°C for 3 h, following which 100 µl of serum-free
medium was added to the upper chamber. The residual
Matrigel/serum-free medium mixture in the upper chamber of the
Transwell insert was then removed, and 500 µl complete medium
consisting of basal medium containing 20% serum was added to the
lower chamber. A total of 4×10⁴ cells/well were seeded
into the upper chamber. The 24-well plate was cultured at 37°C, 5%
CO2 and 90% humidity for 24–48 h. The Transwell insert
was subsequently extracted, fixed with 4% polyformaldehyde at room
temperature for 30 min and stained with 1% (600 µl) crystal violet
at room temperature for 20 min. After washing 3 times with PBS,
images were captured using an optical microscope at ×100
magnification (×10 objective and ×10 eyepiece), and cell counts
were determined using ImageJ software (version 1.42q) (35). The Transwell migration assay does
not require Matrigel coating and the remaining steps aforementioned
were followed.
Statistical analysis
Bioinformatics analysis was conducted using R
software (version 4.2.2; R Development Core Team). Differences
between two groups were compared using the Wilcoxon rank-sum test,
while differences among multiple groups were assessed using the
Kruskal-Wallis test followed by Dunn's post hoc test with Holm
correction for multiple comparisons. Survival differences were
assessed using the log-rank test. Experimental data were analyzed
using GraphPad Prism software (version 10.1.2; Dotmatics).
Experimental data were presented as the mean ± standard deviation.
All experiments, including WB, CCK-8, colony formation and
Transwell migration/invasion assays, were performed using three
independent biological replicates. Comparisons between two groups
were performed using a two-tailed unpaired Student's t-test.
Comparisons among three or more groups were conducted using one-way
ANOVA followed by a two-tailed Bonferroni post hoc test for
multiple pairwise comparisons when the overall difference was
statistically significant. For CCK-8 assays, because both group and
time were included as variables, statistical analysis was performed
using two-way ANOVA followed by Bonferroni post hoc test for
pairwise comparisons. All statistical tests were two-tailed.
P<0.05 was considered to indicate a statistically significant
difference.
Results
PINK1 as a key gene in LUSC
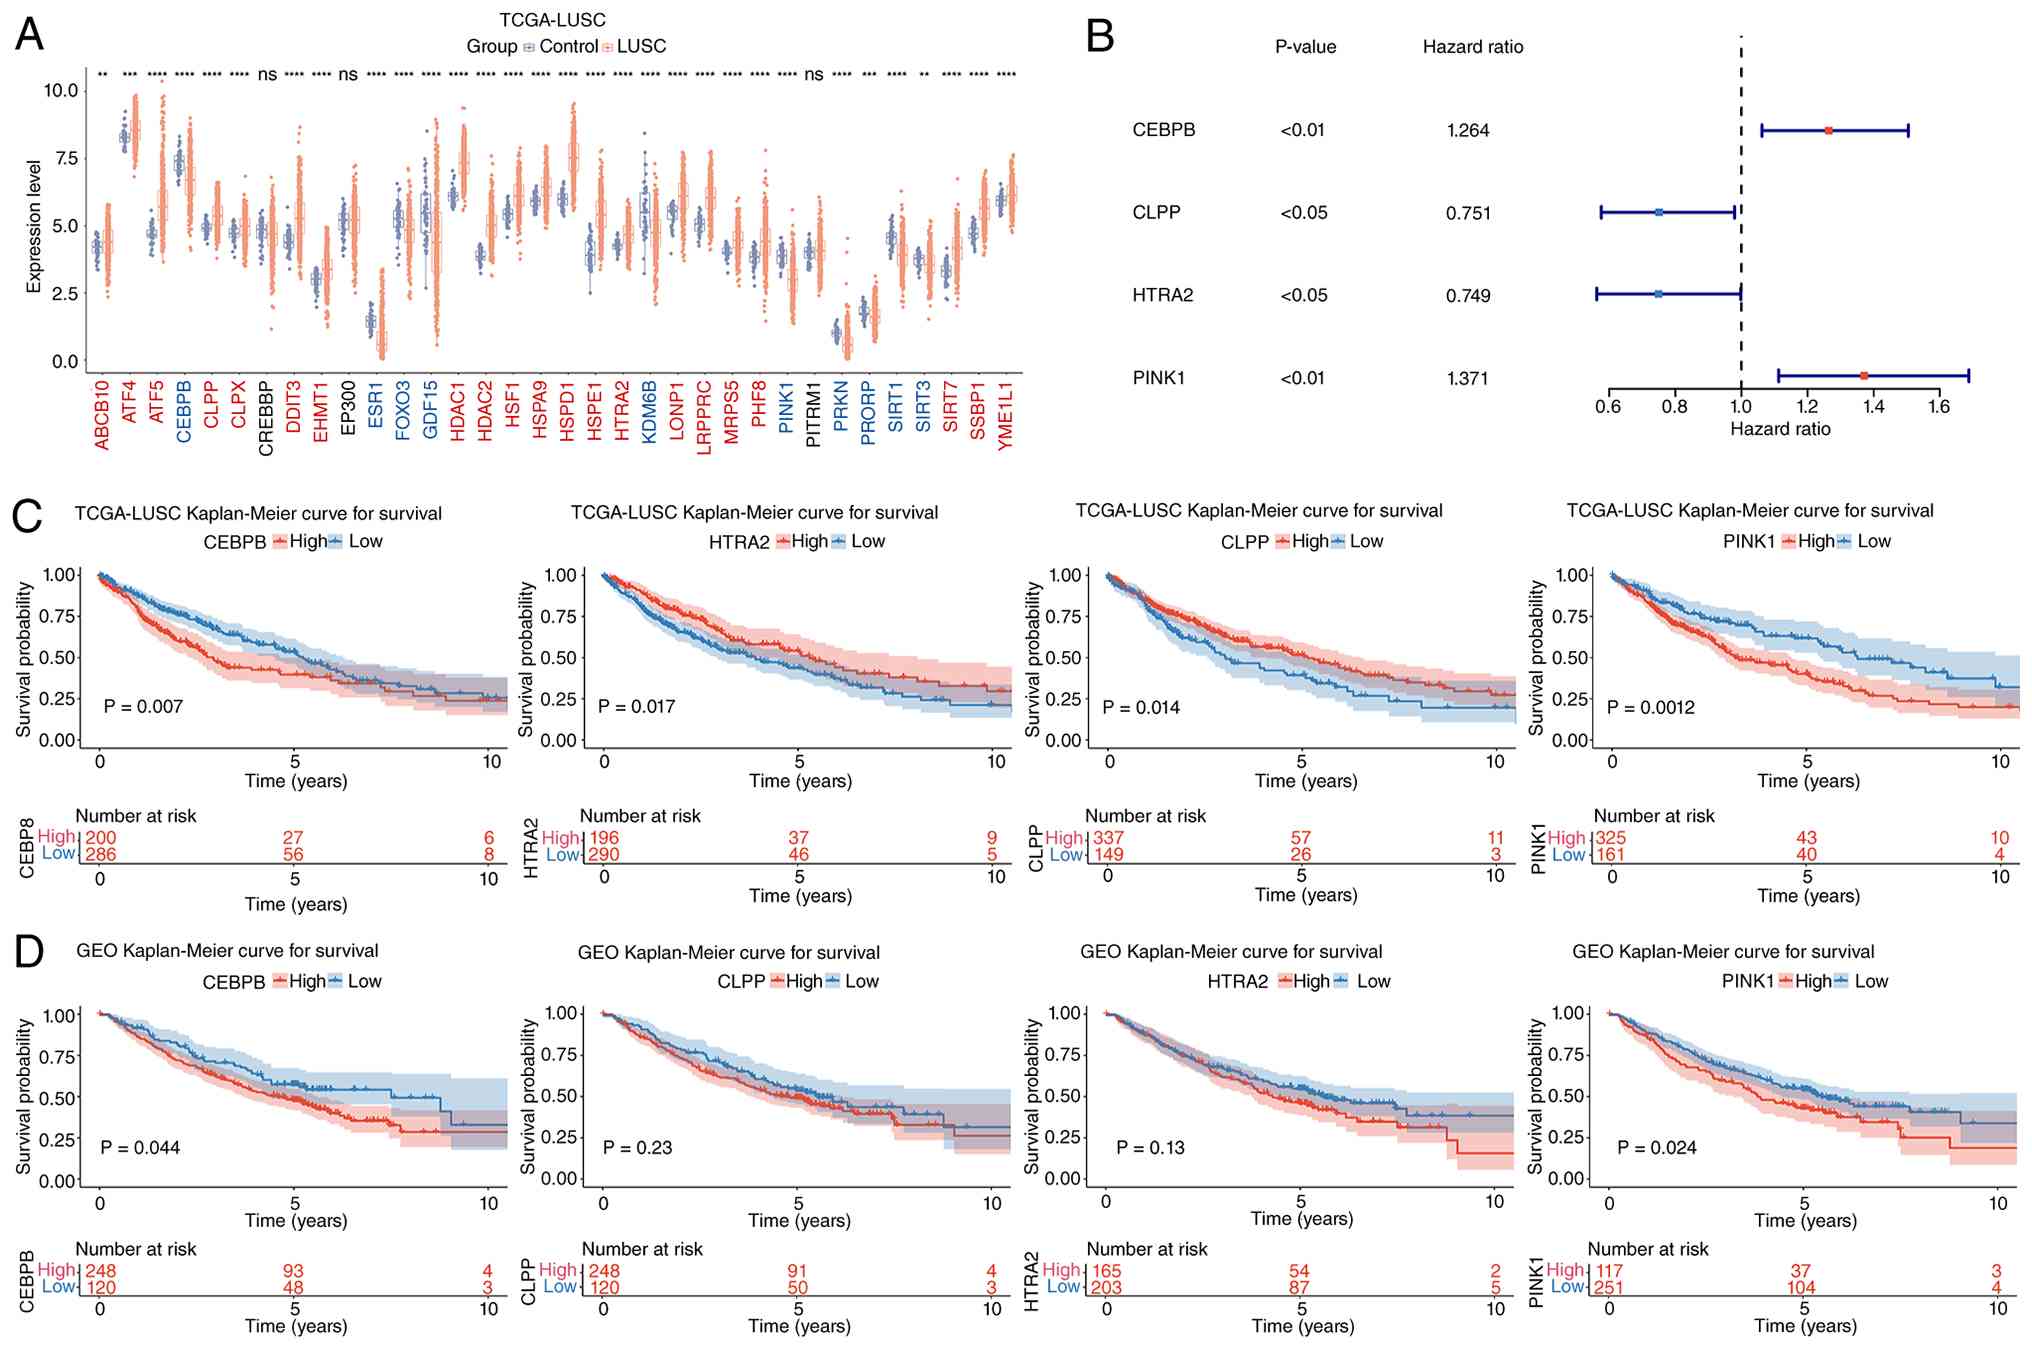
Using differential expression analysis, 31
DE-UPRmt-RGs were identified between LUSC and control
samples in TCGA-LUSC dataset (Fig.
1A). Among these, DE-UPRmt-RGs,
CCAAT/enhancer-binding protein β (CEBPB), caseinolytic
mitochondrial matrix peptidase proteolytic subunit,
high-temperature requirement A2 and PINK1 were identified to be
associated with LUSC survival by univariate Cox analysis (Fig. 1B). Furthermore, LUSC samples were
categorized into high- and low-expression cohorts based on the
optimal cut-off value of 0.3, Kaplan-Meier (KM) survival analysis
was then performed in these groups. In both training and merged
validation sets, survival difference was observed among CEBPB and
PINK1 diverse expression groups (Fig.
1C and D). Of note, the higher expression levels of these genes
were closely associated with worse prognosis, indicating that CEBPB
and PINK1 were risk factors for LUSC. Thus, CEBPB and PINK1 were
identified as candidate key genes in LUSC. According to the
published literature (6), PINK1 was
associated with the poor prognosis of LUSC. Furthermore, KM
survival analysis of the present study also demonstrated that PINK1
was the most relevant genes for LUSC. Therefore, PINK1 was selected
as a key gene for further analysis.
Potential functions of PINK1 in
LUSC
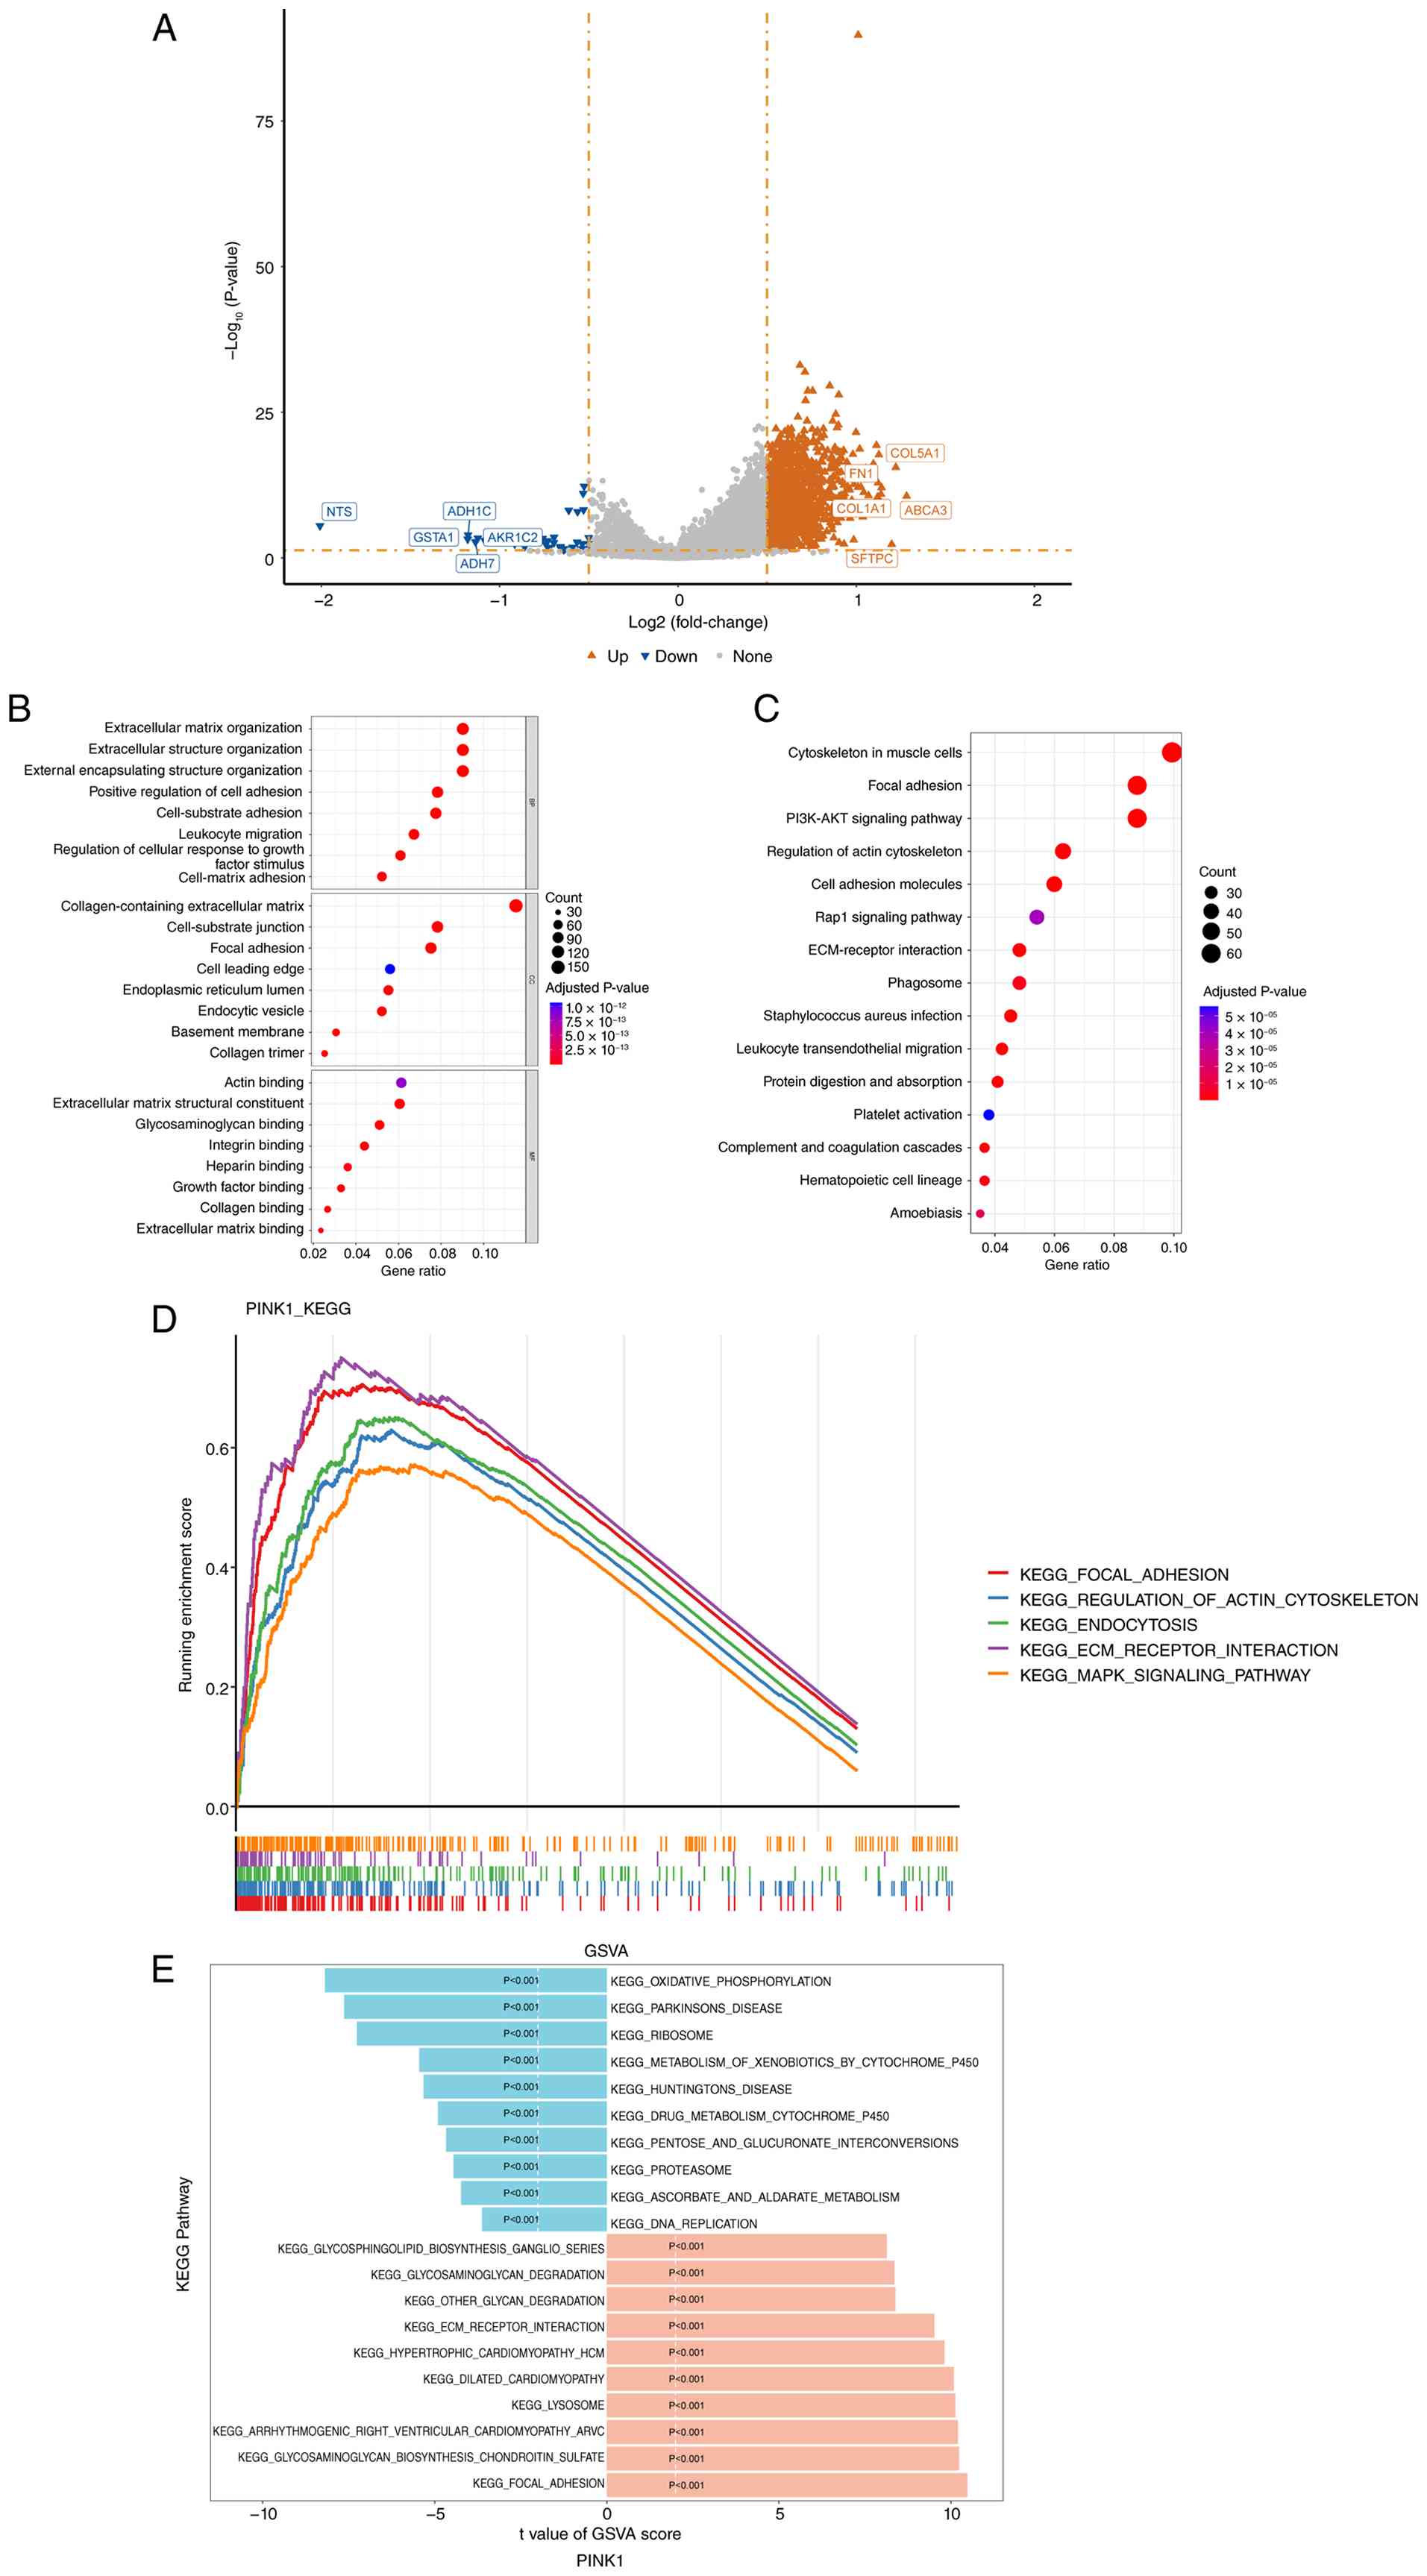
Differential expression analysis was conducted
between the groups with high and low PINK1 expression in TCGA-LUSC
dataset, identifying 1,336 DEGs, comprising 1,300 upregulated and
36 downregulated genes (Fig. 2A;
Table SIV). Functional enrichment
analysis of these DEGs revealed 1,588 GO terms and 55 KEGG
pathways. The GO terms encompassed processes such as ‘extracellular
matrix organization’, ‘extracellular matrix structural constituent’
and ‘collagen-containing extracellular matrix (Fig. 2B)’, while KEGG pathways contained
‘cytoskeleton in muscle cells’, ‘PI3K-AKT signaling pathway’ and
‘regulation of actin cytoskeleton’ (Fig. 2C). To further investigate the
functions of PINK1, GSEA was conducted. The results indicated that
117 pathways were enriched, with the top 5 pathways ranked by |NES|
value being ‘focal adhesion’, ‘regulation of actin cytoskeleton’,
‘endocytosis’, ‘ECM-receptor interaction’ and ‘MAPK signaling
pathway’ (Fig. 2D). These pathways
were correlated with cellular processes, signaling molecules and
interaction, suggesting that PINK1 possibly influenced LUSC through
these mechanisms. Furthermore, to explore the differential pathways
across PINK1 distinct expression groups, GSVA was carried out. The
results revealed that 146 differential pathways between these
groups. Among these, 26 were inhibited and 120 were activated in
the LUSC samples (Fig. 2E). These
inhibited pathways included ‘oxidative phosphorylation’,
‘ribosome’, ‘metabolism of xenobiotics by cytochrome P450’ and
‘ascorbate and aldarate metabolism’, while activated pathways
contained ‘focal adhesion’, ‘glycosaminoglycan biosynthesis
chondroitin sulfate’ and ‘arrhythmogenic right ventricular
cardiomyopathy arrhythmogenic right ventricular
cardiomyopathy’.
Differential immune landscape of PINK1
distinct expression groups in LUSC
Immune infiltration abundance in two PINK1
expression groups is provided in Fig.
3A. Among the types of 22 immune cells, 9 exhibited significant
differences between these groups, including resting memory CD4,
activated memory CD4 and γδ T cells and M0/M1/M2 macrophages
(Fig. 3B). Furthermore, the TIDE
score was also compared between different expression groups,
revealing that the high-expression group had a significantly higher
TIDE score (Fig. 3C). Correlation
analysis revealed a significant positive correlation between the
TIDE score and PINK1 expression (ρ=0.16; Fig. 3D), suggesting that higher PINK1
expression may be associated with greater immune escape potential.
Furthermore, the stromal, immune and ESTIMATE scores were all
significantly elevated in the high-expression group (Fig. 3E), highlighting the marked impact of
PINK1 expression on the immune landscape of LUSC. Further immune
subtypes revealed that LUSC samples could be categorized into six
distinct subtypes, namely C1 (wound healing), C2 (IFN-γ dominant),
C3 (inflammatory), C4 (lymphocyte depleted), C5 (immunologically
quiet) and C6 (TGF-β dominant). Of note, a significant difference
in PINK1 expression was detected between the C1 and C2 subtypes as
compared with the C6 subtype (Fig.
3F). This finding suggested that PINK1 may exert distinct
effects across different LUSC subtypes, thereby highlighting the
necessity for personalized therapeutic approaches in the
future.
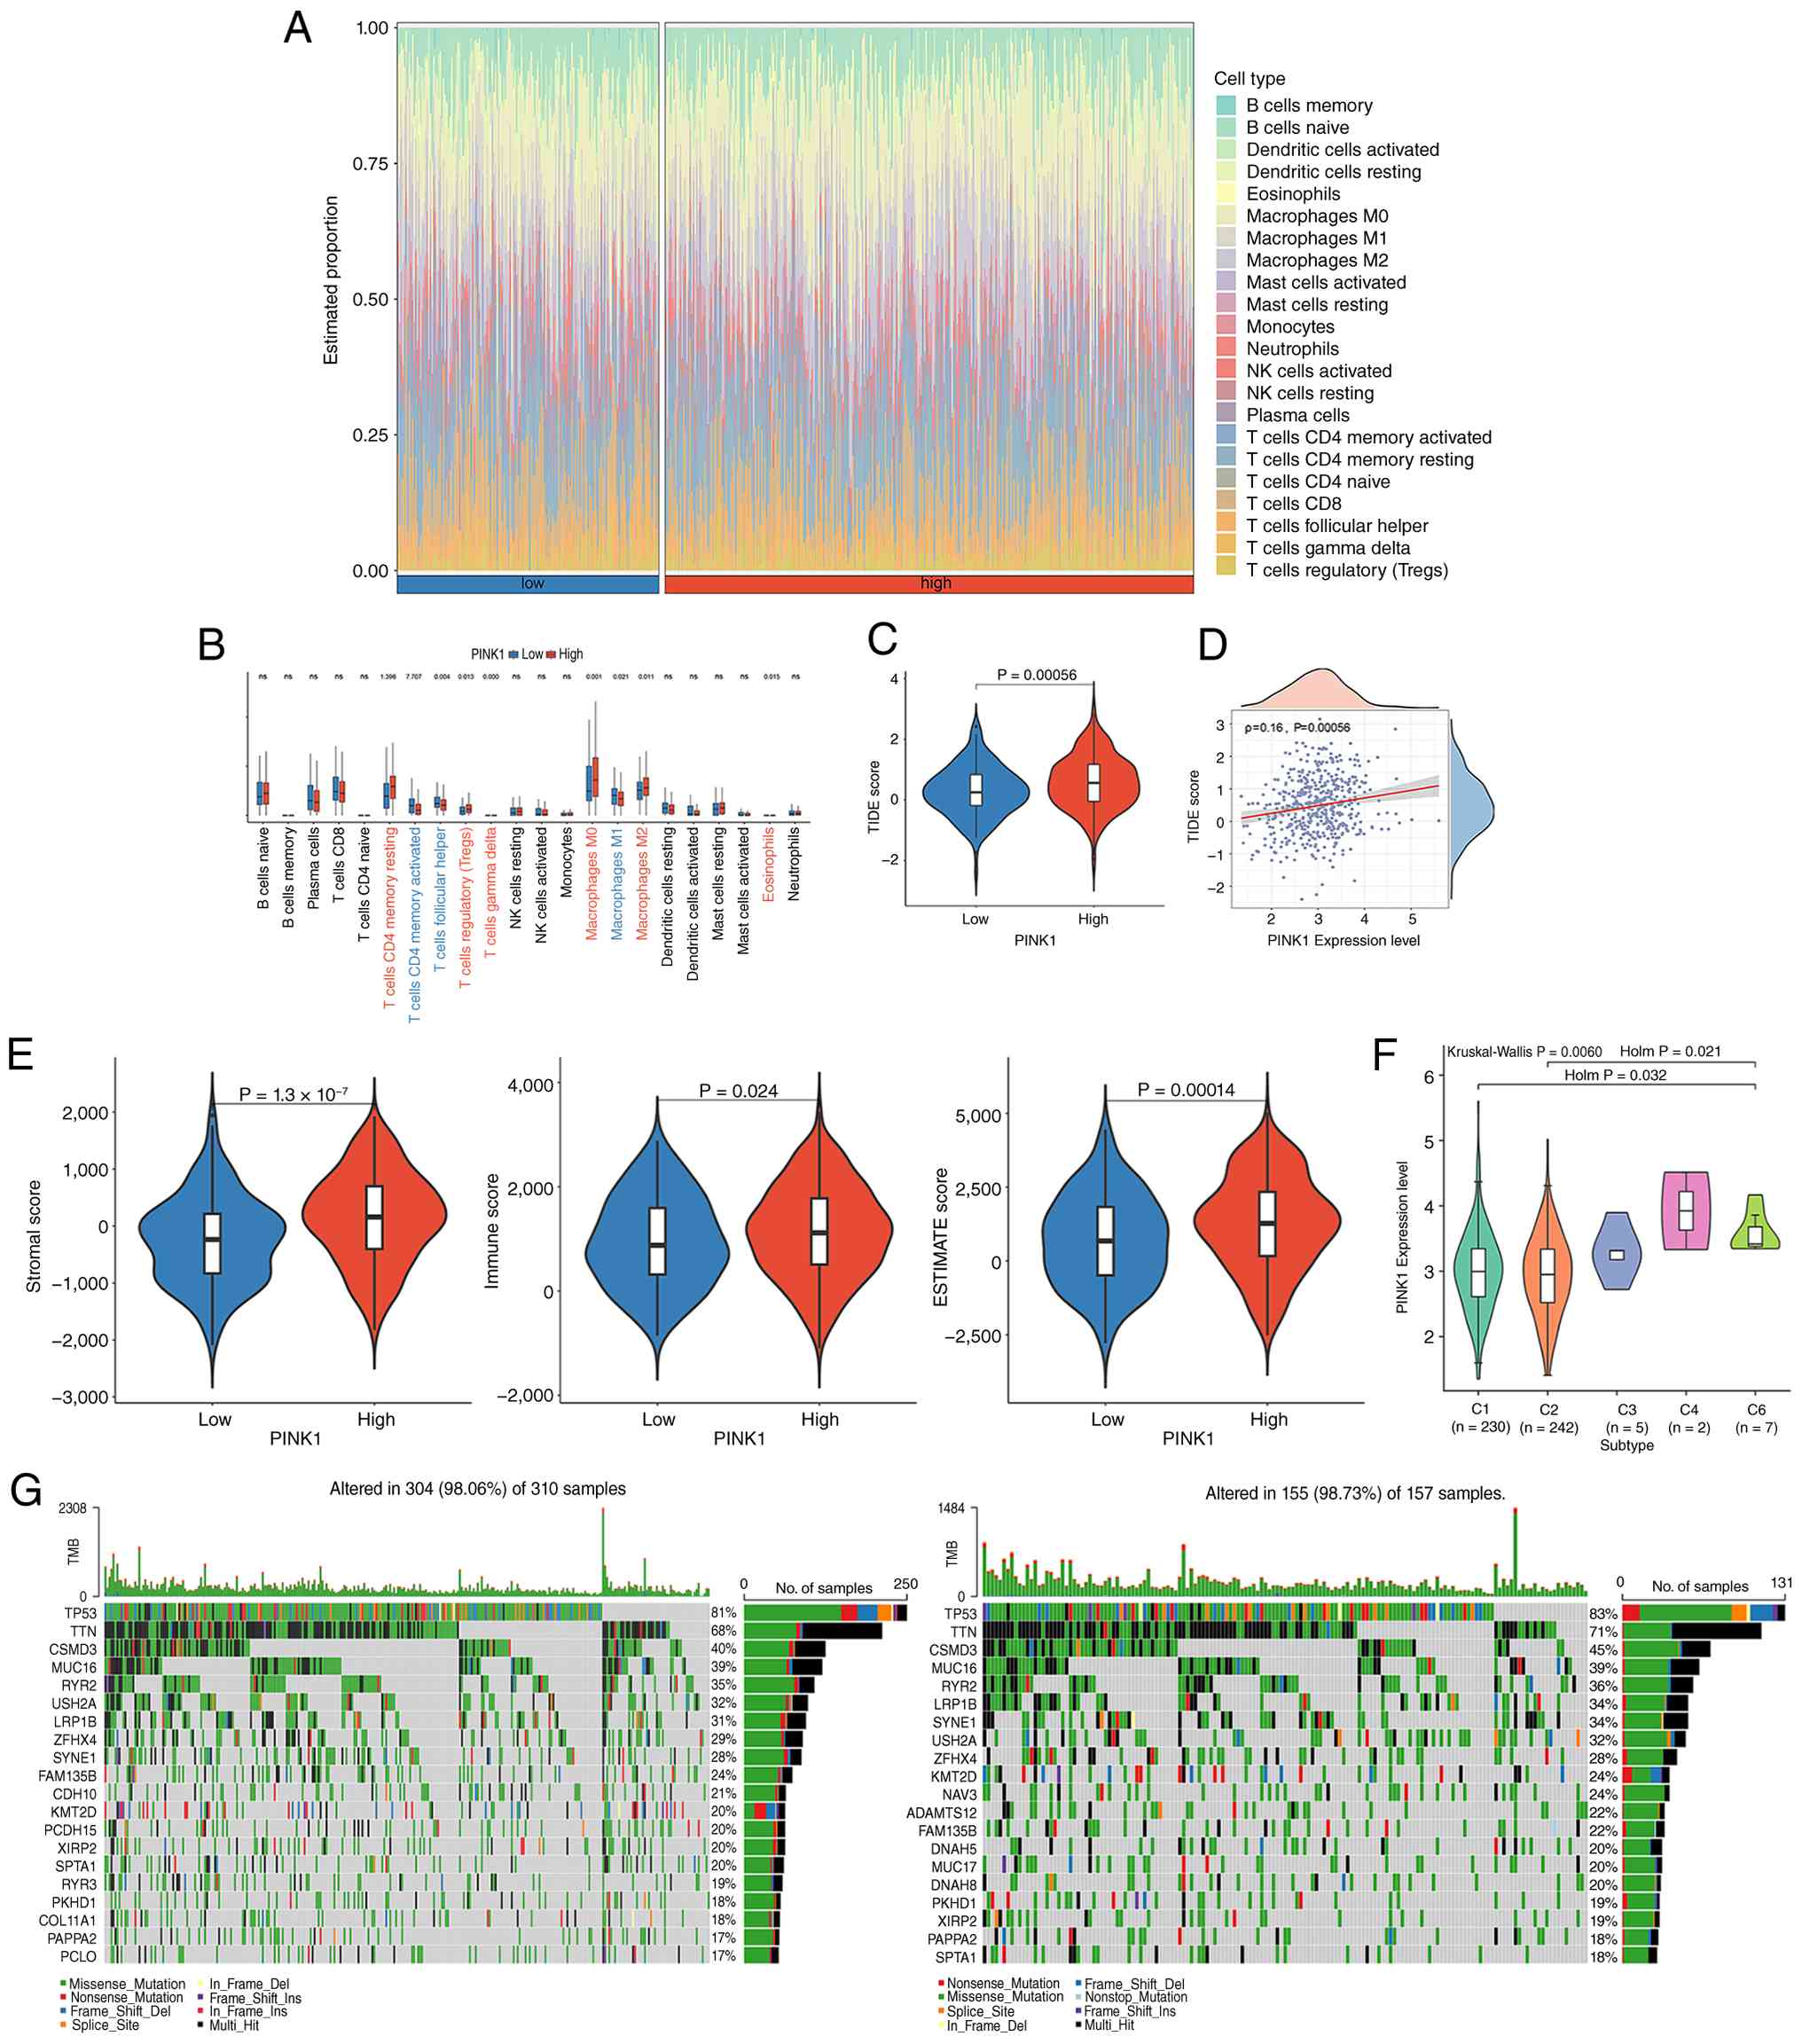 | Figure 3.Immune and mutation landscape between
high- and low-expression groups. (A) Immune landscape in distinct
expression groups. (B) Difference in immune cell infiltration
between high- and low-expression groups. (C) Difference and (D)
correlation of the TIDE score between high- and low-expression
groups. (E) Difference in immune, stromal and ESTIMATE scores
between high- and low-expression groups. (F) Expression levels of
PINK1 among different immune cell subtypes. Statistical
significance was assessed using the Kruskal-Wallis test followed by
Dunn's post hoc multiple comparisons test with Holm correction for
multiple comparisons. (G) Mutation landscape of genes (left,
high-expression group; right, low-expression group). ns, no
significance; TIDE, tumor immune dysfunction and exclusion; PINK1,
PTEN-induced kinase 1; TMB, tumor mutation burden; TIDE, Tumor
Immune Dysfunction and Exclusion; NK, natural killer; ESTIMATE,
Estimation of STromal and Immune cells in MAlignant Tumor tissues
using Expression data. |
Association between PINK1 expression
and chemosensitivity in LUSC
The mutation profiles of high- and low-PINK1
expression groups were investigated. The present study results
reported that the top 3 most frequently mutated genes in both
groups were tumor protein p53 (high, 81%; low, 83%), titin (high,
68%; low, 71%) and CUB and sushi multiple domains 3 (high, 40%;
low, 45%) (Fig. 3G). The
predominant type of mutation was missense mutation.
To assess drug sensitivity in PINK1 distinct
expression groups, the IC50 value of these drugs was
calculated and compared. A total of 100 drugs exhibited a marked
difference between distinct expression groups (Table SV). Common chemotherapeutic drugs,
such as cisplatin_1005, paclitaxel_1080 and gemcitabine_1190
(numbers indicate the corresponding unique drug IDs in the Genomics
of Drug Sensitivity in Cancer database, http://www.cancerrxgene.org/), had a higher
IC50 value in the high-expression groups, indicating
that patients with a high PINK1 expression had a lower drug
sensitivity.
PINK1 aggravates LUSC cell
proliferation, migration, invasion and colony formation
ability
To further elucidate the role of PINK1 in LUSC,
lentivirus vectors for PINK1 OE and KD, together with their
corresponding negative controls, were constructed. PINK1 OE was
established in NCI-H520 cells, whereas PINK1 KD was established in
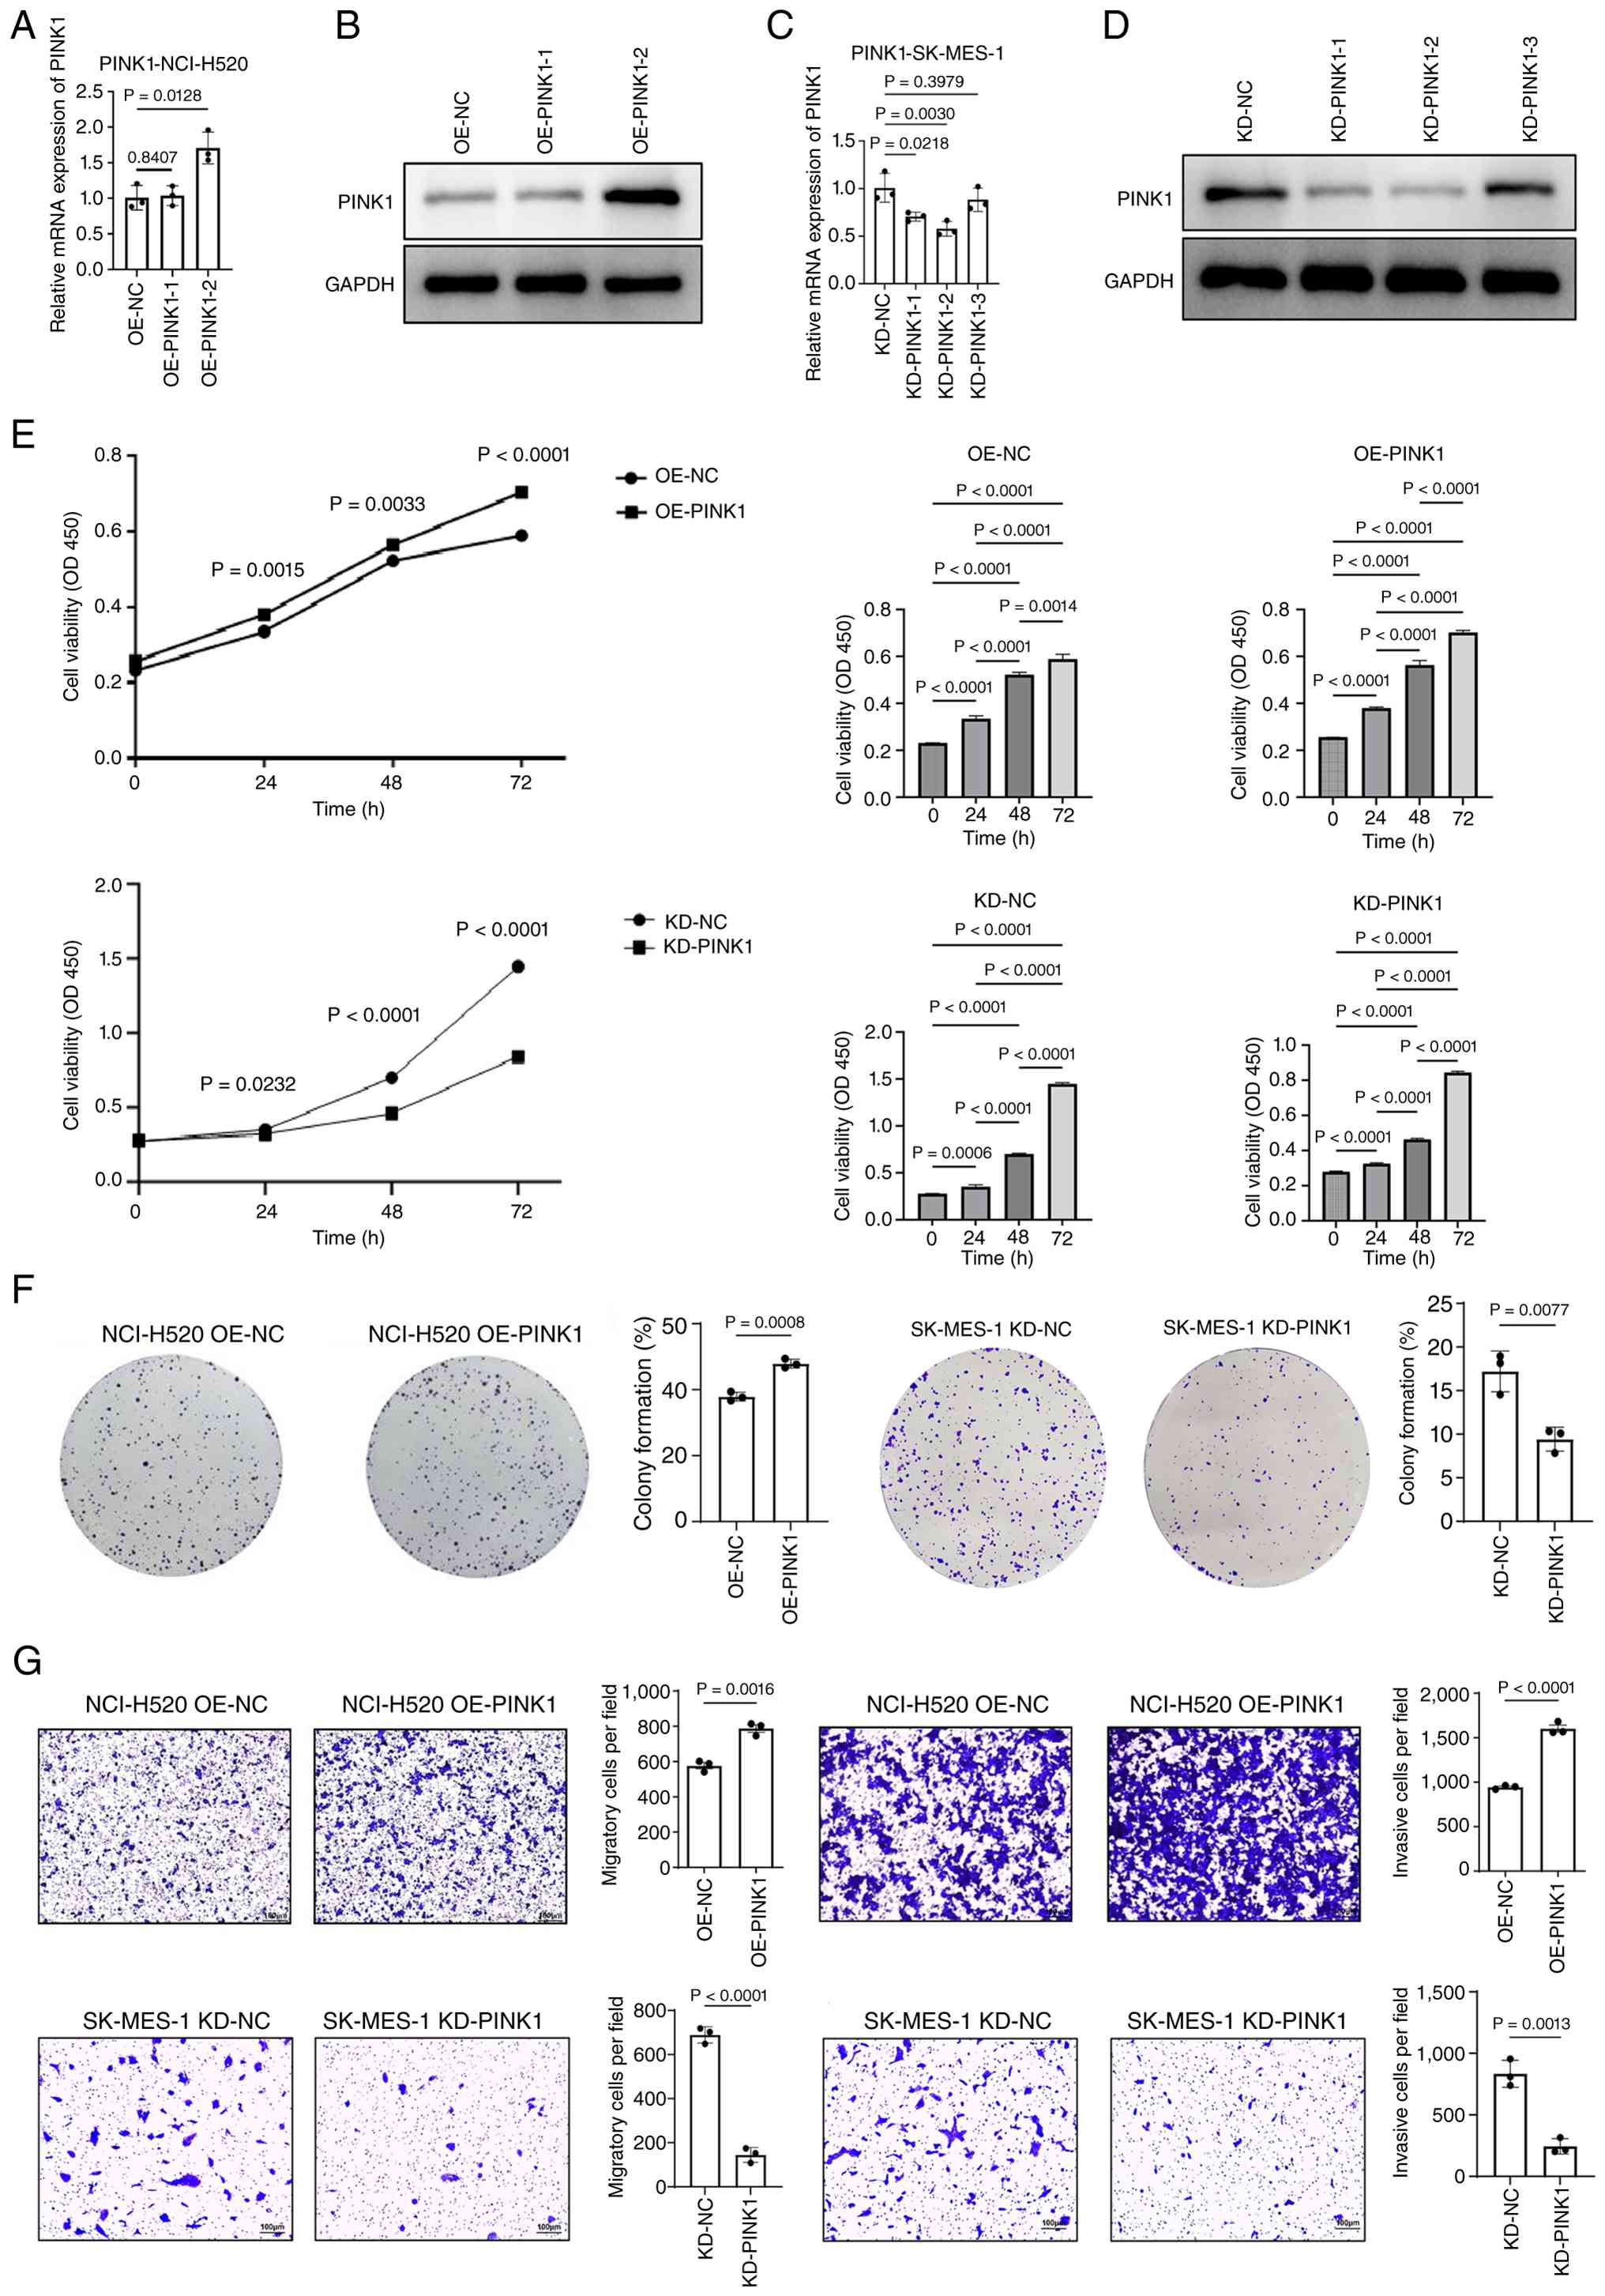
SK-MES-1 cells. As illustrated in Fig.
4A and B, both mRNA and protein expression levels of PINK1 were
significantly increased in NCI-H520 cells transfected with
OE-PINK1-2, compared with the corresponding control group. Among
the two OE constructs, OE-PINK1-2 was selected for the subsequent
functional experiments. As displayed in Fig. 4C and D, PINK1 expression at both the
mRNA and protein levels was significantly reduced in SK-MES-1 cells
transfected with sh-PINK1-1 and −2, compared with the corresponding
control group. Among the three KD constructs, KD-PINK1-2 was
selected for subsequent functional experiments because it exhibited
higher gene knockdown efficiency than KD-PINK1-1. Furthermore,
CCK-8 assay results demonstrated that PINK1 OE significantly
enhanced the proliferation of NCI-H520 cells compared with in the
OE-NC group, with the effect beginning to appear at 24 h, becoming
evident at 48 h and reaching the highest level at 72 h. By
contrast, PINK1 KD significantly reduced the proliferation of
SK-MES-1 cells compared with in the KD-NC group, with the
inhibitory effect becoming marked from 48 h and being most notable
at 72 h (Fig. 4E). In addition to
the between-group comparisons, Bonferroni post hoc analysis also
revealed significant time-dependent increases in cell viability
within each group. In the OE-NC group, cell viability was
significantly increased at 24, 48 and 72 h compared with 0 h and
significant differences were also detected between 24, 48 and 72 h.
In the OE-PINK1 group, cell viability increased significantly over
time, with significant differences observed between 24, 48 and 72
h, indicating that PINK1 OE further enhanced the proliferative
ability of cells over time. Similarly, in the KD-NC group, cell
viability increased significantly at 24, 48 and 72 h compared with
0 h. The time-dependent increase in the KD-PINK1 group was
significantly attenuated compared with that in the KD-NC group.
Colony formation analysis revealed that PINK1 OE significantly
promoted colony formation, whereas PINK1 KD exerted the opposite
effect (Fig. 4F). Furthermore, the
migratory and invasive capabilities of LUSC cells were
significantly increased in NCI-H520 cells following PINK1 OE and
significantly decreased in SK-MES-1 cells following PINK1 KD
(Fig. 4G). Collectively, these
findings suggested that elevated PINK1 expression may exacerbate
LUSC progression by promoting cell proliferation, migration,
invasion and colony formation.
PINK1 promotes LUSC through the
FAK/AKT/RhoA/vinculin pathway
Considering that PINK1 was significantly associated
with focal adhesion by enrichment analyses and FAK has been
recognized as a key regulator in NSCLC (37), the aim of the present study was to
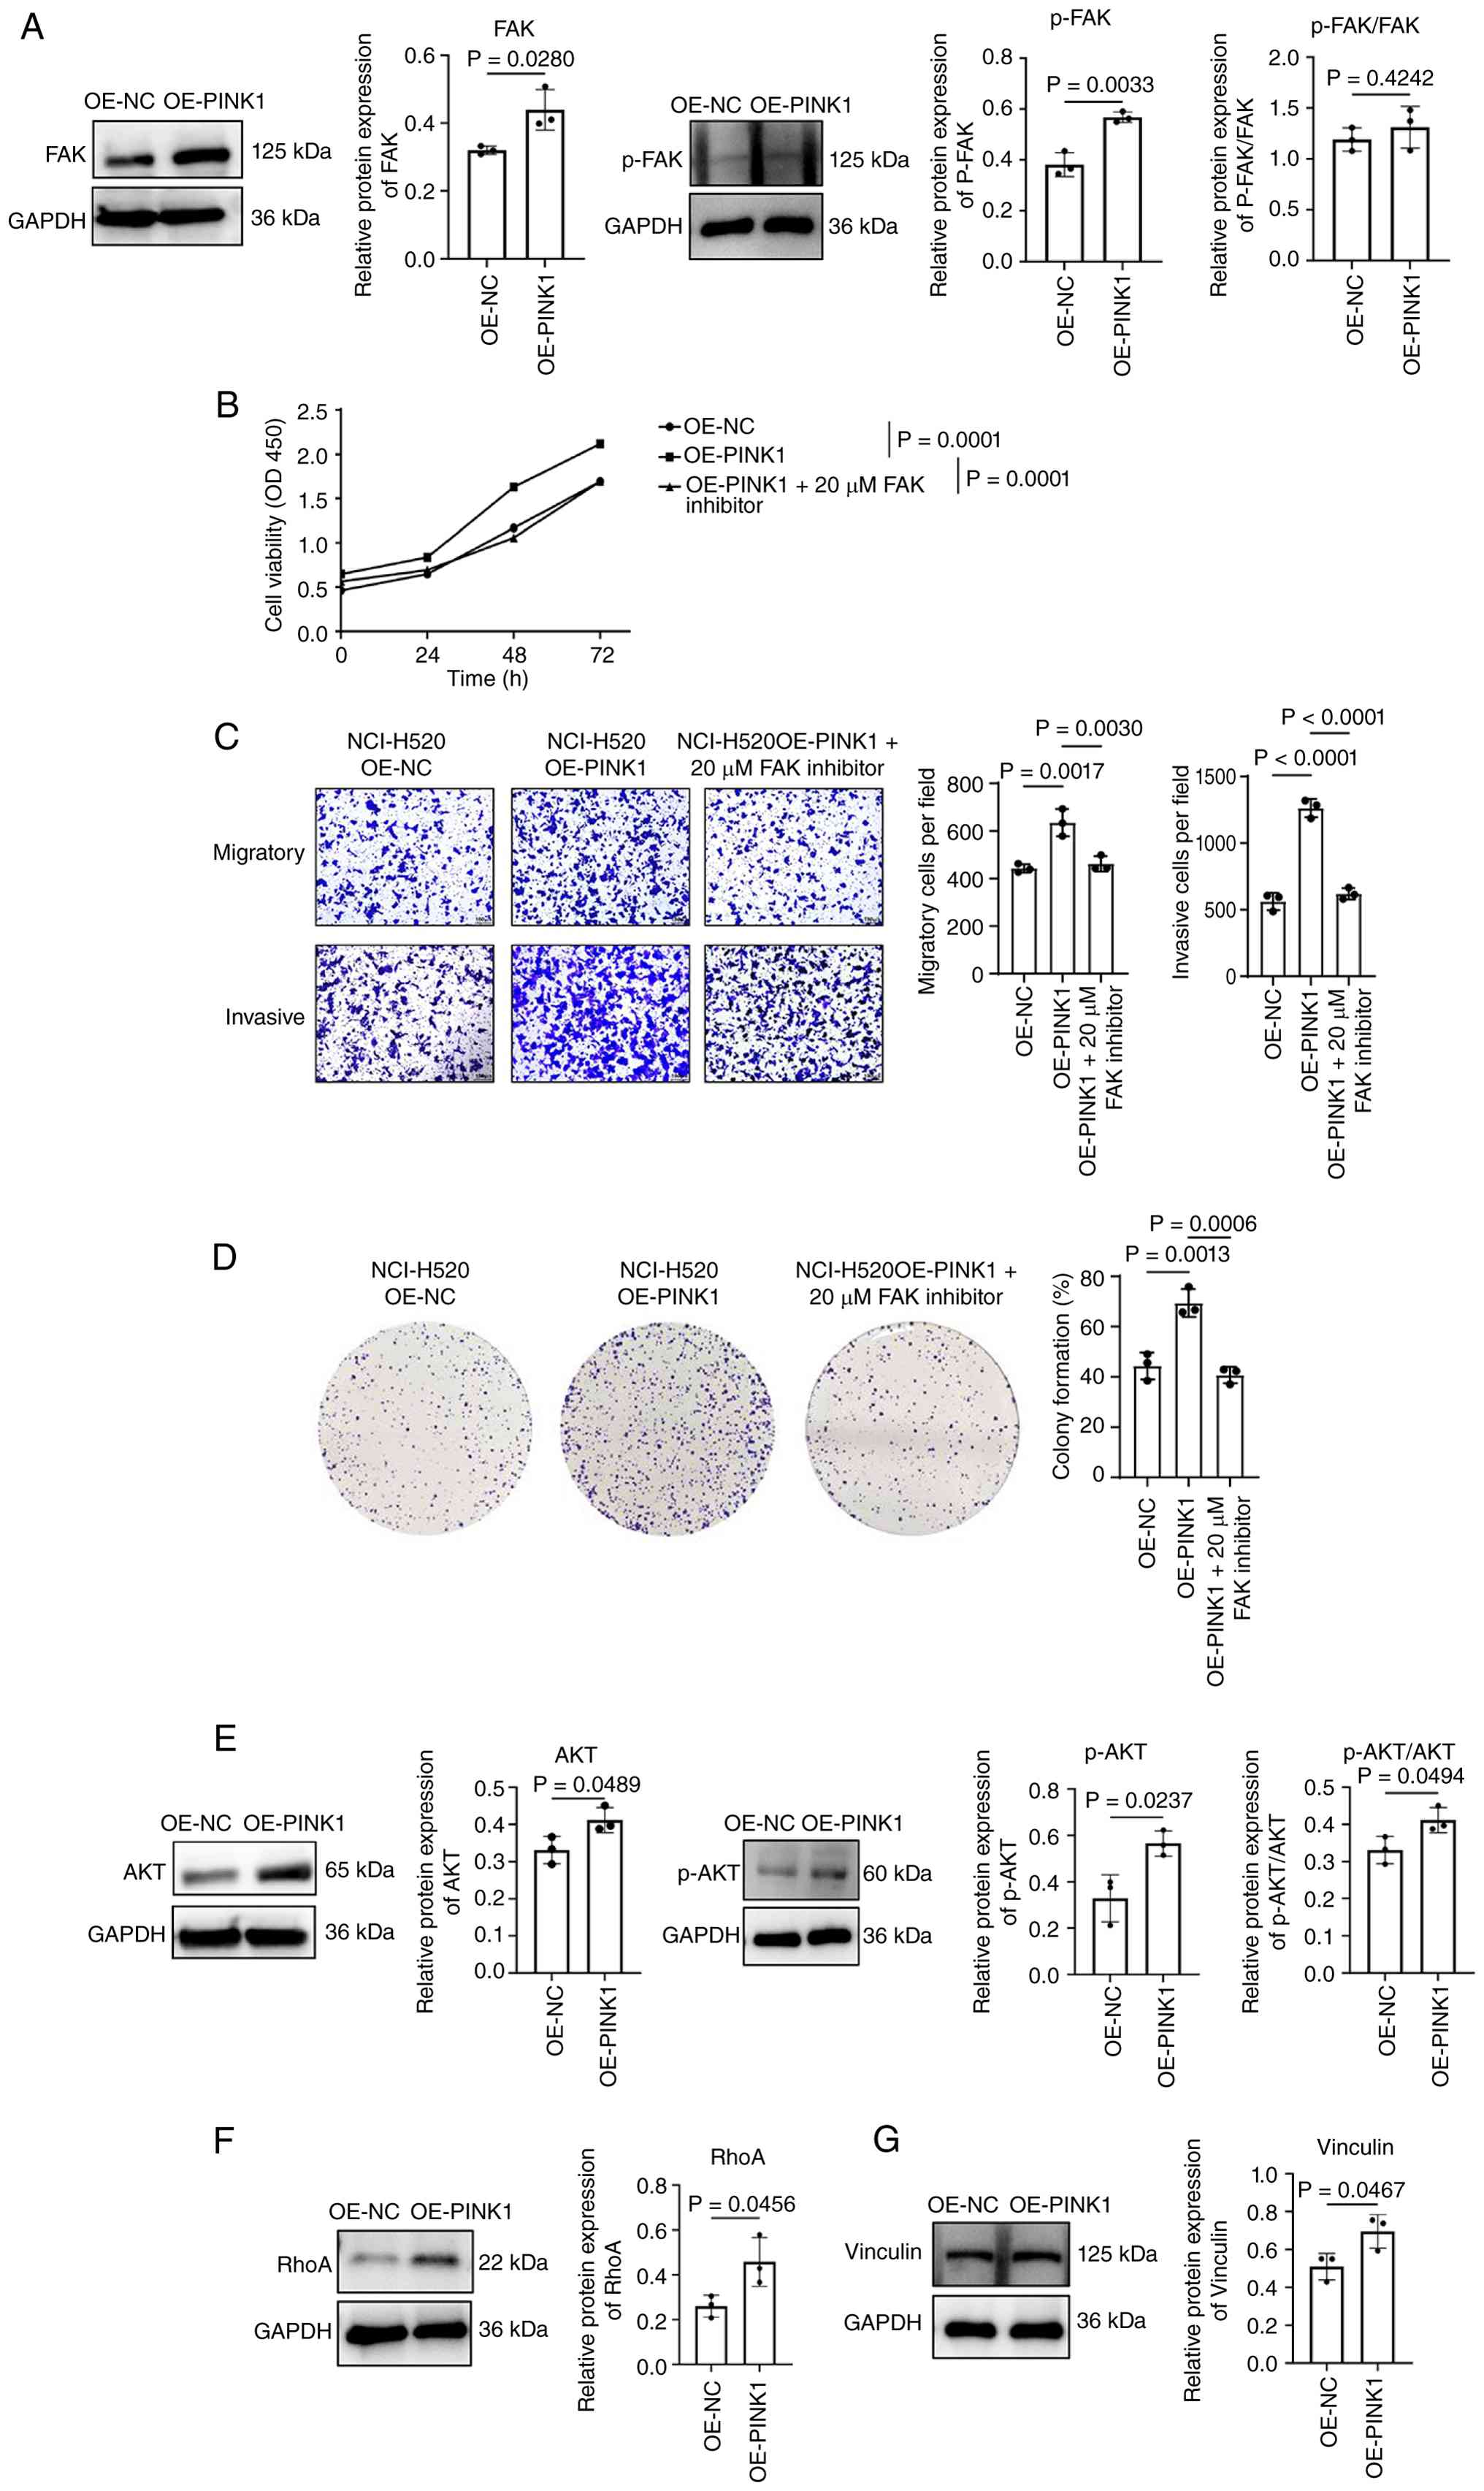
explore the association between FAK and PINK1 in LUSC. WB revealed
that both FAK and p-FAK expression levels were significantly
elevated in OE-PINK1 cells, as compared with OE-control cells
(Fig. 5A). However, the p-FAK/FAK
ratio was not significantly increased in OE-PINK1 cells compared
with OE-control cells. A 20 µM FAK inhibitor was then employed to
investigate its effects on tumor cells in LUSC. PINK1
overexpression significantly increased the proliferation of
NCI-H520 cells compared with the OE-NC group, whereas treatment
with 20 µM FAK inhibitor significantly attenuated this increase
(Fig. 5B). Similarly, PINK1
overexpression significantly enhanced cell migration, invasion and
colony formation compared with in the OE-NC group; by contrast,
treatment with the FAK inhibitor significantly reduced the PINK1
overexpression-induced increases in cell migration, invasion and
colony formation (Fig. 5C and D).
These findings suggested that PINK1 may activate FAK to promote the
aforementioned processes, thereby exacerbating LUSC progression.
Further WB analysis revealed markedly increased expression levels
of AKT, p-AKT, RhoA, vinculin and p-AKT/AKT in OE-PINK1 cells
(Fig. 5E-G). Notably, the
protein-level changes of FAK, AKT, RhoA and vinculin were
consistent with the transcriptomic analysis results in TCGA-LUSC
cohort, in which PTK2, AKT1, RHOA and VCL were significantly
upregulated in the PINK1-high group (Table SIV). Collectively, these findings
indicated that PINK1 aggravated LUSC progression by enhancing tumor
cell proliferation, migration, invasion and colony formation
through the FAK/AKT/RhoA/vinculin pathway.
Discussion
LUSC is a major subtype of NSCLC, characterized by
aggressive growth and poor prognosis (38). Increasing evidence indicates that
mitochondrial dysfunction contributes to tumor progression. The
UPRmt is a stress-adaptive signaling pathway that
maintains mitochondrial proteostasis by upregulating molecular
chaperones and proteases in response to mitochondrial damage
(39–41). The aberrant activation of
UPRmt has been implicated in several cancer types,
including lung cancer (40), breast
cancer (42) and prostate cancer
(43), suggesting that
UPRmt-RGs may serve key roles in LUSC development.
PINK1 is a mitochondrial serine/threonine kinase
that serves a key role in mitochondrial quality control and
mitophagy (44). Dysregulated PINK1
expression has been reported in multiple malignancies, including
glioblastoma (45) and lung cancer
(46), and has been reported to be
closely associated with tumor progression, apoptosis resistance and
chemoresistance, particularly in lung cancer (45–47).
Previous studies have suggested that PINK1 exerts pro-tumorigenic
effects mainly by regulating mitophagy and inhibiting apoptosis,
and elevated PINK1 levels have been associated with poor prognosis
and chemotherapy resistance in NSCLC (6,48,49).
However, to the best of our knowledge, majority of
these studies focused on general NSCLC populations or primarily
emphasized its role in mitochondrial autophagy, leaving the
specific function and downstream signaling mechanisms of PINK1 in
LUSC insufficiently characterized. Consistent with and extending
these findings, the present study results demonstrated that PINK1
is not only associated with poor survival in LUSC but also directly
promotes the proliferation, migration and invasion of LUSC cells,
in part through the activation of focal adhesion-associated
signaling pathways, highlighting its potential role as a key
regulator of LUSC progression.
GSEA analysis demonstrated a significant enrichment
of the ‘focal adhesion’ pathway in the PINK1 high-expression group.
Consistently, PINK1 OE markedly increased FAK and p-FAK levels in
LUSC cells. FAK, a non-receptor tyrosine kinase, has been reported
to promote tumor growth by enhancing cell proliferation, survival,
signal transduction and angiogenesis (50), and its OE is associated with
unfavorable patient prognosis in multiple malignancies, including
ovarian, breast, pancreatic, lung, prostate and colorectal cancer
(51). Furthermore, FAK serves a
key role in carcinogenesis, metastasis and drug resistance
(52). The selective FAK inhibitor
GSK2256098 has been reported to obstruct cancer cell adhesion,
proliferation and migration (53),
and to inhibit migration and metastasis by blocking FAK signaling
in gastric cancer cells (54). In
the present study, treatment with GSK2256098 significantly
attenuated the enhanced proliferation, migration and invasion of
LUSC cells induced by PINK1 OE, indicating that FAK activation is
functionally involved in PINK1-mediated LUSC progression.
Furthermore, PINK1 OE increased the expression
levels of AKT, p-AKT, RhoA and vinculin. The PI3K/AKT pathway, a
principal downstream target of FAK (55,56),
is known to regulate tumor cell proliferation, migration and
invasion (57,58). AKT activation has also been reported
to directly regulate RhoA activity through phosphorylation
(59). RhoA, a member of the
Rho-GTPase family, modulates cytoskeletal architecture by
regulating actin stress fiber formation and focal adhesion complex
assembly (60). Vinculin, a key
protein linking integrin-mediated adhesion complexes to the actin
cytoskeleton (61), has been
associated with reduced overall survival in patients with lung
cancer (62), and its KD suppresses
cell proliferation and invasion (14). In combination, the present study
findings suggested that PINK1 promotes LUSC progression through the
activation of the FAK/AKT/RhoA/vinculin signaling axis.
To the best of our knowledge, the present study was
the first to systematically screen UPRmt-RGs in LUSC and
identify PINK1 as a key prognostic factor using multi-cohort
validation. Of note, experimental evidence associating PINK1 with
the FAK/AKT/RhoA/vinculin signaling axis were provided, thereby
establishing a novel mechanistic connection between mitochondrial
stress responses and focal adhesion signaling in LUSC. These
findings potentially enhanced the current understanding of how
mitochondrial quality control mechanisms interact with cytoskeletal
remodeling pathways in LUSC. By integrating bioinformatics analysis
with functional validation, the present study highlighted PINK1 as
a potential biomarker for prognosis and therapeutic stratification.
Targeting PINK1 or its downstream focal adhesion signaling
components may represent a promising strategy in improving
treatment outcomes in patients with LUSC.
Nonetheless, several limitations should be
acknowledged. First, these conclusions were primarily based on
bioinformatics analyses and in vitro experiments, without
in vivo validation or clinical specimen confirmation, which
may limit the translational strength of these findings. Although
PINK1 promoted proliferation, migration and invasion of LUSC cells,
its role in tumor progression and metastasis has not yet been
verified in animal models. Future studies incorporating
metastasis-associated in vivo experiments and clinical
cohort validation are warranted to further evaluate its biological
and clinical significance.
Secondly, although the present study was conducted
within a UPRmt-associated gene framework, the activation
of canonical ER-UPRmt signaling components or
established UPRmt markers were not directly assessed.
Therefore, it remains to be elucidated whether UPR pathways are
functionally involved in the observed phenotypes and the
UPRmt-associated mechanistic implications should be
cautiously interpreted.
Thirdly, while PINK1 OE increased FAK, AKT, RhoA and
vinculin expression and FAK inhibition attenuated PINK1-induced
phenotypes, the present study findings primarily demonstrated
association rather than a clearly defined hierarchical signaling
cascade. Additional genetic, rescue or epistasis analyses are
warranted to establish causal pathway dependence in future
research.
Lastly, the mitochondrial localization or activation
status of overexpressed PINK1 was not directly verified. Without
confirmation of its mitochondrial engagement, the association
between PINK1-driven effects and mitochondrial mechanisms remains
to be elucidated. Furthermore, the present study mainly focused on
proliferation, migration and focal adhesion-associated signaling,
and other potential mechanisms regulated by PINK1, including
autophagy or metabolic regulation, were not explored.
In conclusion, integrative analyses of TCGA and
multiple GEO cohorts identified PINK1 as a
UPRmt-associated gene significantly associated with poor
overall survival in LUSC. High PINK1 expression was reported to be
enriched in ‘focal adhesion’ and ‘PI3K/AKT-associated pathways’ and
associated with altered immune infiltration, elevated TIDE scores
and reduced predicted chemosensitivity. Functional experiments
demonstrated that PINK1 OE significantly promoted the
proliferation, migration, invasion and colony formation of LUSC
cells, whereas FAK inhibition significantly attenuated these
effects. Mechanistically, PINK1 enhanced FAK phosphorylation and
activated the downstream AKT/RhoA/vinculin signaling axis.
Collectively, these findings indicated that PINK1 contributes to
LUSC progression and may serve as a potential prognostic biomarker
and therapeutic target; however, further in vivo validation
is warranted in future research.
Supplementary Material
Supporting Data
Supporting Data
Supporting Data
Supporting Data
Acknowledgements
Not applicable.
Funding
The present study was supported by the Shanxi Provincial Youth
Scientific Research Program (grant no. 202303021222307).
Availability of data and materials
The data generated in the present study may be
requested from the corresponding author.
Authors' contributions
XL conceptualized the present study, obtained
resources, curated the data, conducted the formal analysis,
provided supervision, validated and visualized the data, wrote the
original draft. YM acquired funding for the present study,
validated and visualized the data, devised the methodology,
participated in project administration, reviewed and edited the
manuscript. XL and YM confirm the authenticity of all the raw data.
Both authors read and approved the manuscript.
Ethics approval and consent to
participate
Not applicable.
Patient consent for publication
Not applicable.
Competing interests
The authors declare that they have no competing
interests.
Glossary
Abbreviations
Abbreviations:
|
NSCLC
|
non-small cell lung cancer
|
|
LUSC
|
lung squamous cell carcinoma
|
|
UPRmt
|
mitochondrial unfolded protein
response
|
|
UPRmt−RGs
|
UPRmt-related genes
|
|
DE-UPRmt−RGs
|
differentially expressed
UPRmt−RGs
|
|
GEO
|
Gene Expression Omnibus
|
|
DEGs
|
differentially expressed genes
|
|
GSEA
|
gene set enrichment analysis
|
|
GSVA
|
gene set variation analysis
|
|
FAK
|
focal adhesion kinase
|
|
RT-qPCR
|
reverse transcription-quantitative
polymerase chain reaction
|
|
WB
|
western blotting
|
|
CCK-8
|
Cell Counting Kit-8
|
References
|
1
|
Sung H, Filho AM, Laversanne M, Ferlay J,
Siegel RL, Soerjomataram I, Jemal A and Bray F: Global cancer
statistics 2024: GLOBOCAN estimates of incidence and mortality
worldwide for 34 cancers in 186 countries. CA cancer J Clin.
76:e700902026.PubMed/NCBI
|
|
2
|
Wang Z, Shen N, Wang Z, Yu L, Yang S, Wang
Y, Liu Y, Han G and Zhang Q: TRIM3 facilitates ferroptosis in
non-small cell lung cancer through promoting SLC7A11/xCT K11-linked
ubiquitination and degradation. Cell Death Differ. 31:53–64. 2024.
View Article : Google Scholar : PubMed/NCBI
|
|
3
|
Zhang L, Wang D, Zeng L, Chen S, Li K,
Yuan T, Wang J, Ma X, Zhu S and Wu Y: FHL2 facilitates LUSC growth
and therapy resistance through PI3K/AKT/mTOR activation. J Biol
Chem. 301:1103322025. View Article : Google Scholar : PubMed/NCBI
|
|
4
|
Yi C, Zang N, Gao L and Ren F: THY1 is a
prognostic-related biomarker via mediating immune infiltration in
lung squamous cell carcinoma (LUSC). Aging (Albany NY).
16:9498–9517. 2024. View Article : Google Scholar : PubMed/NCBI
|
|
5
|
Yu X, Liu J, Xie R, Chang M, Xu B, Zhu Y,
Xie Y and Yang S: Construction of a prognostic model for lung
squamous cell carcinoma based on seven N6-methylandenosine-related
autophagy genes. Math Biosci Eng. 18:6709–6723. 2021. View Article : Google Scholar : PubMed/NCBI
|
|
6
|
Luo L, Deng J and Tang Q: A four-gene
autophagy-related prognostic model signature and its association
with immune phenotype in lung squamous cell carcinoma. Cancer Rep
(Hoboken). 7:e700002024.PubMed/NCBI
|
|
7
|
Liu BH, Xu CZ, Liu Y, Lu ZL, Fu TL, Li GR,
Deng Y, Luo GQ, Ding S, Li N and Geng Q: Mitochondrial quality
control in human health and disease. Mil Med Res.
11:322024.PubMed/NCBI
|
|
8
|
Roca-Portoles A and Tait SWG:
Mitochondrial quality control: From molecule to organelle. Cell Mol
Life Sci. 78:3853–3866. 2021. View Article : Google Scholar : PubMed/NCBI
|
|
9
|
Tang C, Cai J, Yin XM, Weinberg JM,
Venkatachalam MA and Dong Z: Mitochondrial quality control in
kidney injury and repair. Nat Rev Nephrol. 17:299–318. 2021.
View Article : Google Scholar : PubMed/NCBI
|
|
10
|
Youle RJ and van der Bliek AM:
Mitochondrial fission, fusion, and stress. Science. 337:1062–1065.
2012. View Article : Google Scholar : PubMed/NCBI
|
|
11
|
Broda M, Millar AH and Van Aken O:
Mitophagy: A mechanism for plant growth and survival. Trends Plant
Sci. 23:434–450. 2018. View Article : Google Scholar : PubMed/NCBI
|
|
12
|
Hernando-Rodríguez B and Artal-Sanz M:
Mitochondrial quality control mechanisms and the PHB (Prohibitin)
complex. Cells. 7:2382018. View Article : Google Scholar : PubMed/NCBI
|
|
13
|
Tran HC and Van Aken O: Mitochondrial
unfolded protein-related responses across kingdoms: Similar
problems, different regulators. Mitochondrion. 53:166–177. 2020.
View Article : Google Scholar : PubMed/NCBI
|
|
14
|
Zheng X, Xu H, Gong L, Cao D, Jin T, Wang
Y, Pi J, Yang Y, Yi X, Liao D, et al: Vinculin orchestrates
prostate cancer progression by regulating tumor cell invasion,
migration, and proliferation. Prostate. 81:347–356. 2021.
View Article : Google Scholar : PubMed/NCBI
|
|
15
|
Roth KG, Mambetsariev I, Kulkarni P and
Salgia R: The mitochondrion as an emerging therapeutic target in
cancer. Trends Mol Med. 26:119–134. 2020. View Article : Google Scholar : PubMed/NCBI
|
|
16
|
Zhu L, Wu W, Jiang S, Yu S, Yan Y, Wang K,
He J, Ren Y and Wang B: Pan-cancer analysis of the
mitophagy-related protein PINK1 as a biomarker for the
immunological and prognostic role. Front Oncol. 10:5698872020.
View Article : Google Scholar : PubMed/NCBI
|
|
17
|
Bueno M and Rojas M: Lost in translation:
endoplasmic reticulum-mitochondria crosstalk in idiopathic
pulmonary fibrosis. Am J Respir Cell Mol Biol. 63:408–409. 2020.
View Article : Google Scholar : PubMed/NCBI
|
|
18
|
Jiang D, Cui H, Xie N, Banerjee S, Liu RM,
Dai H, Thannickal VJ and Liu G: ATF4 mediates mitochondrial
unfolded protein response in alveolar epithelial cells. Am J Respir
Cell Mol Biol. 63:478–489. 2020. View Article : Google Scholar : PubMed/NCBI
|
|
19
|
Hou J, Aerts J, den Hamer B, van Ijcken W,
den Bakker M, Riegman P, van der Leest C, van der Spek P, Foekens
JA, Hoogsteden HC, et al: Gene expression-based classification of
non-small cell lung carcinomas and survival prediction. PLoS one.
5:e103122010. View Article : Google Scholar : PubMed/NCBI
|
|
20
|
Bueno R, Richards WG, Harpole DH, Ballman
KV, Tsao MS, Chen Z, Wang X, Chen G, Chirieac LR, Chui MH, et al:
Multi-institutional prospective validation of prognostic mRNA
signatures in early stage squamous lung cancer (Alliance). J Thorac
Oncol. 15:1748–1757. 2020. View Article : Google Scholar : PubMed/NCBI
|
|
21
|
Botling J, Edlund K, Lohr M, Hellwig B,
Holmberg L, Lambe M, Berglund A, Ekman S, Bergqvist M, Pontén F, et
al: Biomarker discovery in non-small cell lung cancer: Integrating
gene expression profiling, meta-analysis, and tissue microarray
validation. Clin Cancer Res. 19:194–204. 2013. View Article : Google Scholar : PubMed/NCBI
|
|
22
|
Der SD, Sykes J, Pintilie M, Zhu CQ,
Strumpf D, Liu N, Jurisica I, Shepherd FA and Tsao MS: Validation
of a histology-independent prognostic gene signature for
early-stage, non-small-cell lung cancer including stage IA
patients. J Thorac Oncol. 9:59–64. 2014. View Article : Google Scholar : PubMed/NCBI
|
|
23
|
Xie Y, Xiao G, Coombes KR, Behrens C,
Solis LM, Raso G, Girard L, Erickson HS, Roth J, Heymach JV, et al:
Robust gene expression signature from formalin-fixed
paraffin-embedded samples predicts prognosis of non-small-cell lung
cancer patients. Clin Cancer Res. 17:5705–5714. 2011. View Article : Google Scholar : PubMed/NCBI
|
|
24
|
Zhang S, Guo H, Wang H, Liu X, Wang M, Liu
X, Fan Y and Tan K: A novel mitochondrial unfolded protein
response-related risk signature to predict prognosis, immunotherapy
and sorafenib sensitivity in hepatocellular carcinoma. Apoptosis.
29:768–784. 2024. View Article : Google Scholar : PubMed/NCBI
|
|
25
|
Cao T, Li Q, Huang Y and Li A:
plotnineSeqSuite: A python package for visualizing sequence data
using ggplot2 style. BMC Genomics. 24:5852023. View Article : Google Scholar : PubMed/NCBI
|
|
26
|
Leek JT, Johnson WE, Parker HS, Jaffe AE
and Storey JD: The sva package for removing batch effects and other
unwanted variation in high-throughput experiments. Bioinformatics.
28:882–883. 2012. View Article : Google Scholar : PubMed/NCBI
|
|
27
|
Yi S, Qi X, Luo F, Wang D, Feng Z, Ma L,
Yu W, Wang C, Tian H and Lu M: TFIIB-related factor 2 inhibits lung
squamous carcinoma cell apoptosis through SLC8A3-mediated
mitochondrial homeostasis. Cell Death Dis. 16:4912025. View Article : Google Scholar : PubMed/NCBI
|
|
28
|
Ritchie ME, Phipson B, Wu D, Hu Y, Law CW,
Shi W and Smyth GK: limma powers differential expression analyses
for RNA-sequencing and microarray studies. Nucleic Acids Res.
43:e472015. View Article : Google Scholar : PubMed/NCBI
|
|
29
|
Wu T, Hu E, Xu S, Chen M, Guo P, Dai Z,
Feng T, Zhou L, Tang W, Zhan L, et al: clusterProfiler 4.0: A
universal enrichment tool for interpreting omics data. Innovation
(Camb). 2:1001412021.PubMed/NCBI
|
|
30
|
Newman AM, Liu CL, Green MR, Gentles AJ,
Feng W, Xu Y, Hoang CD, Diehn M and Alizadeh AA: Robust enumeration
of cell subsets from tissue expression profiles. Nat Methods.
12:453–457. 2015. View Article : Google Scholar : PubMed/NCBI
|
|
31
|
Jiang P, Gu S, Pan D, Fu J, Sahu A, Hu X,
Li Z, Traugh N, Bu X, Li B, et al: Signatures of T cell dysfunction
and exclusion predict cancer immunotherapy response. Nat Med.
24:1550–1558. 2018. View Article : Google Scholar : PubMed/NCBI
|
|
32
|
Li H, Luo B, Tulufu Y, Wang X and Yue D: A
super-enhancer-related gene signature predicts prognosis and immune
microenvironment features in glioma. Cell Mol Biol
(Noisy-le-Grand). 71:102–109. 2025. View Article : Google Scholar : PubMed/NCBI
|
|
33
|
Mayakonda A, Lin DC, Assenov Y, Plass C
and Koeffler HP: Maftools: Efficient and comprehensive analysis of
somatic variants in cancer. Genome Res. 28:1747–1756. 2018.
View Article : Google Scholar : PubMed/NCBI
|
|
34
|
Maeser D, Gruener RF and Huang RS:
oncoPredict: An R package for predicting in vivo or cancer patient
drug response and biomarkers from cell line screening data. Brief
Bioinform. 22:bbab2602021. View Article : Google Scholar : PubMed/NCBI
|
|
35
|
Liang L, Wang X, Sun B, Sun Y, Chen J,
Jiang J, Meng L, He S, Li R and Wang F: Almonertinib inhibits liver
cancer progression by triggering autophagy-dependent ferroptosis
through inhibition of the PI3K/Akt1/mTOR pathway. Biochem
Pharmacol. 245:1176282026. View Article : Google Scholar : PubMed/NCBI
|
|
36
|
Livak KJ and Schmittgen TD: Analysis of
relative gene expression data using real-time quantitative PCR and
the 2(−Delta Delta C(T)) method. Methods. 25:402–408. 2001.
View Article : Google Scholar : PubMed/NCBI
|
|
37
|
Gu MM, Gao D, Yao PA, Yu L, Yang XD, Xing
CG, Zhou J, Shang ZF and Li M: p53-inducible gene 3 promotes cell
migration and invasion by activating the FAK/Src pathway in lung
adenocarcinoma. Cancer Sci. 109:3783–3793. 2018. View Article : Google Scholar : PubMed/NCBI
|
|
38
|
Wang DG, Wang J, Gao J, Ao YQ, Long X, Zhu
SQ, Zeng ZH, Zhang LX, Chen SW, Pei X and Wu YB: Circ_0002638
drives squamous cell lung cancer (LUSC) progression and
chemotherapy resistance by inhibiting ferroptosis via
SENP1-mediated deSUMOylation of ACSL4. Life Sci. 376:1237282025.
View Article : Google Scholar : PubMed/NCBI
|
|
39
|
Deng P and Haynes CM: Mitochondrial
dysfunction in cancer: Potential roles of ATF5 and the
mitochondrial UPR. Semin Cancer Biol. 47:43–49. 2017. View Article : Google Scholar : PubMed/NCBI
|
|
40
|
Lai C, Zhang J, Tan Z, Shen LF, Zhou RR
and Zhang YY: Maf1 suppression of ATF5-dependent mitochondrial
unfolded protein response contributes to rapamycin-induced
radio-sensitivity in lung cancer cell line A549. Aging (Albany NY).
13:7300–7313. 2021. View Article : Google Scholar : PubMed/NCBI
|
|
41
|
Anderson NS and Haynes CM: Folding the
mitochondrial UPR into the integrated stress response. Trends Cell
Biol. 30:428–439. 2020. View Article : Google Scholar : PubMed/NCBI
|
|
42
|
Chen H, Zhang DM, Zhang ZP, Li MZ and Wu
HF: SIRT3-mediated mitochondrial unfolded protein response weakens
breast cancer sensitivity to cisplatin. Genes Genomics.
43:1433–1444. 2021. View Article : Google Scholar : PubMed/NCBI
|
|
43
|
Kumar R, Chaudhary AK, Woytash J, Inigo
JR, Gokhale AA, Bshara W, Attwood K, Wang J, Spernyak JA, Rath E,
et al: A mitochondrial unfolded protein response inhibitor
suppresses prostate cancer growth in mice via HSP60. J Clin Invest.
132:e1499062022. View Article : Google Scholar : PubMed/NCBI
|
|
44
|
Zeng C, Zhong L, Liu W, Zhang Y, Yu X,
Wang X, Zhang R, Kang T and Liao D: Targeting the lysosomal
degradation of Rab22a-NeoF1 fusion protein for osteosarcoma lung
metastasis. Adv Sci (Weinh). 10:e22054832023. View Article : Google Scholar : PubMed/NCBI
|
|
45
|
Agnihotri S, Golbourn B, Huang X, Remke M,
Younger S, Cairns RA, Chalil A, Smith CA, Krumholtz SL, Mackenzie
D, et al: PINK1 is a negative regulator of growth and the warburg
effect in glioblastoma. Cancer Res. 76:4708–4719. 2016. View Article : Google Scholar : PubMed/NCBI
|
|
46
|
Liu L, Zuo Z, Lu S, Wang L, Liu A and Liu
X: Silencing of PINK1 represses cell growth, migration and induces
apoptosis of lung cancer cells. Biomed Pharmacother. 106:333–341.
2018. View Article : Google Scholar : PubMed/NCBI
|
|
47
|
Rose K, Herrmann E, Kakudji E, Lizarrondo
J, Celebi AY, Wilfling F, Lewis SC and Hurley JH: In situ cryo-ET
visualization of mitochondrial depolarization and mitophagic
engulfment. Proc Natl Acad Sci USA. 122:e25118901222025. View Article : Google Scholar : PubMed/NCBI
|
|
48
|
Li Y, Qiu L, Liu X, Hou Z and Yu B: PINK1
alleviates myocardial hypoxia-reoxygenation injury by ameliorating
mitochondrial dysfunction. Biochem Biophys Res Commun. 484:118–124.
2017. View Article : Google Scholar : PubMed/NCBI
|
|
49
|
Zhang R, Gu J, Chen J, Ni J, Hung J, Wang
Z, Zhang X, Feng J and Ji L: High expression of PINK1 promotes
proliferation and chemoresistance of NSCLC. Oncol Rep.
37:2137–2146. 2017. View Article : Google Scholar : PubMed/NCBI
|
|
50
|
Hu HH, Wang SQ, Shang HL, Lv HF, Chen BB,
Gao SG and Chen XB: Roles and inhibitors of FAK in cancer: Current
advances and future directions. Front Pharmacol. 15:12742092024.
View Article : Google Scholar : PubMed/NCBI
|
|
51
|
Chuang HH, Zhen YY, Tsai YC, Chuang CH,
Hsiao M, Huang MS and Yang CJ: FAK in cancer: From mechanisms to
therapeutic strategies. Int J Mol Sci. 23:17262022. View Article : Google Scholar : PubMed/NCBI
|
|
52
|
Dawson JC, Serrels A, Stupack DG,
Schlaepfer DD and Frame MC: Targeting FAK in anticancer combination
therapies. Nat Rev Cancer. 21:313–324. 2021. View Article : Google Scholar : PubMed/NCBI
|
|
53
|
Canel M, Sławińska AD, Lonergan DW, Kallor
AA, Upstill-Goddard R, Davidson C, von Kriegsheim A, Biankin AV,
Byron A, Alfaro J and Serrels A: FAK suppresses antigen processing
and presentation to promote immune evasion in pancreatic cancer.
Gut. 73:131–155. 2023. View Article : Google Scholar : PubMed/NCBI
|
|
54
|
Zhang P, Cao X, Guan M, Li D, Xiang H,
Peng Q, Zhou Y, Weng C, Fang X, Liu X, et al: CPNE8 promotes
gastric cancer metastasis by modulating focal adhesion pathway and
tumor microenvironment. Int J Biol Sci. 18:4932–4949. 2022.
View Article : Google Scholar : PubMed/NCBI
|
|
55
|
Zhang C, Yu Z, Yang S, Liu Y, Song J, Mao
J, Li M and Zhao Y: ZNF460-mediated circRPPH1 promotes TNBC
progression through ITGA5-induced FAK/PI3K/AKT activation in a
ceRNA manner. Mol Cancer. 23:332024. View Article : Google Scholar : PubMed/NCBI
|
|
56
|
Paul R, Luo M, Mo X, Lu J, Yeo SK and Guan
JL: FAK activates AKT-mTOR signaling to promote the growth and
progression of MMTV-Wnt1-driven basal-like mammary tumors. Breast
Cancer Res. 22:592020. View Article : Google Scholar : PubMed/NCBI
|
|
57
|
Roudsari NM, Lashgari NA, Momtaz S, Abaft
S, Jamali F, Safaiepour P, Narimisa K, Jackson G, Bishayee A,
Rezaei N, et al: Inhibitors of the PI3K/Akt/mTOR pathway in
prostate cancer chemoprevention and intervention. Pharmaceutics.
13:11952021. View Article : Google Scholar : PubMed/NCBI
|
|
58
|
Dong C, Wu J, Chen Y, Nie J and Chen C:
Activation of PI3K/AKT/mTOR pathway causes drug resistance in
breast cancer. Front Pharmacol. 12:6286902021. View Article : Google Scholar : PubMed/NCBI
|
|
59
|
Zhang B, Li S, Ding J, Guo J, Ma Z and
Duan H: Rho-GTPases subfamily: Cellular defectors orchestrating
viral infection. Cell Mol Biol Lett. 30:552025. View Article : Google Scholar : PubMed/NCBI
|
|
60
|
Tseliou M, Al-Qahtani A, Alarifi S,
Alkahtani SH, Stournaras C and Sourvinos G: The role of RhoA, RhoB
and RhoC GTPases in Cell morphology, proliferation and migration in
human cytomegalovirus (HCMV) infected glioblastoma cells. Cell
Physiol Biochem. 38:94–109. 2016. View Article : Google Scholar : PubMed/NCBI
|
|
61
|
Merkel CD, Li Y, Raza Q, Stolz DB and
Kwiatkowski AV: Vinculin anchors contractile actin to the
cardiomyocyte adherens junction. Mol Biol Cell. 30:2639–2650. 2019.
View Article : Google Scholar : PubMed/NCBI
|
|
62
|
Lim J, Kang M, Ahn YH, Cho MS, Lee JH,
Kang JL and Choi YH: Comprehensive profiling of serum exosomes by a
multi-omics approach reveals potential diagnostic markers for brain
metastasis in lung cancer. Cancers (Basel). 17:19292025. View Article : Google Scholar : PubMed/NCBI
|