Introduction
Prostate cancer is one of the most prevalent
malignancies and a leading cause of cancer-related mortality
worldwide. In the United States, it is estimated that 333,830 new
cases and 36,320 deaths will occur in 2026, with prostate cancer
accounting for ~31% of all newly diagnosed cancers in men (1–5).
Despite widespread clinical use of prostate-specific antigen (PSA)
for prostate cancer diagnosis, its limited specificity and
sensitivity frequently result in both false-positive and
false-negative results (6–8). Conventional diagnostic approaches,
such as digital rectal examination and transrectal
ultrasound-guided biopsy, are invasive and insufficient for
accurate early detection in clinically ambiguous cases (3). Although advances in surgery and
robotics have improved local disease management, mechanistically
informed biomarkers and therapeutic targets must be identified to
enable accurate detection of prostate cancer progression at the
molecular level (9,10). Together, these limitations represent
a major gap in the understanding of the regulatory circuits
underlying prostate cancer progression and therapeutic resistance.
Emerging evidence suggests that prostate cancer progression is
governed not only by canonical oncogenic signaling pathways but
also by cytoskeletal architecture, intracellular transport systems
and primary cilium dynamics. These structural and spatial
regulatory systems have increasingly been recognized as
higher-order determinants of cellular plasticity, lineage
adaptability and metastatic competence. However, the upstream
molecular nodes integrating these processes into coordinated
oncogenic programs remain poorly defined, representing a major
conceptual gap in prostate cancer biology. Dynein heavy chain
domain 1 (DNHD1) is classified as a member of the
coiled-coil domain-containing family, characterized by multiple
coiled-coil regions within its protein structure (11). Exome sequencing profiles have
revealed potential associations between truncating mutations in
DNHD1 and intellectual disability (12) and between missense mutations and
severe fetal anomaly syndromes (13). Furthermore, the biallelic variants
of DNHD1 are associated with male infertility (14,15).
DNHD1 can undergo epigenetic methylation in lead-exposed
uterine and brain tissues, which alters its expression levels
(16). The importance of
DNHD1 in the brain may be related to its role in signal
transmission, particularly as a component of the cytoplasmic dynein
dimer (17). In the context of
vascular structural functions, DNHD1 is associated with
congenital heart defects (13,18);
in particular, DNHD1 methylation is correlated with cardiac
wall thickness (19). Studies using
the zebrafish model have demonstrated involvement of DNHD1 in
Kupffer's vesicle organogenesis and ciliogenesis (20). In cancer research, mutations in
DNHD1 have been identified in epithelioid glioblastoma and
pancreatic cancer; however, their precise biological functions
remain unclear (21,22). Although rotundine treatment can
inhibit DNHD1 in colorectal cancer cells (23), its prognostic value and molecular
mechanisms in cancer biology, particularly prostate cancer, remain
to be elucidated.
Histone deacetylase 6 (HDAC6), a cytoplasmic
deacetylase, functions as a central regulator of microtubule
dynamics, proteostasis and primary cilium disassembly (24–26).
In prostate cancer, HDAC6 regulates α-tubulin acetylation and
stabilizes androgen receptor (AR) signaling output, promoting tumor
growth, lineage plasticity and resistance to androgen deprivation
therapy (ADT) (27–29). Notably, HDAC6 has also emerged as a
pharmacologically actionable target, with selective inhibitors
demonstrating antitumor activity through disruption of cytoskeletal
integrity and oncogenic signaling networks (30,31).
Despite these advances, the upstream regulatory mechanisms
underlying HDAC6 expression and its integration into broader
signaling hierarchies in prostate cancer remain unclear.
The present study hypothesized that DNHD1 functions
as an upstream regulatory node integrating cytoskeletal
organization with HDAC6-dependent oncogenic signaling in prostate
cancer. Through integrated analyses of clinical cohorts,
transcriptomic datasets and functional assays, the present study
identified DNHD1 as a previously underrecognized promoter of
prostate cancer cell aggressiveness. The present study demonstrated
that DNHD1 expression is consistently upregulated in
advanced prostate cancer and associated with poor clinical outcomes
across independent cohorts. Mechanistically, the present study
defined HDAC6 as a downstream effector of DNHD1 and
established a DNHD1-HDAC6 axis that regulates tumor cell
proliferation, invasion and metastatic potential. Notably,
pharmacological inhibition of HDAC6 effectively suppresses
DNHD1-mediated oncogenic phenotypes in vitro,
revealing a potential therapeutic vulnerability within this axis.
In addition to providing functional validation, the findings of the
present study position DNHD1-HDAC6 signaling as a higher-order
regulatory axis integrating cytoskeletal remodeling, ciliary
dynamics and AR signaling in prostate cancer. In general, these
findings indicated that DNHD1-HDAC6, a previously underrecognized
regulatory axis, links structural cellular organization to
oncogenic signaling hierarchies in prostate cancer. In particular,
the present study suggested that DNHD1 may be associated with
prostate cancer cell aggressive phenotypes, providing a preliminary
conceptual framework for further exploration of the
cytoskeleton-cilium-AR regulatory network in advanced prostate
cancer, which warrants future in vivo and prospective
clinical validation.
Materials and methods
Study design and overall analytical
framework
The present study integrated transcriptomic
analyses, computational network modeling, in vitro
functional assays and pharmacological perturbation experiments to
characterize the DNHD1-HDAC6 axis in prostate cancer. Publicly
available datasets were systematically analyzed to evaluate gene
expression patterns, clinical associations, functional pathways and
prognostic significance. Experimental validation was performed in
prostate cancer cell lines with distinct AR and lineage states. A
systems biology framework was employed to identify downstream
effectors and infer regulatory hierarchies and mechanistic
validation and therapeutic targeting were subsequently
employed.
Transcriptomic datasets and cohort
selection
Gene expression profiles were obtained from The
Cancer Genome Atlas (TCGA)-prostate adenocarcinoma (PRAD) cohort,
Gene Expression Omnibus (GEO) (https://www.cancer.gov/ccg/research/genome-sequencing/tcga)
and additional independent datasets (GSE21032, GSE35988, GSE48403
and GSE36133: https://www.ncbi.nlm.nih.gov/geo/query/acc.cgi?acc=GSE21032;
https://www.ncbi.nlm.nih.gov/geo/query/acc.cgi?acc=GSE35988;
https://www.ncbi.nlm.nih.gov/geo/query/acc.cgi?acc=GSE48403;
http://www.ncbi.nlm.nih.gov/geo/query/acc.cgi?acc=GSE36133).
Cross-platform pancancer datasets, including Cell 2015 (https://www.cbioportal.org/study/summary?id=prad_tcga_pub),
Firehose Legacy (https://www.cbioportal.org/study/summary?id=prad_tcga)
and PanCancer Atlas (https://www.cbioportal.org/study/summary?id=prad_tcga_pan_can_atlas_2018),
were used for comparative oncogenomic analyses. Raw or processed
expression matrixes were retrieved and harmonized across datasets
by using platform-specific normalization strategies.
Log2-transformed expression values were used for downstream
analyses when available. Samples were stratified according to
clinical annotations, including tumor stage, Gleason score,
metastatic status and treatment history.
Differential expression and pancancer
analysis
The differential gene expression between tumor and
normal tissues, as well as between early- and late-stage tumors,
was assessed using nonparametric statistical frameworks suitable
for RNA-sequencing and microarray data distributions. Genes
associated with tumor progression were identified through
stage-stratified comparisons. Pancancer expression profiling was
conducted across multiple epithelial malignancies to determine the
tumor-type specificity of DNHD1 and HDAC6
dysregulation.
Clinicopathological association
analysis
The present study evaluated associations between
gene expression and clinicopathological variables, including
pathological T and N stage, Gleason score, residual tumor status
and treatment exposure, by using Spearman rank correlation
analysis. Stratified subgroup analyses were performed to assess
expression trends across disease severity gradients. A two-sided
P<0.05 was considered to indicate significance.
Survival and prognostic modeling
Overall survival (OS) analyses were performed using
the online tool Gene Expression Profiling Interactive Analysis
(GEPIA2) (http://gepia2.cancer-pku.cn). For the analyses of
disease-free interval (DFI) and progression-free interval (PFI) in
the TCGA-PRAD cohort, as well as shorter disease-free survival
(DFS) in the GSE21032 dataset, raw clinical data were extracted
from the respective supplementary tables and analyzed using
Kaplan-Meier survival models. Patients were stratified into high-
and low-expression groups on the basis of median gene expression
thresholds, unless otherwise specified. Hazard ratios (HR) and 95%
confidence intervals (Cis) were estimated using Cox proportional
hazards regression models. Combined gene signature analyses were
performed using dual-gene stratification models to assess additive
prognostic effects.
Correlation-based systems biology and
network construction
To construct DNHD1-associated regulatory
networks, correlation analyses were performed across the TCGA-PRAD
and multiple independent prostate cancer transcriptomic cohorts.
Genes with Spearman's ρ≥0.3 or Spearman's ρ≤-0.3 relative to
DNHD1 were defined as DNHD1-associated gene sets. To
increase robustness and reduce cohort-specific bias, the present
study generated integrated gene lists by using intersection
analysis across multiple independent datasets. The resulting gene
networks were subjected to downstream pathway enrichment
analysis.
Pathway enrichment and functional
annotation
Functional enrichment analysis was performed using
ingenuity pathway analysis (IPA). Canonical pathways, upstream
regulatory networks and disease and function annotations were
evaluated on the basis of enrichment significance scores
(−log10 P). Biological processes associated with
cytoskeletal remodeling, vesicular trafficking, organelle
organization, metabolic reprogramming and cilium assembly were
specifically interrogated. In Gene Ontology classification, the
present study focused on structural cellular organization pathways,
particularly those related to microtubule dynamics and ciliary
regulation.
Construction of DNHD1-HDAC6
coregulatory gene signature
Genes positively correlated with both DNHD1 and
HDAC6 were identified through Venn-based integration across
transcriptomic datasets. To ensure inclusion of only protein-coding
genes, pseudogenes and long noncoding RNAs were filtered out. The
resulting gene set, defined as the DNHD1-HDAC6 downstream
transcriptional signature, was used for correlation analysis and
survival modeling.
Cell lines and culture conditions
Human prostate cancer cell lines representing
different AR and lineage states were used: LNCaP (cat. no. BCRC
60088), PC-3 (cat. no. BCRC 60122), 22RV1 (cat. no. BCRC 60545) and
DU145 (cat. no. BCRC 60348) cells lines were purchased from the
Bioresource Collection and Research Center. Cells were maintained
under standard conditions (37°C; 5% CO2) in appropriate
culture media supplemented with fetal bovine serum and antibiotics
(32,33). Cell line identity was consistent
with American Type Culture Collection or validated repositories and
cells were routinely tested for contamination.
Generation of stable knockdown and
overexpression models
DNHD1, E2F6 and HDAC6 expression was
modulated using a 2nd-generation lentiviral shRNA-mediated
knockdown and cDNA overexpression systems (Table SI). Lentiviral particles were
generated by co-transfecting HEK-293T cells (obtained from the
Bioresource Collection and Research Center; cat. no. BCRC 60019)
with pLKO.1-shRNA or pLenti6/V5-DEST-cDNA transfer plasmids,
alongside the packaging plasmid pCMVΔR8.9 and envelope plasmid
pMD.G at a mass ratio of 4:3:1 (total 10 µg plasmid per 10-cm dish:
5 µg transfer plasmid, 3.75 µg pCMVΔR8.9, and 1.25 µg pMD.G) using
Lipofectamine® 3000 (Thermo Fisher Scientific,
Inc.).
Lentiviral supernatants were harvested at 48 and 72
h post-transfection, filtered through a 0.45-µm membrane filter,
and stored at −80°C. To establish stable cell populations, target
cells were transduced at a multiplicity of infection (MOI) of 5 in
the presence of 8 µg/ml polybrene. Stable knockdown cell lines were
selected with 2 µg/ml puromycin for 3 days and maintained in 0.5
µg/ml puromycin. Stable overexpression cell lines were selected
with 5 µg/ml blasticidin for 4 days and maintained in 2 µg/ml
blasticidin. Subsequent experiments were performed 48 h
post-selection. Knockdown and overexpression efficiency were
validated using reverse transcription-quantitative (RT-q) PCR and
immunoblotting (32,33).
RNA extraction, RT-qPCR and chromatin
immunoprecipitation
Target cells were seeded at a density of
1×10⁶ cells/well prior to RNA extraction. Total RNA
extraction, cDNA synthesis, and qPCR assays were performed strictly
according to the manufacturers' protocols. Total RNA was isolated
and reverse transcription was performed to generate cDNA using the
TOOLSQuant II Fast RT Kit (cat. no. KRT-BA06-2; BIOTOOLS Co.,
Ltd.). Gene expression levels were quantified using SYBR
Green-based qPCR assays with PowerTrack SYBR Green Master Mix (cat.
no. A46012; Applied Biosystems; Thermo Fisher Scientific, Inc.;
Table SII). Relative expression
was calculated using the 2−ΔΔCq method (34), with housekeeping genes as internal
normalization controls. For promoter binding analysis, potential
E2F6-binding motifs within the HDAC6 promoter region
were identified using a bioinformatic sequence prediction tool
(JASPAR database). A putative E2F6-binding site (5′-GAGAGGGAAGA-3′,
positions −781 to −770 bp relative to the transcription start site)
was identified within the HDAC6 promoter. Chromatin
immunoprecipitation was performed using the EZ-Magna ChIP A/G kit
(MilliporeSigma) according to the manufacturer's instructions. In
brief, target cells were harvested at a density of 1×10⁷ cells per
ChIP reaction and cross-linked with 1% formaldehyde
(MilliporeSigma) to fix protein-DNA complexes. Chromatin was
sheared by sonication using an Ultrasonic Disruptor UD-201 (TOMY
Digital Biology Co., Ltd.; 15 cycles of 30 sec on/30 sec off at
4°C) to yield DNA fragments ranging from 200–1,000 bp, which were
verified by agarose gel electrophoresis. A portion of the clarified
lysate (10%) was saved as Input DNA for normalization. Cell lysates
(100 µg per reaction) were immunoprecipitated with anti-E2F6 (2
µg/reaction; cat. no. 31464-1-AP; Proteintech Group, Inc.) or
control IgG (2 µg/reaction; cat. no. 30000-0-AP; Proteintech Group,
Inc.) overnight (12–16 h) at 4°C with magnetic A/G beads.
Immunocomplexes were washed sequentially with Low Salt, High Salt,
LiCl and TE Wash Buffers provided in the kit. Specific promoter DNA
fragments encompassing the predicted E2F6 binding motif
(positions −781 to −770 bp) were subsequently amplified and
quantified through qPCR using PowerTrack SYBR Green Master Mix
(cat. no. A46012; Applied Biosystems; Thermo Fisher Scientific,
Inc.). The thermocycling conditions were: Initial denaturation at
95°C for 3 min; 35 cycles of denaturation at 95°C for 30 sec,
annealing at 58°C for 30 sec and elongation at 72°C for 30 sec;
followed by a final extension at 72°C for 5 min. The ChIP
enrichment efficiency was determined using the Percent Input
approach. Briefly, the Cq value of the 10% Input fraction was
adjusted for dilution [ΔCq (Input)=Cq (Input)-log2(10)], and the
percent input was calculated using the formula: %
Input=100×2[ΔCq (Input)-Cq [ChIP)]. Signal acquisition
and quantitative processing were carried out using QuantStudio
Design and Analysis Software (version 1.3; Applied Biosystems;
Thermo Fisher Scientific, Inc.).
Protein extraction and
immunoblotting
Whole-cell lysates were prepared using TOOLS RIPA
Lysis Buffer (cat. no. TAAR-ZBZ5; BIOTOOLS Co., Ltd.) supplemented
with protease and phosphatase inhibitors. Protein concentrations
were determined using the Bio-Rad Protein Assay Kit II (cat. no.
5000002; Bio-Rad Laboratories, Inc.) based on the Bradford
method.
Total protein (30–60 µg per lane) was separated
through sodium dodecyl sulfate-polyacrylamide gel electrophoresis
on 12% polyacrylamide gels and transferred onto polyvinylidene
difluoride membranes. These membranes were blocked with 5% non-fat
milk in Tris-buffered saline with 0.1% Tween-20 for 1 h at room
temperature. Membranes were then incubated overnight at 4°C with
antibodies against DNHD1 (cat. no. PAU491Hu01; CLOUD-CLONE CORP),
E2F6 (cat. no. 31464-1-AP; Proteintech Group, Inc.), HDAC6 (cat.
no. 67250-1-lg; Proteintech Group, Inc.), α-tubulin (cat. no. 2144;
Cell Signaling Technology, Inc.), acetylated α-tubulin (cat. no.
3971; Cell Signaling Technology, Inc.), AR (cat. no. 54653; Cell
Signaling Technology, Inc.) and PSA (cat. no. 2475; Cell Signaling
Technology, Inc.). Followed primary antibody incubation, membranes
were washed and incubated with horseradish peroxidase
(HRP)-conjugated secondary antibodies, including Goat Anti-Rabbit
IgG (H+L) HRP (1:5,000; cat. no. GTX213110-01; GeneTex, Inc.) or
Goat Anti-Mouse IgG HRP (1:5,000; cat. no. GTX213111-01; GeneTex,
Inc.), for 1 h at room temperature. Protein signals were detected
using chemiluminescence and quantified, as necessary. Protein bands
were visualized using SuperKine West Femto Maximum Sensitivity
Substrate (cat. no. BMU102-EN; Abbkine Scientific Co., Ltd.;
distributed by Proteintech Group, Inc.) and captured using the
Bio-Rad ChemiDoc MP Imaging System (Bio-Rad Laboratories, Inc.).
Protein bands were visualized using SuperKine West Femto Maximum
Sensitivity Substrate (cat. no. BMU102-EN.; distributed by
Proteintech Group, Inc.) and captured using the Bio-Rad ChemiDoc MP
Imaging System (Bio-Rad Laboratories, Inc.). Densitometric analysis
was performed using Image Lab Software (version 6.1; Bio-Rad
Laboratories, Inc.), with β-Actin (cat. no. GTX26276; GeneTex,
Inc.) serving as the internal loading control for
normalization.
Cell proliferation and clonogenic
assays
For cell proliferation assays, target cells were
seeded into 96-well plates at a density of 2×10³
cells/well and cultured at 37°C in a humidified incubator
containing 5% CO2. Cell proliferation was evaluated
using AlamarBlue Cell Viability Reagent (cat. no. DAL1025;
Invitrogen; Thermo Fisher Scientific, Inc.) strictly following the
manufacturer's protocol. Briefly, AlamarBlue reagent was added to
each well (10% of total volume), and cells were incubated for 2–4 h
at 37°C. Fluorescence/absorbance was measured using a microplate
reader at defined time points. For colony formation assays, cells
were seeded into 6-well plates at a density of 2×10³
cells/well and cultured at 37°C in a 5% CO2 atmosphere
for 14 days to allow colony development. Following incubation,
culture media were discarded, and cells were fixed with a
methanol-acetic acid mixture (7:1, v/v) for 30 min at room
temperature. The fixed cells were subsequently stained with 0.1%
crystal violet solution (MilliporeSigma) for 30 min at room
temperature and gently rinsed with distilled water. Stained plates
were imaged, and colonies were captured under a stereomicroscope.
Colony quantification was performed using ImageJ software (version
1.53t; National Institutes of Health) via the Analyze Particles
plugin after thresholding.
Migration and invasion assays
Cell migration and invasive capacities were
evaluated using a 48-well microchemotaxis Boyden chamber system
(Neuro Probe, Inc.) to assess cell motility and invasive capacity.
For the invasion assays, polycarbonate membranes with an 8-µm pore
size (Neuro Probe, Inc.) were pre-coated with Matrigel (BD
Biosciences; Corning, Inc.; diluted 1:8 in serum-free medium) at
37°C for 1 h to form a reconstituted basement membrane. Uncoated
membranes were used for migration assays. Target cells were
harvested, washed, and resuspended in serum-free culture medium. A
total of 2×10⁴ cells in 50 µl of serum-free medium (with or without
specified drug treatments) were loaded into the upper chamber
wells. The lower chamber wells were filled with 25–30 µl of culture
medium supplemented with 10% fetal bovine serum (FBS; Thermo Fisher
Scientific, Inc.) as a chemoattractant. The chamber was assembled
and incubated at 37°C in a humidified 5% CO2 atmosphere
for 24 h (migration) or 48 h (invasion). After incubation,
non-migrated cells on the upper surface of the membrane were gently
scraped off using a cotton swab. Cells that migrated or invaded
cells were fixed with 4% paraformaldehyde (or methanol-acetic acid
7:1) for 15–30 min at room temperature and stained with Giemsa
stain solution (cat. no. G5637; MilliporeSigma) for 20–30 min at
room temperature. Stained membranes were mounted, and
migratory/invasive cells were visualized and captured using an
inverted light microscope (Olympus Corporation). Cell numbers were
quantified across three randomly selected high-power microscopic
fields per well using ImageJ software (version 1.53t; National
Institutes of Health) (32,33).
Pharmacological inhibition of
HDAC6
To selectively inhibit HDAC6 catalytic activity,
human prostate cancer LNCaP cells were seeded in multi-well plates
and allowed to adhere overnight at 37°C in a humidified atmosphere
containing 5% CO2. Cells were then treated with
Tubastatin A (cat. no. HY-13271A; MedChemExpress) at indicated
concentrations (5 and 10 µM) or with dimethyl sulfoxide (DMSO;
MilliporeSigma) as the vehicle control for 24 h at 37°C. The final
concentration of DMSO in the culture medium was maintained below
0.1% (v/v) across all experimental groups. The efficacy and
specificity of enzymatic HDAC6 inhibition were verified by
evaluating the hyperacetylation levels of its downstream substrate,
acetylated α-tubulin, via immunoblotting.
Epistasis and rescue experiments
To establish functional dependency, combinatorial
gain-of-function and loss-of-function experiments were performed in
prostate cancer cells (LNCaP, PC-3) using a lentiviral gene
delivery system. For DNHD1 overexpression, prostate cancer cells
were transduced with recombinant lentiviruses encoding full-length
DNHD1 cDNA cloned into the pLenti6/V5-DEST Gateway vector (cat. no.
V49610; Invitrogen; Thermo Fisher Scientific, Inc.) or an empty
destination control vector. Transductions were performed at 37°C
for 24 h in the presence of 8 µg/ml Polybrene (hexadimethrine
bromide; MilliporeSigma). To establish stable DNHD1-overexpressing
populations, cells were selected with Blasticidin (5.0 µg/ml; cat.
no. A1113903; Gibco; Thermo Fisher Scientific, Inc.) for 5–7 days.
Subsequently, DNHD1-overexpressing cells were transduced with
lentiviral particles expressing specific short hairpin RNA
targeting HDAC6 (sh-HDAC6; pLKO.1-shHDAC6) or a non-targeting
scramble control shRNA (sh-NC) at an optimized multiplicity of
infection (MOI=10-20) with 8 µg/ml Polybrene at 37°C for 24 h.
Transduced cells were co-selected with Puromycin (2.0 µg/ml;
MilliporeSigma) for 48–72 h. Overexpression and knockdown
efficiencies were validated at 48–72 h post-transduction via
RT-qPCR and immunoblotting (using an anti-V5 tag antibody for
exogenous DNHD1 detection). Transduced cells were harvested and
re-seeded into downstream functional assays to evaluate rescue
outcomes, including cell proliferation (48 h readout),
clonogenicity (14 days incubation), and Boyden chamber
migration/invasion assays (24–48 h incubation) under standard
conditions (37°C; 5% CO2).
Statistical analysis
All statistical analyses were conducted using R
(version 4.3.1; R Foundation for Statistical Computing, Vienna,
Austria). Data were presented as means ± standard deviations,
unless otherwise stated. Between-group comparisons were performed
using unpaired Student's t-test, depending on relevant distribution
assumptions. Correlation was assessed using Spearman rank
correlation analysis. Survival significance was assessed using
log-rank tests and Cox proportional hazards regression models.
P<0.05 was considered to indicate a statistically significant
difference.
Results
Dysregulated DNHD1 expression is
correlated with unfavorable prostate cancer prognosis
To identify genes associated with advanced prostate
cancer and to determine progression-associated transcriptional
alterations, transcriptomic profiles from TCGA-PRAD) cohort were
stratified by tumor stage (T2a vs. T4). Differential expression
analysis revealed a gene subset markedly upregulated in
higher-stage tumors; among these genes, DNHD1 was
consistently enriched (Fig. 1A),
suggesting that it is involved in prostate cancer progression
rather than in tumor maintenance alone. In the TCGA-PRAD cohort,
DNHD1 expression was markedly elevated in tumor tissues
compared with adjacent nontumor tissues (P=0.0003; Fig. 1B; Table
SIII), further corroborating its association with malignant
transformation. Pancancer analysis demonstrated that DNHD1
upregulation occurs not only in prostate cancer but also across
various epithelial malignancies, including cholangiocarcinoma,
colon adenocarcinoma (COAD), head and neck squamous cell carcinoma,
renal clear cell carcinoma (KIRC), hepatocellular carcinoma and
rectal adenocarcinoma (Fig. 1C).
However, prognostic stratification analysis revealed that
DNHD1-associated high-risk clinical outcomes were most
consistently observed in PRAD, KIRC and COAD (Fig. 1D), suggesting that DNHD1 has
a context-dependent functional relevance in tumor progression
rather than a universal oncogenic role. Notably, DNHD1
expression was significantly and positively correlated with Gleason
score in prostate cancer tissues (P<0.0001; Fig. 1E). Moreover, it increased
progressively across stratified Gleason grading groups (Fig. 1F; Table
SIV), suggesting that DNHD1 expression is strongly
associated with histopathological severity and tumor
aggressiveness. To validate these findings across independent
datasets, multiple external prostate cancer cohorts (GSE21032,
GSE35988 and GSE48403) were analyzed (Fig. 1G; Table
SV). Consistent with the observations in TCGA-PRAD,
DNHD1 expression was markedly upregulated in GSE21032.
Elevated DNHD1 expression was also observed in both
localized prostate cancer and metastatic castration-resistant
prostate cancer (mCRPC) tissues, suggesting its persistence
throughout disease progression and metastatic evolution. Notably,
ADT was associated with further upregulation of DNHD1
expression, indicating its potential involvement in
therapy-adaptive transcriptional reprogramming. Survival analysis
using TCGA-PRAD cohort data demonstrated that higher DNHD1
expression was significantly associated with poorer overall
survival (OS; P=0.039, HR=3.8) and shorter disease-free survival
(DFS; P=3.7×10⁻⁵; HR=2.4; Fig. 1H). These prognostic associations
were independently validated in the GSE21032 cohort, where
DNHD1 expression also correlated with shorter DFS (P=0.0034,
HR=3.443, 95% CI=1.494–7.931; Fig.
1I; Table SVI). Taken
together, these results suggest that in prostate cancer,
DNHD1 is not only differentially expressed but also
associated with a transcriptional program linked to progression,
histopathological severity and adverse clinical outcomes. These
consistent associations across independent cohorts further
corroborate the potential role of DNHD1 as a
progression-associated molecular indicator in prostate cancer.
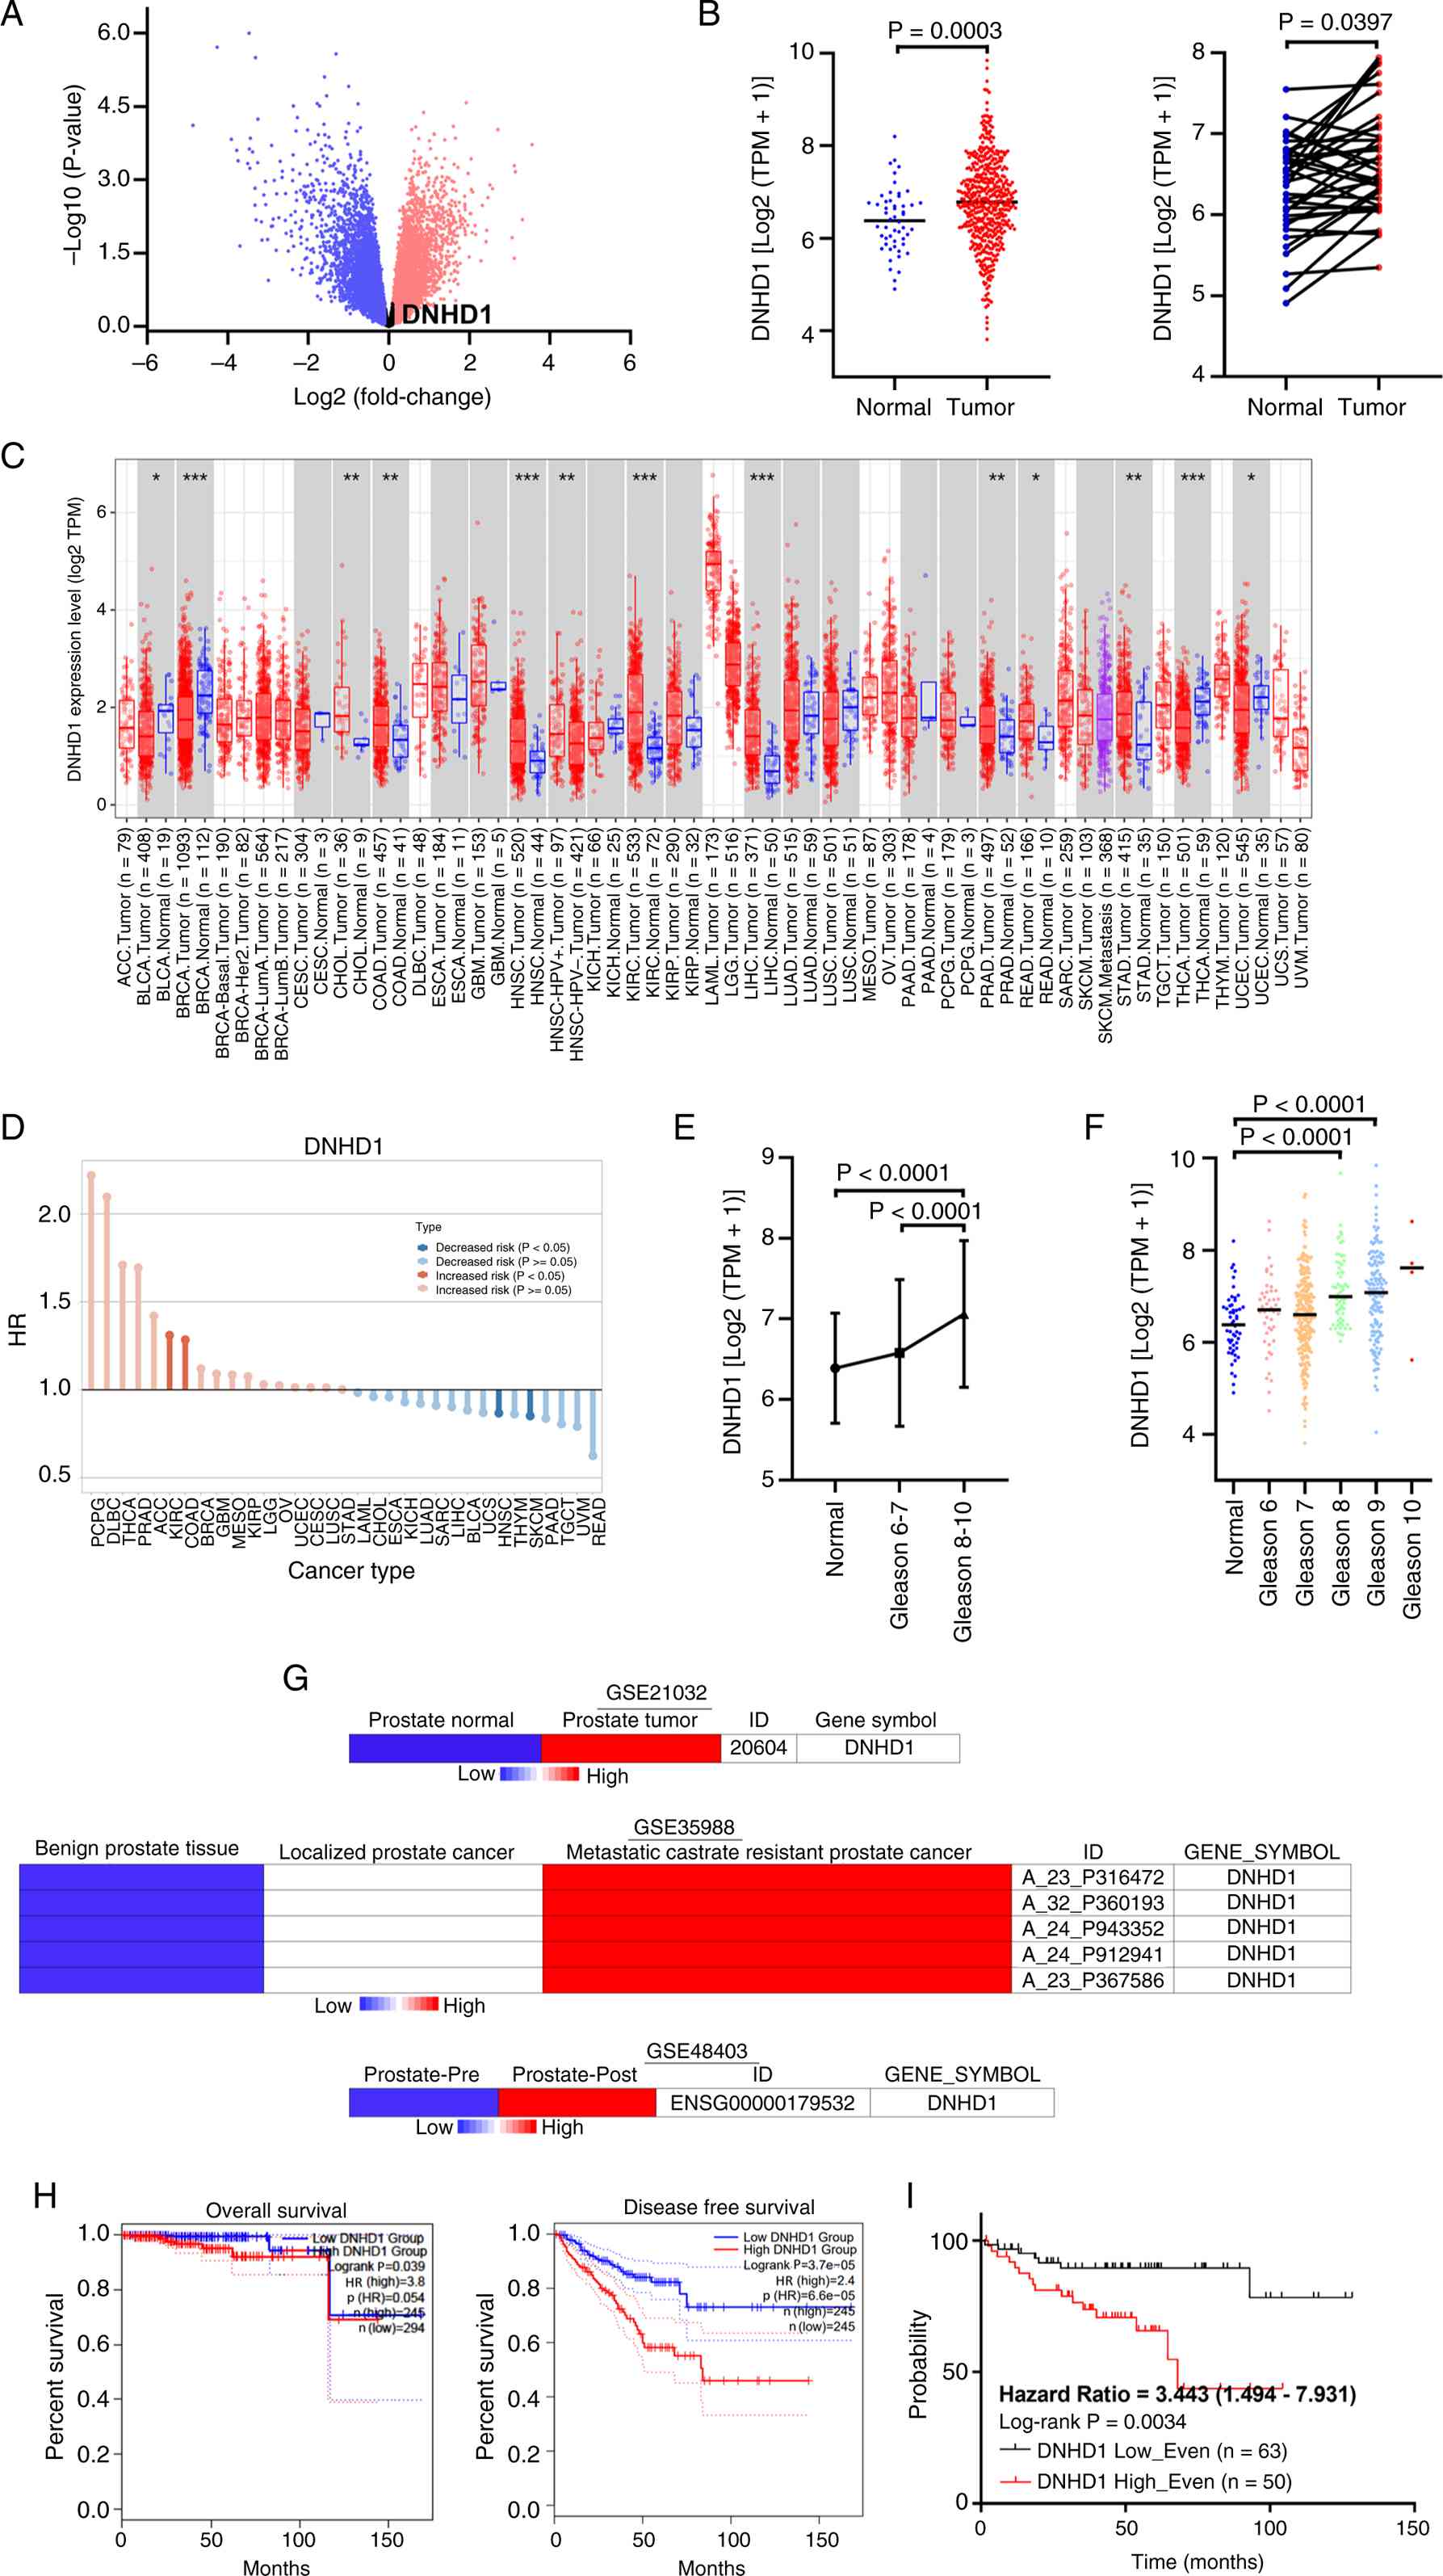 | Figure 1.Dysregulation of DNHD1
expression is associated with prostate cancer progression and
unfavorable clinical outcomes. (A) Differential expression analysis
of TCGA-PRAD transcriptomic profiles stratified by pathological
stage (T2a vs. T4), indicating DNHD1 as one of the
transcripts markedly enriched in advanced prostate cancer. (B)
DNHD1 expression levels in paired prostate tumor and
adjacent nontumor tissues from the TCGA-PRAD cohort, indicating
increased DNHD1 expression in tumor specimens. (C) Pancancer
expression profiling of DNHD1 across TCGA-PRAD cohorts,
indicating differential expression patterns among multiple human
cancer types. (D) Pancancer prognostic analyses of association
between DNHD1 expression and clinical outcome across
distinct tumor types, indicating that PRAD, KIRC and COAD are tumor
entities with significant DNHD1-associated prognostic
stratification. (E) Αnalysis between DNHD1 expression and
Gleason score in prostate cancer specimens. (F) Distribution of
DNHD1 expression across stratified Gleason grade score in
the TCGA-PRAD cohort. (G) Validation of DNHD1 expression
patterns in independent prostate cancer cohorts (GSE21032, GSE35988
and GSE48403), including benign prostate tissues as well as
localized prostate cancer, mCRPC and ADT-associated prostate cancer
tissues. (H) Kaplan-Meier survival analyses of OS and DFS according
to DNHD1 expression status in the TCGA-PRAD cohort. (I)
Independent validation of prognostic significance of DNHD1
expression for DFS in GSE21032. *P<0.05, **P<0.01,
***P<0.001. DNHD1, dynein heavy chain domain 1; TCGA, The Cancer
Genome Atlas; TPM, transcripts per million; mCRPC, metastatic
castration-resistant prostate cancer; ADT, androgen deprivation
therapy; OS, overall survival; DFS, disease-free survival; HR,
hazard ratio; GEO, Gene Expression Omnibus; ACC, Adrenocortical
Carcinoma; BLCA, Bladder Urothelial Carcinoma; BRCA, Breast
Invasive Carcinoma; CESC, Cervical Squamous Cell Carcinoma and
Endocervical Adenocarcinoma; CHOL, Cholangiocarcinoma; COAD, Colon
Adenocarcinoma; DLBC, Lymphoid Neoplasm Diffuse Large B-cell
Lymphoma; ESCA, Esophageal Carcinoma; GBM, Glioblastoma Multiforme;
HNSC, Head and Neck Squamous Cell Carcinoma; KICH, Kidney
Chromophobe; KIRC, Kidney Renal Clear Cell Carcinoma; KIRP, Kidney
Renal Papillary Cell Carcinoma; LAML, Acute Myeloid Leukemia; LGG,
Brain Lower Grade Glioma; LIHC, Liver Hepatocellular Carcinoma;
LUAD, Lung Adenocarcinoma; LUSC, Lung Squamous Cell Carcinoma;
MESO, Mesothelioma; OV, Ovarian Serous Cystadenocarcinoma; PAAD,
Pancreatic Adenocarcinoma; PCPG, Pheochromocytoma and
Paraganglioma; PRAD, Prostate Adenocarcinoma; READ, Rectum
Adenocarcinoma; SARC, Sarcoma; SKCM, Skin Cutaneous Melanoma; STAD,
Stomach Adenocarcinoma; TGCT, Testicular Germ Cell Tumors; THCA,
Thyroid Carcinoma; THYM, Thymoma; UCEC, Uterine Corpus Endometrial
Carcinoma; UCS, Uterine Carcinosarcoma; UVM, Uveal Melanoma. |
DNHD1 promotes prostate cancer cell
growth and metastatic potential through tumor cell plasticity
regulation
The oncogenic role of DNHD1 in prostate
cancer remains largely undefined. To investigate its potential
functional relevance, the present study first examined DNHD1
expression across prostate cancer cell lines by using the CCLE
dataset GSE36133 (Table SVII).
Notably, DNHD1 expression demonstrated a lineage-associated
distribution, with lower expression in AR-positive luminal-like
cell lines (LNCaP and 22RV1) but higher expression in AR-negative,
more aggressive and mesenchymal-like cell lines (PC-3 and DU145;
Fig. 2A). Thus, DNHD1 may be
associated with lineage plasticity and a more dedifferentiated
tumor state in prostate cancer. Protein-level validation through
immunoblotting across prostate cancer cell lines further confirmed
this differential expression pattern (Fig. 2B), corroborating the transcriptional
and translational consistency of DNHD1 deregulation in
distinct prostate cancer cellular contexts. To investigate its
functional role, the present study generated stable
DNHD1-knockdown and -overexpression models by using
lentiviral short hairpin RNA (shRNA) and cDNA systems. On the basis
of the endogenous expression profiles, LNCaP and PC-3 cells were
used for gain-of-function and loss-of-function experiments,
respectively. Efficient modulation of DNHD1 expression was
validated by RT-qPCR and immunoblotting (Fig. 2C and D).
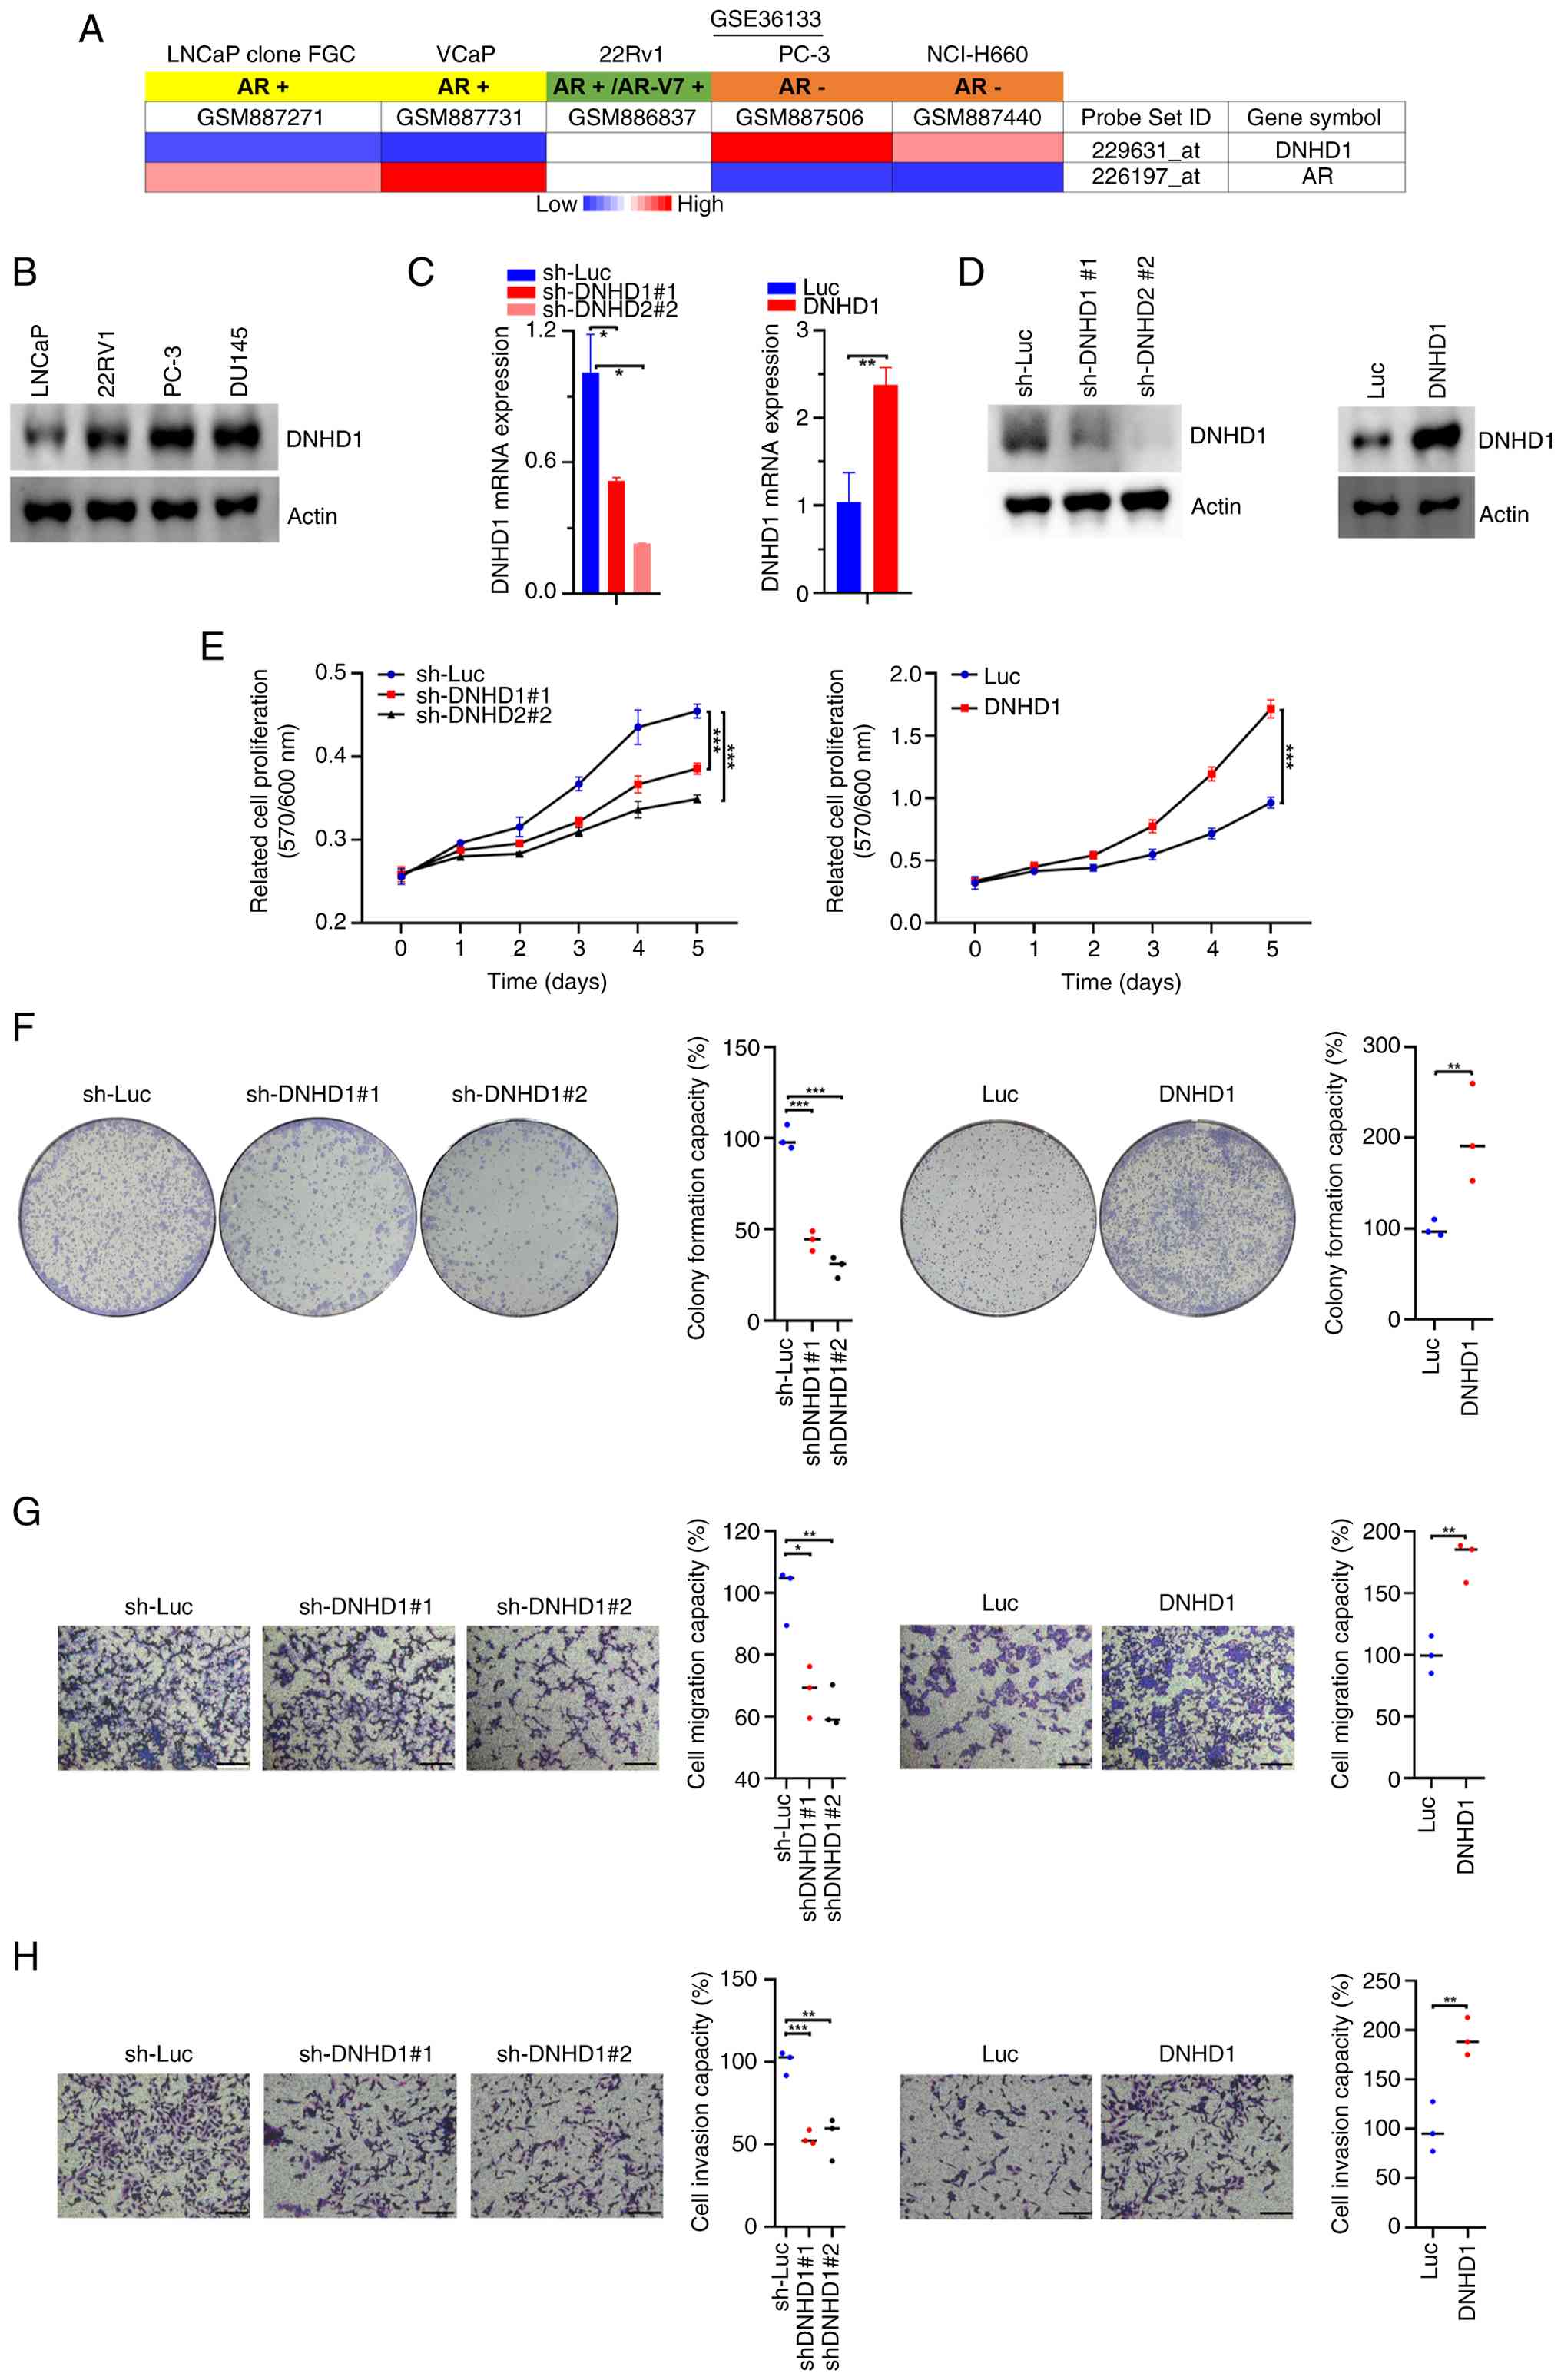 | Figure 2.DNHD1 facilitates prostate
cancer cell growth and metastatic behavior. (A) Analysis of
DNHD1 expression across prostate cancer cell lines from the
CCLE dataset (GSE36133), including AR-positive (LNCaP and 22RV1)
and AR-negative (PC-3 and DU145) cell models. (B) Immunoblotting of
DNHD1 expression in a panel of prostate cancer cell lines. (C and
D) Establishment and validation of DNHD1 gain-of-function
and loss-of-function models. DNHD1 overexpression in LNCaP
cells and DNHD1 knockdown in PC-3 cells were confirmed
through qPCR and immunoblotting. (E) Alamar Blue proliferation
assays indicating effects of DNHD1 overexpression in LNCaP
cells and DNHD1 knockdown in PC-3 cells on cell growth. (F)
Colony formation assays assessing clonogenic capacity after
DNHD1 overexpression in LNCaP cells or DNHD1
knockdown in PC-3 cells. (G) Boyden chamber migration assays for
migratory activity in DNHD1-overexpressing LNCaP cells and
DNHD1-knockdown PC-3 cells. (H) Matrigel invasion assays for
invasive capacity of DNHD1-overexpressing LNCaP cells and
DNHD1-knockdown PC-3 cells. (Scale bar, 100 µm). *P<0.05,
**P<0.01, ***P<0.001. DNHD1, dynein heavy chain domain 1;
CCLE, Cancer Cell Line Encyclopedia; AR, androgen receptor; qPCR,
quantitative polymerase chain reaction; shRNA, short hairpin RNA;
sh-Luc, short hairpin RNA targeting luciferase (control); Luc,
luciferase; AR-V7, androgen receptor splice variant 7; GSE, Gene
Expression Omnibus Series. |
Functional assay results demonstrated a potent
regulatory role of DNHD1 in prostate cancer cell function.
DNHD1 knockdown markedly impaired proliferative capacity in
PC-3 cells, whereas ectopic DNHD1 expression considerably
enhanced proliferation in LNCaP cells, as indicated by the Alamar
Blue assay results (Fig. 2E). These
findings were further corroborated by colony formation assay
results: DNHD1 knockdown suppressed long-term clonogenic
survival, whereas DNHD1 overexpression promoted robust
colony expansion (Fig. 2F),
indicating a critical role for DNHD1 in sustaining the
proliferative and survival capacities of prostate cancer cells.
Considering the clinical relevance of metastatic dissemination in
prostate cancer progression, the present study subsequently
evaluated the regulatory role of DNHD1 in prostate cancer
cell motility and invasive behavior. Fibronectin- and
Matrigel-based Boyden chamber assays revealed that DNHD1
knockdown markedly reduced both migratory and invasive potential in
PC-3 cells; by contrast, DNHD1 overexpression led to
considerable improvements in LNCaP cell motility and invasion
(Fig. 2G and H). These findings
indicate that DNHD1 functionally enhances both proliferative
and metastatic phenotypes in prostate cancer cells, consequently
establishing DNHD1 as a functional regulator of prostate cancer
cell growth and motility. Notably, the associations observed
between DNHD1 expression and AR status indicate a potential
link between DNHD1 and prostate cancer lineage plasticity:
In prostate cancer cells, DNHD1 upregulation may promote a
shift toward more aggressive, AR-independent states with enhanced
metastatic competence.
HDAC6 is a key downstream effector
within the DNHD1-associated oncogenic network in prostate
cancer
To elucidate the downstream regulatory network
associated with DNHD1 in prostate cancer, the present study
performed a correlation-based system-level analysis using
transcriptomic datasets from TCGA-PRAD, Cell 2015, Firehose Legacy
and PanCancer Atlas cohorts (35–38).
Genes with a robust positive correlation (Spearman's ρ≥0.3) or
negative correlation (Spearman's ρ≤-0.3) with DNHD1
expression were integrated across datasets to construct a
high-confidence DNHD1-associated gene signature (Fig. 3A; Table
SVIII). Functional enrichment analysis of 2,145 positively
correlated and 463 negatively correlated genes conducted using IPA
revealed that DNHD1-associated transcriptional programs are
strongly enriched in pathways regulating cytoskeletal organization,
vesicular trafficking, organelle biogenesis and cellular metabolic
rewiring (Fig. 3B; Table SIX). Notably, among the top-ranked
canonical pathways, cilium assembly emerged as a consistently
enriched biological process, highlighting a potential association
between DNHD1 and structural signaling regulation in
prostate cancer. Within this cilium-associated regulatory network,
HDAC6 was identified as a biologically and clinically
relevant candidate downstream effector. HDAC6 is a well-established
cytoplasmic deacetylase, regulating microtubule dynamics through
α-tubulin deacetylation. It plays a key role in primary cilium
disassembly, protein homeostasis and oncogenic stress adaptation.
Notably, although HDAC6 is implicated in prostate cancer
progression and AR signaling regulation (39), its position within upstream
regulatory networks remains unclear. In the TCGA-PRAD cohort, HDAC6
expression was positively correlated with DNHD1 expression
(R=0.4; P=3.1×10⁻²⁰; Fig.
3C). The result of the network-based analysis therefore
suggested that HDAC6 represents a functional convergence
node, linking DNHD1-associated transcriptional programs to
cytoskeletal and ciliary remodeling pathways in prostate cancer. To
validate the clinical relevance of this association, the present
study subsequently examined HDAC6 expression in TCGA-PRAD
and independent prostate cancer cohorts. HDAC6 expression
was significantly upregulated in primary tumor tissues compared
with in the adjacent nontumor tissues (P=0.0230; Fig. 3D; Table
SX). Notably, HDAC6 expression was strongly and
positively correlated with DNHD1 expression across multiple
independent datasets, including TCGA-PRAD (Spearman's ρ=0.4283;
P=0.0092) and validation cohorts (Fig.
3E; Table SX), confirming the
robustness of this regulatory association. In clinical specimens,
higher HDAC6 expression was positively correlated with a
higher Gleason score, suggesting a role in prostate cancer
progression and aggressiveness (Fig.
3F; Table SIV). Moreover,
comparative analysis across these specimens revealed a significant
positive correlation between DNHD1 and HDAC6 expression (Spearman's
ρ=0.3436; P<0.0001; Fig. 3G;
Table SIV), confirming a
coordinated transcriptional relationship between the two molecules.
Consistently, elevated HDAC6 expression was observed across
localized prostate cancer (GSE21032) and mCRPC (GSE35988) cohorts,
further indicating its association with advanced prostate cancer.
Notably, ADT led to further upregulation of HDAC6 expression
(GSE48403), suggesting that HDAC6 is involved in the
progression to ADT-adaptive tumor states (Fig. 3H; Table
SV). Survival analysis revealed that high HDAC6
expression was significantly associated with poor OS (P=0.047;
HR=4.4) and DFS (P=0.039; HR=1.5) in the TCGA-PRAD cohort (Fig. 3I). The relationship between
HDAC6 expression and DFS was independently validated in the
external cohort GSE21032 (P=0.0453; HR=2.332; 95% CI=1.025–5.306).
Notably, combined stratification based on DNHD1 and
HDAC6 expression revealed a high-risk patient subgroup with
the poorest clinical outcomes across all cohorts (P<0.0001),
suggesting additive or synergistic prognostic value for both genes
(Fig. 3J; Table SVI). Together, these results
indicate that HDAC6 may be a key downstream effector within the
DNHD1-associated transcriptional network, affording a model
in which DNHD1-HDAC6 signaling constitutes a coordinated regulatory
axis governing cytoskeletal remodeling, ciliary dynamics and
prostate cancer progression. In prostate cancer, this axis may not
only be correlated with tumor aggressiveness and therapy adaptation
but also define a clinically relevant high-risk molecular subclass
of the condition.
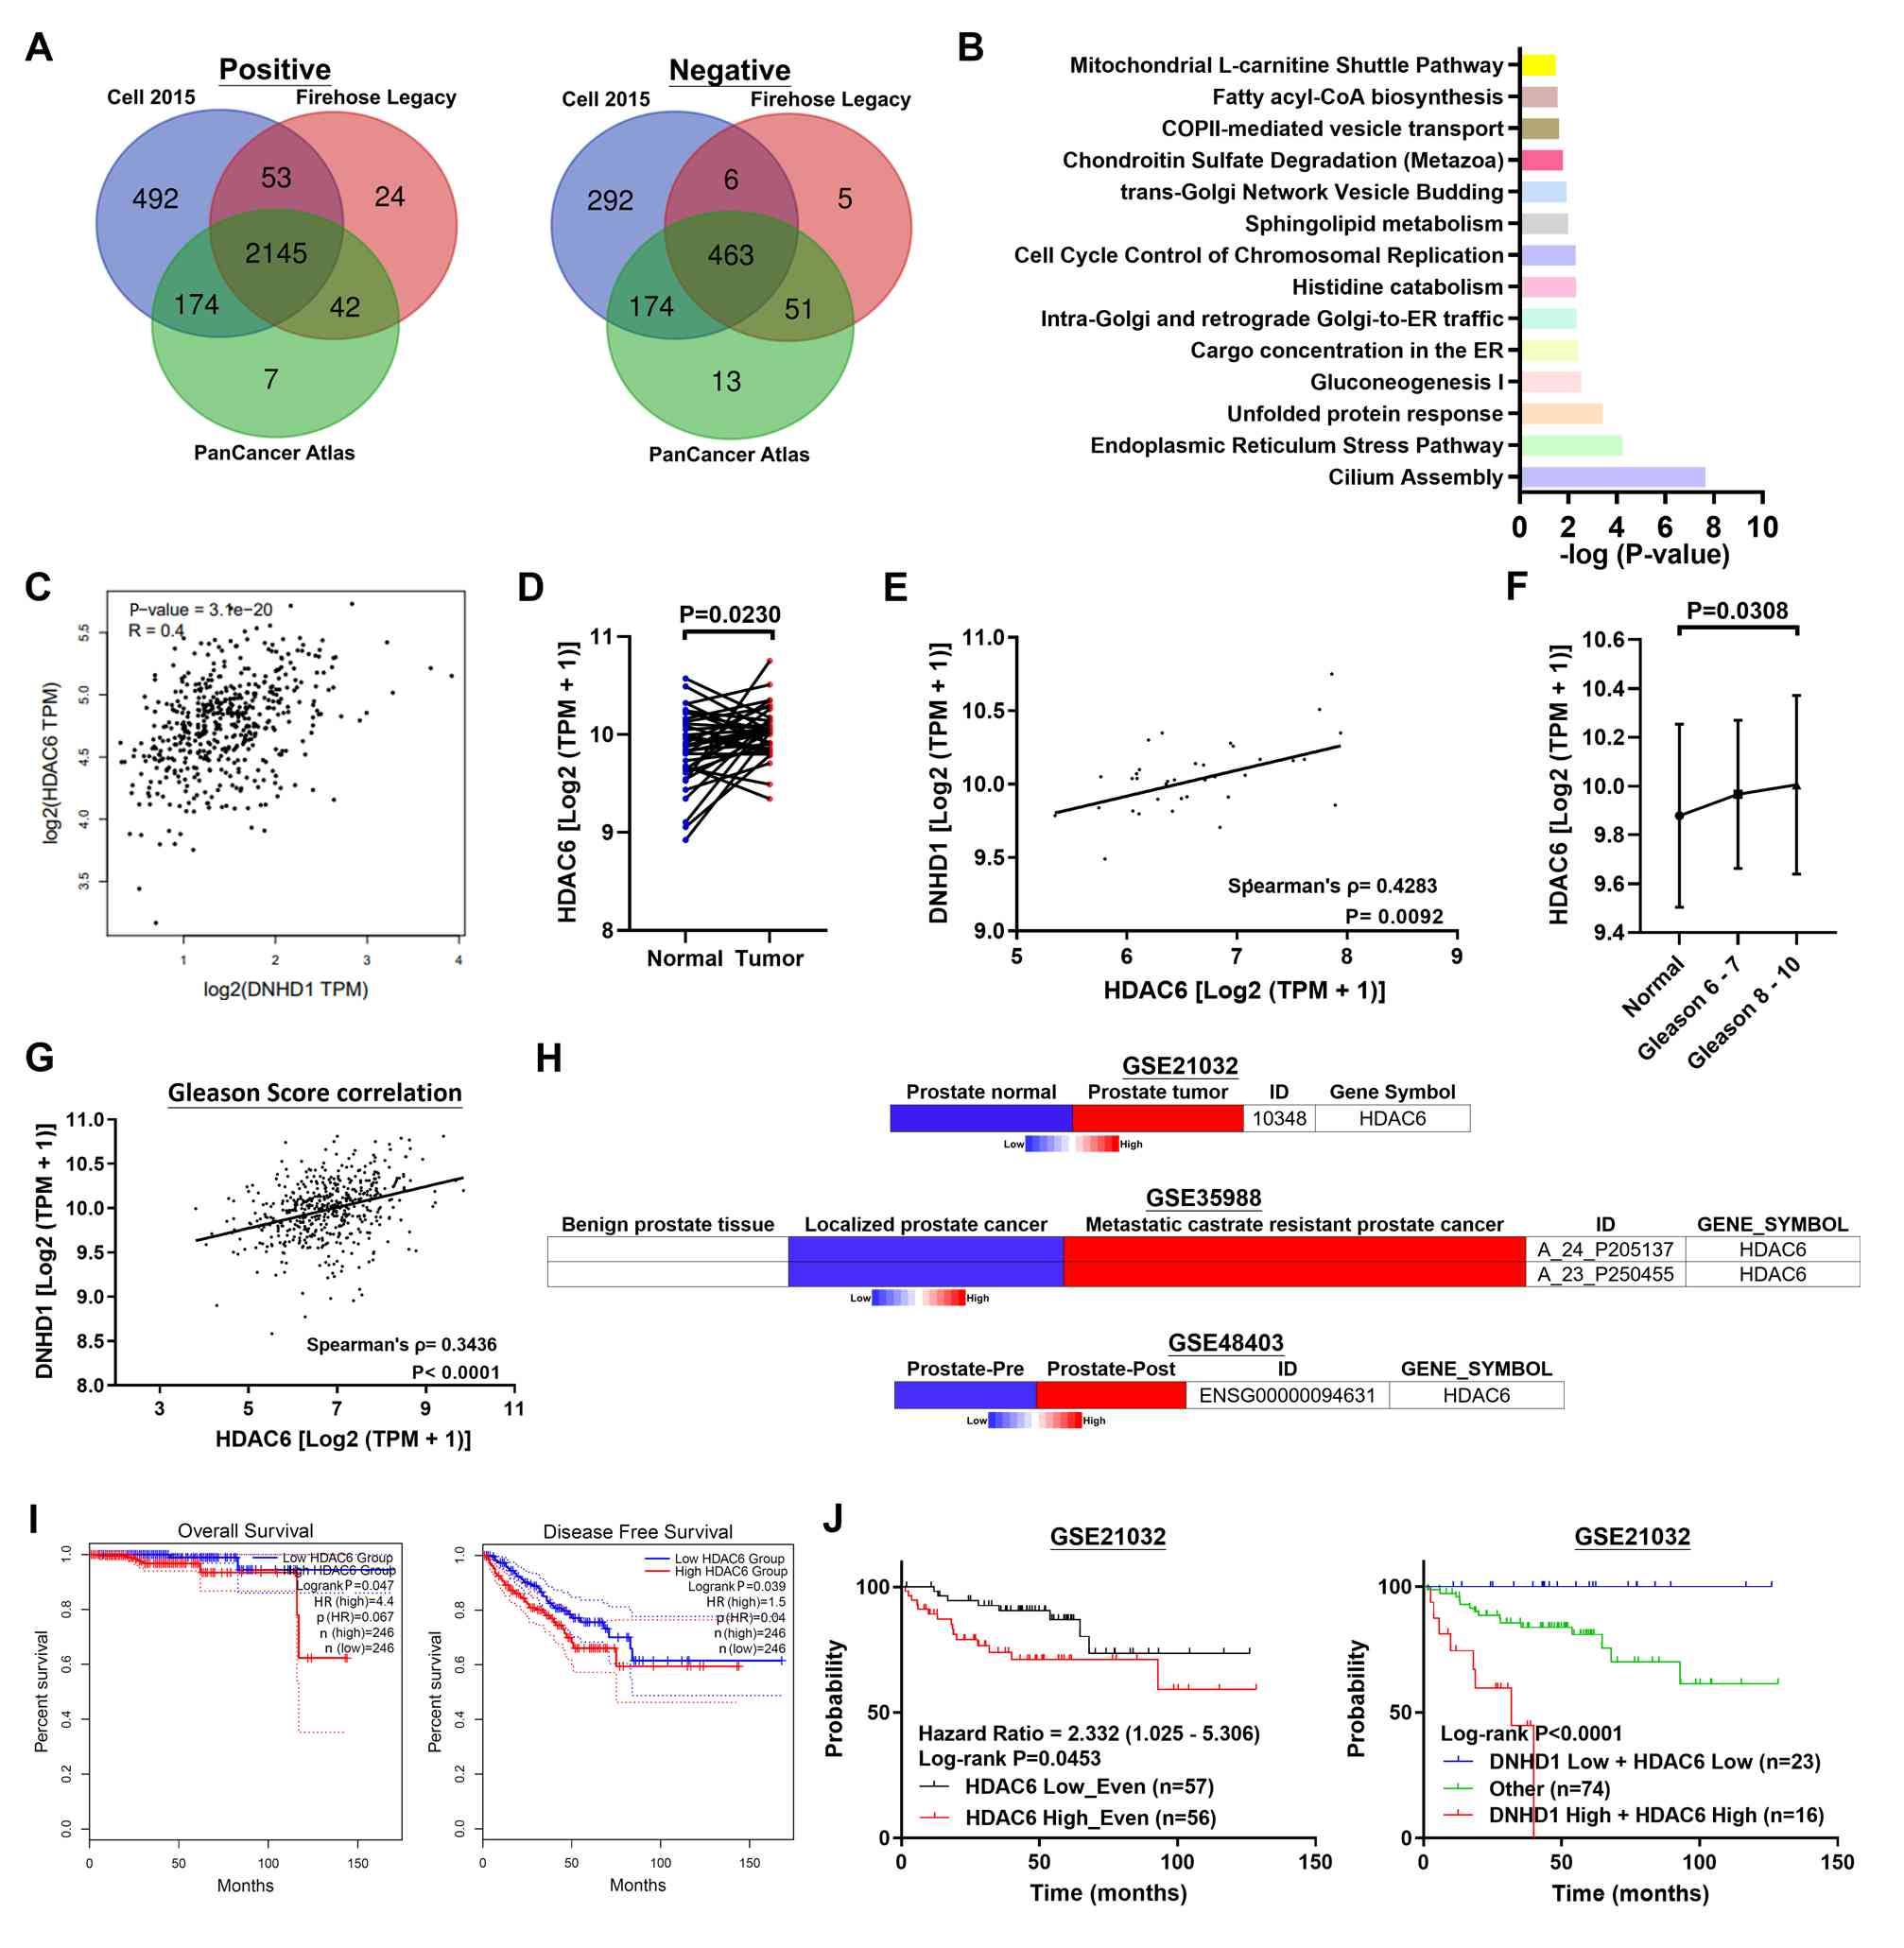 | Figure 3.HDAC6 is a key downstream
effector within the DNHD1-associated oncogenic network in
prostate cancer. (A) Integrative correlation analysis across the
TCGA-PRAD, Cell 2015, Firehose Legacy and PanCancer Atlas cohorts
to identify genes consistently associated with DNHD1
expression (Spearman's ρ≥0.3 or Spearman's ρ≤-0.3), generating a
high-confidence DNHD1-associated transcriptional network.
(B) IPA of DNHD1-associated genes revealing significant
enrichment of biological processes related to cytoskeletal
organization, vesicular transport, organelle dynamics and metabolic
regulation. Cilium assembly appeared to be one of the most
consistently enriched pathways, implicating DNHD1 in
structural signaling programs associated with prostate cancer
progression. (C and D) Transcriptomic analyses of TCGA-PRAD
specimens demonstrating increased HDAC6 expression in
prostate cancer tissues relative to normal prostate tissues.
Representative comparisons and quantitative analyses are presented.
(E) Correlation analysis in the TCGA-PRAD cohort. The significant
positive association between DNHD1 and HDAC6
expression confirmed a coordinated transcriptional relationship
between these genes in clinical prostate cancer specimens. (F)
Clinicopathological analysis revealing a positive association
between HDAC6 expression and Gleason score, thereby
indicating progressive upregulation of HDAC6 expression with
increasing histological aggressiveness. (G) Independent validation
within prostate cancer patient cohorts, confirming a significant
positive correlation between DNHD1 and HDAC6
expression levels, supporting the robustness of the DNHD1-HDAC6
axis. (H) Validation across independent clinical datasets,
demonstrating elevated HDAC6 expression in localized
prostate cancer, mCRPC and ADT-treated prostate cancer tissues,
indicating its association with disease progression and
therapy-adaptive tumor states. (I) Kaplan-Meier survival analyses
demonstrating that upregulated HDAC6 expression is
associated with inferior OS and DFS in patients with prostate
cancer, supporting its prognostic relevance. (J) Combined
stratification based on DNHD1 and HDAC6 expression. A
high-risk molecular subgroup with the poorest clinical outcome was
noted, confirming the additive prognostic value of the DNHD1-HDAC6
axis. HDAC6, histone deacetylase 6; DNHD1, dynein heavy chain
domain 1; TCGA, The Cancer Genome Atlas; PRAD, prostate
adenocarcinoma; IPA, Ingenuity Pathway Analysis; COPII, coat
protein complex II; ER, endoplasmic reticulum; TPM, transcripts per
million; mCRPC, metastatic castration-resistant prostate cancer;
ADT, androgen deprivation therapy; OS, overall survival; DFS,
disease-free survival; HR, hazard ratio; GEO, Gene Expression
Omnibus; GSE, Gene Expression Omnibus Series. |
DNHD1 promotes malignancy in prostate
cancer through HDAC6-dependent regulatory mechanisms
To further delineate the mechanistic relationship
between DNHD1 and HDAC6 in prostate cancer, the present study first
evaluated HDAC6 expression across prostate cancer cell lines
by using CCLE transcriptomic datasets (GSE36133). It was observed
that HDAC6 expression exhibited a lineage-associated
distribution, with lower expression in AR-positive luminal-like
prostate cancer cells than in AR-negative prostate cancer cell
lines (Fig. 4A; Table SVII). This distribution closely
parallels DNHD1 expression patterns, further suggesting a
potential functional coupling between DNHD1 and HDAC6 within
various prostate cancer cell states. Additionally, integrative
correlation analysis revealed a strong positive association between
DNHD1 and HDAC6 expression across prostate cancer
datasets (Spearman's ρ=0.90; Fig.
4B; Table SVII), corroborating
a strong transcriptional association between the two genes. To
determine whether DNHD1 functionally regulates HDAC6
expression, the present study performed gain-of-function and
loss-of-function experiments in prostate cancer cell models. qPCR
and immunoblotting analyses revealed that DNHD1
overexpression markedly upregulated HDAC6 mRNA and protein
expression in LNCaP cells, whereas DNHD1 knockdown
considerably downregulated HDAC6 mRNA and protein expression
in PC-3 cells (Fig. 4C and D).
These findings suggested that DNHD1 positively regulates
HDAC6 expression at both the transcriptional and the
translational level. Notably, reciprocal perturbation experiments
revealed that modulating HDAC6 expression did not affect
DNHD1 expression (Fig. 4E),
indicating a unidirectional regulatory hierarchy in which
DNHD1 acts upstream of HDAC6. These results establish
HDAC6 as a downstream effector rather than a feedback
regulator within the DNHD1 signaling axis. To assess the
functional contribution of HDAC6 in prostate cancer
progression, the present study established HDAC6
gain-of-function and loss-of-function models in prostate cancer
cell lines (Fig. 4F and G).
Consistent with a previous report (29), HDAC6 knockdown markedly
suppressed proliferation and clonogenic growth in PC-3 cells,
whereas HDAC6 overexpression enhanced proliferative capacity
in LNCaP cells (Fig. 4H and I).
Moreover, Boyden chamber assays revealed that in both cell lines,
HDAC6 knockdown considerably reduced migratory and invasive
potential, whereas ectopic HDAC6 expression promoted
aggressive motility (Fig. 4J and
K). These results confirmed that HDAC6 expression is
essential and sufficient to drive prostate cancer cell growth and
metastatic behavior. To establish whether HDAC6 functionally
mediates DNHD1-driven oncogenic phenotypes, the present
study performed combinatorial epistasis experiments. DNHD1
overexpression substantially enhanced proliferation, colony
formation, migration and invasion in LNCaP cells. Notably,
simultaneous silencing of HDAC6 and DNHD1 markedly
attenuated all DNHD1-induced oncogenic phenotypes (Fig. 4L-O), indicating that HDAC6 is
required for the complete execution of DNHD1-mediated
tumor-promoting effects.
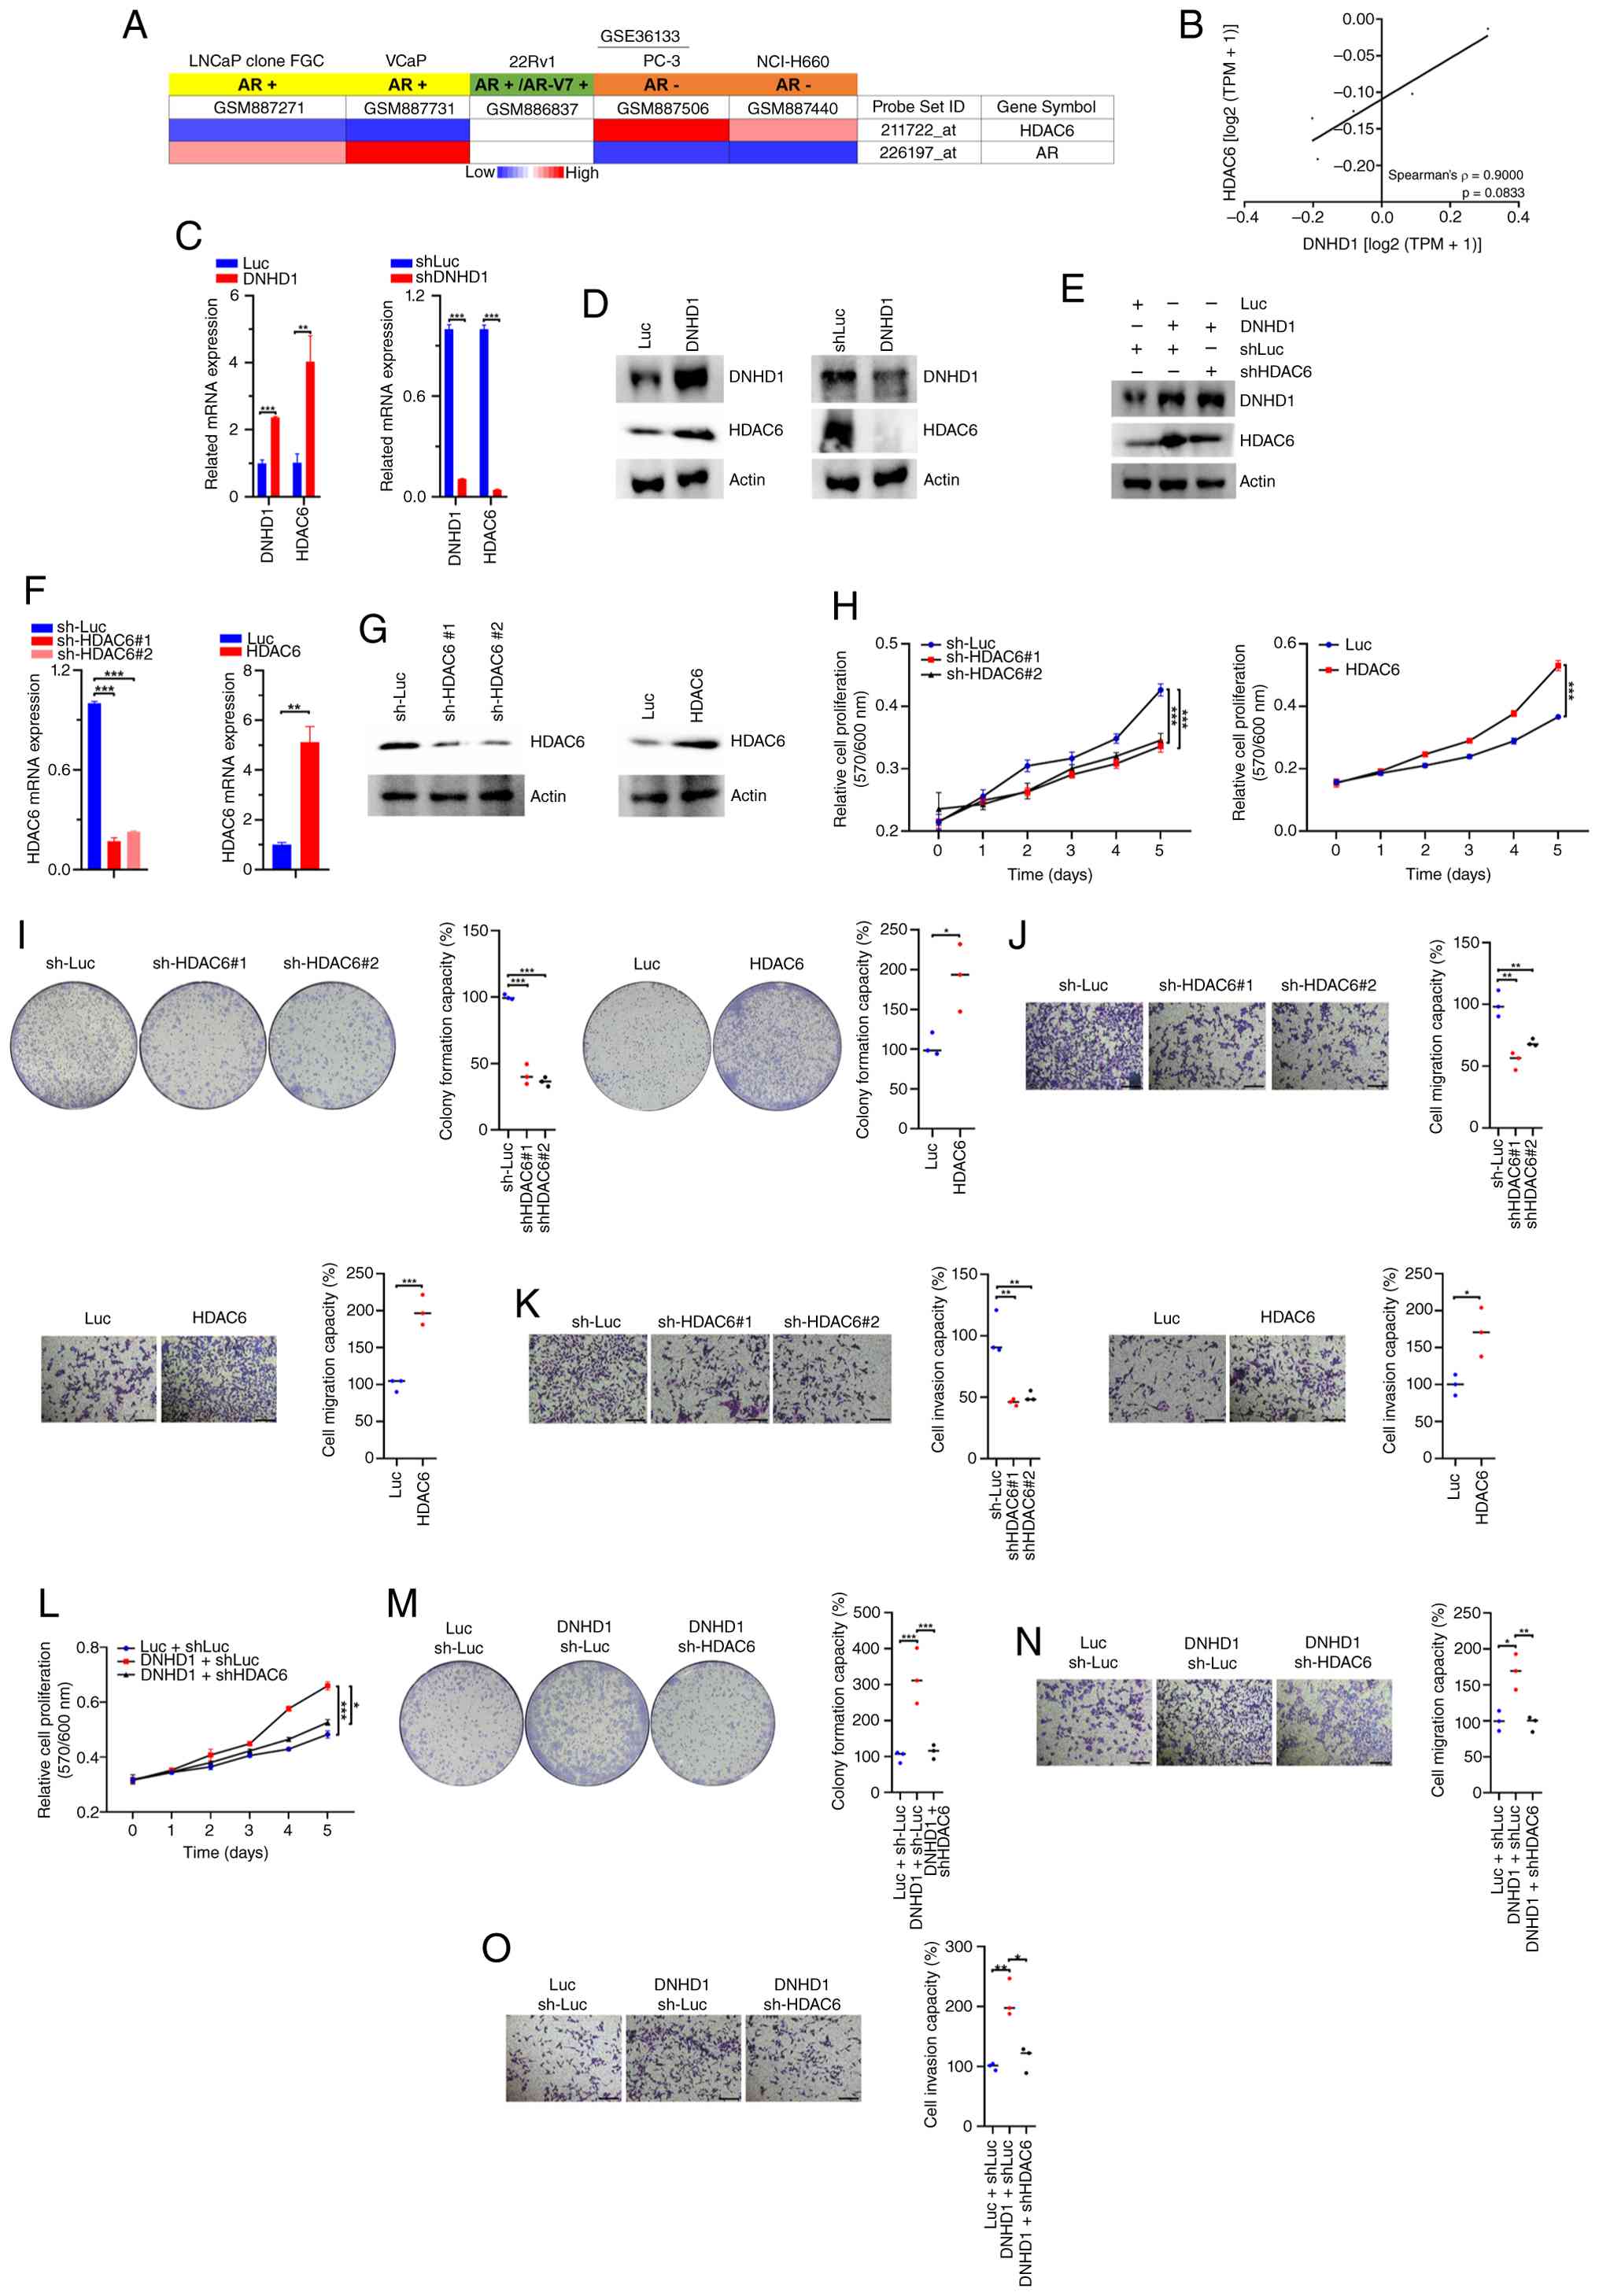 | Figure 4.DNHD1 promotes malignancy in
prostate cancer cells through HDAC6-dependent regulatory
mechanisms. (A) Analysis of the CCLE-derived prostate cancer
transcriptomic dataset GSE36133, demonstrating a lineage-associated
distribution pattern of HDAC6 expression, with lower
expression observed in AR-positive luminal-like prostate cancer
cell lines relative to AR-negative cell lines. (B) Correlation
analysis across prostate cancer datasets, revealing a strong
positive association between DNHD1 and HDAC6
expression (Spearman's ρ=0.90), confirming a coordinated
transcriptional relationship between these two molecules. (C and D)
Positive regulatory effect of DNHD1 on HDAC6
transcript and protein expression. Ectopic expression of
DNHD1 in LNCaP cells increased HDAC6 expression,
whereas DNHD1 knockdown in PC-3 cells reduced HDAC6
mRNA and protein expression, as determined through qPCR and
immunoblotting. (E) Reciprocal perturbation analyses demonstrating
that modulating HDAC6 expression did not alter DNHD1
expression, indicating a unidirectional regulatory relationship in
which DNHD1 functions as an upstream regulator of
HDAC6. (F and G) Establishment and validation of
HDAC6 gain-of-function and loss-of-function models in
prostate cancer cells. HDAC6 overexpression in LNCaP cells
and HDAC6 knockdown in PC-3 cells were confirmed through
qPCR and immunoblotting. Functional analyses demonstrating that
HDAC6 contributes to prostate cancer cell growth and
clonogenic capacity. HDAC6 overexpression (H) enhanced
proliferative and (I) colony-forming ability in LNCaP cells,
whereas HDAC6 knockdown suppressed these phenotypes in PC-3
cells. (J and K) Boyden chamber migration and Matrigel invasion
assays demonstrating that HDAC6 positively regulates
prostate cancer cell motility and invasive behavior. Ectopic
HDAC6 expression increased migratory and invasive capacities
in LNCaP cells, whereas HDAC6 knockdown markedly impaired
these phenotypes in PC-3 cells. (L-O) Epistasis analyses in
DNHD1-overexpressing LNCaP cells indicating that
HDAC6 is required for DNHD1-driven oncogenic phenotypes.
DNHD1 promoted cell proliferation, clonogenic growth,
migration and invasion, whereas concurrent HDAC6 silencing
markedly attenuated these tumor-promoting effects (Scale bar, 100
µm). *P<0.05, **P<0.01, ***P<0.001. DNHD1, dynein heavy
chain domain 1; HDAC6, histone deacetylase 6; CCLE, Cancer Cell
Line Encyclopedia; AR, androgen receptor; AR-V7, androgen receptor
splice variant 7; TPM, transcripts per million; qPCR, quantitative
polymerase chain reaction; mRNA, messenger RNA; shRNA, short
hairpin RNA; sh-Luc, short hairpin RNA targeting luciferase
(control); Luc, luciferase; shHDAC6, short hairpin RNA targeting
histone deacetylase 6; GSE, Gene Expression Omnibus Series. |
Upstream regulator analysis of
DNHD1-simulated networks revealed E2F6 as a potential
transcription factor involved in the transactivation of
HDAC6 under DNHD1 regulation (P=0.0398; Fig. S1A). Transcriptomic profiling of
TCGA-PRAD cohort data revealed that E2F6 expression was
positively correlated with the expression of both DNHD1
(R=0.22; P=1.2×10⁻⁶) and HDAC6 (R=0.29;
P=1.0×10⁻¹⁰). Clinical outcome analysis further revealed
that in patients with prostate cancer, E2F6 upregulation led
to significantly worse OS than low E2F6 expression did
(P=0.046; HR=3.8; Fig. S1B). To
investigate whether E2F6 functionally modulates HDAC6
expression, the present study performed gain-of-function and
loss-of-function experiments. E2F6 overexpression
considerably upregulated HDAC6 expression in LNCaP cells,
whereas E2F6 knockdown substantially downregulated
HDAC6 mRNA and protein expression, as validated through qPCR
and immunoblotting (Fig. S1C and
D). To evaluate whether E2F6 directly transactivates
HDAC6, the present study performed promoter sequence
analysis and identified a putative E2F6-binding motif
(5′-GAGAGGGAAGA-3′) located between positions −781 and −770 bp
within the HDAC6 promoter (Fig.
S1E). Chromatin immunoprecipitation coupled with qPCR
demonstrated an enriched recruitment of E2F6 to the HDAC6
promoter relative to the immunoglobulin G (IgG) control; this
effect was further enhanced after ectopic E2F6 expression in
LNCaP cells (Fig. S1F). Thus, E2F6
drives HDAC6 transactivation by directly binding to the
HDAC6 promoter. Given the regulatory hierarchy established
in the aforementioned text, the present study further explored the
functional role of E2F6 in the DNHD1-HDAC6 axis. Immunoblotting
revealed that DNHD1 overexpression stimulated E2F6
expression, whereas E2F6 knockdown suppressed DNHD1
expression (Fig. S1G), suggesting
a reciprocal regulatory relationship between DNHD1 and E2F6.
Functional assays revealed that E2F6 knockdown markedly
attenuated DNHD1-induced proliferation, migration and
invasion in LNCaP cells (Fig.
S1H-J). By contrast, although E2F6 transactivated HDAC6,
HDAC6 knockdown slightly downregulated E2F6 expression
(Fig. S1K). The results of
epistatic rescue experiments demonstrated that HDAC6
knockdown substantially reversed the enhancements in
colony-forming, migratory and invasive capacities conferred by
E2F6 overexpression (Fig.
S1L-N), indicating that HDAC6 is an indispensable
downstream mediator of E2F6-driven malignant phenotypes.
These results further confirmed the presence of a
DNHD1-HDAC6 axis in prostate cancer cells, in which DNHD1 is
an upstream regulator that activates HDAC6 through E2F6 to
promote proliferation and motility in tumor cells in vitro.
Notably, HDAC6 is a critical epistatic mediator of
DNHD1-driven malignancy, indicating that the DNHD1-HDAC6
axis is a functionally coherent regulatory module determining
prostate cancer aggressiveness.
Pharmacological targeting of the
DNHD1-HDAC6 axis reveals a therapeutically actionable vulnerability
in prostate cancer
Given the vital role of HDAC6 in regulating
microtubule dynamics, proteostasis and oncogenic signaling
networks, its selective inhibition has emerged as a promising
cancer treatment strategy (24–26).
To evaluate the translational relevance of the DNHD1-HDAC6 axis in
prostate cancer, the present study employed tubastatin A, a
well-characterized selective HDAC6 inhibitor. In LNCaP cells,
tubastatin A treatment resulted in a dose-dependent increase in
acetylated α-tubulin levels (Fig.
5A), confirming that the enzymatic activity of HDAC6 was
effectively inhibited. Time-course analysis further revealed
sustained accumulation of acetylated α-tubulin after tubastatin A
exposure, indicating strong suppression of HDAC6-dependent
deacetylation activity (Fig. 5B).
Notably, HDAC6 inhibition was accompanied by suppression of
downstream AR signaling output, as indicated by decreased AR and
PSA levels (Fig. 5C). Thus, the
enzymatic activity of HDAC6 may functionally contribute to
maintenance of AR-driven transcriptional programs in prostate
cancer cells. Functionally, tubastatin A markedly impaired prostate
cancer cell viability, clonogenic capacity, migratory behavior and
invasive potential, demonstrating that pharmacological inhibition
of HDAC6 effectively abrogates key malignant phenotypes associated
with cancer progression (Fig.
5D-G). These results establish HDAC6 as a critical regulator of
prostate cancer growth and metastatic competence. Notably,
pharmacological inhibition of HDAC6 also attenuated
DNHD1-driven oncogenic phenotypes. In
DNHD1-overexpressing LNCaP cells, tubastatin A treatment
effectively reversed DNHD1-induced upregulation of HDAC6
expression and suppressed associated AR and PSA expression
(Fig. 5H). These findings indicate
that DNHD1-mediated signaling is functionally dependent on
the enzymatic activity of HDAC6. Combinatorial functional assays
further revealed that HDAC6 inhibition considerably abrogated
DNHD1-induced enhancement of proliferation, colony
formation, migration and invasion (Fig.
5I-L). This epistatic evidence confirms that HDAC6 is required
for the execution of DNHD1-driven cancer-promoting
programs.
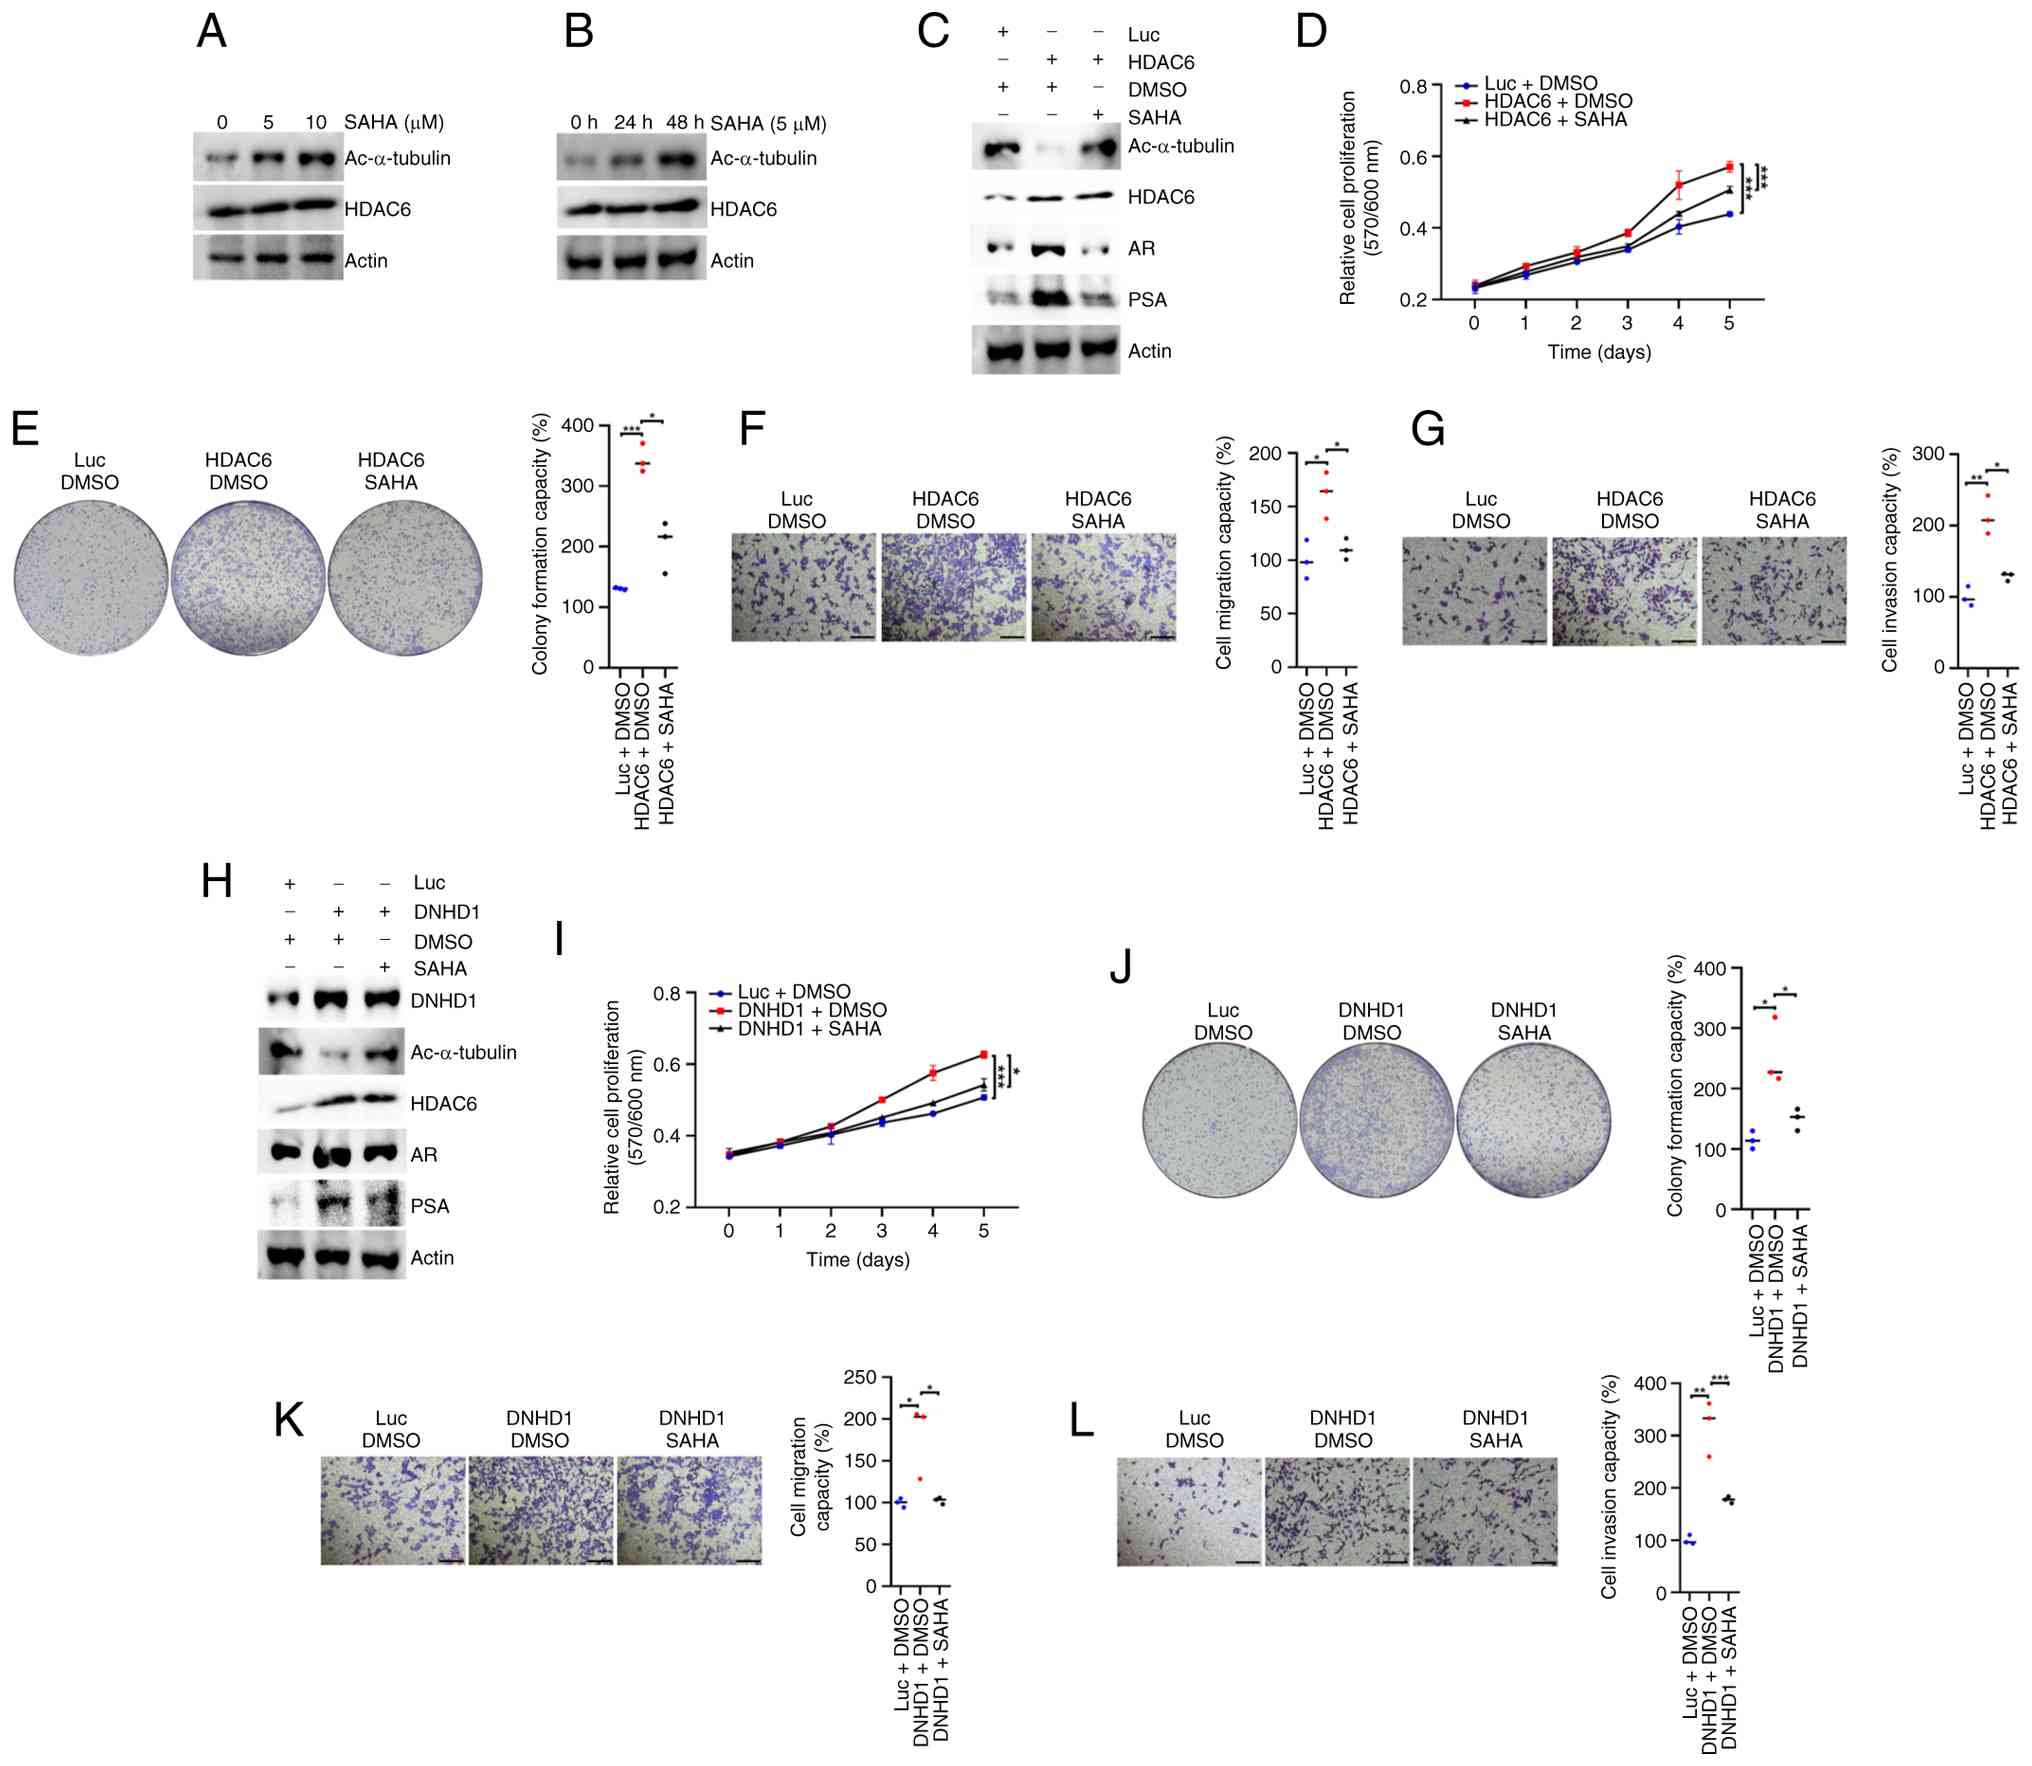 | Figure 5.Pharmacological inhibition of
HDAC6 suppresses DNHD1-driven oncogenic phenotypes in
prostate cancer. (A) Immunoblotting of LNCaP cells treated with
increasing concentrations of the selective HDAC6 inhibitor
tubastatin A. The results indicate dose-dependent accumulation of
acetylated α-tubulin, confirming inhibition of HDAC6 deacetylase
activity. (B) Time-course analysis in LNCaP cells demonstrating
sustained increase in acetylated α-tubulin levels after tubastatin
A treatment, thereby indicating prolonged suppression of
HDAC6-dependent deacetylation. (C) Pharmacological
inhibition of HDAC6. The results demonstrate reduced AR and
PSA expression in LNCaP cells, consistent with suppression of AR
signaling activity. (D-G) Functional analyses in LNCaP cells
demonstrating that tubastatin A treatment markedly inhibited cell
viability, clonogenic growth, migratory capacity and invasive
behavior. (H) Immunoblotting in DNHD1-overexpressing LNCaP
cells. The results indicate that tubastatin A treatment suppressed
DNHD1-associated HDAC6 expression and concomitantly
reduced AR and PSA expression. (I-L) Functional epistasis analyses
in DNHD1-overexpressing LNCaP cells. The results
demonstrated that pharmacological inhibition of HDAC6 markedly
attenuates DNHD1-induced enhancements in cell proliferation,
colony formation, migration and invasion, indicating that HDAC6
activity is required for DNHD1-mediated oncogenic effects in
prostate cancer. (Scale bar, 100 µm). *P<0.05, **P<0.01,
***P<0.001. DNHD1, dynein heavy chain domain 1; HDAC6, histone
deacetylase 6; Ac-α-tubulin, acetylated α-tubulin; SAHA,
suberoylanilide hydroxamic acid (vorinostat); AR, androgen
receptor; PSA, prostate-specific antigen; DMSO, dimethyl sulfoxide;
Luc, luciferase; sh-Luc, short hairpin RNA targeting luciferase
(control); shHDAC6, short hairpin RNA targeting histone deacetylase
6. |
These results indicated that the DNHD1-HDAC6 axis
is a pharmacologically tractable signaling module in prostate
cancer. In addition to holding prognostic relevance, this pathway
represents a functional therapeutic vulnerability, whereby HDAC6
inhibition can efficiently suppress DNHD1-driven tumor
growth and metastatic behavior. Thus, targeting the DNHD1-HDAC6
axis is a potential therapeutic strategy for advanced prostate
cancer.
Association of the DNHD1-HDAC6 axis
with prostate cancer pathophysiology and clinical progression
To further delineate the clinical relevance of the
DNHD1-HDAC6 axis, the present study elucidated its association with
established pathological parameters and disease progression metrics
in the TCGA-PRAD cohort. At the gene level, DNHD1 and
HDAC6 expression demonstrated a consistent positive
correlation across multiple pathological strata, including the N
stage (Spearman's ρ=0.3308; P<0.0001; Fig. 6A) and T stage (Spearman's ρ=0.3203;
P<0.0001; Fig. 6B), suggesting
coordinated upregulation during prostate cancer progression.
Notably, this coregulatory pattern persisted in residual tumor
specimens, where DNHD1 expression remained positively
correlated with HDAC6 expression (Spearman's ρ=0.3290;
P<0.0001; Fig. 6C), indicating
that the DNHD1-HDAC6 axis is maintained even in posttreatment
disease contexts. Clinically, both DNHD1 and HDAC6
expression individually stratified patients with significantly
worse disease-free interval (DFI) and progression-free interval
(PFI). Higher DNHD1 expression was associated with a
considerably poorer DFI (HR=5.733; P<0.0001); moreover, higher
HDAC6 expression was associated with a considerably worse
PFI (HR=2.157; P=0.0309; Fig. 6D and
E; Table SXI). Notably,
integrated analysis of the combined DNHD1-HDAC6 signature further
enhanced prognostic discrimination, identifying a subgroup of
patients with the poorest DFI (P<0.0001; Fig. 6F; Table
SXI). A similar trend was observed for PFI: High-risk patients
with markedly decreased survival probabilities demonstrated high
expression of both DNHD1 and HDAC6 (Fig. 6G-I; Table SXII). Together, these findings
indicated that the DNHD1-HDAC6 axis provides more additive
prognostic information than single-gene models do, supporting its
role as a coordinated molecular module rather than a set of
independent biomarkers.
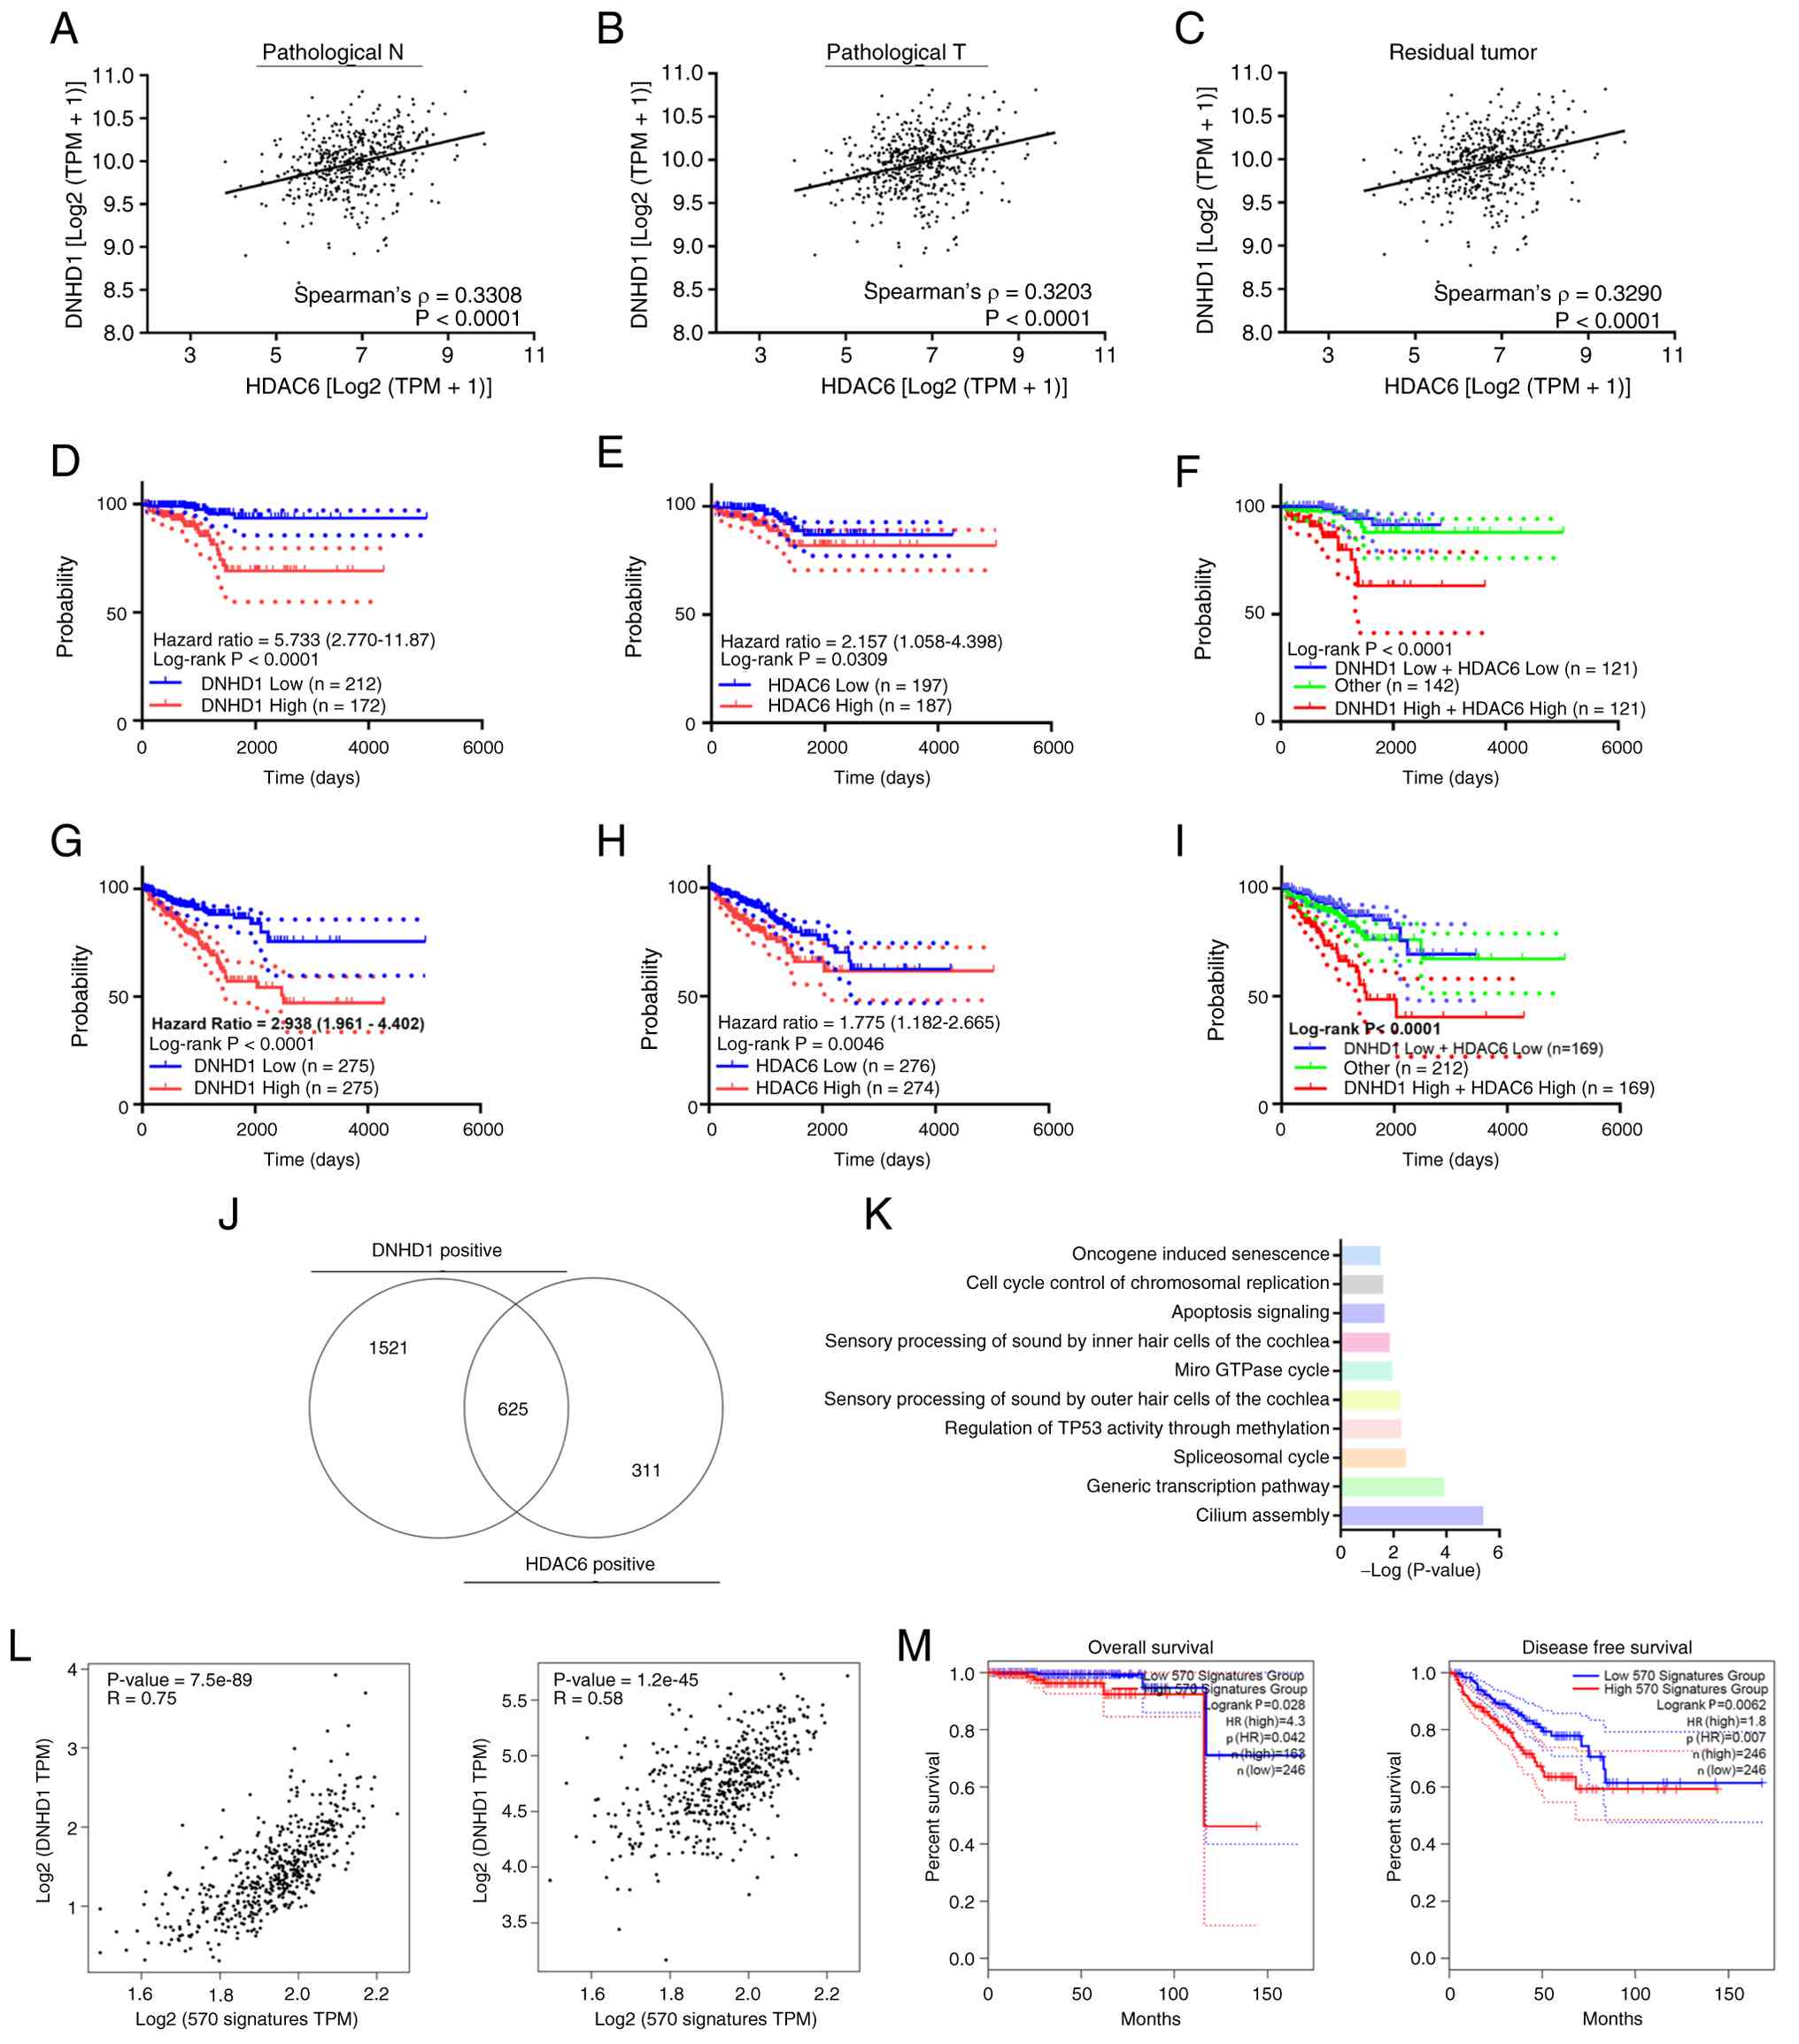 | Figure 6.The DNHD1-HDAC6 axis is a
transcriptionally coordinated program associated with prostate
cancer progression and adverse clinical outcomes. Correlation
analyses of the relationship between DNHD1 and HDAC6
expression across distinct clinicopathological contexts within the
TCGA-PRAD cohort. Positive associations between DNHD1 and
HDAC6 expression were observed in tumors stratified by
pathological (A) N and (B) T stages and (C) residual tumor status,
confirming the maintenance of the regulatory relationship between
DNHD1 and HDAC6 during disease progression and
posttreatment prostate cancer states. Kaplan-Meier analyses of DFI
by (D) DNHD1 and (E) HDAC6 expression in patients
from the TCGA-PRAD cohort. Patients were stratified into high- and
low-expression groups on the basis of predefined cutoff criteria.
(F) Integrated prognostic stratification of DFI based on combined
DNHD1 and HDAC6 expression status. Coexpression
analysis revealed a patient subgroup exhibiting the most
unfavorable clinical outcomes. Kaplan-Meier analyses of PFI
according to (G) DNHD1 or (H) HDAC6 expression levels
in the TCGA-PRAD cohort. (I) Combined PFI analysis based on
DNHD1-HDAC6 coexpression status demonstrating enhanced prognostic
discrimination compared with single-gene stratification. (J)
Venn-based integration of DNHD1- and HDAC6-associated
transcriptional networks indicating a shared set of positively
correlated genes that represent the common downstream regulatory
program of the DNHD1-HDAC6 axis. (K) Functional enrichment analysis
of the shared gene set associated with the DNHD1-HDAC6 axis. After
exclusion of non-protein-coding transcripts, a refined 570-gene
signature was established, with cilium assembly emerging as the
most markedly enriched biological process. (L) Correlation analyses
demonstrating significant positive associations between the
DNHD1-HDAC6 downstream transcriptional signature and expression
levels of DNHD1 or HDAC6 in PRAD specimens,
confirming coordinated transcriptional coupling of the
axis-associated gene program. (M) Kaplan-Meier analyses of OS and
DFS according to the DNHD1-HDAC6 downstream transcriptional
signature. Patients were stratified into high- and low-signature
groups on the basis of predefined cutoff criteria, demonstrating
the prognostic relevance of the shared DNHD1-HDAC6 gene program.
DNHD1, dynein heavy chain domain 1; HDAC6, histone deacetylase 6;
TCGA, The Cancer Genome Atlas; PRAD, prostate adenocarcinoma; TPM,
transcripts per million; DFI, disease-free interval; PFI,
progression-free interval; OS, overall survival; DFS, disease-free
survival; HR, hazard ratio. |
To further characterize the transcriptional
architecture associated with the DNHD1-HDAC6 axis, the present
study identified a set of 625 positively correlated genes through
Venn-based integration of DNHD1- and HDAC6-associated
expression profiles (Fig. 6J;
Table SXIII). Pathway enrichment
analysis of this gene set revealed that despite partial divergence
from single-gene pathway outputs, cilium assembly remained the most
consistently enriched biological process. Thus, in prostate cancer,
ciliary regulation may represent a convergent functional output of
DNHD1-HDAC6 signaling. After excluding non-protein-coding
transcripts, the present study defined a refined 570-gene signature
as the downstream transcriptional program of the DNHD1-HDAC6 axis
(Fig. 6K; Table SXIV). This signature was strongly
and positively correlated with both DNHD1 (Spearman's
ρ=0.75; P<7.5×10−89) and HDAC6 (Spearman's
ρ=0.58, P<1.2×10−45; Fig.
6L; Table SXV), indicating
robust transcriptional coupling across independent patient samples.
Notably, this axis-associated gene program also demonstrated
significant prognostic value, stratifying patients with regard to
OS (P=0.028; HR=4.3) and DFS (P=0.0062; HR=1.8; Fig. 6M).
To further assess whether the DNHD1-HDAC6 axis is
an independent prognostic indicator in prostate cancer, the present
study performed a multivariate Cox proportional hazards regression
analysis including DNHD1, HDAC6 and KLK3 as
covariates across multiple clinical endpoints (Table I). In the GSE21032 validation cohort
(n=113), the independent risk factors for shortened DFS were
identified to be DNHD1 (HR=1.015; 95% CI=1.001–1.028;
P=0.0334) and HDAC6 (HR=1.012; 95% CI=1.003–1.020;
P=0.0073). Consistent with these findings, evaluation within the
larger TCGA-PRAD cohort revealed that the overall Cox models for
both DFI and PFI were highly significant. In particular, shortened
DFI was predicted by elevated expression of DNHD1 (HR=1.804;
95% CI=1.233–2.640; P=0.0024) and HDAC6 (HR=3.883; 95%
CI=1.059–14.233; P=0.0407), independent of KLK3 expression.
Moreover, both genes demonstrated strong independent prognostic
value for PFI, with a 1.54-fold and 2.24-fold increase in
progression risk conferred by DNHD1 (HR=1.541; 95%
CI=1.238–1.919; P=0.0001) and HDAC6 (HR=2.238; 95%
CI=1.139–4.395; P=0.0194), respectively. These multivariate
analysis results confirmed that the DNHD1-HDAC6 axis affords a
robust, independent molecular prognostic framework for predicting
disease recurrence and progression in prostate cancer.
 | Table I.Multivariate Cox proportional hazards
analysis for prostate cancer cohorts. |
Table I.
Multivariate Cox proportional hazards
analysis for prostate cancer cohorts.
| Clinical
outcome/dataset | Covariate | b (Coeff) | SE | Wald | HR [(Exp(b))] | 95% CI Lower | 95% CI Upper | P-value | Significance |
|---|
| Disease-free | DNHD1 | 0.5901 | 0.1942 | 9.236 | 1.804 | 1.233 | 2.640 | 0.0024 | b |
| interval | HDAC6 | 1.3566 | 0.6627 | 4.190 | 3.883 | 1.059 | 14.233 | 0.0407 | a |
| (TCGA, n=384) | KLK3 | 0.1123 | 0.1670 | 0.452 | 1.119 | 0.807 | 1.552 | 0.5012 | ns |
| Progression- | DNHD1 | 0.4325 | 0.1118 | 14.982 | 1.541 | 1.238 | 1.919 | 0.0001 | c |
| free interval | HDAC6 | 0.8053 | 0.3444 | 5.468 | 2.238 | 1.139 | 4.395 | 0.0194 | a |
| (TCGA, n=550) | KLK3 | −0.0785 | 0.0636 | 1.526 | 0.925 | 0.816 | 1.047 | 0.2167 | ns |
| Biochemically | DNHD1 | 0.0145 | 0.0068 | 4.527 | 1.015 | 1.001 | 1.028 | 0.0334 | a |
| recurrent | HDAC6 | 0.0114 | 0.0043 | 7.198 | 1.012 | 1.003 | 1.020 | 0.0073 | b |
| (GSE21032,
n=113) | KLK3 | −0.0001 | 0.0001 | 1.809 | 1.000 | 1.000 | 1.000 | 0.1787 | ns |
Taken together, these results support a
systems-level model in which DNHD1 and HDAC6 operate
as a coordinated regulatory axis that establishes a stable
transcriptional state associated with tumor progression, ciliary
dysregulation and adverse clinical outcomes in prostate cancer.
Rather than acting as isolated biomarkers, DNHD1 and
HDAC6 appear to converge on a shared downstream gene network
that denotes a biologically and clinically coherent program
underlying prostate cancer aggressiveness.
Discussion
The present study identified DNHD1 as a
regulator of malignancy in prostate cancer and defined the
DNHD1-HDAC6 axis that functionally promotes tumor cell
aggressiveness in vitro. In contrast to studies focused on
individual prognostic biomarkers, the present study integrated
clinical, molecular and functional evidence to position
DNHD1 not only as a correlative marker of prostate cancer
but also as a potential contributor to its aggressiveness. Notably,
the present study also observed that the DNHD1-HDAC6 axis is
regulatory and pharmacologically targetable at the cellular level,
thereby providing meaningful mechanistic insight and revealing the
potential translational relevance of our findings.
DNHD1 has not been previously characterized
in the context of prostate cancer. Integrative analyses revealed
that DNHD1 expression is consistently elevated in advanced
disease stages, is positively correlated with Gleason score
progression and predicts unfavorable clinical outcomes across
multiple independent cohorts. Functional analyses further
demonstrated that DNHD1 directly promotes tumor cell
proliferation, clonogenicity, migration and invasion in
vitro. These results were consistent with a model in which
DNHD1 may contribute to malignancy in prostate cancer cells
rather than functioning as a passive biomarker alone.
Mechanistically, HDAC6 was noted to be a
critical downstream effector of DNHD1. HDAC6 has been
extensively implicated in cytoskeletal remodeling, protein quality
control and ciliary disassembly; all these processes have
increasingly been recognized as integral to tumor progression
(40,41). In prostate cancer, HDAC6 can
regulate microtubule dynamics through deacetylation of α-tubulin
and can modulate AR stability and transcriptional activity, thereby
contributing to tumor progression and therapy resistance (27,42–44).
However, the upstream regulatory mechanisms underlying HDAC6
expression in prostate cancer remain unclear. The current findings
indicated that DNHD1 regulates HDAC6 expression at
both transcriptional and protein levels and that HDAC6 is
required for DNHD1-mediated oncogenic phenotypes. Reciprocal
rescue experiments further established a functional hierarchy in
which HDAC6 acts downstream of DNHD1, reinforcing its
role as a key mediator of DNHD1-driven malignancy.
Pathway analysis further revealed a prominent
enrichment of cilium assembly programs associated with the
DNHD1-HDAC6 axis. Given the emerging role of primary cilia as
critical signaling hubs for pathways such as the Hedgehog and Wnt
pathways, ciliary homeostasis disruption has increasingly been
associated with cancer progression (45–49).
In addition, studies have suggested that ciliary dynamics may
influence AR signaling and cellular adaptation to androgen-deprived
conditions (50–52). The current findings suggested that
DNHD1-driven activation of HDAC6 may promote tumor
aggressiveness, at least in part, by modulating ciliary dynamics.
They thereby reveal a previously underexplored association between
cilium-associated processes and prostate cancer pathobiology. In
general, these observations indicated that the DNHD1-HDAC6 axis
contributes to coordinated regulation of cytoskeletal remodeling,
ciliary function and oncogenic signaling.
The association between the DNHD1-HDAC6 axis and AR
signaling is another notable observation of the current study. The
present study observed that DNHD1 and HDAC6
expression levels are upregulated under androgen-deprived
conditions and in castration-resistant prostate cancer, suggesting
they play roles in adaptive responses to prostate cancer treatment.
Consistently, pharmacological inhibition of HDAC6 attenuated
AR and PSA expression, indicating that the DNHD1-HDAC6 axis may
interfere with AR signaling networks. These findings suggested that
DNHD1-HDAC6 signaling contributes to therapeutic resistance,
particularly in the context of ADT and is a mechanism underlying
prostate cancer progression toward castration-resistant states.
Notably, the current results indicated a
therapeutically exploitable vulnerability within the DNHD1-HDAC6
axis. Pharmacological targeting of HDAC6 has emerged as a
promising strategy in cancer treatment; moreover, certain
HDAC6 inhibitors can disrupt cytoskeletal dynamics, impair
protein homeostasis and modulate oncogenic signaling pathways. In
prostate cancer, HDAC6 inhibition can interfere with AR
signaling and reduce cancer cell viability, indicating its
potential clinical relevance (27,28,53,54).
In this context, the present study provided additional mechanistic
and functional support for targeting HDAC6: Tubastatin A
effectively suppressed DNHD1-driven tumor growth and
motility and attenuated AR signaling output. As DNHD1 was
identified as an upstream regulator of HDAC6 in vitro, the
present study hypothesized that DNHD1 expression might represent a
potential candidate marker to explore in future studies regarding
responsiveness to HDAC6-targeted strategies, though this hypothesis
requires independent in vivo and prospective clinical
validation. This may provide a preliminary framework for
biomarker-informed patient selection. Thus, the DNHD1-HDAC6 axis
may be leveraged not only as a therapeutic target but also as a
framework for precision medicine in prostate cancer.
This study has several critical limitations. First,
although the in vitro functional assays provided strong
mechanistic findings, they were not validated in animal models
(such as xenograft tumor growth or metastasis models). As prostate
cancer progression, invasion and therapeutic responses are highly
cross-gated by the complex in vivo tumor microenvironment,
the current findings, from a simplified model, should be
interpreted with caution in terms of their implications regarding
systemic progression. In particular, direct clinical comparisons of
DNHD1 and HDAC6 expression levels in tissue samples
from benign prostate, localized prostate cancer, high-Gleason-score
prostate cancer, mCRPC and post-ADT prostate cancer tissues remain
to be experimentally established. Thus, the current study should be
considered to provide preliminary evidence positioning the
DNHD1-HDAC6 axis merely as a candidate biomarker requiring
independent clinical validation, rather than a clinically
applicable biomarker at this stage. Second, the precise molecular
mechanism through which DNHD1 regulates HDAC6
expression (such as whether this regulation occurs through direct
transcriptional control or indirect signaling pathways) warrants
further elucidation. Third, although pathway analysis implicated
cilium-associated processes associated with the DNHD1-HDAC6 axis,
direct functional validation of ciliary dynamics is warranted to
establish their causal contribution to prostate cancer progression.
Future studies should integrate rigorous in vivo animal
models and independent, multistage prospective clinical cohorts to
validate the therapeutic potential and clinical applicability of
targeting the DNHD1-HDAC6 axis in advanced prostate cancer.
In summary, the present study identified a novel
DNHD1-HDAC6 axis associated with aggressive prostate cancer cell
phenotypes in vitro, though its potential effect on clinical
outcomes warrants further in vivo and prospective clinical
validation. These findings broaden the current understanding of
prostate cancer biology by linking DNHD1, a novel upstream
regulator, to HDAC6-dependent oncogenic pathways and
cilium-associated processes. Moreover, the in vitro findings
suggested that this regulatory axis may represent a potential
candidate target, providing a preliminary conceptual foundation
that requires further in vivo and prospective clinical
validation to evaluate its therapeutic potential in advanced
prostate cancer.
Supplementary Material
Supporting Data
Supporting Data
Acknowledgements
The authors acknowledge the support of Taipei
Medical University-Shuang Ho Hospital and National Yang Ming Chiao
Tung University for providing computational infrastructure and
software resources to facilitate the analyses in this study.
Funding
The present study was funded by Taipei Medical University-Shuang
Ho Hospital, Taiwan, under grants 114TMU-SHH-32 and 114FRP-23.
Availability of data and materials
The data generated in the present study may be
found in the TCGA-PRAD project and GEO repository under accession
numbers GSE21032, GSE35988, GSE48403 and GSE36133 or at the
following URL: (persistent, direct URL to datasets). Additional
data supporting the findings of the present study may be requested
from the corresponding author.
Authors' contributions
ANL, CCW, and CHL contributed to the study
conception and design. Material preparation, experimental
procedures and data acquisition were performed by ANL, CCW, SWH,
CHC, YTC, WTK, KYT, CHL, SWD, YTW, YLL, SBL, CAW, CCL, MHC, PHC and
CHL. Data analysis and interpretation were conducted by ANL, CCW,
SWH, CHC, YTC, WTK, KYT, CHL, SWD, YTW, YLL, SBL, CAW, CCL, MHC,
PHC and CHL. The first draft of the manuscript was written by ANL
and CCW. All authors participated in drafting or critically
revising the manuscript for important intellectual content. All
authors read and approved the final manuscript for publication. All
authors read and approved the final manuscript. PHC and CHL confirm
the authenticity of all the raw data.
Ethics approval and consent to
participate
Not applicable.
Patient consent for publication
Not applicable.
Competing interests
The authors declare that they have no competing
interests.
References
|
1
|
Kelly BD, Miller N, Sweeney KJ, Durkan GC,
Rogers E, Walsh K and Kerin MJ: A circulating MicroRNA signature as
a biomarker for prostate cancer in a high risk group. J Clin Med.
4:1369–1379. 2015. View Article : Google Scholar : PubMed/NCBI
|
|
2
|
Siegel RL, Giaquinto AN and Jemal A:
Cancer statistics, 2024. CA Cancer J Clin. 74:12–49.
2024.PubMed/NCBI
|
|
3
|
Salinas CA, Tsodikov A, Ishak-Howard M and
Cooney KA: Prostate cancer in young men: An important clinical
entity. Nat Rev Urol. 11:317–323. 2014. View Article : Google Scholar : PubMed/NCBI
|
|
4
|
Rebello RJ, Oing C, Knudsen KE, Loeb S,
Johnson DC, Reiter RE, Gillessen S, Van der Kwast T and Bristow RG:
Prostate cancer. Nat Rev Dis Primers. 7:92021. View Article : Google Scholar : PubMed/NCBI
|
|
5
|
Siegel RL, Kratzer TB, Wagle NS, Sung H
and Jemal A: Cancer statistics, 2026. CA Cancer J Clin.
76:e700432026.PubMed/NCBI
|
|
6
|
Pron G: Prostate-specific antigen
(PSA)-based population screening for prostate cancer: An
evidence-based analysis. Ont Health Technol Assess Ser. 15:1–64.
2015.
|
|
7
|
Kang BJ, Jeun M, Jang GH, Song SH, Jeong
IG, Kim CS, Searson PC and Lee KH: Diagnosis of prostate cancer via
nanotechnological approach. Int J Nanomedicine. 10:6555–6569.
2015.PubMed/NCBI
|
|
8
|
Cuzick J, Thorat MA, Andriole G, Brawley
OW, Brown PH, Culig Z, Eeles RA, Ford LG, Hamdy FC, Holmberg L, et
al: Prevention and early detection of prostate cancer. Lancet
Oncol. 15:e484–e492. 2014. View Article : Google Scholar : PubMed/NCBI
|
|
9
|
Hyldgård VB, Laursen KR, Poulsen J and
Søgaard R: Robot-assisted surgery in a broader healthcare
perspective: A difference-in-difference-based cost analysis of a
national prostatectomy cohort. BMJ Open. 7:e0155802017. View Article : Google Scholar : PubMed/NCBI
|
|
10
|
Hohwü L, Borre M, Ehlers L and Venborg
Pedersen K: A short-term cost-effectiveness study comparing
robot-assisted laparoscopic and open retropubic radical
prostatectomy. J Med Econ. 14:403–409. 2011. View Article : Google Scholar : PubMed/NCBI
|
|
11
|
Burkhard P, Stetefeld J and Strelkov SV:
Coiled coils: A highly versatile protein folding motif. Trends Cell
Biol. 11:82–88. 2001. View Article : Google Scholar : PubMed/NCBI
|
|
12
|
Anazi S, Maddirevula S, Faqeih E,
Alsedairy H, Alzahrani F, Shamseldin HE, Patel N, Hashem M, Ibrahim
N, Abdulwahab F, et al: Clinical genomics expands the morbid genome
of intellectual disability and offers a high diagnostic yield. Mol
Psychiatry. 22:615–624. 2017. View Article : Google Scholar : PubMed/NCBI
|
|
13
|
Meier N, Bruder E, Lapaire O, Hoesli I,
Kang A, Hench J, Hoeller S, De Geyter J, Miny P, Heinimann K, et
al: Exome sequencing of fetal anomaly syndromes: Novel
phenotype-genotype discoveries. Eur J Hum Genet. 27:730–737. 2019.
View Article : Google Scholar : PubMed/NCBI
|
|
14
|
Tan C, Meng L, Lv M, He X, Sha Y, Tang D,
Tan Y, Hu T, He W, Tu C, et al: Bi-allelic variants in DNHD1 cause
flagellar axoneme defects and asthenoteratozoospermia in humans and
mice. Am J Hum Genet. 109:157–171. 2022. View Article : Google Scholar : PubMed/NCBI
|
|
15
|
Martinez G, Barbotin AL, Cazin C, Wehbe Z,
Boursier A, Amiri-Yekta A, Daneshipour A, Hosseini SH, Rives N,
Feraille A, et al: New mutations in DNHD1 cause multiple
morphological abnormalities of the sperm flagella. Int J Mol Sci.
24:25592023. View Article : Google Scholar : PubMed/NCBI
|
|
16
|
Wu S, Hivert MF, Cardenas A, Zhong J,
Rifas-Shiman SL, Agha G, Colicino E, Just AC, Amarasiriwardena C,
Lin X, et al: Exposure to low levels of lead in utero and umbilical
cord blood DNA methylation in project viva: An epigenome-wide
association study. Environ Health Perspect. 125:0870192017.
View Article : Google Scholar : PubMed/NCBI
|
|
17
|
Schiavo G, Greensmith L, Hafezparast M and
Fisher EMC: Cytoplasmic dynein heavy chain: The servant of many
masters. Trends Neurosci. 36:641–651. 2013. View Article : Google Scholar : PubMed/NCBI
|
|
18
|
Ung C, Sanchez AV, Shen L, Davoudi S,
Ahmadi T, Navarro-Gomez D, Chen CJ, Hancock H, Penman A, Hoadley S,
et al: Whole exome sequencing identification of novel candidate
genes in patients with proliferative diabetic retinopathy. Vision
Res. 139:168–176. 2017. View Article : Google Scholar : PubMed/NCBI
|
|
19
|
Jones AC, Patki A, Claas SA, Tiwari HK,
Chaudhary NS, Absher DM, Lange LA, Lange EM, Zhao W, Ratliff SM, et
al: Differentially methylated DNA regions and left ventricular
hypertrophy in african americans: A HyperGEN study. Genes (Basel).
13:17002022. View Article : Google Scholar : PubMed/NCBI
|
|
20
|
Liu S, Wei W, Wang P, Liu C, Jiang X, Li
T, Li F, Wu Y, Chen S, Sun K and Xu R: LOF variants identifying
candidate genes of laterality defects patients with congenital
heart disease. PLoS Genet. 18:e10105302022. View Article : Google Scholar : PubMed/NCBI
|
|
21
|
Xu MD, Liu SL, Feng YZ, Liu Q, Shen M, Zhi
Q, Liu Z, Gu DM, Yu J, Shou LM, et al: Genomic characteristics of
pancreatic squamous cell carcinoma, an investigation by using high
throughput sequencing after in-solution hybrid capture. Oncotarget.
8:14620–14635. 2017. View Article : Google Scholar : PubMed/NCBI
|
|
22
|
Lin Z, Xu H, Yang R, Li Z, Zheng H, Zhang
Z, Peng J, Zhang X, Qi S, Liu Y and Huang G: Effective treatment of
a BRAF V600E-mutant epithelioid glioblastoma patient by
vemurafenib: A case report. Anticancer Drugs. 33:100–104. 2022.
View Article : Google Scholar : PubMed/NCBI
|
|
23
|
Huang L, Zou T, Liang W, Mo C, Wei J, Deng
Y and Ou M: High-throughput sequencing reveals that rotundine
inhibits colorectal cancer by regulating prognosis-related genes. J
Pers Med. 13:5502023. View Article : Google Scholar : PubMed/NCBI
|
|
24
|
Li ZT, Zhu H, Wang XJ, Zhang LH and Zhang
L: Histone deacetylase 6: A potential therapeutic target for drug
development. Bioorg Chem. 165:1089322025. View Article : Google Scholar : PubMed/NCBI
|
|
25
|
Liang Y, Wang Y, Xing J, Li J and Zhang K:
The regulatory mechanisms and treatment of HDAC6 in immune
dysregulation diseases. Front Immunol. 16:16535882025. View Article : Google Scholar : PubMed/NCBI
|
|
26
|
Ran J, Yang Y, Li D, Liu M and Zhou J:
Deacetylation of α-tubulin and cortactin is required for HDAC6 to
trigger ciliary disassembly. Sci Rep. 5:129172015. View Article : Google Scholar : PubMed/NCBI
|
|
27
|
Zhou M, Zheng H, Li Y, Huang H, Min X, Dai
S, Zhou W, Chen Z, Xu G and Chen Y: Discovery of a novel AR/HDAC6
dual inhibitor for prostate cancer treatment. Aging (Albany NY).
13:6982–6998. 2021. View Article : Google Scholar : PubMed/NCBI
|
|
28
|
Gibbs A, Schwartzman J, Deng V and Alumkal
J: Sulforaphane destabilizes the androgen receptor in prostate
cancer cells by inactivating histone deacetylase 6. Proc Natl Acad
Sci USA. 106:16663–16668. 2009. View Article : Google Scholar : PubMed/NCBI
|
|
29
|
Ai J, Wang Y, Dar JA, Liu J, Liu L, Nelson
JB and Wang Z: HDAC6 regulates androgen receptor hypersensitivity
and nuclear localization via modulating Hsp90 acetylation in
castration-resistant prostate cancer. Mol Endocrinol. 23:1963–1972.
2009. View Article : Google Scholar : PubMed/NCBI
|
|
30
|
Peng J, Xie F, Qin P, Liu Y, Niu H, Sun J,
Xue H, Zhao Q, Liu J and Wu J: Recent development of selective
inhibitors targeting the HDAC6 as anti-cancer drugs: Structure,
function and design. Bioorg Chem. 138:1066222023. View Article : Google Scholar : PubMed/NCBI
|
|
31
|
Pulya S, Amin SA, Adhikari N, Biswas S,
Jha T and Ghosh B: HDAC6 as privileged target in drug discovery: A
perspective. Pharmacol Res. 163:1052742021. View Article : Google Scholar : PubMed/NCBI
|
|
32
|
Hu SW, Wu CC, Dong SW, Tzou KY, Chen CH,
Wang YH, Liu YN, Liao CC and Li CH: Implications of the KHDC4-TRAF2
axis in the context of prostate cancer prognosis. Aging (Albany
NY). 17:1544–1570. 2025.PubMed/NCBI
|
|
33
|
Wu CC, Hu SW, Dong SW, Tzou KY and Li CH:
The prognostic and neuroendocrine implications of SLC25A29-mediated
biomass signature in prostate cancer. Geroscience. 47:4711–4732.
2025. View Article : Google Scholar : PubMed/NCBI
|
|
34
|
Livak KJ and Schmittgen TD: Analysis of
relative gene expression data using real-time quantitative PCR and
the 2(−Delta Delta C(T)) method. Methods. 25:402–408. 2001.
View Article : Google Scholar : PubMed/NCBI
|
|
35
|
Li CH, Chan MH and Chang YC: The role of
fructose 1,6-bisphosphate-mediated glycolysis/gluconeogenesis genes
in cancer prognosis. Aging (Albany NY). 14:3233–3258. 2022.
View Article : Google Scholar : PubMed/NCBI
|
|
36
|
Li CH, Chan MH, Chang YC and Hsiao M: The
CHST11 gene is linked to lung cancer and pulmonary fibrosis. J Gene
Med. 24:e34512022. View Article : Google Scholar : PubMed/NCBI
|
|
37
|
Li CH, Fang CY, Chan MH, Chen CL, Chang YC
and Hsiao M: The cytoplasmic expression of FSTL3 correlates with
colorectal cancer progression, metastasis status and prognosis. J
Cell Mol Med. 27:672–686. 2023. View Article : Google Scholar : PubMed/NCBI
|
|
38
|
Li CH, Fang CY, Chan MH, Lu PJ, Ger LP,
Chu JS, Chang YC, Chen CL and Hsiao M: The activation of EP300 by
F11R leads to EMT and acts as a prognostic factor in
triple-negative breast cancers. J Pathol Clin Res. 9:165–181. 2023.
View Article : Google Scholar : PubMed/NCBI
|
|
39
|
Kim S, Lee K, Choi JH, Ringstad N and
Dynlacht BD: Nek2 activation of Kif24 ensures cilium disassembly
during the cell cycle. Nat Commun. 6:80872015. View Article : Google Scholar : PubMed/NCBI
|
|
40
|
Valenzuela-Fernández A, Cabrero JR,
Serrador JM and Sánchez-Madrid F: HDAC6: A key regulator of
cytoskeleton, cell migration and cell-cell interactions. Trends
Cell Biol. 18:291–297. 2008. View Article : Google Scholar : PubMed/NCBI
|
|
41
|
Chen P and Zhang YL: Role of HDAC6 in
carcinomas. Discov Oncol. 17:2402026. View Article : Google Scholar : PubMed/NCBI
|
|
42
|
Godbole AM and Njar VCO: New insights into
the androgen-targeted therapies and epigenetic therapies in
prostate cancer. Prostate Cancer. 2011:9187072011. View Article : Google Scholar : PubMed/NCBI
|
|
43
|
Ye PC, Leu WJ, Yeh TY, Hsu YT, Lin YC, Wei
ZY, Chen YC, Chiang YC, Hsu JL, Chan SH, et al: A novel HDAC6
inhibitor interferes microtubule dynamics and spindle assembly
checkpoint and sensitizes cisplatin-induced apoptosis in
castration-resistant prostate cancer. Prostate. 84:605–619. 2024.
View Article : Google Scholar : PubMed/NCBI
|
|
44
|
Pramanik SD, Kumar Halder A, Mukherjee U,
Kumar D, Dey YN and R M: Potential of histone deacetylase
inhibitors in the control and regulation of prostate, breast and
ovarian cancer. Front Chem. 10:9482172022. View Article : Google Scholar : PubMed/NCBI
|
|
45
|
Eguether T and Hahne M: Mixed signals from
the cell's antennae: Primary cilia in cancer. EMBO Rep.
19:e465892018. View Article : Google Scholar : PubMed/NCBI
|
|
46
|
Mill P, Christensen ST and Pedersen LB:
Primary cilia as dynamic and diverse signalling hubs in development
and disease. Nat Rev Genet. 24:421–441. 2023. View Article : Google Scholar : PubMed/NCBI
|
|
47
|
Kiseleva AA, Nikonova AS and Golemis EA:
Patterns of ciliation and ciliary signaling in cancer. Rev Physiol
Biochem Pharmacol. 185:87–105. 2023. View Article : Google Scholar : PubMed/NCBI
|
|
48
|
Zheng M, Zhou J and Wang Y: Primary cilia
in cancer: Structures, functions, mechanisms, and therapeutic
implications. Cancer Biol Med. 22:1455–1472. 2025.PubMed/NCBI
|
|
49
|
Collinson R and Tanos B: Primary cilia and
cancer: A tale of many faces. Oncogene. 44:1551–1566. 2025.
View Article : Google Scholar : PubMed/NCBI
|
|
50
|
Kaushal JB, Seshacharyulu P, Batra SK and
Muniyan S: Multifaceted role of primary cilia and ciliary proteins:
A potential nexus for hedgehog signaling and prostate cancer.
Biochim Biophys Acta Mol Basis Dis. 1872:1681202026. View Article : Google Scholar : PubMed/NCBI
|
|
51
|
O'Toole SM and Chapple JP: Primary cilia:
A link between hormone signalling and endocrine-related cancers?
Biochem Soc Trans. 44:1227–1234. 2016. View Article : Google Scholar : PubMed/NCBI
|
|
52
|
Matissek SJ and Elsawa SF: GLI3: A
mediator of genetic diseases, development and cancer. Cell Commun
Signal. 18:542020. View Article : Google Scholar : PubMed/NCBI
|
|
53
|
Gao L and Alumkal J: Epigenetic regulation
of androgen receptor signaling in prostate cancer. Epigenetics.
5:100–104. 2010. View Article : Google Scholar : PubMed/NCBI
|
|
54
|
Tran HY, Lin CL, Lin HY, Shen CJ, Sharma
R, Liou JP and Hsu TI: A dual CYP17A1/HDAC6 inhibitor for targeted
prostate cancer therapy. FASEB J. 39:e711522025. View Article : Google Scholar : PubMed/NCBI
|

















