Introduction
Isocitrate dehydrogenase (IDH) enzymes are key
players in various metabolic processes, such as the tricarboxylic
acid cycle, lipogenesis, glutamine metabolism and redox regulation
(1). These
NAD(P)+-dependent enzymes catalyze the conversion of
isocitrate to α-ketoglutarate (α-KG) via oxidative decarboxylation
and generates NAD(P)H (2).
Mutations in IDH1 were first identified in human glioma tissue
biopsies by whole genome sequencing, and it was observed that the
mutations occur in a large fraction of patients with secondary
glioblastoma (3). The most
critical is a point mutation where arginine is replaced by
histidine (R132H) at the 132nd position. The IDH1 mutation status
is currently included as an essential criterion for glioma
classification by the World Health Organization classification of
the Central Nervous System Tumors (4,5).
It has been previously reported that IDH1 mutation
generates increased levels of reactive oxygen species (ROS) in
cells via its enzymatic product, 2-hydroxyglutarate (2-HG)
(6). The generated ROS can thus
interact with several biomolecules, leading to the activation of
signaling events and consequently to robust responses, such as the
activation of the antioxidant pathway and DNA damage repair
pathways. Among these, the ROS-mediated activation of various
sanitation enzymes, such as MutT homolog1 (MTH1) has been reported
(7). MTH1 belongs to a superfamily
of enzymes known as the nucleoside diphosphates linked to moiety-X
(NUDIX) hydrolases and is potentially the only enzyme involved in
preventing mutations in DNA (8).
In a previous study, the authors reported that the silencing of
MTH1 affected glioma cell migration and invasion, and inhibited the
regulators of angiogenesis (9).
In the present study, it was hypothesized that
mutant IDH1 (mIDH1) and its product, 2-HG, is responsible for the
activation of MTH1, via the production of ROS. To examine this
hypothesis, two human cell lines [U87 (glioblastoma of unknown
origin) and U251 (astrocytoma)] were transfected with mIDH1 plasmid
and MTH1 expression was examined in these cells. The
mIDH1-expressing cells exhibited an increased MTH1 expression. When
2-HG, a product of mIDH1 enzyme, was exogenously supplied to the
cells, MTH1 expression was found to be significantly elevated. The
results also suggested that 2-HG was a major contributor of
increased ROS generation in mIDH1-expressing cells. In order to
verify the aforementioned findings obtained using the cell lines,
MTH1 expression levels/activity was examined in IDH1 wild-type (wt)
gliomas and gliomas with IDH1 mutation. A positive correlation was
also found between MTH1 and mIDH1 expression in glioma patient
biopsies. Consistent with this finding, the
8-oxo-7,8-dihydro-2'-deoxyguanosine (8-oxo-dG) levels, which are
indicative of MTH1 activity, were found to be higher in the
mIDH1-harboring glioma biopsies than the wt-IDH1 biopsies. On the
whole, the present study provides evidence of the role of
mIDH1/2-HG-mediated ROS production in the activation of MTH1 in
both mIDH1 glioma cell lines and in glioma tissues harboring
mIDH1.
Materials and methods
Collection of tissue biopsies
Human glioma tissue biopsies were collected (from
January, 2017 to December, 2019) from the Department of
Neurosurgery, Sree Chitra Tirunal Institute for Medical Sciences
and Technology, Trivandrum, India, according to the protocols
approved by the Institutional Ethical Committee (Institutional
Ethics Committee Approval no. SCT/IEC/932/AUGUST-2016). In total,
57 glioma biopsies were selected for the study (30 samples with
wild-type IDH1 and 27 samples carrying the IDH mutation). The
patients selected for the study were in the age range of 7-65 years
with a median age of 42. Informed written consent was obtained from
the patients or relatives prior to tissue collection and
processing, which has been previously described (9). For patients who were <18 years of
age, consent was obtained by the parents of those patients. A
summary of patient characteristics is presented in Table I.
 | Table ISummary of the patient
characteristics. |
Table I
Summary of the patient
characteristics.
| | Sex |
|---|
| No. of cases | Tumor grade | Age (range) | Female | Male |
|---|
| 17 | LGG | 11-65 | 8 | 9 |
| 40 | HGG | 7-63 | 11 | 29 |
Cell culture, plasmid DNA isolation
and transfection
The U87MG cells (glioblastoma of unknown origin) and
the U251MG human astrocytoma cell line used in the experiments were
procured from the National Centre for Cell Science (NCCS, Pune,
India). The U87MG cells were authenticated at NCCS using short
tandem repeat (STR) analysis. The cells were grown in DMEM (low
glucose) (Sigma-Aldrich; Merck KGaA) at 37˚C with 5%
CO2. pcDNA3-Flag-IDH1-R132H was a kind gift from Dr Yue
Xiong (Addgene plasmid cat. no. 62907; http://n2t.net/addgene:62907; RRID: Addgene_62907;
Addgene, Inc.) (10). Pure
colonies were selected from ampicillin-containing LB agar plates
and then grown in LB broth (MilliporeSigma) at 37˚C. Plasmid DNA
was then isolated using the SmartPure Plasmid DNA Isolation kit
(Eurogentech). The DNA (10 µg/ml) mixed with transfection reagent
and its buffer was used for transfecting the glioma cells
(1x10⁴ cells) cultured in a 12-well culture plate.
Transfection was performed using the Jetprime transfection kit
(Polyplus-transfection SA) for 4 h in serum-free DMEM and the
medium was changed to 10% FBS-containing medium after 4 h. The
cells were used for the experiments after 48 h. The concentrations
of 2-HG, N-acetylcysteine (NAC) and mutant IDH1 inhibitor used were
reported earlier in various studies (11,12).
A total of 30 mM 2-HG, 2 µM mIDH1 inhibitor (AGI-5198) and 1 mM NAC
(all from Sigma-Aldrich; Merck KGaA) were used for the
experiments.
Intracellular ROS measurements
The intracellular ROS levels were measured in
cultured cells after the various treatments using
dichlorodihydrofluorescein diacetate (DCF-DA; D6883-50MG;
Sigma-Aldrich; Merck KGaA). The cells were cultured in a 96-well
black plate at a seeding density of 1x10⁴ cells per
well. The wells were washed with HBSS (MilliporeSigma) after
treatment and incubated with 10 µM DCFH-DA at 37˚C in the dark for
1 h. The cells treated with 100 µM H2O2
(MilliporeSigma) for 30 min were used as a positive control. The
wells were washed twice with HBSS to remove excess dye, and the DCF
fluorescence developed was measured using a fluorimeter (BioTek
instruments, Inc.) at 530 nm (excitation 488 nm), using Gen5
softwarev2.0 (BioTek instruments, Inc.). The relative fluorescence
of the treated groups to the control was calculated using the
fluorescence intensities from triplicates.
Western blot analysis
The cells and glioma tissues were processed for
protein expression analysis and probed for desired proteins along
with loading controls. The culture plates having either U87MG or
U251MG cells were decanted off the medium and washed thrice
thoroughly with ice-cold PBS to remove all traces of media and
other chemicals. After decanting off the PBS, the cells were
incubated for 5 min in ice-cold radio immunoprecipitation assay
(RIPA) (Thermo Fisher Scientific, Inc.) buffer containing
protease/phosphatase inhibitor cocktail. The cells were scraped
using a cell scraper and the lysate was then collected in a
microcentrifuge tube. The lysates were then incubated 30 min in ice
with vortexing at regular intervals of 5 min. The cell lysates were
centrifuged at 16,500 x g for 15 min at 4˚C and the supernatants
were stored at -80˚C. The glioma and as non-tumor tissues after
weighing were pulverized using RIPA buffer with
protease/phosphatase inhibitor cocktail (Thermo Fisher Scientific,
Inc.). The supernatant was collected and stored as mentioned above.
The isolated proteins were quantified using the bicinchoninic acid
assay method (Pierce; Thermo Fisher Scientific, Inc.).
The protein lysates (30-60 µg) were mixed with 6X
Laemmli buffer containing 2-mercaptoethanol (2-ME) (Thermo Fisher
Scientific, Inc.), heat denatured for 5 min at 95˚C and resolved on
5-12% polyacrylamide gels using Tris-Glycine-SDS buffer. The
resolved proteins were transferred to a PVDF membrane (pre-wetted
with 100% methanol) using a Trans semi-dry blot apparatus (Bio-Rad
Laboratories, Inc.) at 10 V for 30-40 min. The membrane was blocked
for 1 h at room temperature using either 5% skimmed milk (for
non-phosphoprotein detection) or 1% bovine serum albumin (BSA)
solutions in TBST. The membrane was then probed with antibodies
(prepared in 3% BSA-TBST) specific to the target proteins at 4˚C
overnight. Secondary antibodies conjugated to horseradish
peroxidase (HRP; anti-rabbit IgG; cat. no. 7074S; 1:5,000-1:8,000;
anti-mouse IgG; cat. no. 7076; 1:10,000-1:20,000; both secondary
antibodies were from Cell Signaling Technology, Inc.) were used to
probe the primary antibodies by incubation for 1 h at room
temperature. Protein bands were visualized using Enhanced
Chemiluminescence (Thermo Fisher Scientific, Inc.) detection. Equal
volumes of luminol and peroxide solutions were mixed and added on
to the membranes. Light emitting bands were captured on an X-ray
film and developed and then documented in Gel Doc™ XR
Imaging System (Bio-Rad Laboratories, Inc.) and quantified using
Quantity One 1 D Analysis Software (Version 4.6.7, Bio-Rad
Laboratories, Inc.).
The primary antibodies used were as follows: MTH1
(1:500; cat. no. NB100-109, Novus Biologicals, Inc.), vinculin
(;1:1,000; cat. no. 13901, Cell Signaling Technology, Inc.),
manganese superoxide dismutase (Mn-SOD; 1:1,000; cat. no. ab68155,
Abcam), glutathione peroxidase (GPx; 1;1,000; cat. no. ab125066,
Abcam), mIDH1 (1:500; cat. no. SAB4200548), FLAG (1:500; cat. no.
F2555) and β-actin (1:2,000; cat. no. A2228) (all from
Sigma-Aldrich; Merck KGaA).
Enzyme immunoassays
The Universal 8-oxo-dG ELISA kit (ImmunoTag) was
used in order to measure the levels of 8-oxo-dG, which is an
indicator of MTH1 activity. The cells/tissue lysates were prepared
according to the protocol provided with the kit and added in
triplicate into the 96-well plate coated with antibody against
8-oxo-dG. Briefly, the biotinylated antibodies were added which was
followed by streptavidin-HRP for labeling. The substrate (provided
with the kit) for HRP was then added for color development and the
reaction was terminated after 10 min. The absorbance was then
measured at 450 nm using an ELISA plate reader (BioTek Instruments,
Inc.) and the 8-oxo-dG concentrations were extrapolated from their
respective standard curves.
Immunofluorescence staining
8-Oxoguanineglycosylase-1 (OGG1) expression was
analyzed in the cells using immunocytochemistry. Briefly, the cells
were fixed, permeabilized and incubated with blocking buffer. The
cells were then incubated with anti-OGG1 antibody (1:200; (cat. no.
ITA6482; ImmunoTag) for overnight at 4˚C. After washing, the cells
incubated with secondary antibody (anti-rabbit; 1:10,000; Cell
Signaling Technology, Inc.; cat. no. 7074S) and then observed under
a fluorescence microscope (Olympus Corporation) once stained with
DAPI (Sigma-Aldrich; Merck KGaA) for 15 min in the dark at room
temperature. The images captured were analyzed using ImageJ
software v1.49 (National Institutes of Health) and the mean
fluorescence intensity normalized to the cell count was
estimated.
Sanger sequencing
Genomic DNA from frozen tissue sections from the
glioma tissue biopsies was isolated using the HiPura™
Mammalian Genomic DNA Purification kit (HiMedia). The target region
(Exon 4 of IDH1) was amplified using the following forward and
reverse primer set: IDH1 forward, 5'-CGGTCTTCAGAGAAGCCATT-3' and
reverse, 5'-GCAAAATCACATTATTGCCAAC-3'. A total of 50 ng isolated
DNA was amplified using the primers for 30 cycles (95˚C for 40 sec,
60˚C for 40 sec, and 72˚C for 1 min). following the purification of
the PCR product, cycle sequencing was carried out using the ABI Big
Dye Terminator v.3.1 kit (Thermo Fisher Scientific, Inc.). PCR
products were resolved by electrophoresis on an 8 capillary ABI
3500 model sequencer (Thermo Fisher Scientific, Inc.). In this
case, cycle sequencing was performed separately in both the forward
and reverse directions. The sequences obtained were analyzed using
the BioEdit tool (Tom Hall, Ibis Biosciences) and the corresponding
genotypes were recorded.
Statistical analysis
All data are presented as the mean ± SEM.
Statistical analyses were performed using GraphPad Prism 5 software
(GraphPad Software, Inc.). The Shapiro-Wilk test was used to test
the normality of the data. Non-parametric tests were used for those
data which were not normally distributed. Parametric tests were
used for those data which were normally distributed. For
comparisons between two groups, an unpaired t-test was used for
cell line data and the Mann Whitney test for patient-derived data.
In case of multiple group comparisons, for parametric analysis,
one-way ANOVA followed by Tukey's or Dunnett's multiple comparisons
test was performed. For non-parametric analysis, the Kruskal-Wallis
test with Dunn's post hoc test were used. Pearson's correlation
coefficient was used for examining the correlation between MTH1 and
mIDH1 expression. P-values ≤0.05 were considered to indicate
statistically significant differences.
Results
mIDH1 expression and 2-HG-treatment
enhance the MTH1 levels in glioma cells
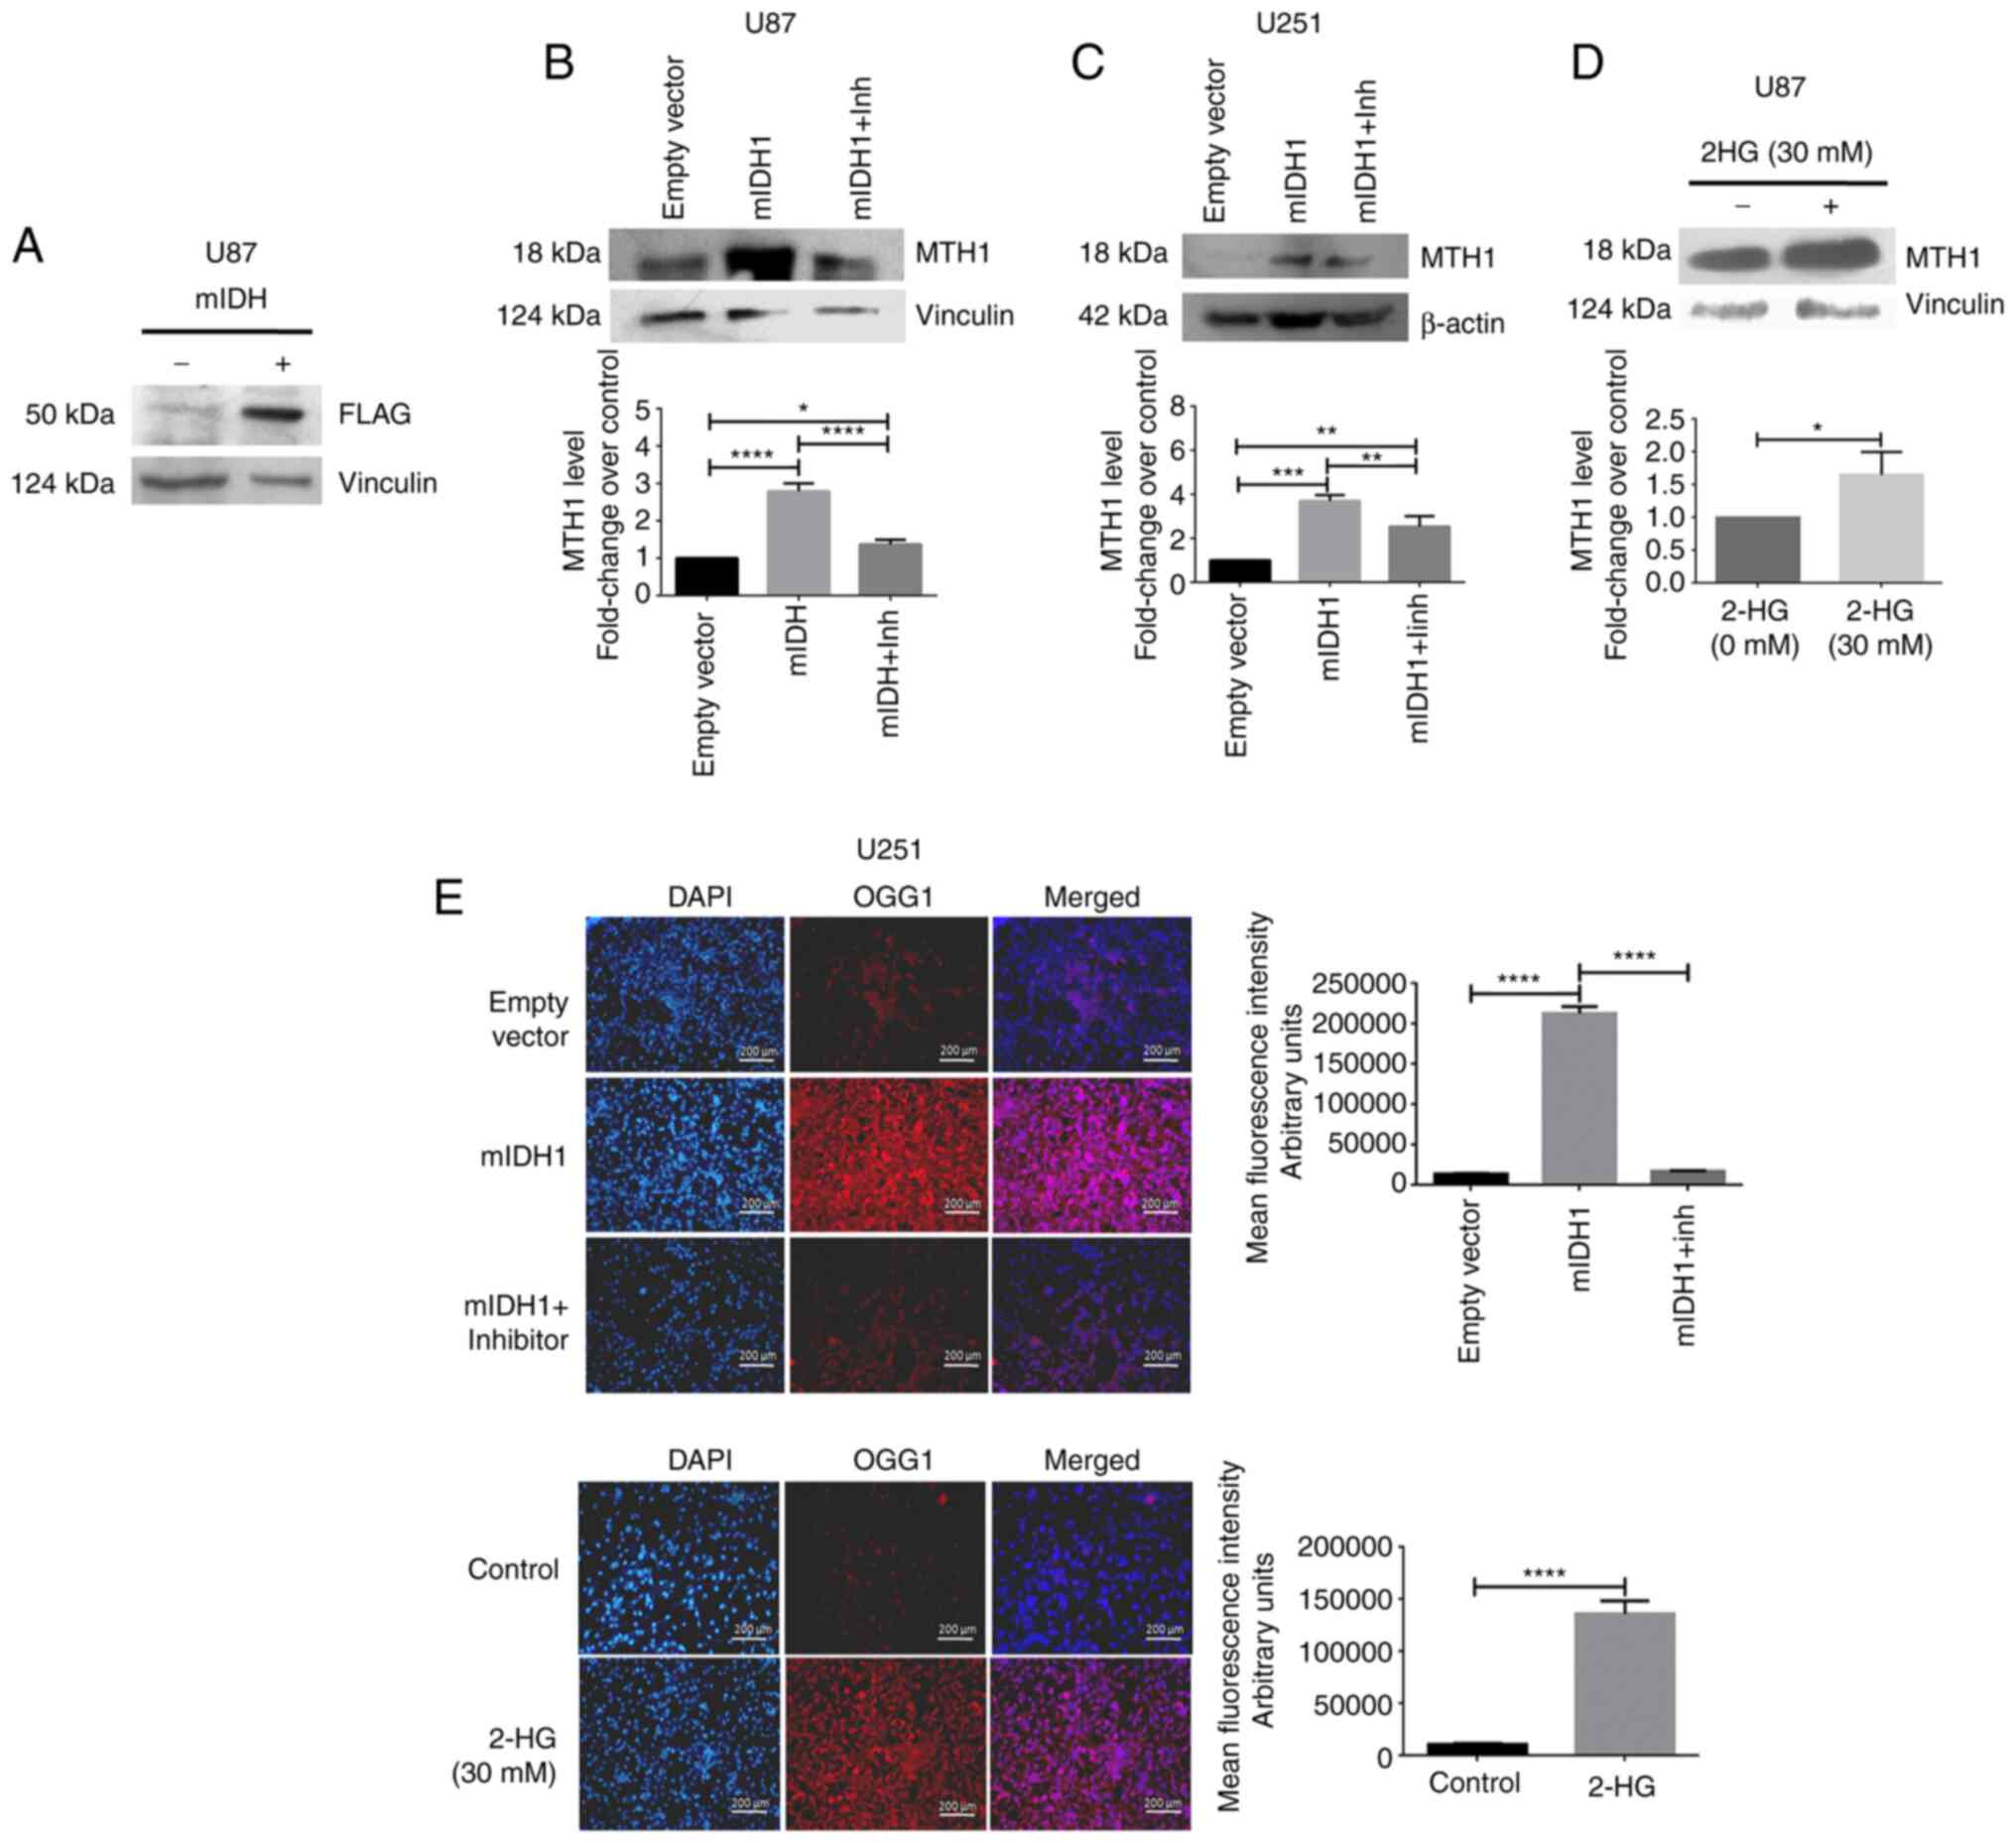
In order to examine whether mIDH1 has any effect on
the expression of MTH1, a FLAG-tagged plasmid carrying the mutant
IDH1 (R132H) was expressed in the U87MG and U251MG cells. FLAG
expression indicating successful transfection is illustrated in
(Fig. 1A). Western blot analysis
of the protein isolated from U87MG cells revealed that MTH1
expression was significantly increased (P<0.0001, 2.79±1.22;
Fig. 1B) in mIDH1-expressing cells
compared to the empty vector-transfected wt-IDH1 cells. Upon the
inhibition of mIDH1 using a specific inhibitor (AGI-5198), the MTH1
protein levels were significantly decreased P<0.0001, 1.37±0.07;
(Fig. 1B). Similar results were
also obtained with the U251 cells (Fig. 1C). Subsequently, the U87MG cells
treated with 2-HG exhibited a significant increase in MTH1
expression (P=0.0308, 1.65±0.20) compared to the untreated control
(Fig. 1D). When examining the
expression of OGG1, a base excision repair enzyme, its expression
was significantly increased in mIDH1-expressing and 2-HG-treated
U251 cells; however, upon the inhibition of mIDH1 with its specific
inhibitor, its expression was reduced (Fig. 1E).
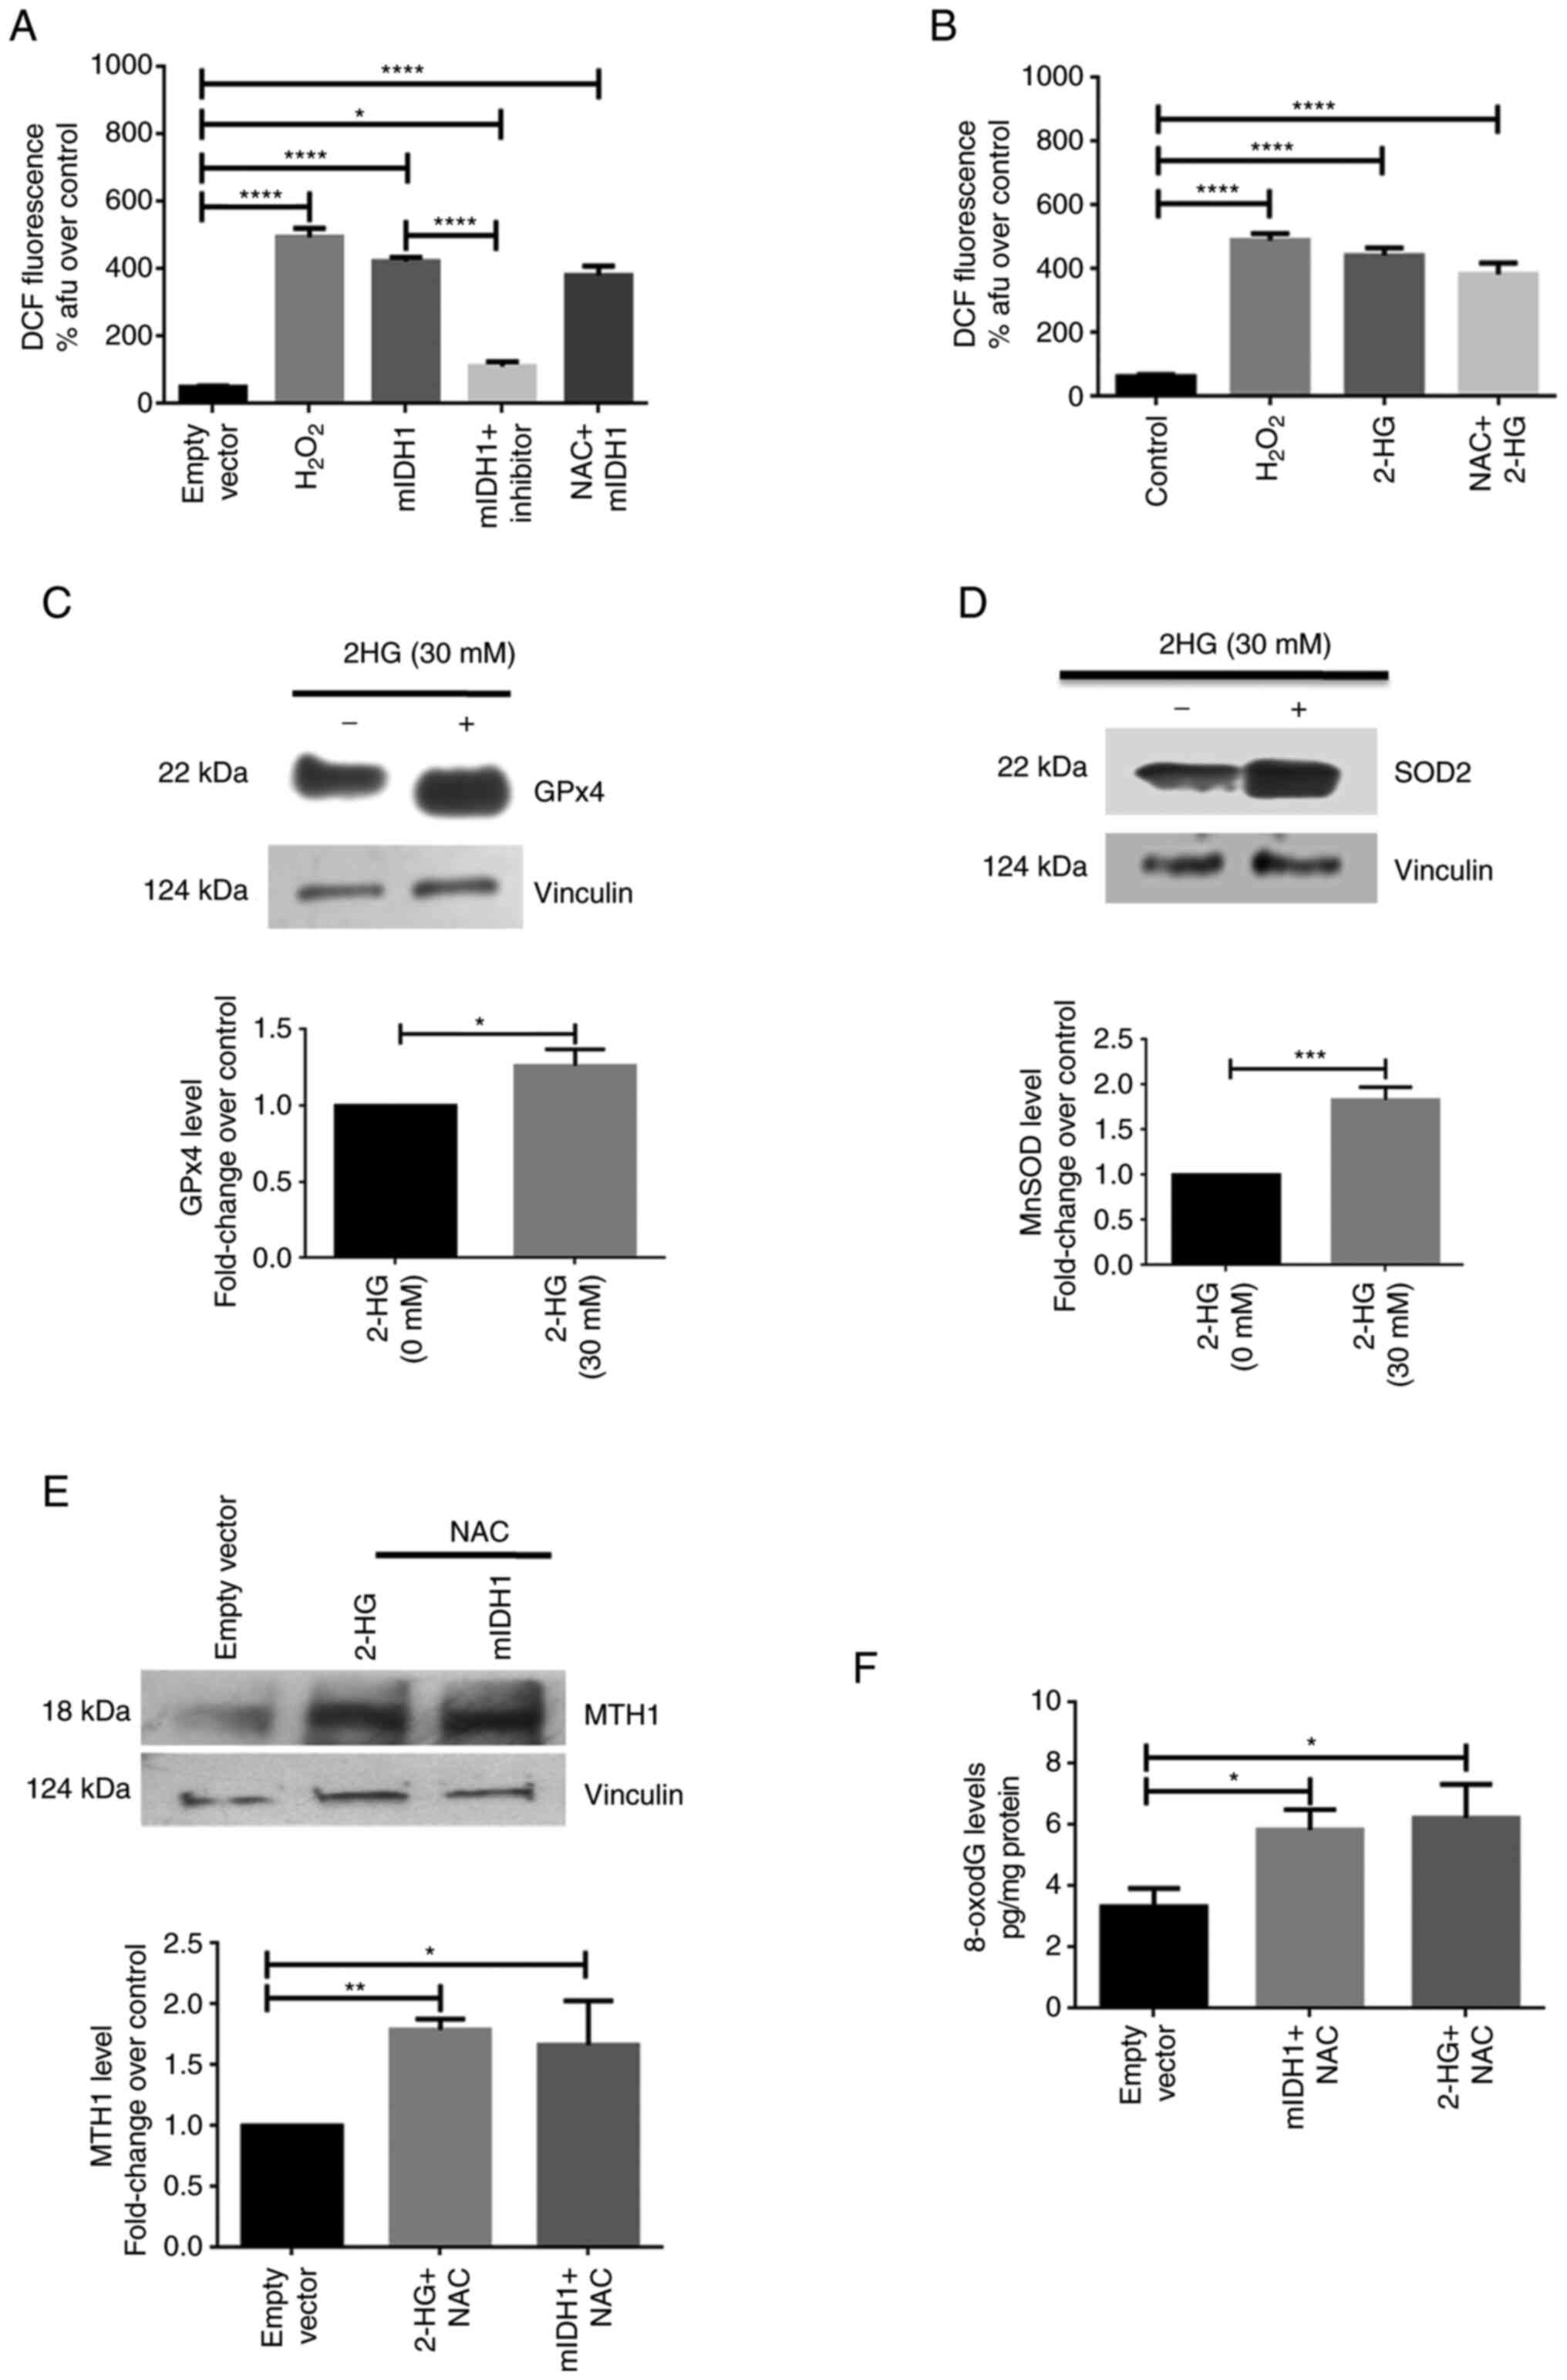
mIDH1/2-HG contributes to high ROS
levels in glioma cells
The DCF-DA assay was performed to determine whether
ROS are produced due to mIDH1 expression or its product, 2-HG, in
U87 cells. Cells transfected with plasmid carrying mIDH1 or treated
with 2-HG were subjected to fluorometric analysis for the detection
of ROS. The measurements of DCF fluorescence revealed a significant
increase in the ROS levels in cells expressing mIDH1. The
mIDH1-expressing cells exhibited a 8.51-fold increase in
fluorescence intensity (P<0.0001, 422.7±7.45) than cells
harboring the empty vector (49.67±1.67) (Fig. 2A). In addition, in the 2-HG-treated
cells, the ROS fluorescence levels were increased 7.0-fold
(P<0.0001, 443±13.43) when compared to the untreated control
(63.33±3.18). (Fig. 2B). Moreover,
in mIDH1-expressing cells treated with the specific mIDH1
inhibitor, DCF fluorescence decreased 3.4-fold (P<0.0001,
112±7.94) vs. the mIDH1-expressing cells (Fig. 2A).
Pre-treatment of both mIDH1-expressing cells and
2-HG-treated cells with NAC, a ROS scavenger, prevented the
inhibition of the formation of ROS under these conditions
(6.06-fold, P<0.0001, 384±19.92; and 7.67-fold, P<0.0001,
381±16.56, respectively) compared to the respective control groups
(Fig. 2A and B). H2O2 was used as
a positive control in these experiments. In addition, the levels of
the two antioxidant enzymes, GPx4 and MnSOD, were determined upon
treatment of the U87MG cells with 2-HG using western blot analysis.
The levels of the antioxidant enzymes, GPx4 (P=0.0136, 1.26±0.06)
and MnSOD (P=0.0005, 1.83±0.08), were increased in the presence of
2-HG (Fig. 2C and D).
The U87 MG cells expressing mIDH1 were pre-treated
with 1 mM NAC for 24 h and then probed for MTH1 protein levels. In
another group, NAC-pre-treated U87MG cells were exposed to 30 mM
2-HG for 48 h. Western blot analysis of proteins isolated from
these NAC-pre-treated cells exhibited an elevated MTH1 expression
both following mIDH1 transfection (P=0.0158, 1.67±0.21) and 2-HG
treatment (P=0.0073, 1.79±0.05) (Fig.
2E). A significant increase in 8-oxodG levels was also observed
in the NAC-pre-treated cells expressing mIDH1 (P=0.0218,
5.84±0.38), as well as in those treated with 2-HG (P=0.0115,
6.23±0.63) (Fig. 2F).
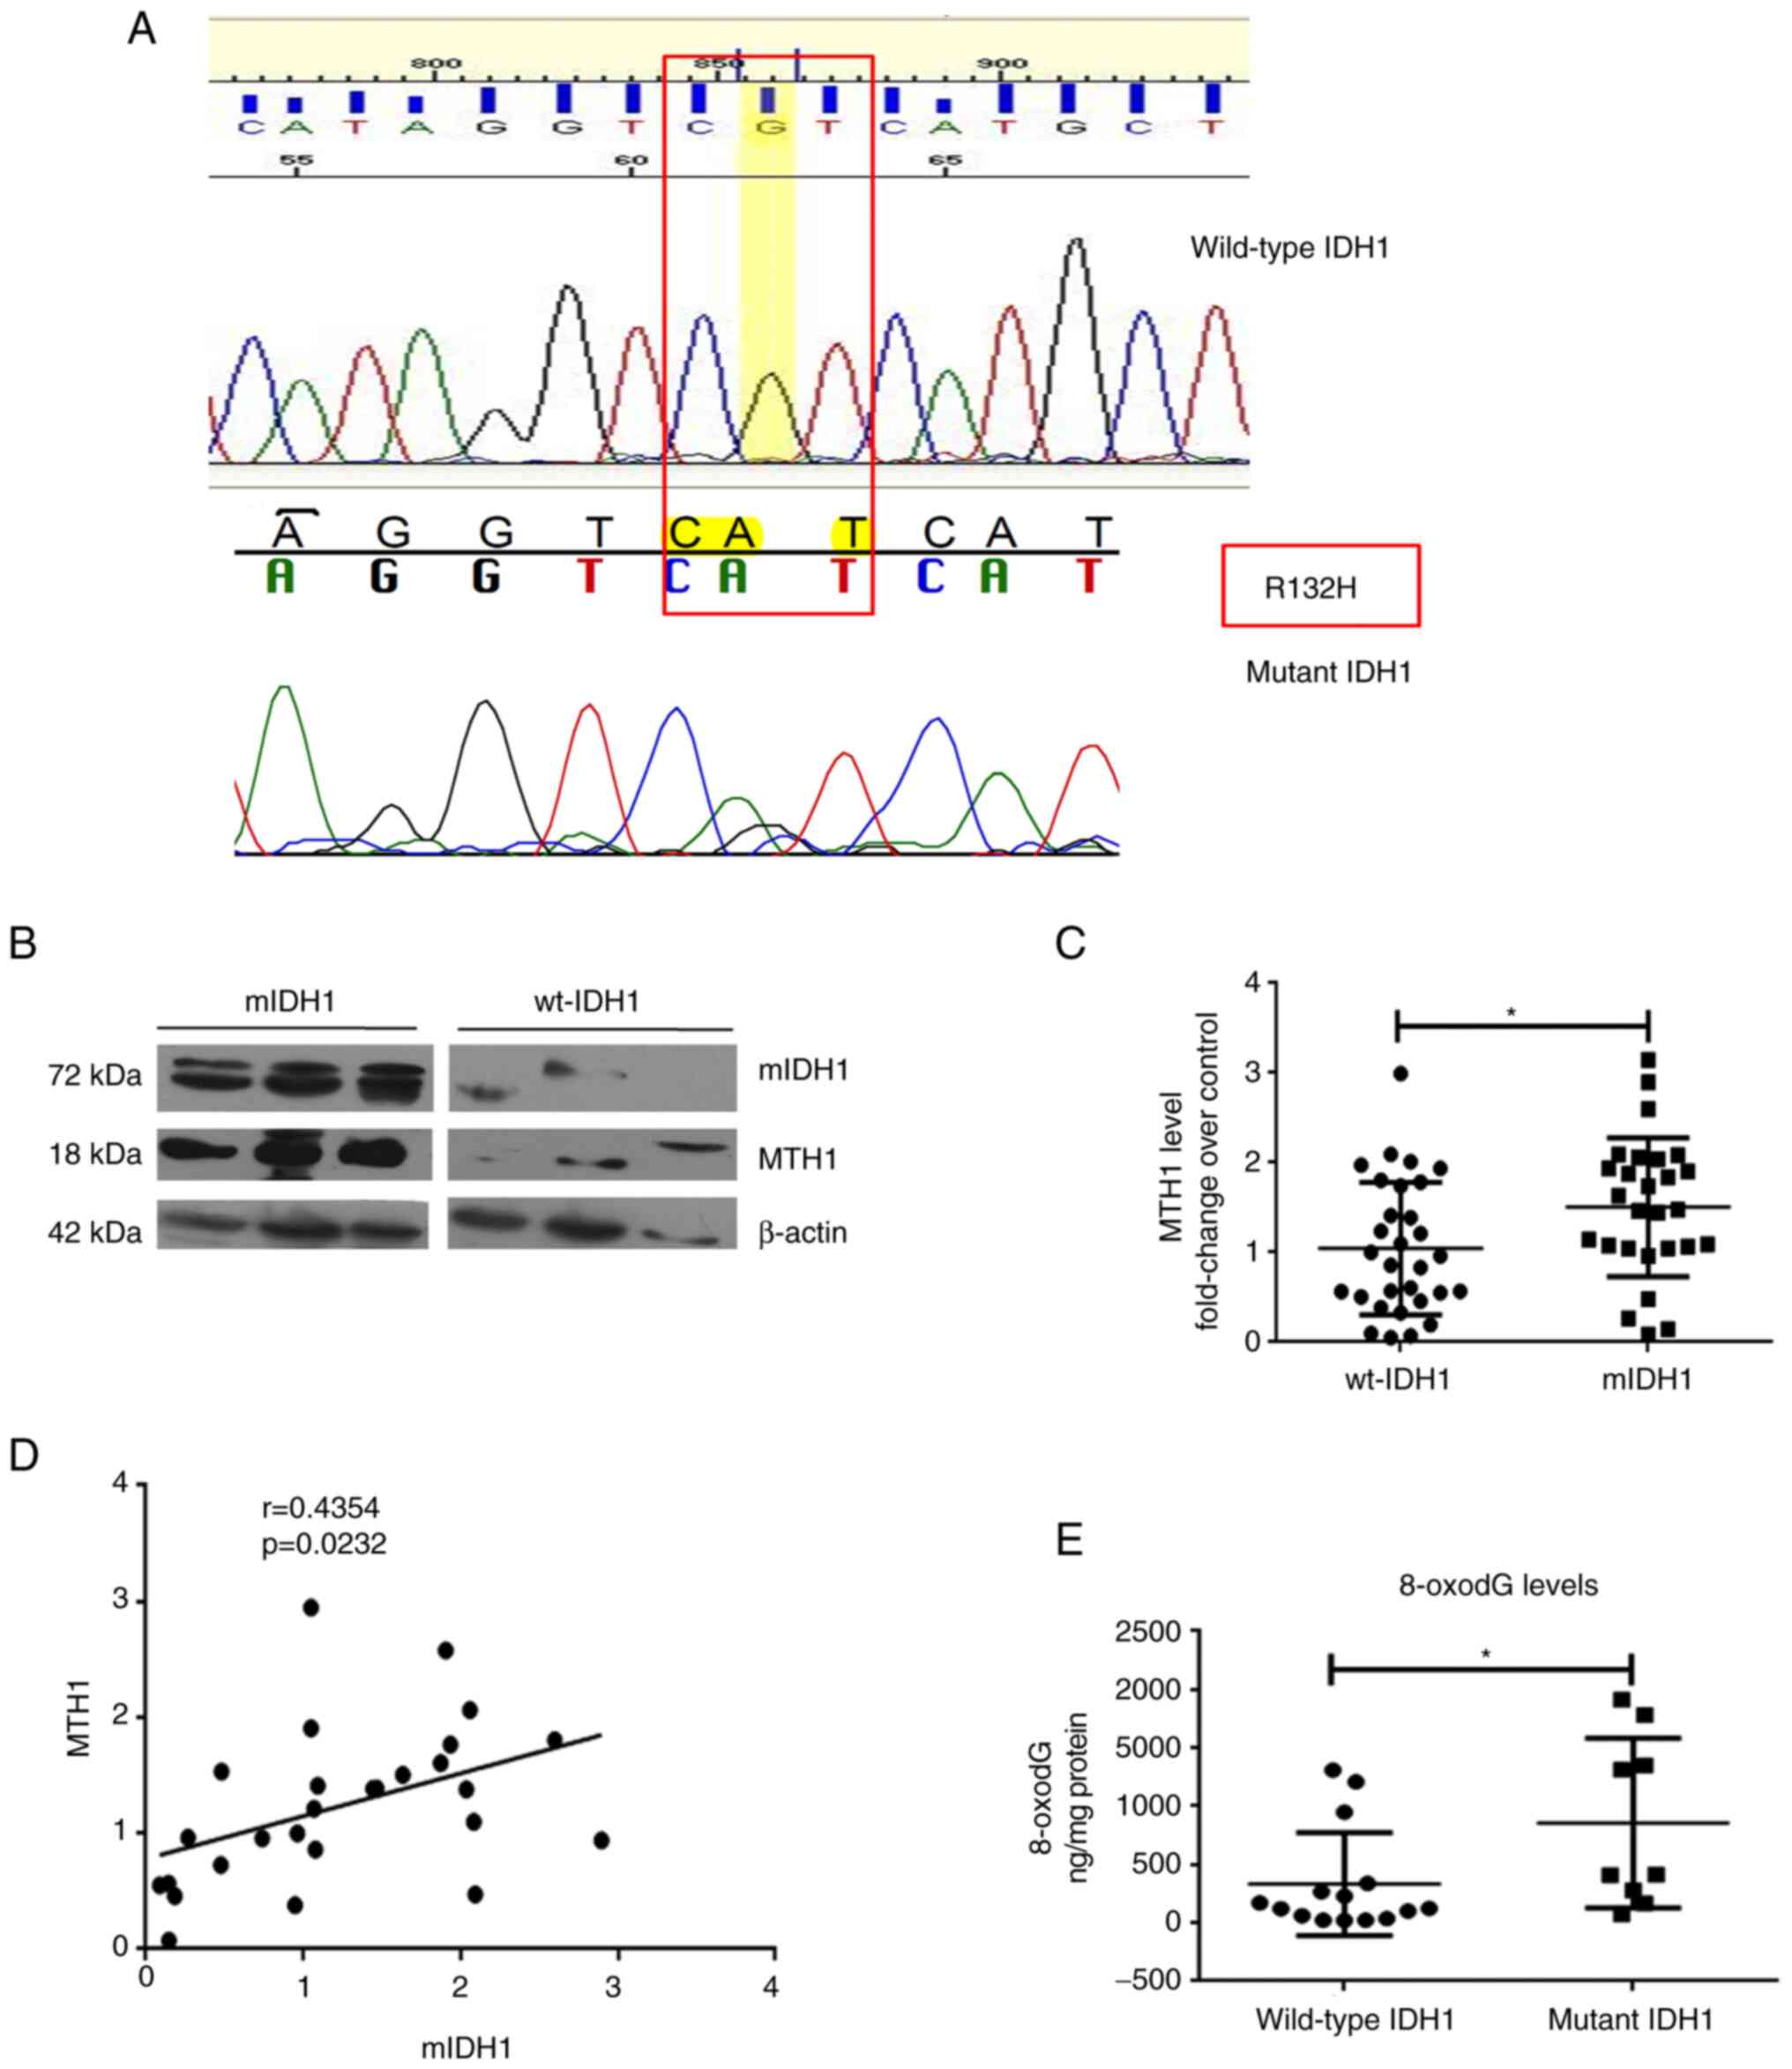
Increased MTH1 expression and activity
in mIDH1-harboring glioma tissues
The DNA sequencing data of a subset of patient
samples (n=21) denoting the IDH1 status revealed that 5 patients
had the R132H mutation (Fig. 3A).
Out of the 57 glioma samples, MTH1 expression was found to be
elevated in patients harboring mIDH1 when compared to those
harboring wt-IDH1. Western blot analyses of the glioma tissues
revealed that MTH1 expression was significantly upregulated
(P=0.0249) in patients harboring the mIDH1 (n=27, 1.51±0.15) when
compared to patients carrying wt-IDH1 (n=30, 1.04±0.13) (Fig. 3B and C). In patients with mIDH1, there was a
moderate positive correlation between mIDH1 and MTH1 expression
(n=27; r=0.4354, P=0.0232) (Fig.
3D).
Subsequently, the 8-oxo-dG levels, which are
indicative of the activity of the MTH1 enzyme, were measured in
glioma tissue biopsy extracts using immunoassay. The results
revealed increased 8-oxo-dG levels in those patients harboring
mIDH1 (n=15; 855.3±242.6 ng/mg) compared to patients with wt-IDH1
(n=9; 332.6±114.1 ng/mg; P=0.0148; Fig. 3E), which was in concordance with
the correlation found between MTH1 and mIDH1 expression. This
indicated that concurrent with the high MTH1 expression pattern
observed in the mIDH1 glioma samples, there was a relative increase
in MTH1 activity as well.
Discussion
The oxidative damage of biomolecules, such as
proteins, DNA and lipids due to elevated ROS levels promotes
pro-tumorigenic signaling, cancer cell proliferation, cell
survival, cancer metastasis, apoptosis, and adaptation to hypoxia
(13,14). Research pertaining to IDH mutations
in the pathobiology of cancers, particularly gliomas is increasing
worldwide. The R132H substitution, the frequently observed IDH1
mutation in gliomas is caused by the G→A transition at nucleotide
position 395 of codon 132(15).
Cancer-associated IDH mutations lead to the formation of an
oncometabolite, 2-HG (16) and an
associated increased ROS environment in cells and subsequent
oxidative stress, which is a major hallmark of cancers with IDH
mutations (17). 2-HG, being the
structural analogue of α-KG, competitively inhibits various
α-KG-dependent enzymes, α-keto acid transaminase, the inhibition of
DNA break repair and the methylation of histones, such as H3K4,
H3K9 and H3K27 (15-18).
Since increased ROS levels are associated with a
greater propensity for oxidant-mediated DNA damage in cells, it was
hypothesized that mIDH1/2-HG may induce the expression of MTH1, an
enzyme responsible for sanitizing the oxidant nucleotide pool in
cells. The results of the present study are in line with the
initial hypothesis of the authors (as aforementioned), and
2-HG-treated and mIDH1-expressing U87MG, as well as U251 cells,
exhibited a high level of MTH1 expression. The increased MTH1
expression in mIDH1-expressing cells was significantly decreased
upon treatment with a specific mIDH1 inhibitor (AGI-5198), which
establishes the role of mIDH1/2-HG in regulating MTH1 levels in
cells.
Augmented ROS levels observed in both
mIDH1-expressing and 2-HG-treated cells are in concordance with an
earlier report (11). This shift
in the redox status of cells is likely to trigger the escalation of
the antioxidant enzymes, GPx4 and MnSOD, as was observed herein. In
order to examine whether the obliteration of basal ROS would
significantly affect the pro-oxidant influences imparted by
mIDH1/2-HG, the cells were pre-treated with NAC and probed for ROS
levels. Notably, NAC pre-treatment had little or no influence on
the ROS-inducing capabilities of mIDH1/2-HG. When probed for MTH1
expression under NAC pre-treatment in mIDH1/2-HG treated cells,
there was almost a 2-fold increase in protein levels and in MTH1
enzyme activity, determined by the 8-oxodG levels in cells. These
results indicate the augmented MTH1 activity in the treated cells,
even after scavenging the basal ROS that clearly suggests ROS
generated via mIDH1/2-HG are responsible for the activation MTH1 in
glioma cells.
Of note, in glioma patient biopsies with IDH1
mutation, a significantly higher MTH1 expression was observed
compared to the wt-IDH1 samples. A concomitant increase in the
activity (as assessed by the increased 8-oxo-dG levels) supported
the protein expression results in glioma tissues.
The highlight of the present study is that a link
was found between mIDH1 and MTH1 activation, mediated by ROS. This
forms the basis for the increased MTH1 expression observed in mIDH1
glioma tissues and is the first study (to the best of our
knowledge) linking IDH1 mutation, ROS and activation of MTH1 in
cells. As it was found that mIDH1/2-HG causes increased DNA damage
(a higher OGG1 expression) in U251 cells, this may yet be another
factor that plays a role in the upregulation of MTH1 in gliomas.
Further experiments are required in order to decipher the
mechanistic molecules involved in relation to MTH1 and mIDH1.
Acknowledgements
The authors would like to acknowledge Dr Priya
Srinivas (Scientist-G, Rajiv Gandhi Centre for Biotechnology,
Kerala, India) and Dr Cibin Raghavan (Associate Professor, Sree
Chitra Tirunal Institute for Medical Sciences and Technology,
Kerala, India) for their valuable inputs and suggestions towards
execution of the study. The authors would also like to thank Dr
Jackson James (Scientist-G, Rajiv Gandhi Centre for Biotechnology,
Kerala, India) for providing the empty vector for the mIDH1
overexpression studies.
Funding
Funding: The authors would like to thank the Department of
Science and Technology, India for providing the INSPIRE Fellowship
(IF150784). The authors also acknowledge the Council of Scientific
and Industrial Research [09/523(0082)/2014-EMR-1], Government of
India for granting Research Fellowship.
Availability of data and materials
The datasets generated during and/or analyzed during
the current study are available from the corresponding author on
reasonable request.
Authors' contributions
BB, CRA, MU, KS, AND and SG were involved in the
conceptualization and methodology of the study. BB, CRA, MU, HVE,
KS, GRM, KK, AND and SG were involved in data validation. BB, CRA,
MU, HVE, KS, GRE, KK, AND and SG were involved in the formal
analysis. BB, CRA, HVE, KS, GRE and KK were involved in the
provision of the study resources. BB, CRA, MU and SG were involved
in the writing of the original draft and visualization. BB, CRA, MU
and SG were involved in the writing, reviewing and editing of the
manuscript. MU and SG supervised the study. SG was involved in
project administration and in funding acquisition. All authors have
read and approved the final manuscript. BB and CRA confirm the
authenticity of the raw data. All authors have read and approved
the final manuscript.
Ethics approval and consent to
participate
All procedures performed with human subjects in the
present study were in accordance with the ethical standards of the
Institutional Ethics Committee of Sree Chitra Tirunal Institute for
Medical Sciences and Technology, Trivandrum, India, and with the
1964 Helsinki declaration and its later amendments or comparable
standards. Informed consent was obtained from all individual
participants >18 years of age included in the study. Informed
consent was obtained from the parents of the patients who were
<18 years of age included in the study.
Patient consent for publication
Not applicable.
Competing interests
The authors declare that they have no competing
interests.
References
|
1
|
Han S, Liu Y, Cai SJ, Qian M, Ding J,
Larion M, Gilbert MR and Yang C: IDH mutation in glioma: Molecular
mechanisms and potential therapeutic targets. Br J Cancer.
122:1580–1589. 2020.PubMed/NCBI View Article : Google Scholar
|
|
2
|
Shi J, Zuo H, Ni L, Xia L, Zhao L, Gong M,
Nie D, Gong P, Cui D, Shi W and Chen J: An IDH1 mutation inhibits
growth of glioma cells via GSH depletion and ROS generation. Neurol
Sci. 35:839–845. 2014.PubMed/NCBI View Article : Google Scholar
|
|
3
|
Parsons DW, Jones S, Zhang X, Lin JC,
Leary RJ, Angenendt P, Mankoo P, Carter H, Siu IM, Gallia GL, et
al: An integrated genomic analysis of human glioblastoma
multiforme. Science. 321:1807–1812. 2008.PubMed/NCBI View Article : Google Scholar
|
|
4
|
Komori T: The 2021 WHO classification of
tumors, 5th edition, central nervous system tumors: The 10 basic
principles. Brain Tumor Pathol. 39:47–50. 2022.PubMed/NCBI View Article : Google Scholar
|
|
5
|
Louis DN, Perry A, Reifenberger G, von
Deimling A, Figarella-Branger D, Cavenee WK, Ohgaki H, Wiestler OD,
Kleihues P and Ellison DW: The 2016 World Health Organization
classification of tumors of the central nervous system: A summary.
Acta Neuropathol. 131:803–820. 2016.PubMed/NCBI View Article : Google Scholar
|
|
6
|
Molenaar RJ, Botman D, Smits MA, Hira VV,
van Lith SA, Stap J, Henneman P, Khurshed M, Lenting K, Mul AN, et
al: Radioprotection of IDH1-mutated cancer cells by the IDH1-mutant
inhibitor AGI-5198. Cancer Res. 75:4790–4802. 2015.PubMed/NCBI View Article : Google Scholar
|
|
7
|
Qing X, Shao Z, Lv X, Pu F, Gao F, Liu L
and Shi D: Anticancer effect of (S)-crizotinib on osteosarcoma
cells by targeting MTH1 and activating reactive oxygen species.
Anticancer Drugs. 29:341–352. 2018.PubMed/NCBI View Article : Google Scholar
|
|
8
|
Gad H, Koolmeister T, Jemth AS, Eshtad S,
Jacques SA, Ström CE, Svensson LM, Schultz N, Lundbäck T,
Einarsdottir BO, et al: MTH1 inhibition eradicates cancer by
preventing sanitation of the dNTP pool. Nature. 508:215–221.
2014.PubMed/NCBI View Article : Google Scholar
|
|
9
|
Bhavya B, Easwer HV, Vilanilam GC, Anand
CR, Sreelakshmi K, Urulangodi M, Rajalakshmi P, Neena I,
Padmakrishnan CJ, Menon GR, et al: MutT homolog1 has multifaceted
role in glioma and is under the apparent orchestration by hypoxia
inducible factor1 alpha. Life Sci. 264(118673)2020.PubMed/NCBI View Article : Google Scholar
|
|
10
|
Zhao S, Lin Y, Xu W, Jiang W, Zha Z, Wang
P, Yu W, Li Z, Gong L, Peng Y, et al: Glioma-derived mutations in
IDH1 dominantly inhibit IDH1 catalytic activity and induce
HIF-1alpha. Science. 324:261–265. 2009.PubMed/NCBI View Article : Google Scholar
|
|
11
|
Gilbert MR, Liu Y, Neltner J, Pu H, Morris
A, Sunkara M, Pittman T, Kyprianou N and Horbinski C: Autophagy and
oxidative stress in gliomas with IDH1 mutations. Acta Neuropathol.
127:221–233. 2014.PubMed/NCBI View Article : Google Scholar
|
|
12
|
Chen L, Li X, Liu L, Yu B, Xue Y and Liu
Y: Erastin sensitizes glioblastoma cells to temozolomide by
restraining xCT and cystathionine-γ-lyase function. Oncol Rep.
33:1465–1474. 2015.PubMed/NCBI View Article : Google Scholar
|
|
13
|
Behrend L, Henderson G and Zwacka RM:
Reactive oxygen species in oncogenic transformation. Biochem Soc
Trans. 31:1441–1444. 2003.PubMed/NCBI View Article : Google Scholar
|
|
14
|
Reczek CR and Chandel NS: The two faces of
reactive oxygen species in cancer. Annu Rev Cancer Biol. 1:79–98.
2017.
|
|
15
|
Mohamed Yusoff AA, Zulfakhar FN, Sul'ain
MD, Idris Z and Abdullah JM: Association of the IDH1 C.395G>A
(R132H) mutation with histological type in malay brain tumors.
Asian Pac J Cancer Prev. 17:5195–5201. 2016.PubMed/NCBI View Article : Google Scholar
|
|
16
|
Bhavya B, Anand CR, Madhusoodanan UK,
Rajalakshmi P, Krishnakumar K, Easwer HV, Deepti AN and Gopala S:
To be wild or mutant: Role of isocitrate dehydrogenase 1 (IDH1) and
2-hydroxy glutarate (2-HG) in gliomagenesis and treatment outcome
in glioma. Cell Mol Neurobiol. 40:53–63. 2020.PubMed/NCBI View Article : Google Scholar
|
|
17
|
Shi J, Sun B, Shi W, Zuo H, Cui D, Ni L
and Chen J: Decreasing GSH and increasing ROS in chemosensitivity
gliomas with IDH1 mutation. Tumour Biol. 36:655–662.
2015.PubMed/NCBI View Article : Google Scholar
|
|
18
|
Reiter-Brennan C, Semmler L and Klein A:
The effects of 2-hydroxyglutarate on the tumorigenesis of gliomas.
Contemp Oncol (Pozn). 22:215–222. 2018.PubMed/NCBI View Article : Google Scholar
|