Introduction
Prostate cancer (PCa) is the second most prevalent
type of malignancy and one of the leading causes of cancer-related
mortality among the male population, accounting for almost one half
(48%) of all incident cases in men (1). Current clinical techniques for the
diagnosis of PCa include a digital rectal examination (DRE),
prostate-specific antigen (PSA) level detection, imaging
[transrectal ultrasonography (TRUS) and multiparametric magnetic
resonance imaging (mpMRI) of the prostate] and prostate biopsies.
Although DRE is affordable and simple to perform, its
effectiveness, with a positive predictive value ranging from 5 to
30%, is dependent on the skills of the examiner (2). Moreover, PSA is not a cancer-specific
marker. It is affected by age and its levels can increase in
non-malignant circumstances. MRI is particularly effective in
diagnosing PCa due to its high accuracy in detecting clinically
significant cancers. This helps reduce unnecessary biopsies, guides
targeted biopsies and facilitates monitoring during active
surveillance. Key tools, such as the Prostate Imaging Reporting and
Data System (PI-RADS) enhance these capabilities. However, there
are some limitations, including high costs, variability in
interpretation, the potential to miss aggressive cancers (resulting
in false negatives), and challenges related to accessibility and
the standardization of readings (3). However, mpMRI is not used for the
diagnosis of PCa, but rather for biopsy guidance, local staging,
post-treatment assessment, and as an adjunct tool for active
surveillance. Prostate biopsy is the only surgery that enables a
specific diagnosis and is currently conducted transperineally or
transrectally under ultrasound guidance. A hybrid method combining
TRUS and mpMRI has increased the overall accuracy of PCa diagnosis
to 85% (4). Nonetheless, this
method has disadvantages, including the risks of hematuria,
infection and urine retention, in which in severe cases, could lead
to sepsis and long-term hospitalization (5). Therefore, less invasive approaches
are required.
Liquid biopsy involves the non-invasive analysis of
biomarkers in biological fluids (such as blood or urine) for the
diagnosis of malignancies that avoids the disadvantages of invasive
techniques and collects more molecular information than tissue
biopsy (6). This test mainly
analyses circulating tumor cells (CTCs), plasma cell-free genetic
material, such as cell-free RNA and cell-free DNA and extracellular
vesicles. Each of these biomarkers provides specific information
based on its intrinsic characteristics. Blood or urine samples can
be used for analysis (7). The
present performed a systematic review and meta-analysis in an aim
to evaluate the specificity and sensitivity of blood and urine
biopsies as tools for the diagnosis of PCa.
Data and methods
Search strategy
A comprehensive search and selection of studies
written in the English langauge and published between 2013 and 2025
was conducted from four electronic databases: PubMed, Cochrane
Library, OVID Medline and Science Direct. The search terms and
phrases used to identify the articles relevant to the study topic
are listed in Table I. The present
systematic review followed the Preferred Reporting Items for
Systematic Reviews and Meta-Analyses (PRISMA) guidelines for
diagnostic test accuracy studies. Additionally, the protocol of the
present systematic review has been registered in PROSPERO (RN:
CRD42022338451).
 | Table ILiterature search strategy. |
Table I
Literature search strategy.
| Databases | Key words | Results | Date of
attempt |
|---|
| PubMed | ‘Liquid biopsy’ OR
‘Circulating tumor cell’ OR ‘CTC’ OR ‘ctDNA’ OR ‘Circulating tumor
DNA’ OR ‘Circulating tumor Deoxyribonucleic Acid’ AND ‘Prostate
cancer’ AND ‘Diagnosis’ | 374 | November 11,
2025 |
| Cochrane
Library | ‘Liquid biopsy’ OR
‘Circulating tumor cell’ OR ‘CTC’ OR ‘ctDNA’ OR ‘Circulating tumor
DNA’ OR ‘Circulating tumor Deoxyribonucleic Acid’ AND ‘Prostate
cancer’ AND ‘Diagnosis’ | 717 | November 11,
2025 |
| Medline | ‘Liquid biopsy’ OR
‘Circulating tumor cell’ OR ‘CTC’ OR ‘ctDNA’ OR ‘Circulating tumor
DNA’ OR ‘Circulating tumor Deoxyribonucleic Acid’ AND ‘Prostate
cancer’ AND ‘Diagnosis’ | 82 | November 11,
2025 |
| Science Direct | ‘Liquid biopsy’ OR
‘Circulating tumor cell’ OR ‘CTC’ OR ‘ctDNA’ OR ‘Circulating tumor
DNA’ OR ‘Circulating tumor’ AND ‘Deoxyribonucleic Acid’ AND
‘Prostate cancer’AND ‘Diagnosis’ | 705 | November 11,
2025 |
Exclusion and inclusion criteria
Studies were included if these explored patients who
were suspected of having PCa for any reason (patients) and were
positive for a liquid biomarker (intervention) compared with those
negative for a liquid biomarker (comparison) to assess the
diagnostic accuracy for detecting PCa (outcomes) and reported
sensitivity and specificity of liquid biopsy for diagnosing PCa.
The following studies were excluded: Review articles, letters,
editorials, case reports/series, non-human animal studies, studies
on PCa with malignancy or metastases and articles not published in
the English language.
Quality assessment and risk of
bias
The risk of bias and applicability were evaluated
independently by two authors (FES and FR) using the Quality
Assessment of Diagnostic Accuracy Studies-2 (QUADAS-2). The
following four domains were assessed: Patient selection, index
text, ‘reference standard, and flow and timing, and judged these as
high, unclear, or low.
Statistical analysis. All analyses were
performed using R version 4.5.1 via RS studio version
2025.09.0+387(2025; R Foundation for Statistical Computing).
Heterogeneity was evaluated using the Chi-squared (χ2)
test and quantified by the I2 statistic. An I2 value
>50% indicated substantial heterogeneity, and a P-value <0.05
was considered to indicate a statistically significant difference.
The random effects model was used for the present study as a small
number of studies and clinical heterogeneity are expected.
Heterogeneity in the bivariate diagnostic meta-analysis was
evaluated using two complementary approaches. First, the bivariate
I² statistic proposed by Zhou and Dendukuri study (8) was applied which quantifies
heterogeneity, while accounting for the correlation between
sensitivity and false-positive rate within the Reitsma model.
Second, heterogeneity was also assessed using the Holling approach,
which provides both sample-size unadjusted and adjusted I²
estimates to illustrate the impact of study size and design on
between-study variability (9).
Risk of bias assessment for specificity and specifiticity was
analysed using funnel plot and Egger's test. Egger's test was used
for linear regression method in the meta-analysis to detect
potentials publication bias by measuring the asymmetry of the
funnel plot.
True positives (TPs), false positives (FPs), false
negatives (FNs) and true negatives (TNs) were recalculated using
basic diagnostic formulas, considering the sample size, case
prevalence, and statistical measures available from each study.
Forest plots with 95% confidence intervals (CIs) were calculated
and depicted. The analysis of bivariate models was performed using
the Reitsma model (10-12).
A summary receiver operating characteristic (SROC) curve and
calculated the area under the curve (AUC) to examine the diagnostic
accuracy of liquid biopsy.
Results
Study selection and
characteristics
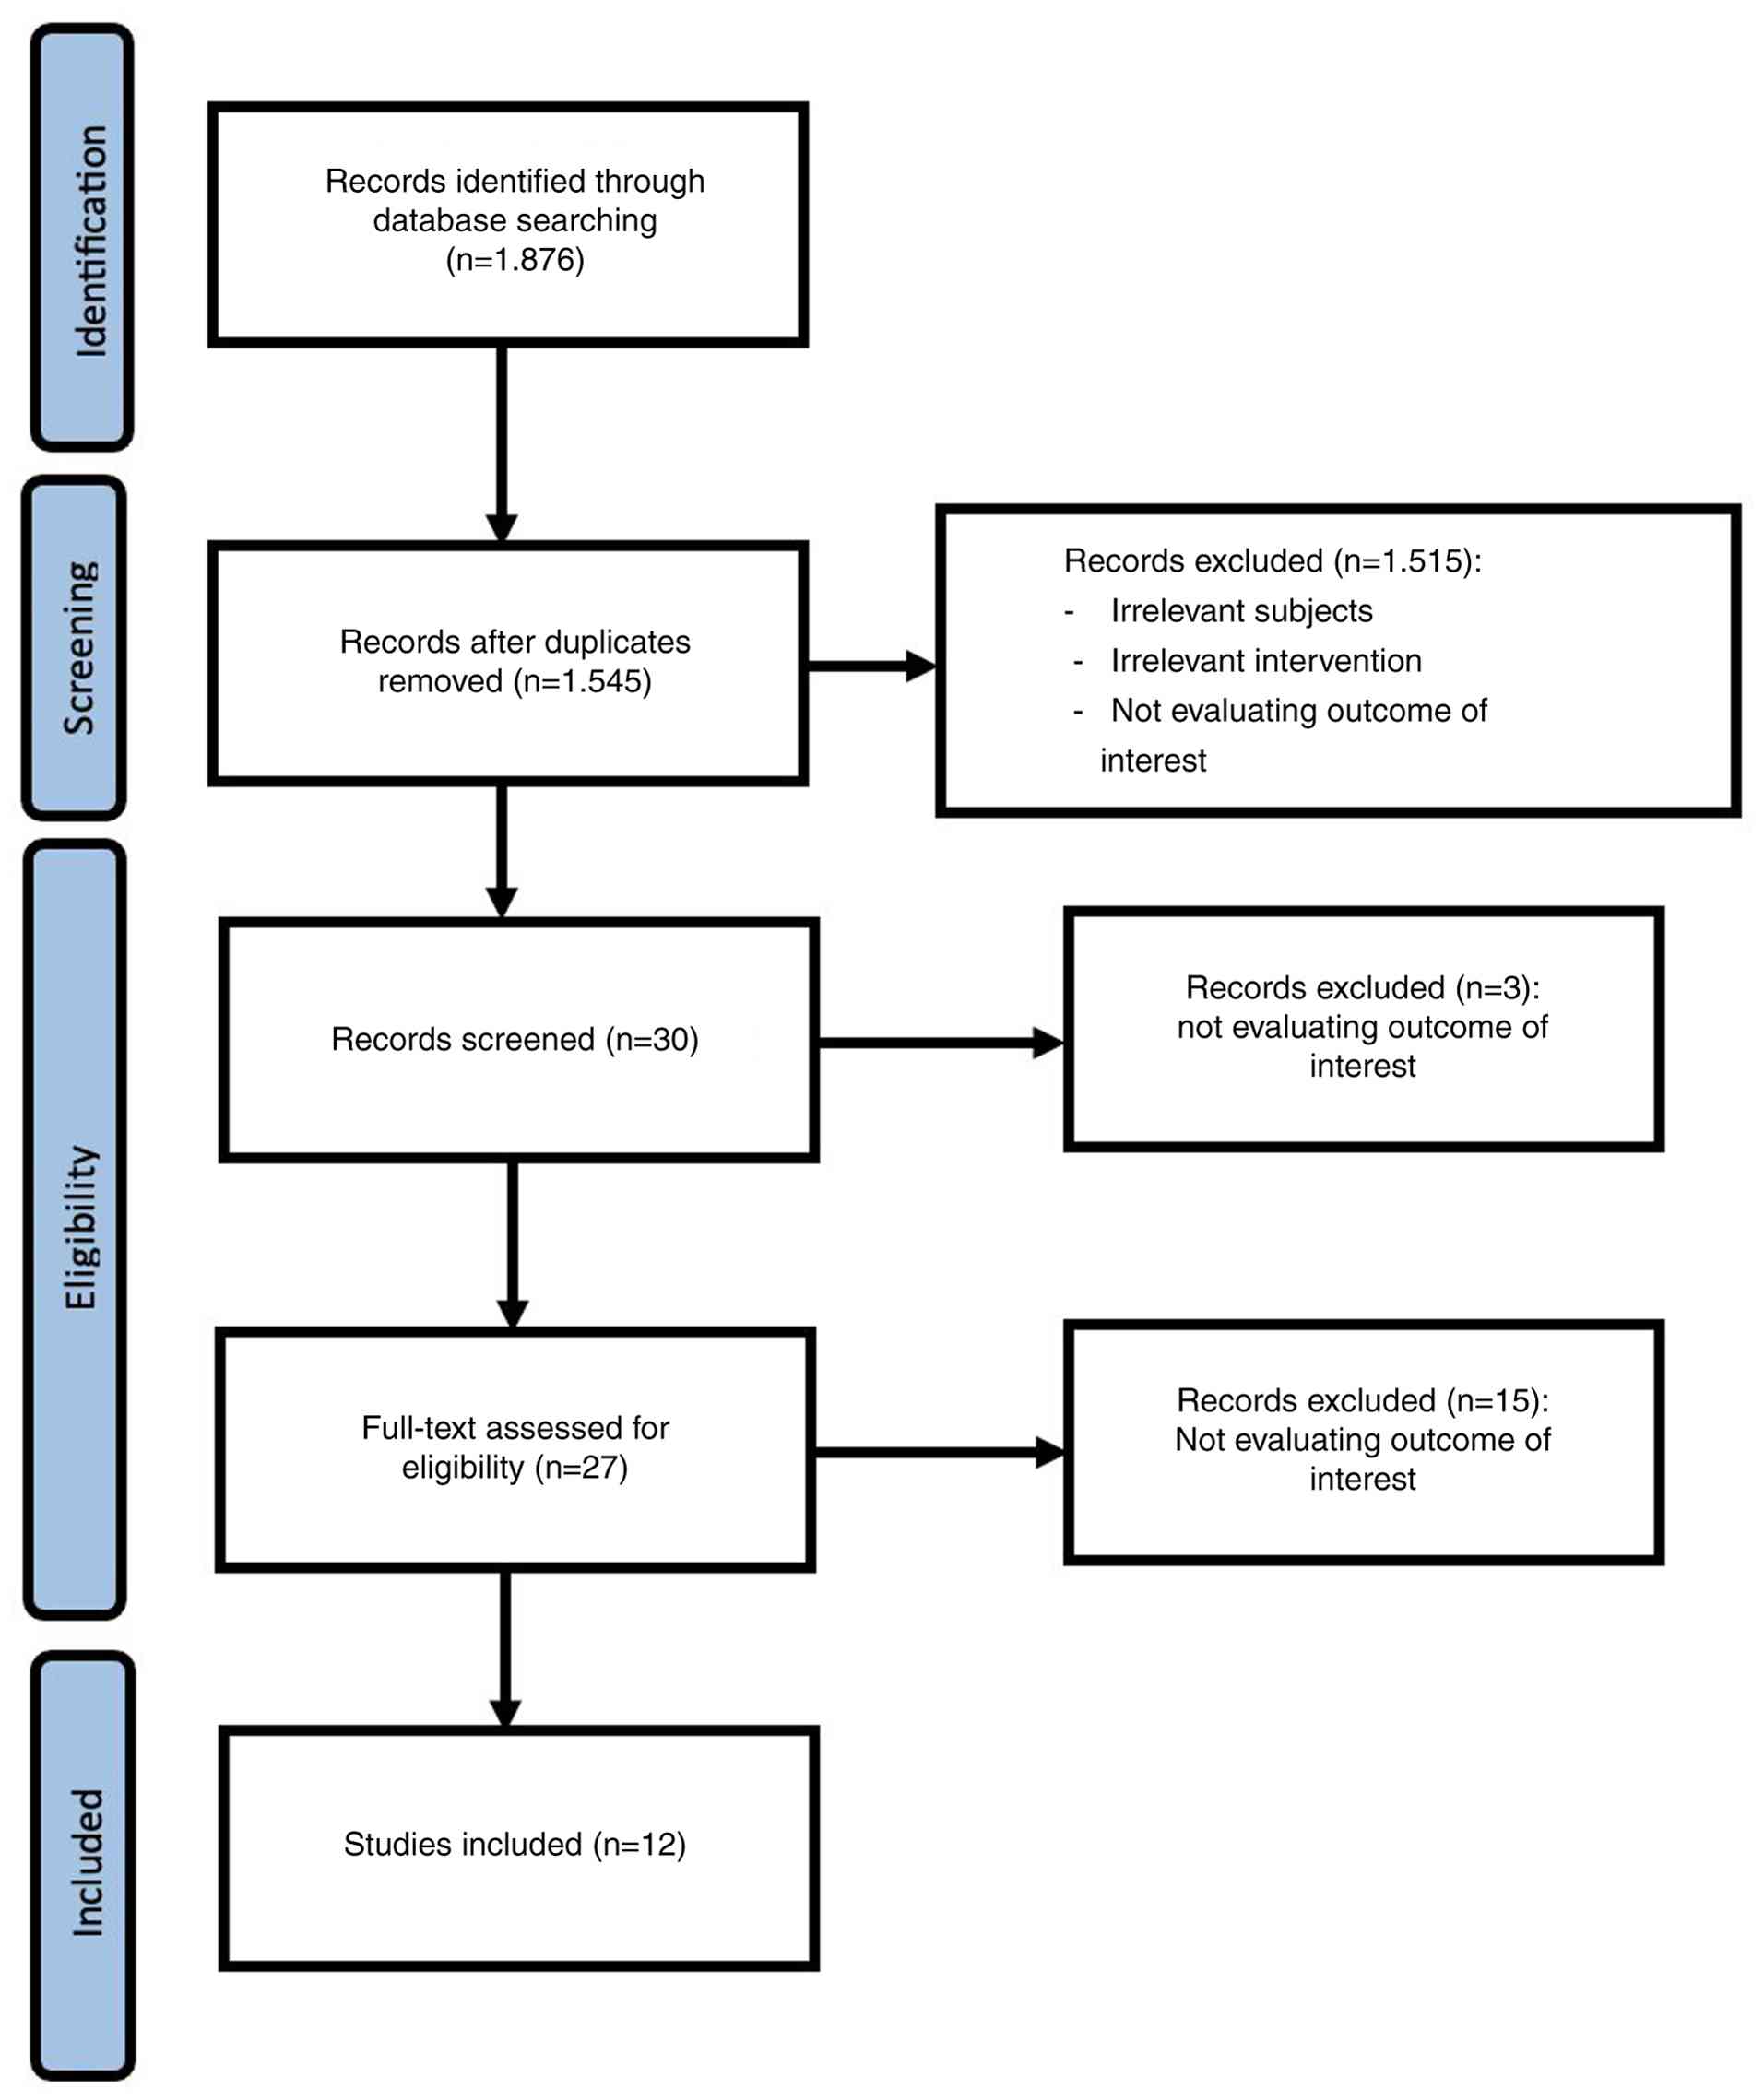
The initial search for studies identified 1,876
studies; after excluding duplicates and screening for the
established criteria, 12 studies were determined to be eligible for
inclusion in the present meta-analysis. The PRISMA flowchart
illustrating the systematic literature search is presented in
Fig. 1.
The characteristics of 12 studies included in the
present meta-analysis are depicted in Table II. There were three studies based
on blood biopsies (13-15)
and nine studies based on urine biopsies (16-24).
Some studies reported more than one biomarker within the same
study, leading to variations in gene targets, laboratory platforms,
and sample sizes of both cases and non-cases. Blood biopsy
biomarkers demonstrated a very high specificity, but exhibited a
low to moderate sensitivity. By contrast, urine biomarkers
exhibited higher and more consistent sensitivity, although with
significant variations in specificity.
| Table IICharacteristics of the studies
included in the present systematic review and meta-analysis. |
Table II
Characteristics of the studies
included in the present systematic review and meta-analysis.
| Authors | Year of
publication | No. of samples | Biomarker | Sample | Sens | Spec | No. of patients
with disease | No. of patients
without disease | TPs | FNs | TNs | FPs | (Refs.) |
|---|
| Constancio et
al | 2019 | 323 | FOXA1 | Blood | 0,61 | 0,77 | 121 | 136 | 74 | 47 | 105 | 31 | (13) |
| | | | GSTP1 | Blood | 0,15 | 0,98 | 121 | 136 | 18 | 103 | 133 | 3 | |
| | | | HOXD3 | Blood | 0,8 | 0,43 | 121 | 136 | 97 | 24 | 58 | 78 | |
| | | | RARB2 | Blood | 0,22 | 0,96 | 121 | 136 | 27 | 94 | 131 | 5 | |
| | | | RASSF1A | Blood | 0,13 | 0,96 | 121 | 136 | 16 | 105 | 131 | 5 | |
| | | | SEPT9 | Blood | 0,12 | 0,99 | 121 | 136 | 15 | 106 | 135 | 1 | |
| | | | SOX17 | Blood | 0,23 | 0,99 | 121 | 136 | 28 | 93 | 135 | 1 | |
| | | | Panel (4
genes) | Blood | 0,72 | 0,72 | 121 | 136 | 87 | 34 | 98 | 38 | |
| Haldrup et
al | 2018 | 37 | CCDC181 | Blood | 0,26 | 1 | 212 | 307 | 55 | 157 | 307 | 0 | (14) |
| | | | HAPLN3 | Blood | 0,44 | 1 | 212 | 307 | 93 | 119 | 307 | 0 | |
| | | | ST6GALNAC3 | Blood | 0,3 | 1 | 212 | 307 | 64 | 148 | 307 | 0 | |
| | | | ZNF660 | Blood | 0,22 | 1 | 212 | 307 | 47 | 165 | 307 | 0 | |
| | | | Panel (3
genes) | Blood | 0,67 | 1 | 212 | 307 | 142 | 70 | 307 | 0 | |
| Ried et
al | 2020 | 47 | CTC + PSA | Blood | 0,97 | 0,99 | 29 | 18 | 28 | 1 | 18 | 0 | (15) |
| Davey et
al | 2020 | 56 | 7mRNA+2miRNA | Urine | 0,79 | 0,89 | 28 | 28 | 22 | 6 | 25 | 3 | (24) |
| | | | 7mRNA | Urine | 0,75 | 0,84 | 28 | 28 | 21 | 7 | 24 | 4 | |
| Kim et
al | 2021 | 38 | miR-6090 | Urine | 0,95 | 0,68 | 19 | 19 | 18 | 1 | 13 | 6 | (16) |
| McKiernan et
al | 2018 | 503 | EPI | Urine | 0,83 | 0,26 | 369 | 166 | 306 | 63 | 43 | 123 | (17) |
| Van Neste et
al | 2018 | 905 | DLX1 | Urine | 0,83 | 0,16 | 393 | 512 | 326 | 67 | 82 | 430 | (18) |
| | | | HOXC4 | Urine | 0,91 | 0,22 | 393 | 512 | 358 | 35 | 113 | 399 | |
| | | | HOXC6 | Urine | 0,91 | 0,33 | 393 | 512 | 358 | 35 | 169 | 343 | |
| | | | PCA3 | Urine | 0,91 | 0,2 | 393 | 512 | 358 | 35 | 102 | 410 | |
| | | | TDRD1 | Urine | 0,9 | 0,11 | 393 | 512 | 354 | 39 | 56 | 456 | |
| | | | HOXC6+DLX1 | Urine | 0,91 | 0,36 | 393 | 512 | 358 | 35 | 184 | 328 | |
| Ochiai et
al | 2013 | 633 | PCA3 | Urine | 0,67 | 0,72 | 264 | 369 | 177 | 87 | 266 | 103 | (19) |
| Wang et
al | 2017 | 42 | Flotillin2 | Urine | 0,88 | 0,94 | 16 | 16 | 14 | 2 | 15 | 1 | (20) |
| | | |
Flotillin2+PARK7 | Urine | 0,68 | 0,93 | 16 | 16 | 11 | 5 | 15 | 1 | |
| | | | PARK7 | Urine | 0,42 | 0,93 | 16 | 16 | 7 | 9 | 15 | 1 | |
| Yu et
al | 2024 | 155 | WWP1 + RAB5B | Urine | 0,81 | 0,89 | 43 | 92 | 35 | 8 | 82 | 10 | (21) |
| Opoku Mensah et
al | 2022 | 237 | PCA3 | Urine | 0,57 | 0,86 | 63 | 174 | 36 | 27 | 149 | 25 | (22) |
| Cheng et
al | 2025 | 2,002 | FAM153C-RPL19 | Urine | 0,911 | 0,875 | 826 | 1.176 | 752 | 74 | 1.029 | 147 | (23) |
Diagnostic data were not presented in a complete 2x2
format (TPs, FPs, FNs and TNs) from 11 studies in the present
meta-analysis. A total of 12 studies (13-24)
reported only sensitivity, specificity, predictive value, or
overall accuracy percentages without explicitly stating case
frequencies. To ensure consistency and enable a collaborative
analysis of all studies: TP, FP, FN and TN values were recalculated
using basic diagnostic formulas, considering the sample size, case
prevalence, and statistical measures available from each study. The
analysis revealed considerable heterogeneity in both diagnostic
performance and cohort size.
A descriptive analysis of the meta-analysis revealed
significant variation in diagnostic performance across the studies.
Sensitivity estimates varied from 0.127 to 0.950, whereas
specificity varied from 0.110 to 0.998. A homogeneity test
confirmed these findings. Both sensitivity (χ2=2160.7;
df=30; P<0.0001) and specificity (χ2=3981.0; df=30;
P<0.0001). Additionally, the diagnostic odds ratio (DOR) values
exhibited a wide range of accuracy patterns across studies, with
values spanning from <1 to >1. A strong positive correlation
(Rho=0.638; 95% CI, 0.367-0.809) between sensitivity and the false
positive rate further indicated a structural association between
these diagnostic parameters. These findings support the use of
bivariate models, such as the Reitsma model, as a suitable
approach, since they can account for dependencies between the
diagnostic variables within their structure.
Risk of bias assessment
The QUADAS-2 assessment of 12 studies in the present
meta-analysis (Fig. 2) revealed a
good to moderate methodological quality, a low or unclear risk of
bias, minimal applicability concerns, and a representative patient
selection. Index tests of all studies revealed a low risk as the
biomarker testing methods were well-reported, although some studies
did not specify threshold values beforehand, leading to slight
uncertainty (13-24).
Reference standards generally had a low risk, supported by the use
of appropriate standard diagnostic methods and no issues relevant
to disease definition. Low risk was also demonstrated in the study
flow and timing. Only a few studies exhibited a high risk of bias
and almost no significant applicability issues.
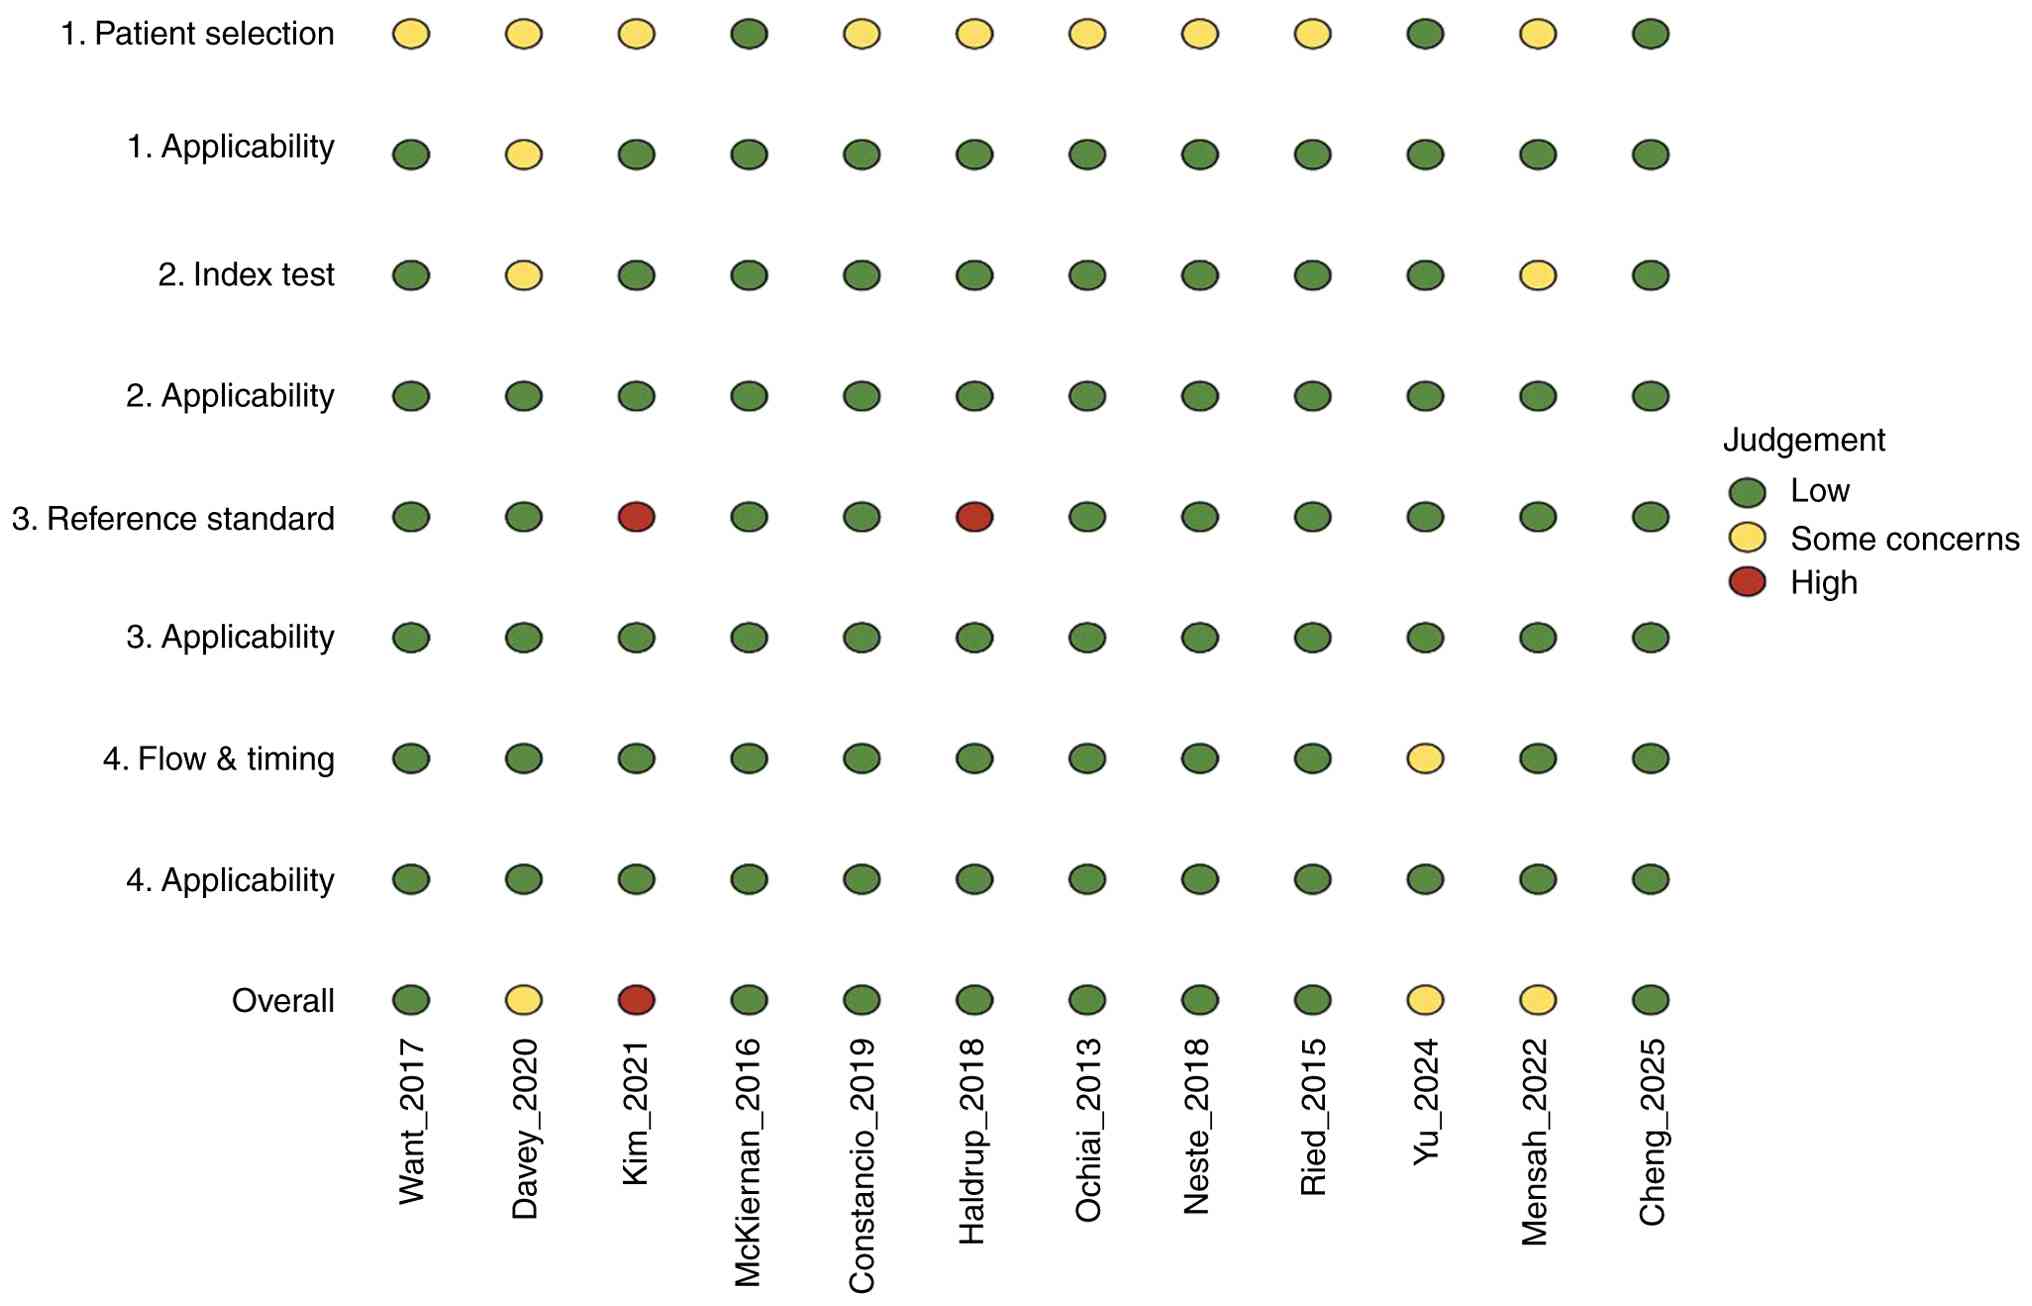 | Figure 2Summary of QUADAS-2 for assessing the
risk of bias of the included studies. The studies included were the
following: Constancio et al (13), Haldrup et al (14), Ried et al (15), Davey et al (24), Kim et al (16), McKiernan et al (17), Van Neste et al (18), Ochiai et al (19), Wang et al (20), Yu et al (21), Opoku Mensah et al (22) and Cheng et al (23). |
Meta-analysis of blood biopsy.
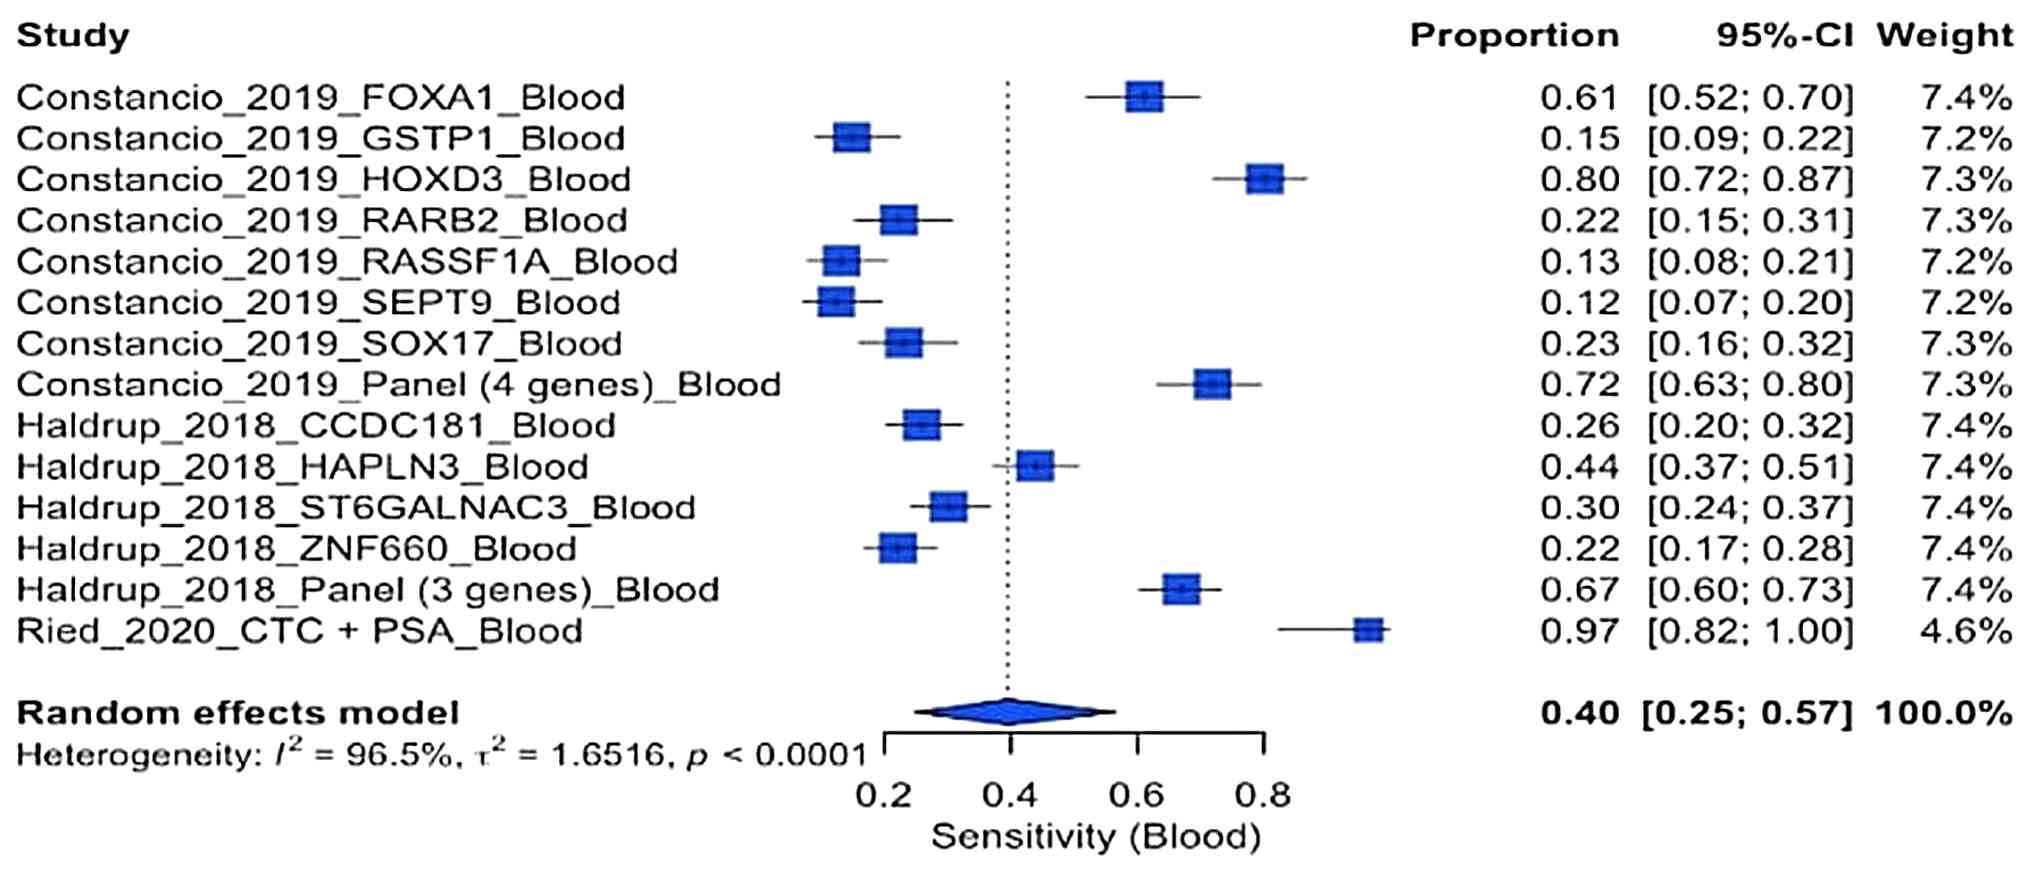
Sensitivity of blood biopsy
The forest plot depicted in Fig. 3 illustrates the comparison of the
sensitivity of the three blood-based studies. There was a wide
range of sensitivity values (~0.12 to 0.97), with a pooled
sensitivity of 0.40 (95% CI, 0.25-0.57). This pooled sensitivity
indicates that blood biomarkers generally have limited
effectiveness in detecting prostate cancer, as they identify only
~40% of positive cases. A high heterogeneity (I2=96.5%)
was also found in the blood-based studies. The optimal diagnostic
performance was observed in the multigene panel in the study by
Constâncio et al (13) and
the CTC+PSA markers identified in the study by Ried et al
(15). By contrast, some
individual biomarkers, including RASSF1A and SEPT9, demonstrated a
significantly lower accuracy.
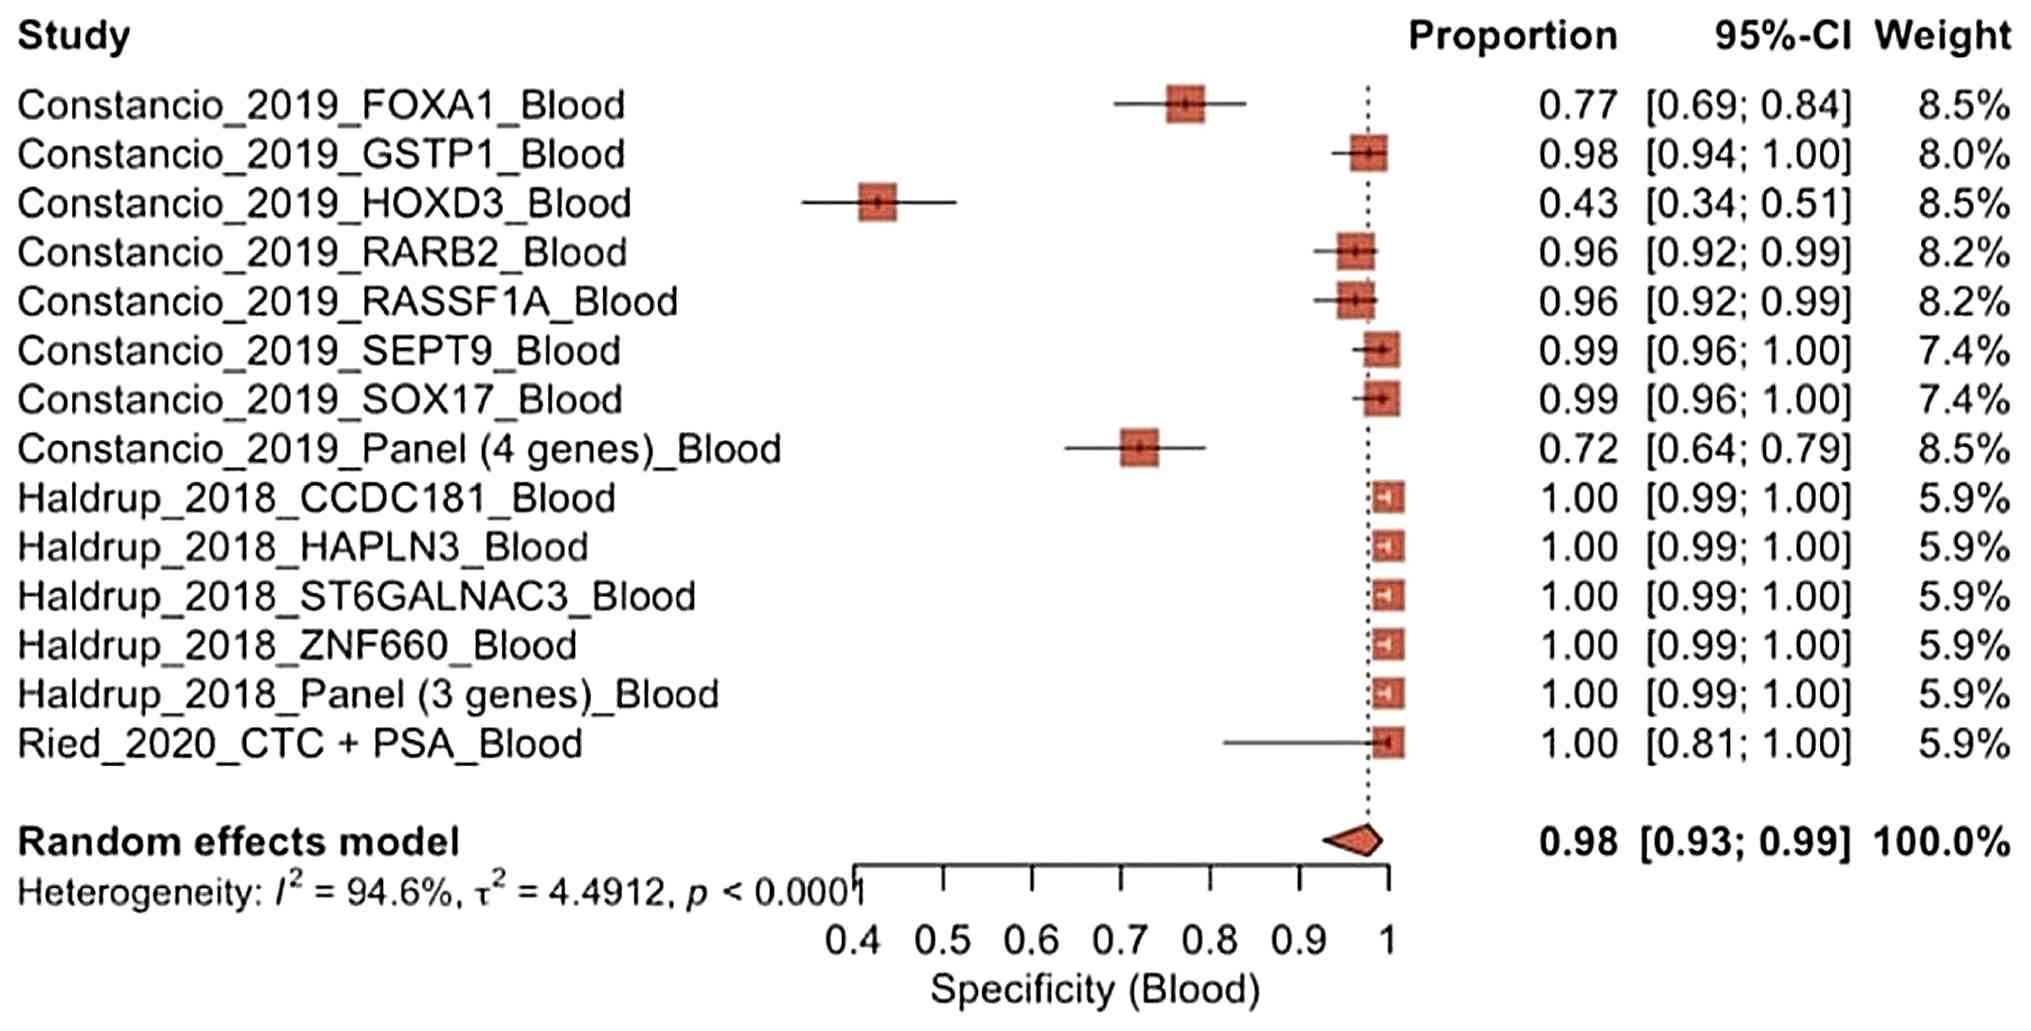
Specificity of blood biopsy. As regards
specificity, the three blood-based studies reported very high
values (~0.72 to 1.00), with a pooled specificity of 0.98 (95% CI,
0.93-0.99), as illustrated in Fig.
4. This indicates that blood biomarkers are highly effective at
identifying individuals who do not have cancer, resulting in a low
false-positive rate. Additionally, heterogeneity was high
(I2=94.6%); the effect direction remains very
consistent, as almost studies demonstrated near-perfect
specificity.
Meta-analysis of urine biopsy.
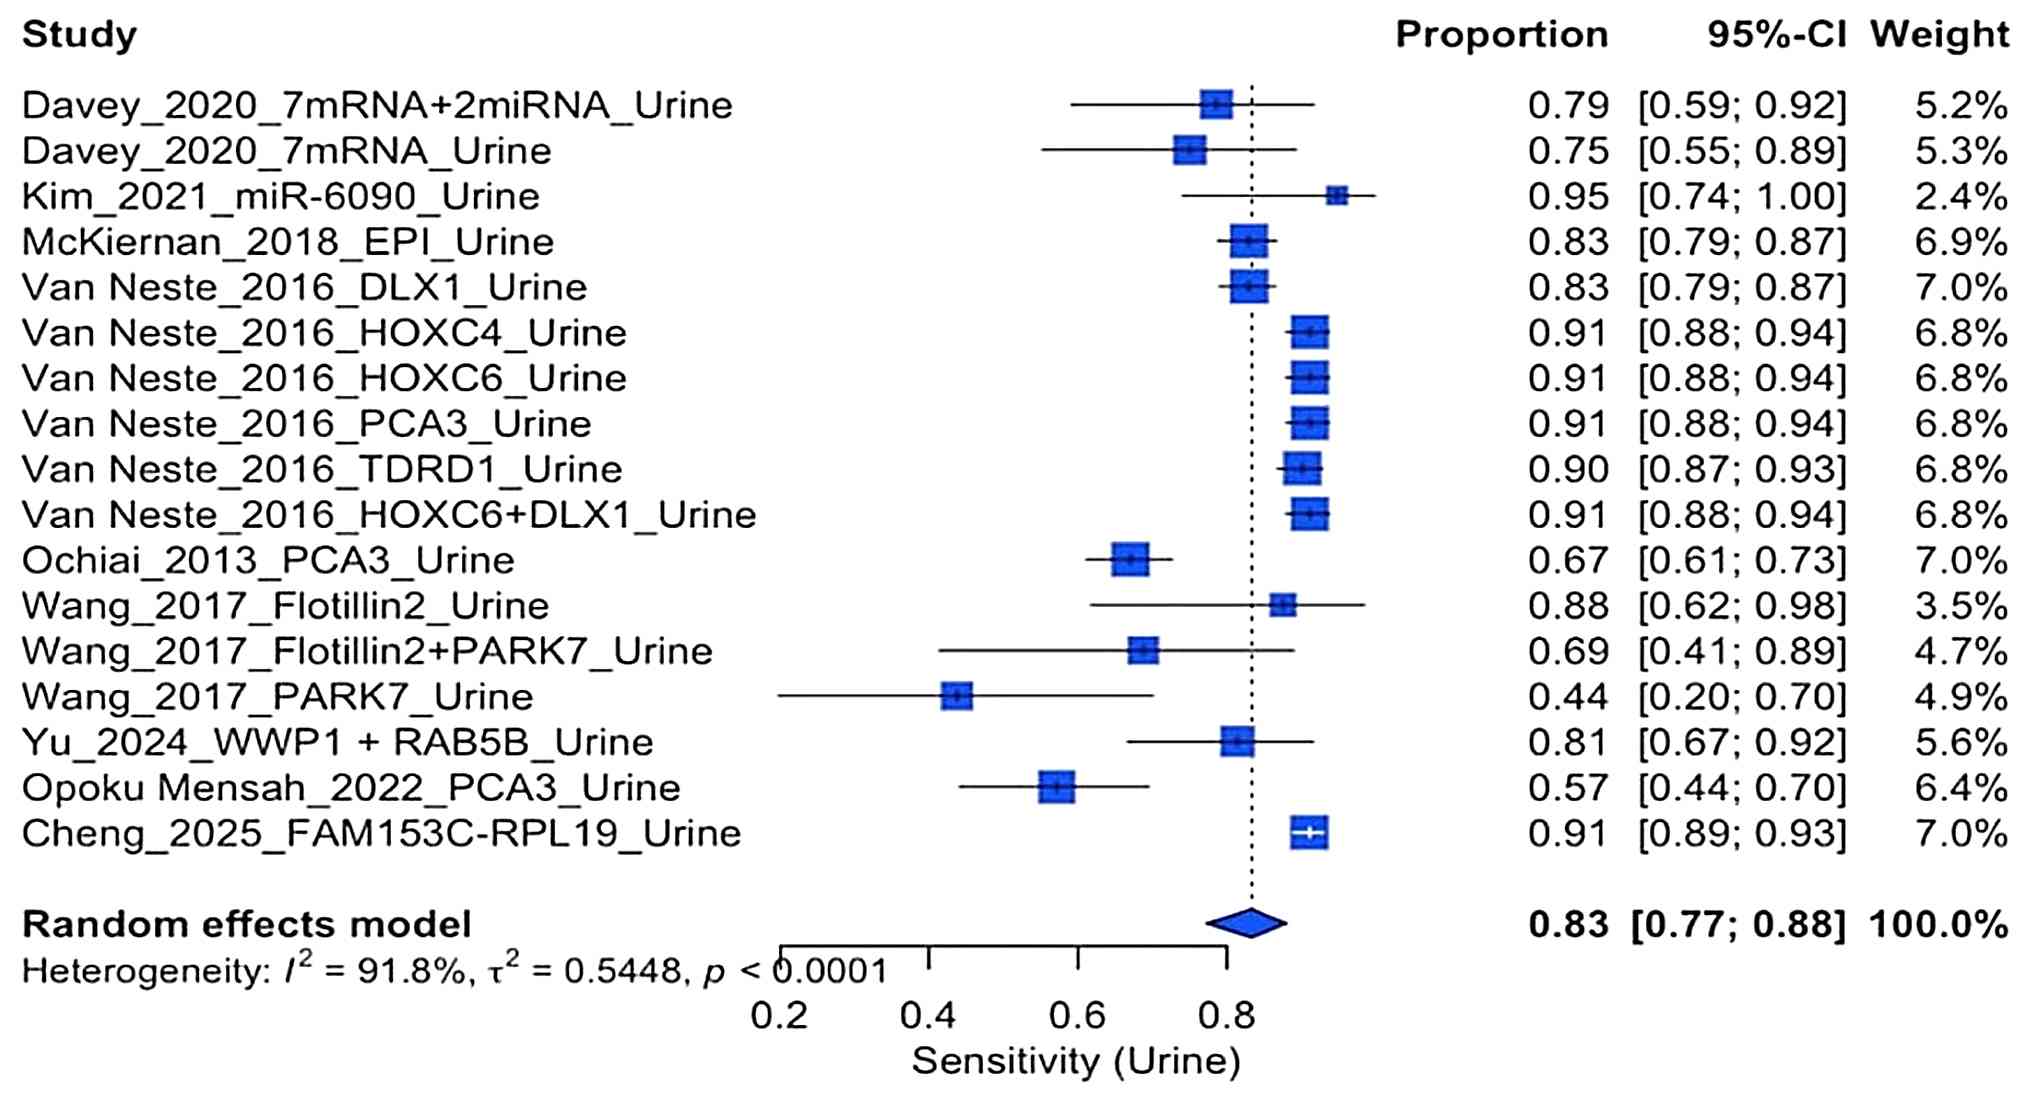
Sensitivity of urine biopsy
The forest plot of the sensitivity urine
biopsy-based studies (Fig. 5)
revealed that this ranged from 0.67 to 0.95, with a pooled
sensitivity of 0.83 (95% CI, 0.77-0.88). Both the gene panel in the
study by Van Neste et al (18) and the EPI marker the study by
McKiernan et al (17)
demonstrated strong performance. The evaluation of heterogeneity
remained high (I2=91.8%), indicating significant
biological and methodological variations between the studies.
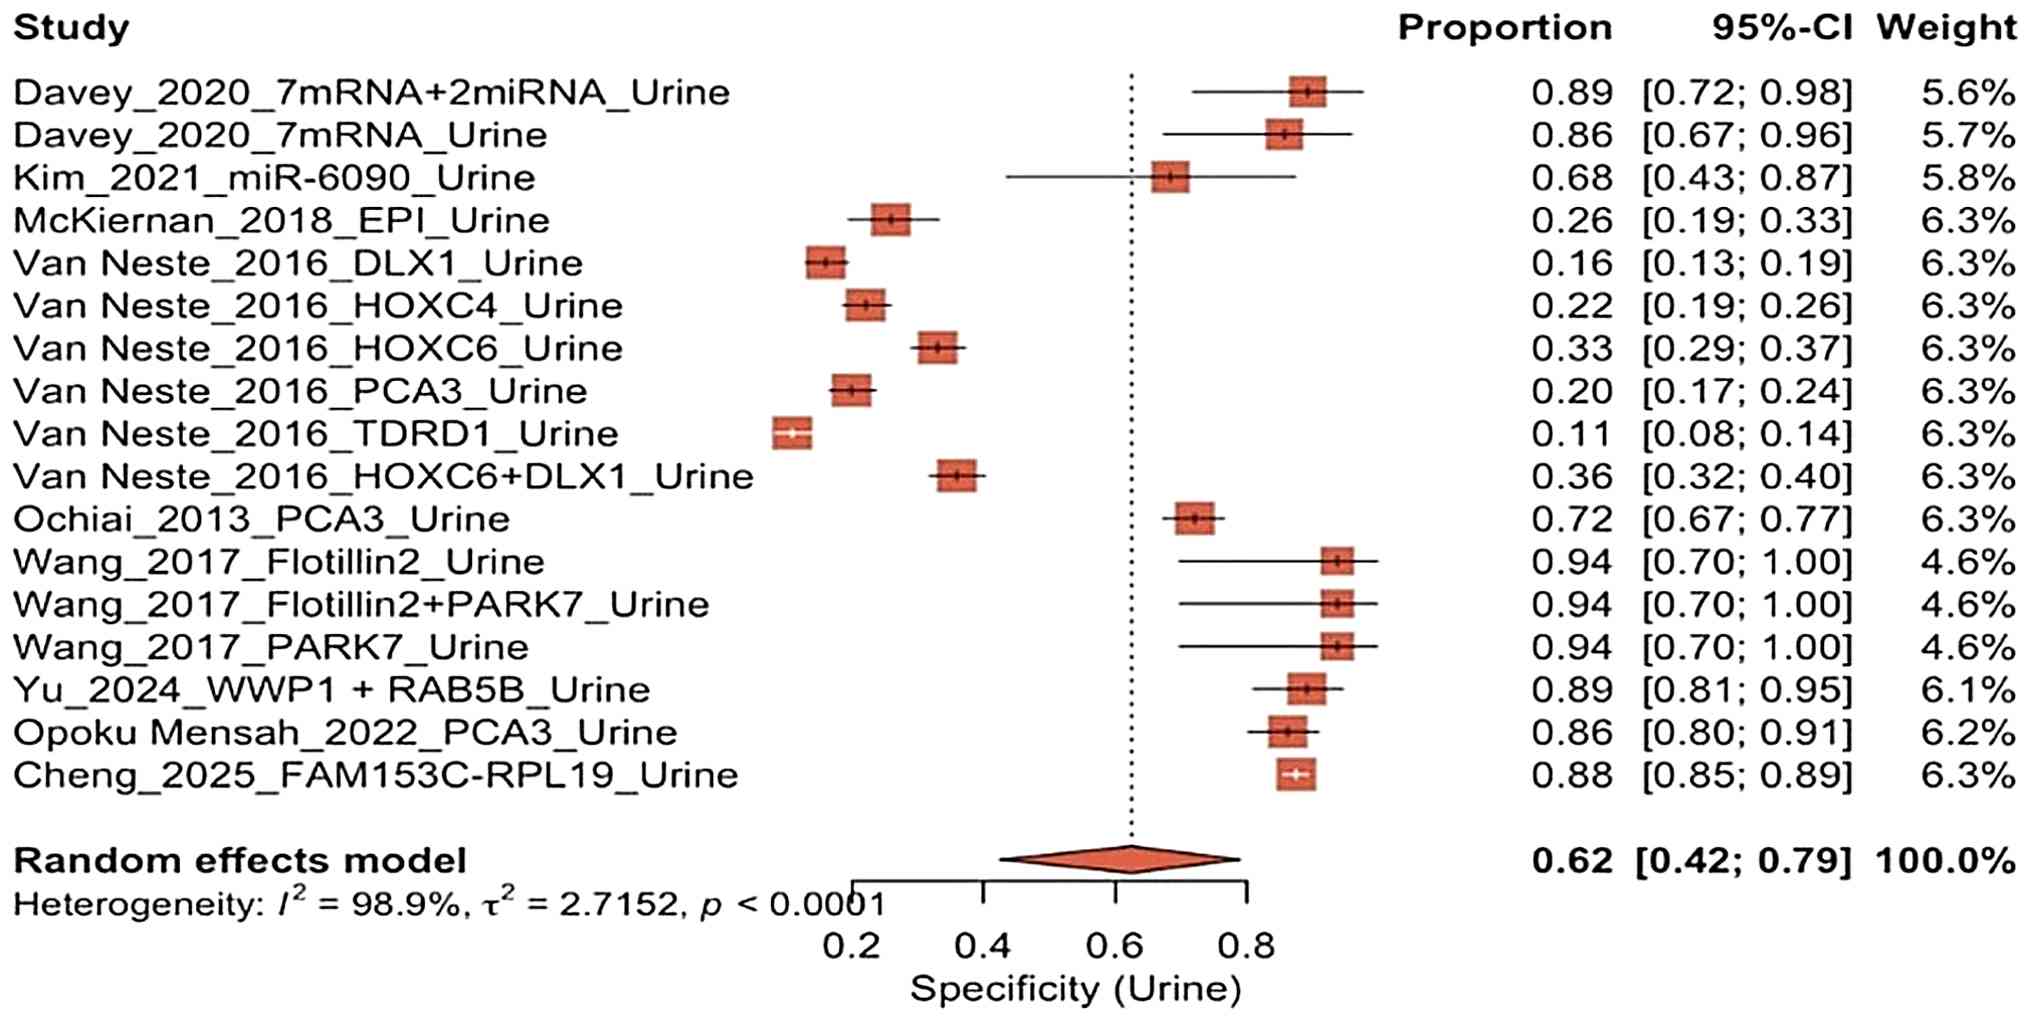
Specificity of urine biopsy. The specificity
of the urine-based biopsy studies varied significantly (Fig. 6); this was ~0.11 to 0.94 with a
pooled specificity of only 0.62 (95% CI, 0.42-0.79). While two
studies (19,22) exhibited a high performance, the
majority of biomarkers reported in the study by Van Neste et
al (18) exhibited low
specificity values (<0.35). The very high heterogeneity
(I2=98.9%) indicates that a variety of structural
factors, such as differences in molecular classification, detection
thresholds and measurement technology, play a critical role.
Meta-analysis specificity of blood
biopsy and urine biopsy (random effects model)
The specificity forest plot of blood biopsy vs.
urine biopsy using the random effects model (Fig. 7) revealed a wide variation in
diagnostic performance of 12 different studies. Blood-based
biomarkers generally exhibited very high specificity, with the
majority of values approaching 1.00 and relatively narrow
confidence intervals, particularly in the study by Haldrup et
al (14) and the gene panel in
the study by Constancio et al (13).
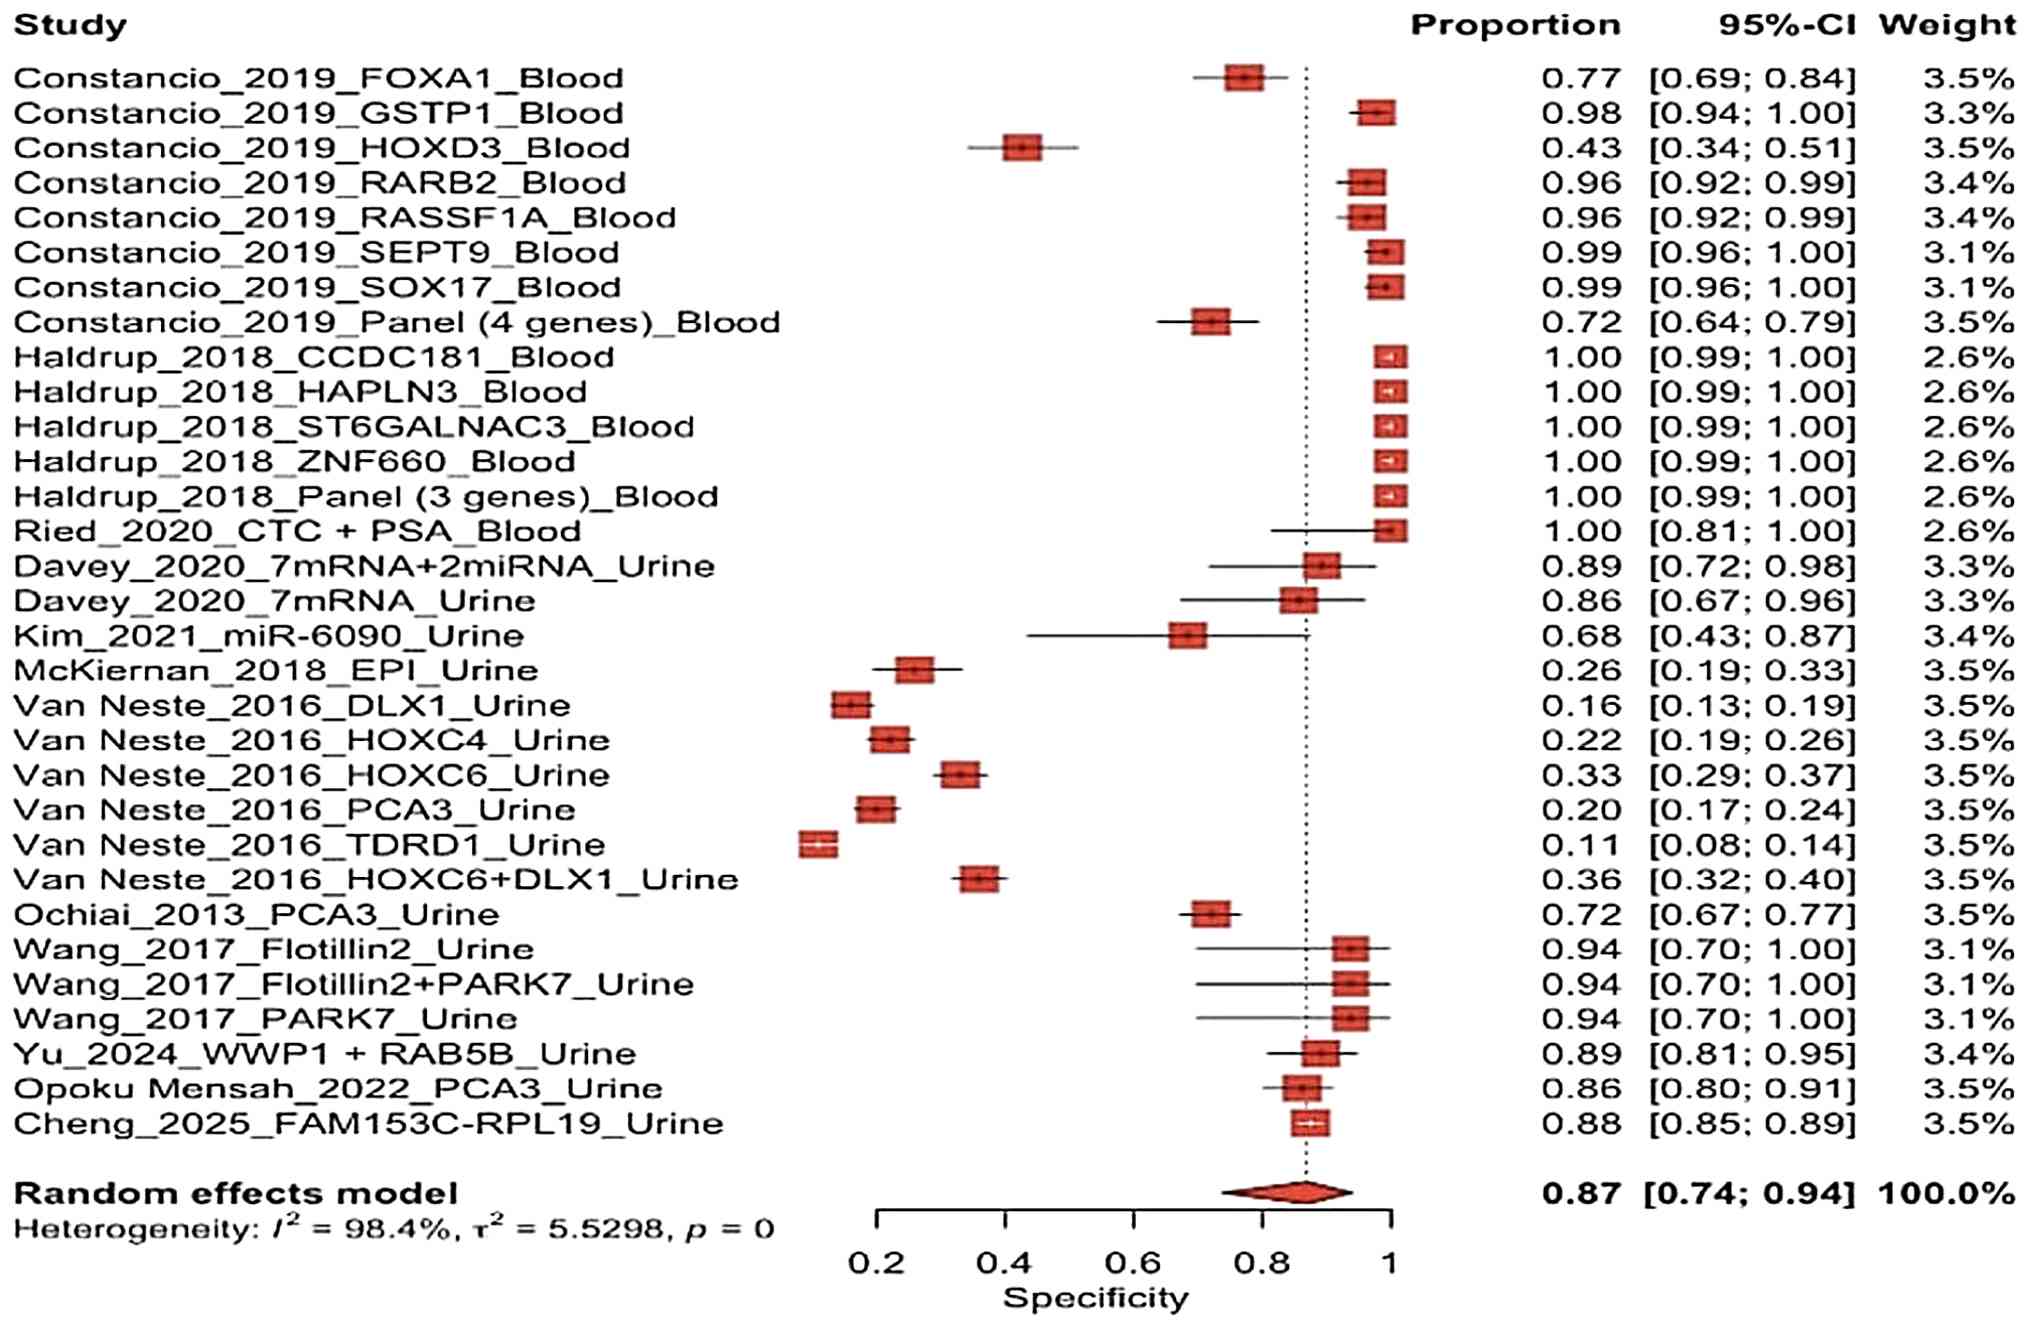 | Figure 7Specificity forest plot comparing
blood biopsy and urine biopsy studies using a random effects model.
The studies included were the following: Constancio et al
(13), Haldrup et al
(14), Ried et al (15), Davey et al (24), Kim et al (16), McKiernan et al (17), Van Neste et al (18), Ochiai et al (19), Wang et al (20), Yu et al (19), Opoku Mensah et al (22) and Cheng et al (23). |
By contrast, urine biomarkers demonstrated a much
wider range of specificities. Some urine markers, such as the
HOXC4, HOXC6, DLX1, PCA3 and TDRD1 panels (19), exhibited low to moderate
specificity, indicating a higher rate of false positives in certain
groups. However, other urine markers, similar with the Flotillin2 +
PARK7 and WWP1/RAB5B panels (18),
exhibited high specificity. This variation highlights that the
specificity of urine biomarkers is highly dependent on the type of
biomarker and the analytical methods used.
Overall, the random effects model yielded a pooled
specificity of 0.87 (95%, CI 0.74-0.94), indicating a good
diagnostic ability to identify subjects without prostate cancer.
However, the significant dispersion of studies along the horizontal
axis, corresponding to I2=98.4%, indicates extreme
heterogeneity and substantial variation between studies (Fig. 7).
Meta-analysis sensitivity of blood
biopsy and urine biopsy (random effects model)
The forest plot of sensitivity of blood biopsy and
urine biopsy using random model effect (Fig. 8) revealed significant variations in
diagnostic performance between the studies. Generally, the
blood-based studies exhibited lower and more widely dispersed
sensitivity values (ranging from 0.12 to 0.80), particularly for
single markers. By contrast, the urine-based studies exhibited
relatively high and consistent sensitivity values (~0.67 to 0.97).
This distinction is noticeable in the distribution of confidence
intervals at the top of the graph, where several urine biomarkers,
including HOXC6, HOXC4 and PCA3, and the multigene panel from the
study Van Neste et al (18)
cluster in areas indicating high sensitivity with relatively narrow
confidence intervals. This suggests that these estimates are more
stable. By contrast, the majority of blood-based biomarkers (such
as RASSF1A, SEPT9, RARB2 and SOX17) exhibited a low to intermediate
sensitivity with wider confidence intervals, reflecting greater
variability in estimates and smaller sample sizes (13).
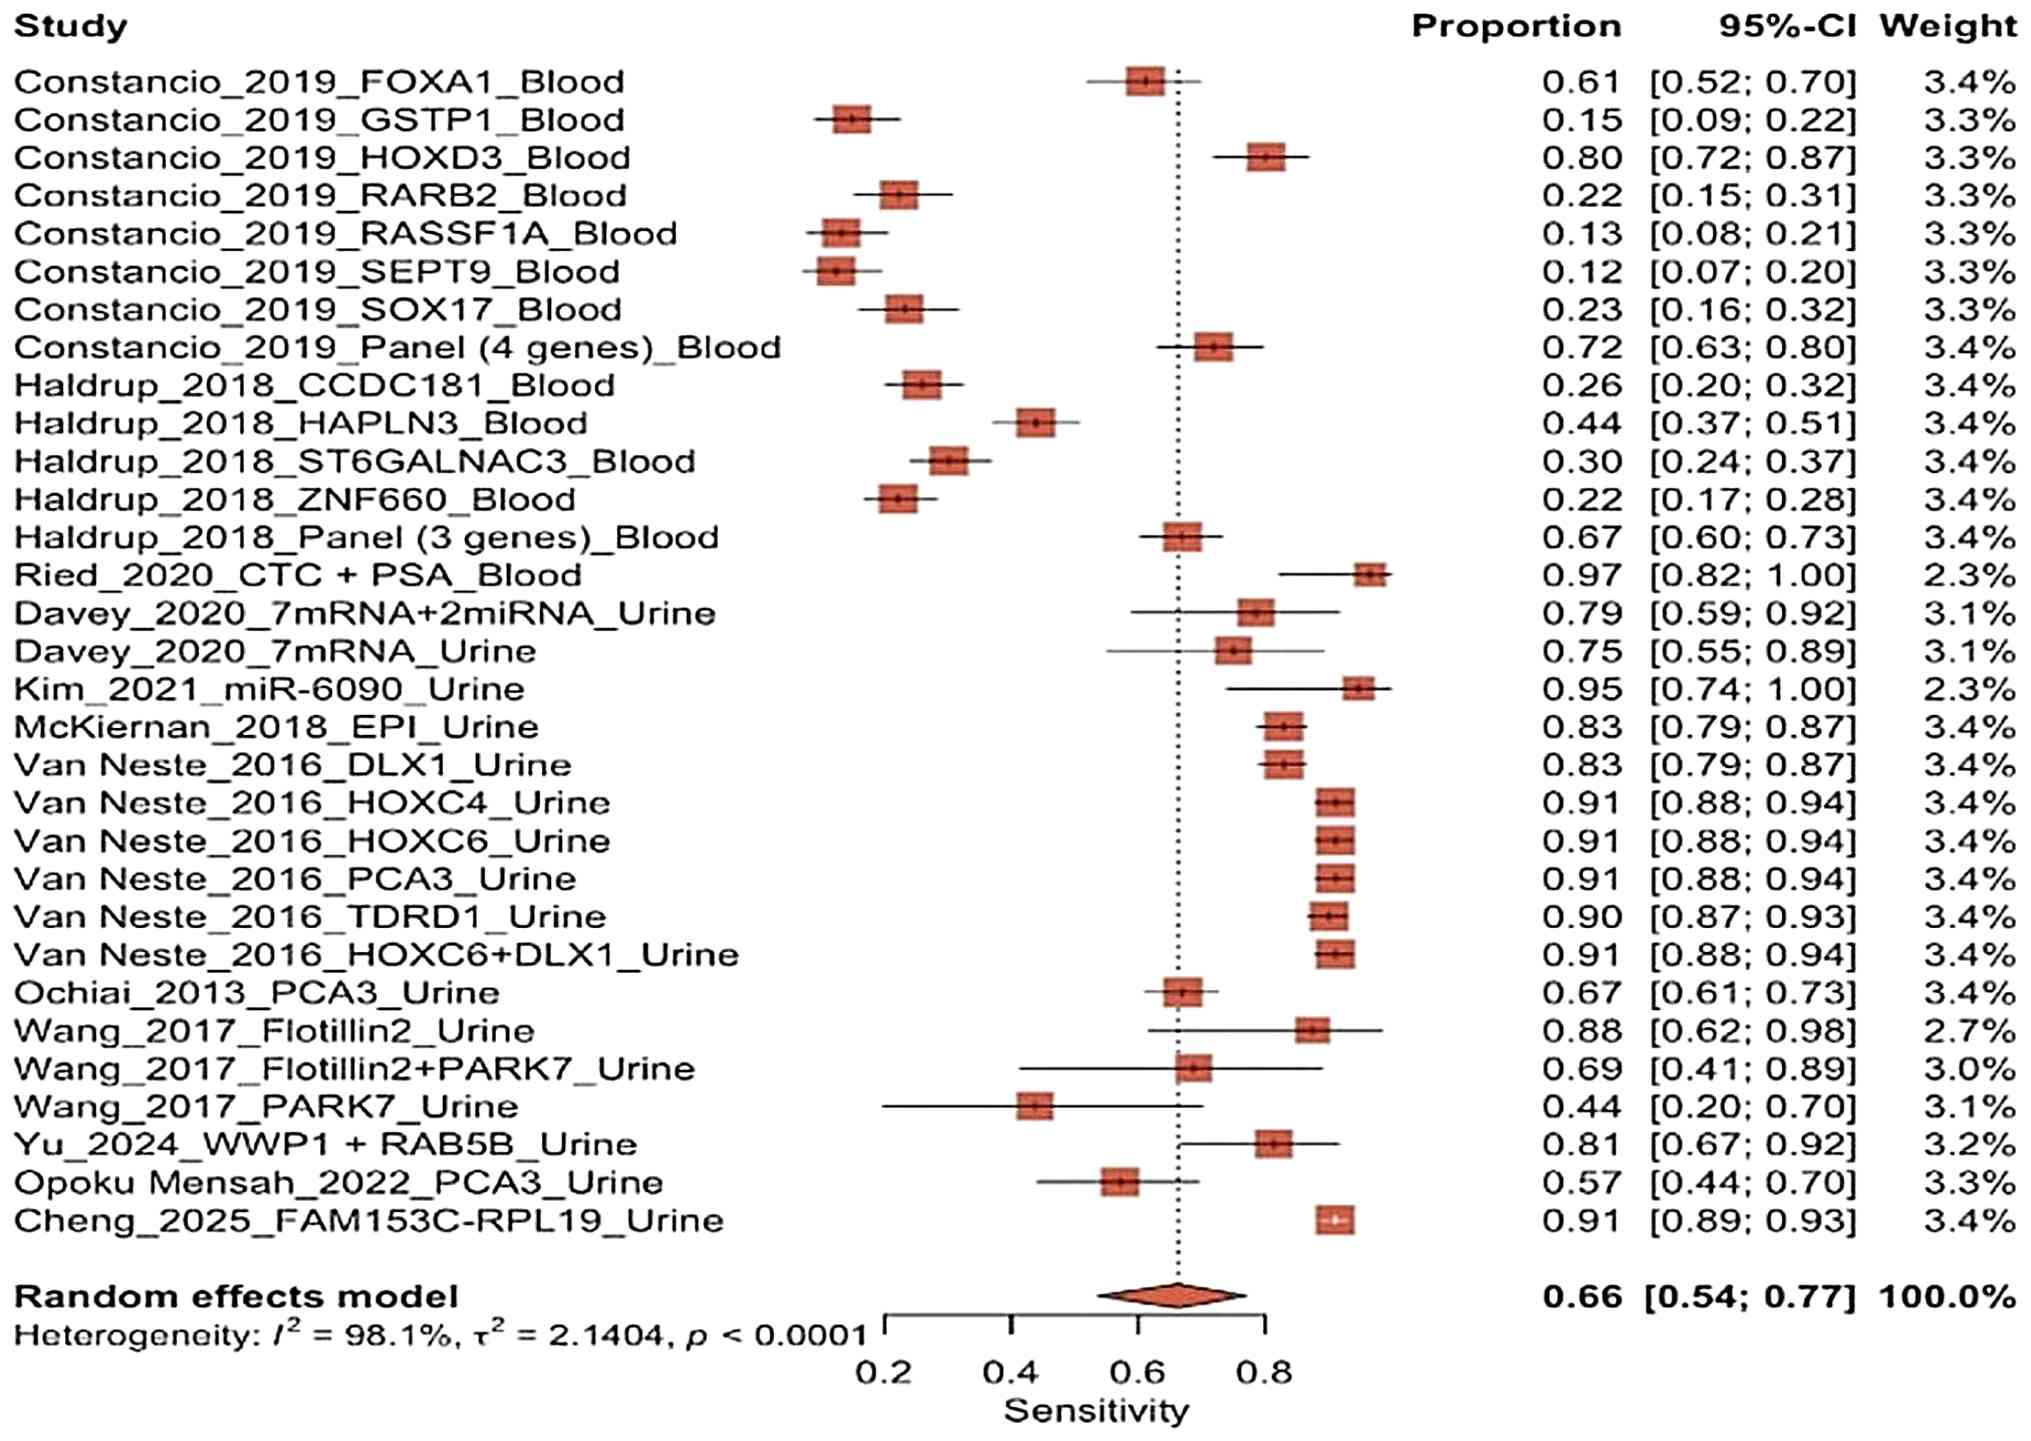 | Figure 8The sensitivity forest plot comparing
blood biopsy and urine biopsy studies using a random effect model.
The studies included were the following: Constancio et al
(13), Haldrup et al
(14), Ried et al (15), Davey et al (24), Kim et al (16), McKiernan et al (17), Van Neste et al (18), Ochiai et al (19), Wang et al (20), Yu et al (21), Opoku Mensah et al (22) and Cheng et al (23). |
The random effects model indicated a pooled
sensitivity of 0.66 (95% CI, 0.54-0.77), suggesting that the
average sensitivity of all the diagnostic tests included in this
meta-analysis is at a moderate level. However, the wide range of
study effect points and the significant variation in study values
highlight a high degree of heterogeneity among the studies, which
aligns with the previously reported I2 values. This
analysis also revealed that no single study or biomarker
predominantly influenced the results of the meta-analysis, as the
weights assigned to the studies are fairly evenly distributed
(~3.4%). This lack of dominance by any one study increases
confidence that the pooled results are not being overly influenced
by a single source.
The forest sensitivity plot indicated that while
some biomarkers demonstrated high diagnostic performance on their
own, their collective sensitivity accuracy was only moderate and
can vary significantly across different studies. This highlights
the necessity for additional subgroup analyses and bivariate
methods to gain a comprehensive understanding of the relationship
between sensitivity and specificity.
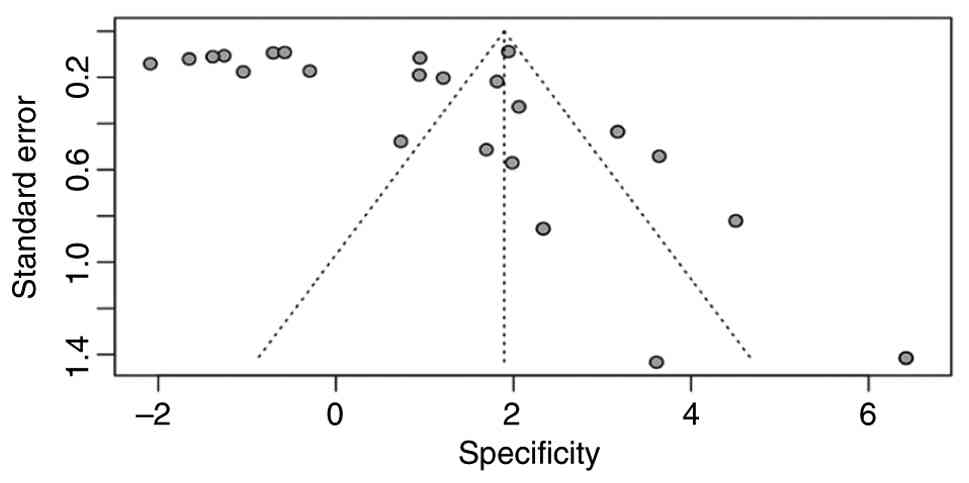
Risk of bias assessment for
specificity (funnel plot and Egger's test)
Egger's test was used for linear regression method
in the meta-analysis to detect potentials publication bias by
measuring the asymmetry of the funnel plot. The bias assessment for
specificity funnel plot analysis of the present meta-analysis
(Fig. 9) revealed a clear
asymmetrical distribution of study points. Studies with a high
specificity are clustered in the upper right-hand corner of the
plot, while those with lower specificity are less common and
unevenly distributed toward the left-hand corner. This imbalanced
distribution correlates with the significant result from Egger's
test (t=2.60; P=0.014), which indicates funnel plot asymmetry and
suggests the possibility of bias in specificity estimates.
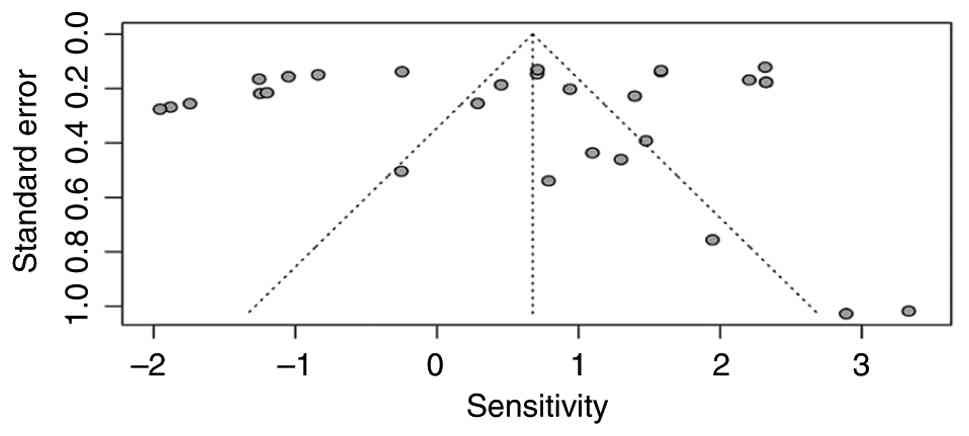
Risk of bias assessment for
sensitivity (funnel plot and Egger's test)
The bias assessment for sensitivity funnel plot
analysis (Fig. 10) revealed a
relatively symmetrical distribution of study points around the
combined effect line, exhibiting no evidence of missing small
studies on either side. This plot analysis aligns with the
non-significant result of Egger's test (t=-0.64; P=0.53); a small,
non-significant bias estimate (-2.05; SE=3.23) supports this
finding. However, the funnel plot reveals a wide vertical
distribution of studies, suggesting high variation in standard
errors among them. This observation is consistent with very high
residual heterogeneity (tau2=53.24), which complicates
interpretation as Egger's test is generally less sensitive to
datasets characterized by extreme heterogeneity. The highly varied
data (tau2=53.7), influenced by significant differences
in precision levels between studies also observed in this test.
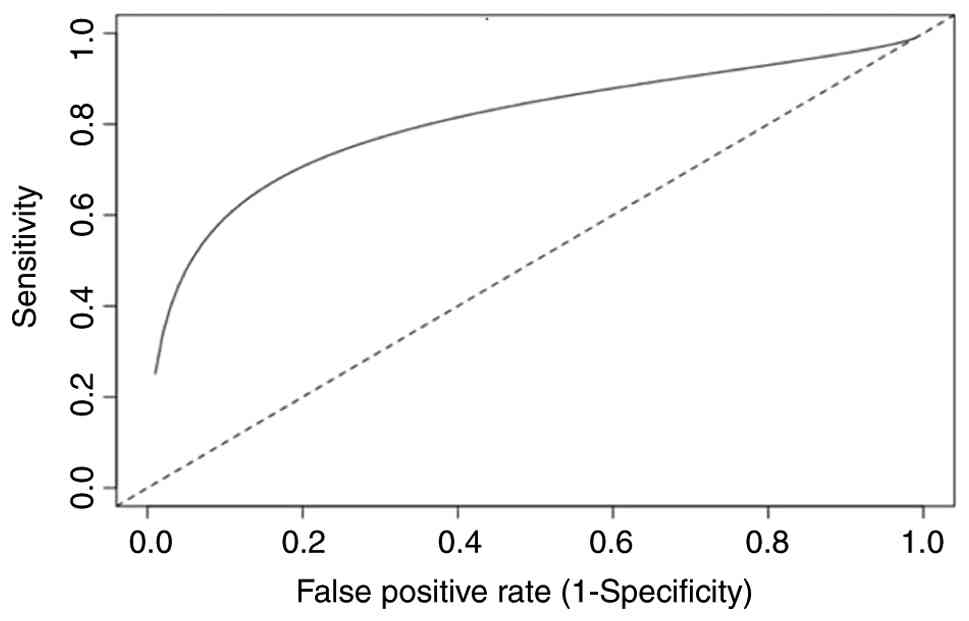
Diagnostic performance with bivariate
random effects (Reitsma model) for included studies
The analysis of the Reitsma bivariate random effects
model for the included studies (Fig.
11) demonstrated that prostate biomarkers within the overall
dataset exhibited solid diagnostic performance, exhibiting moderate
sensitivity and high specificity. The logit intercept for
sensitivity [the logit-transformed sensitivity (tsens)=0.62;
P=0.015] and the false-positive rate [the logit-transformed
false-positive rate (tpfr)=-1.80; P<0.001] were both
statistically significant. This resulted in a pooled sensitivity
estimate of 0.65 (95% CI, 0.53-0.76) and a false-positive rate of
0.14 (95% CI, 0.07-0.27) following probability transformation. The
likelihood ratio for a positive result (LR+) of 4.83 significantly
enhances the odds of having cancer, whereas the likelihood ratio
for a negative result (LR-) of 0.41 suggests limited ability to
exclude the disease. The DOR of 11.77 indicates a good overall
discriminatory capacity. The SROC curve, with an AUC of 0.80,
indicates a strong sensitivity-false-positive association that
significantly exceeds the random line, indicating good
discriminatory ability. The random effects model revealed
significant heterogeneity, with considerable between-study standard
deviations for sensitivity (1.39), the false-positive rate (2.26)
and strong positive correlation between sensitivity and the
false-positive rate (ρ=0.81).
Heterogeneity from the Zhou-Dendukuri approach
(I2=33.8%) indicated moderate variability after
accounting for the bivariate structure of the model. By contrast,
heterogenicity based on the Holling approach yielded higher values
(ranging from 84 to 94%), suggesting that factors, such as sample
size and study design significantly influence the variability of
the results (8,9).
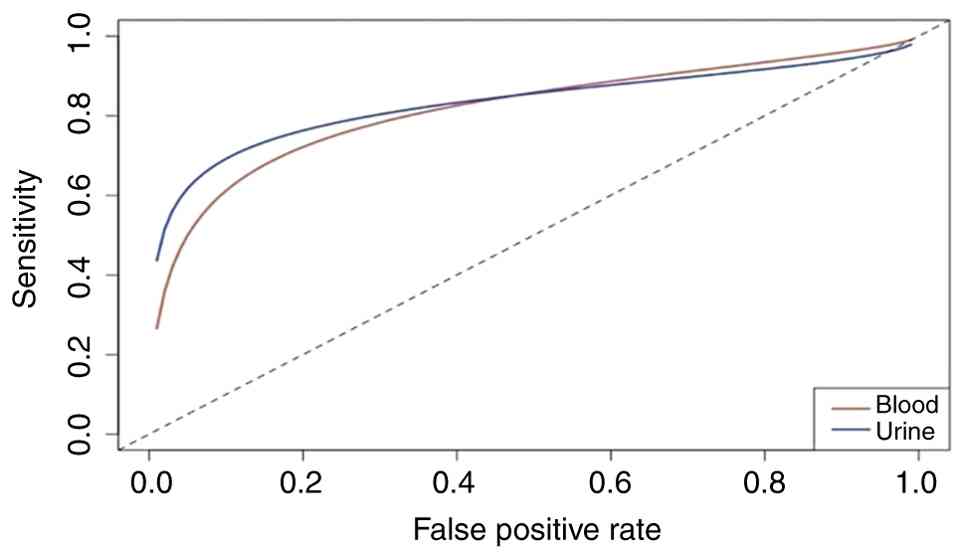
SROC curve between blood biopsy vs.
urine biopsy
The comparison of SROC curves between blood biopsy
vs. urine biopsy (Fig. 12)
revealed a significant difference in diagnostic performance between
blood and urine biomarkers. In the low to medium range of
false-positive rates, the curve for urine biomarkers is
consistently higher than that for blood biomarkers. The blood curve
is higher in the section of the graph that show a very low
false-positive rate, indicating stronger specificity. Both curves
are positioned far from the random diagonal line, which confirms
that both urine and blood tests have significant diagnostic
accuracy that surpasses chance-based predictions. The alignment of
the two curves in the upper right-hand corner of the graph suggests
that at very high false-positive rates, when diagnostic
discrimination is minimal, the sensitivity of blood and urine tests
becomes similar.
Discussion
The present meta-analysis of 12 studies (8-19)
that investigated blood biopsy and urine biopsy with different
biomarkers as a diagnostic tool for PCa found that accuracy was
significantly affected by biomarker type, analytical approach and
sample characteristics. The effectiveness of PCa biomarkers depends
on the type of biopsy (blood or urine) and the type of biomarker.
Accuracy was significantly affected by the variation in molecular
targets or biomarker type, RNA/miRNA/methylation platforms,
laboratory protocols and population characteristics. Clinically,
the high sensitivity and accuracy of urine biomarker tests support
this biopsy in diagnosing of PCa, rendering urine biomarkers
suitable for ruling out the disease compared with blood
biomarkers.
Blood-based biomarkers generally exhibit very high
specificity, indicating that these biomarker effectively exclude
non-cancer individuals with a low risk of false positives. By
contrast, urine biomarkers display a wider range of specificities,
from low to moderate, which can lead to a higher rate of false
positives in certain groups. However, some urine biomarkers, such
as the Flotillin2 + PARK7(15) or
WWP1/RAB5B panels (19)
demonstrate a high specificity. This difference underscores that
the specificity of urine biomarkers is highly dependent on the type
of biomarker and the analytical platform used. The observed
heterogeneity also reveals significant variation across different
studies.
The forest plot of specificity indicated that blood
biomarkers are more consistent and superior for rule-in diagnosis,
whereas urine biomarkers exhibit greater variability in their
specificity performance. To better understand the diagnostic
performance of both types of biomarkers, these combined results
should be analyzed using subgroup and bivariate models for a more
comprehensive assessment. Blood biopsy provides the significant
advantage of enabling repeated collection, which aids in the early
detection of resistance mechanisms that can influence treatment
strategies. This approach allows for the more effective
implementation of combination therapies. By utilizing genomic,
transcriptomic and epigenomic analyses on blood samples, the
prediction of patient phenotypes can be enhanced and liquid
biopsies can be optimized in clinical settings. An effective PCa
blood assay should guide essential clinical decisions, including
diagnosis, molecular characterization, early risk stratification,
timely relapse detection and informed treatment choices regarding
intensification or cessation (25). Collaboration among clinicians,
researchers and bioinformaticians is essential to address this
challenge to identify who should be molecularly profiled, improve
biomarker-driven clinical trial designs, overcome technical
obstacles, and successfully integrate liquid biopsies into standard
clinical practice, ultimately enhancing the outcomes of patients
with PCa.
The liquid biopsy is revolutionizing cancer care as
an effective non-invasive approach for early diagnosis, tailored
biopsy selection, ongoing surveillance of low-risk cancer, and
monitoring for recurrence after treatment. By harnessing this
advanced technology, highly sensitive and specific biomarkers can
be identified, enabling earlier detection and superior risk
stratification. This paves the way for personalized treatment plans
that cater to the unique needs of each patient with PCa, ensuring
improved outcomes and quality of life (26-28).
Further meta-analyses are required to assess the
diagnostic performance of each biomarker from blood and urine
biopsy as a single or combined biomarker with different prevalence,
thresholds and laboratory approaches (genomic, transcriptomic and
epigenomic analyses) for clinical settings. Another key aspect of
these biomarkers is their cost effectiveness. The main challenges
are ensuring that tests are reliable, affordable, and clinically
useful to prevent both overdiagnosis and undertreatment.
In conclusion, according to the present
meta-analysis, blood biopsy has potential for use as a tool for
confirming diagnoses (rule-in), although this biopsy may have a low
to moderate sensitivity. By contrast, urine biopsy provides a
significant advantage with the higher and more reliable
sensitivity, although with greater variability in specificity. This
unique profile renders urine biopsy an optimal choice for initial
screenings (rule-out), helping to identify potential issues early
and effectively. Selecting the right type of biomarker both from
blood or urine biopsy can enhance diagnostic accuracy and improve
patient care.
Acknowledgements
Not applicable.
Funding
Funding: No funding was received.
Availability of data and materials
The data generated in the present study may be
requested from the corresponding author.
Author's contributions
All authors (FES, FR, CAM and ARAHH) conducted a
significant portion of the literature search and drafted the
manuscript, had full access to all data in the study and take
responsibility for the integrity of the data and the accuracy of
the data analysis, provided critical review and feedback on the
manuscript. All authors have read and approved the final version of
the manuscript. FES and FR confirm the authenticity of all the raw
data.
Ethics approval and consent to
participate
Not applicable.
Patient consent for publication
Not applicable.
Competing interests
The authors declare that they have no competing
interests.
References
|
1
|
Siegel RL, Kratzer TB, Giaquinto AN, Sung
H and Jemal A: Cancer statistics, 2025. CA Cancer J Clin. 75:10–45.
2025.PubMed/NCBI View Article : Google Scholar
|
|
2
|
Nguyen-Nielsen M and Borre M: Diagnostic
and therapeutic strategies for prostate cancer. Semin Nucl Med.
46:484–490. 2016.PubMed/NCBI View Article : Google Scholar
|
|
3
|
Padhani AR, Godtman RA and Schoots IG: Key
learning on the promise and limitations of MRI in prostate cancer
screening. Eur Radiol. 34:6168–6174. 2024.PubMed/NCBI View Article : Google Scholar
|
|
4
|
Rapisarda S, Bada M, Crocetto F, Barone B,
Arcaniolo D, Polara A, Imbimbo C and Grosso G: The role of
multiparametric resonance and biopsy in prostate cancer detection:
Comparison with definitive histological report after
laparoscopic/robotic radical prostatectomy. Abdom Radiol (NY).
45:4178–4184. 2020.PubMed/NCBI View Article : Google Scholar
|
|
5
|
Serrano MJ, Garrido-Navas MC, Diaz Mochon
JJ, Cristofanilli M, Gil-Bazo I, Pauwels P, Malapelle U, Russo A,
Lorente JA, Ruiz-Rodriguez AJ, et al: Precision prevention and
cancer interception: The new challenges of liquid biopsy. Cancer
Discov. 10:1635–1644. 2020.PubMed/NCBI View Article : Google Scholar
|
|
6
|
Ozturk EA and Caner A: Liquid biopsy for
promising non-invasive diagnostic biomarkers in parasitic
infections. Acta Parasitol. 67:1–17. 2022.PubMed/NCBI View Article : Google Scholar
|
|
7
|
Zainfeld D and Goldkorn A: Liquid biopsy
in prostate cancer: Circulating tumor cells and beyond. Cancer
Treat Res. 175:87–102. 2018.PubMed/NCBI View Article : Google Scholar
|
|
8
|
Zhou Y and Dendukuri N: Statistics for
quantifying heterogeneity in univariate and bivariate meta-analyses
of binary data: The case of meta-analyses of diagnostic accuracy.
Stat Med. 33:2701–2717. 2014.PubMed/NCBI View
Article : Google Scholar
|
|
9
|
Holling H, Böhning W, Masoudi E, Böhning D
and Sangnawakij P: Evaluation of a new version of
I2 with emphasis on diagnostic problems. Commun
Stat Simul Comput. 9:942–972. 2020.
|
|
10
|
Reitsma JB, Glas AS, Rutjes AW, Scholten
RJ, Bossuyt PM and Zwinderman AH: Bivariate analysis of sensitivity
and specificity produces informative summary measures in diagnostic
reviews. J Clin Epidemiol. 58:982–990. 2005.PubMed/NCBI View Article : Google Scholar
|
|
11
|
Takwoingi Y, Guo B, Riley RD and Deeks JJ:
Performance of methods for meta-analysis of diagnostic test
accuracy with few studies or sparse data. Stat Methods Med Res.
26:1896–1911. 2017.PubMed/NCBI View Article : Google Scholar
|
|
12
|
Rosenberger KJ, Chu H and Lin L: Empirical
comparisons of meta-analysis methods for diagnostic studies: A
meta-epidemiological study. BMJ Open. 12(e055336)2022.PubMed/NCBI View Article : Google Scholar
|
|
13
|
Constâncio V, Nunes SP, Moreira-Barbosa C,
Freitas R, Oliveira J, Pousa I, Oliveira J, Soares M, Dias CG, Dias
T, et al: Early detection of the major male cancer types in
blood-based liquid biopsies using a DNA methylation panel. Clin
Epigenetics. 11(175)2019.PubMed/NCBI View Article : Google Scholar
|
|
14
|
Haldrup C, Pedersen AL, Øgaard N, Strand
SH, Høyer S, Borre M, Ørntoft TF and Sørensen KD: Biomarker
potential of ST6GALNAC3 and ZNF660 promoter hypermethylation in
prostate cancer tissue and liquid biopsies. Mol Oncol. 12:545–560.
2018.PubMed/NCBI View Article : Google Scholar
|
|
15
|
Ried K, Tamanna T, Matthews S, Eng P and
Sali A: New screening test improves detection of prostate cancer
using circulating tumor cells and prostate-specific markers. Front
Oncol. 10(582)2020.PubMed/NCBI View Article : Google Scholar
|
|
16
|
Kim J, Shim JS, Han BH, Kim HJ, Park J,
Cho IJ, Kang SG, Kang JY, Bong KW and Choi N: Hydrogel-based
hybridization chain reaction (HCR) for detection of urinary
exosomal miRNAs as a diagnostic tool of prostate cancer. Biosens
Bioelectron. 192(113504)2021.PubMed/NCBI View Article : Google Scholar
|
|
17
|
McKiernan J, Donovan MJ, Margolis E,
Partin A, Carter B, Brown G, Torkler P, Noerholm M, Skog J, Shore
N, et al: A prospective adaptive utility trial to validate
performance of a novel urine exosome gene expression assay to
predict high-grade prostate cancer in patients with
prostate-specific antigen 2-10 ng/ml at initial biopsy. Eur Urol.
74:731–738. 2018.PubMed/NCBI View Article : Google Scholar
|
|
18
|
Van Neste L, Hendriks RJ, Dijkstra S,
Trooskens G, Cornel EB, Jannink SA, de Jong H, Hessels D, Smit FP,
Melchers WJ, et al: Detection of high-grade prostate cancer using a
urinary molecular biomarker-based risk score. Eur Urol. 70:740–748.
2016.PubMed/NCBI View Article : Google Scholar
|
|
19
|
Ochiai A, Okihara K, Kamoi K, Oikawa T,
Shimazui T, Murayama S, Tomita K, Umekawa T, Uemura H and Miki T:
Clinical utility of the prostate cancer gene 3 (PCA3) urine assay
in Japanese men undergoing prostate biopsy. BJU Int. 111:928–933.
2013.PubMed/NCBI View Article : Google Scholar
|
|
20
|
Wang L, Skotland T, Berge V, Sandvig K and
Llorente A: Exosomal proteins as prostate cancer biomarkers in
urine: From mass spectrometry discovery to immunoassay-based
validation. Eur J Pharm Sci. 98:80–85. 2017.PubMed/NCBI View Article : Google Scholar
|
|
21
|
Yu J, Yu C, Jiang K, Yang G, Yang S, Tan
S, Li T, Liang H, He Q, Wei F, et al: Unveiling potential: Urinary
exosomal mRNAs as non-invasive biomarkers for early prostate cancer
diagnosis. BMC Urol. 24(163)2024.PubMed/NCBI View Article : Google Scholar
|
|
22
|
Opoku Mensah B, Fondjo LA, Owiredu WKBA
and Adusei B: Urinary PCA3 a superior diagnostic biomarker for
prostate cancer among Ghanaian men. Dis Markers.
2022(1686991)2022.PubMed/NCBI View Article : Google Scholar
|
|
23
|
Cheng B, Luo T, Wu Y, Hu J, Yang C, Wu J,
Luo Y, Shangguan W, Li W, Yang L, et al: Urinary exosomal
FAM153C-RPL19 chimeric RNA as a diagnostic and prognostic biomarker
for prostate cancer in Chinese patients. Cancer Lett.
631(217938)2025.PubMed/NCBI View Article : Google Scholar
|
|
24
|
Davey M, Benzina S, Savoie M, Breault G,
Ghosh A and Ouellette RJ: Affinity captured urinary extracellular
vesicles provide mRNA and miRNA biomarkers for improved accuracy of
prostate cancer detection: A pilot study. Int J Mol Sci.
21(8330)2020.PubMed/NCBI View Article : Google Scholar
|
|
25
|
Trujillo B, Wu A, Wetterskog D and Attard
G: Blood-based liquid biopsies for prostate cancer: Clinical
opportunities and challenges. Br J Cancer. 127:1394–1402.
2022.PubMed/NCBI View Article : Google Scholar
|
|
26
|
Prensner JR, Rubin MA, Wei JT and
Chinnaiyan AM: Beyond PSA: The next generation of prostate cancer
biomarkers. Sci Transl Med. 4(127rv3)2012.PubMed/NCBI View Article : Google Scholar
|
|
27
|
Chi KR: The dark side of the human genome.
Nature. 538:275–277. 2016.PubMed/NCBI View
Article : Google Scholar
|
|
28
|
Minciacchi VR, Zijlstra A, Rubin MA and Di
Vizio D: Extracellular vesicles for liquid biopsy in prostate
cancer: Where are we and where are we headed? Prostate Cancer
Prostatic Dis. 20:251–258. 2017.PubMed/NCBI View Article : Google Scholar
|