Introduction
Kashin-Beck disease (KBD) is an endemic
osteoarthropathy, which is similar with osteoarthritis (OA) in
clinical manifestation, with pathological features including
cartilage degeneration, cartilage extracellular matrix degradation,
chondrocyte necrosis and apoptosis (1,2). In
contrast with OA, instead of the middle aged and elderly people,
KBD predominantly presents in 3–12 year old patients. KBD is
characterized by swelling of digits, deformed limb joints and
limited movement or potentially dwarfism (3), the majority of adult patients partly or
completely lose work and self-care ability. KBD primarily occurs in
the northeast and southwest regions of China where selenium
deficiency has been associated with the disease pathogenesis
(4). To date, there are more than
0.66 million KBD patients in China, while less than 30 million
residents are at risk in endemic areas (4,5).
At present, diagnosis of KBD remains to be based on
clinic manifestations and X-ray changes of metaphyseal (5). KBD may be classed as early, stage І, II
and III, according to the severity (6). The clinic changes generally appear
after cartilage degeneration with a slow process, thereby the
method is not sensitive enough to diagnose and treat the early case
which inevitably leads to irreversible aggravation, such as
deformed limbs. Hence, effective early diagnosis is crucial for the
therapy and prognosis of KBD.
Peripheral blood collection is rapid, with small
trauma, which is why it is the ideal biological sample for the
early diagnosis of various diseases (7). A number of studies have analyzed the
differentially expressed genes of peripheral blood to identify
marker genes for early diagnosis of diseases including cancer,
coronary disease and OA (8–12). With regard to KBD, in prior studies
differentially expressed genes in cartilage and peripheral blood
have been screened using microarrays (1,7,13). Although single gene expression
analyses are important for authenticating the related target genes
of KBD and OA, KBD is a gene-environment interactional disease;
therefore, gene network and pathway analyses may prove more
comprehensive and effective for the early diagnosis and therapy of
KBD and OA, as compared with single gene analyses.
In the present study, an Agilent 44k human
microarray was applied to determine the gene expression profile of
peripheral blood mononuclear cells (PBMCs) and to identify the
different expressed genes between the KBD and normal control
subjects. The data of different expressed genes in peripheral blood
of OA was obtained from GEO database (http://www.ncbi.nlm.nih.gov/geo/). Ingenuity Pathway
Analysis (IPA) was used for network and pathway analyses. The
comparison of commonly expressed genes and signaling pathways
between KBD and OA patients may help to identify the key genes and
pathways associated with KBD, for improved early diagnosis and
elucidation of its pathogenesis.
Materials and methods
Ethical approval
This study was approved by the human ethics
committee of Xi'an Jiaotong University (Xi'an, China) and all
subjects provided informed consent.
Disease diagnosis and grouping
Subjects were selected randomly from the Center for
Disease Control, Yongshou County (Xianyang, China), an endemic area
with a KBD prevalence of 17.4% (14). Patients were diagnosed according to
WS/T 207–2010 criteria (6), while
those with any history of other osteoarticular diseases were
excluded. Finally, 20 KBD patients and 12 normal controls were
selected (age and gender matched) and divided into four groups
(KBD, n=5 subjects/pair; control, n=3 subjects/pair) (Table I). In additional, 5 KBD patients and
5 normal controls were selected to validate the results of the
microarray (Table I).
 | Table I.Characteristics of the patients with
KBD and control subjects used for microarray and RT-qPCR
analysis. |
Table I.
Characteristics of the patients with
KBD and control subjects used for microarray and RT-qPCR
analysis.
|
| KBD | Normal |
|---|
|
|
|
|
|---|
| Sample pair | n | Age, years
(range) | Male | Female | n | Age, years
(range) | Male | Female |
|---|
| Microarray |
|
| 1 | 5 | 47.20 (41–55) | 2 | 3 | 3 | 45.00 (35–63) | 1 | 2 |
| 2 | 5 | 50.40 (43–58) | 2 | 3 | 3 | 48.67 (39–68) | 1 | 2 |
| 3 | 5 | 50.20 (40–67) | 2 | 3 | 3 | 44.67 (37–59) | 1 | 2 |
| 4 | 5 | 46.60 (38–58) | 3 | 2 | 3 | 51.00 (27–54) | 0 | 3 |
| RT-qPCR |
|
| 1 | 5 | 59.60 (52–69) | 3 | 2 | 5 | 56.00 (48–65) | 3 | 2 |
Peripheral blood sample
collection
A total of 3 ml peripheral blood was collected from
each subject into heparinized vacutainer tubes (BD Biosciences, San
Jose, CA, USA) for gene expression analysis. The number of
leukocyte cells was determined by using a Hemovet 950 (Drew
Scientific, Inc., Oxford, CT, USA). PBMCs were separated from the
plasma by centrifuging blood at 1,500 × g for 20 min. The cell
pellet was resuspended in Hank's balanced salt solution (Gibco;
Thermo Fisher Scientific, Inc., Waltham, MA, USA). The cell
suspension was layered over 5 ml Lympholyte-H (Cedarlane
Laboratories Ltd., Hornby, ON, Canada) in a 15-ml Falcon tube and
centrifuged for 40 min at 1,500 × g. After rinsing twice with cold
Hank's balanced salt solution, they were stored in RNAlater
(Ambion, Inc., Austin, TX, USA) until RNA isolation.
RNA preparation
The total RNA was isolated from PBMCs using TRIzol
reagent (Invitrogen; Thermo Fisher Scientific, Inc., Carlsbad, CA,
USA) following the manufacturer's recommended protocol. The quality
and integrity of extracted total RNA were evaluated using a high
resolution electrophoresis system (Agilent 2100 bioanalyzer;
Agilent Technologies, Palo Alto, CA, USA). To avoid individual
differences among subjects, 30 µl total RNA was extracted from each
individual subject and mixed to form four pairs of microarrays,
according to the four groups in Table
I.
Microarray hybridization
Isolated total RNA was mixed with RNase-free DNase I
(Thermo Fisher Scientific, Inc.) and incubated at 37°C for 30 min,
followed by mixing with EDTA at 65°C for 10 min, to remove residual
genomic DNA. The isolated total RNA of KBD and control in each pair
was first transcribed into cDNA, which were labeled with CyDye,
using an Amino Allyl Message Ampa RNA Kit (Ambion, Inc.) according
to the manufacturer's protocol. For each pair, 0.5 µg labeled cDNA
was purified separately and mixed with hybridization buffer
(LifeGen Technologies, LLC, Madison, WI, USA) prior to application
to the microarrays. The Agilent 44K human whole-genome
oligonucleotide microarray (Agilent Technologies) consisting of
21,073 (60-mer) oligonucleotide probes, which span conserved exons
across the transcripts of the targeted full-length genes, was then
applied for microarray hybridization following the Agilent
recommended protocol. The microarray slides were scanned using
Gene-Pix 4000B (Axon Instruments, Inc., Foster City, CA, USA).
GenePixPro 3.0 software package (Axon Instruments, Inc.) was used
to analyze the 16-bit TIFF images produced by the Axon scanner. The
ratio image of all spots was defined by accessing the gene list
file which described the location of each gene on the microarray.
The gene expression data were imported into Excel spreadsheets
(Microsoft Corporation, Redmond, WA, USA) using Unigene (http://www.ncbi.nlm.nih.gov/unigene) and GenBank
(http://www.ncbi.nlm.nih.gov/genbank/)
descriptors after the average signal intensity was subtracted from
the median background intensity. Global normalization was conducted
to calculate the relative expression level between two samples
using all detected genes.
Gene expression analysis
Significance analysis of microarrays (SAM) (15) is a statistical technique used to
identify differentially expressed genes. The cutoff for
significance is determined by a tuning parameter, delta, selected
by the user based on the false-positive rate (<0.05). The SAM
algorithm performs unsupervised calculations based on Student's
t-test to identify significant genes in a set of microarray data.
SAM computes a statistic ‘di’ for each gene ‘i’, measuring the
strength of the association between gene expression and the
response variable. It uses repeated permutations of the data to
determine if the expression levels of selected genes are
significantly associated with the response.
Microarray data of PBMCs in OA
The PBMCs of OA microarray data GSE48556, published
by Ramos et al (12), was
downloaded from GEO database in NCBI and performed using IPA. The
data GSE48556 included 106 patients with OA and 33 normal controls
that were age and sex-matched. In total, 1 ml peripheral blood was
collected from each sample for the microarray analysis, conducted
using an Illumina HumanHT-12 v3 BeadChip platform (Illumina, San
Diego, CA, USA).
IPA
IPA uses Fisher's exact test to determine which
biofunctions and canonical pathways are significantly associated
with the genes of interest compared with the whole Ingenuity
knowledge base (http://www.ingenuity.com/science/knowledge-base). In
the present study, IPA was used to identify the signaling pathways
and biofunctions of KBD and OA in PBMCs. Gene symbols of PBMCs of
KBD and OA patients were imported into IPA, version 8.5 (Ingenuity
Systems; Qiagen, Hilden, Germany) web-based software, respectively.
IPA is a repository of biological interactions and functional
annotations including proteins, genes, complexes, cells, tissues,
metabolites, drugs and diseases. EntrezGene (http://jura.wi.mit.edu/entrez_gene/), Ref-Seq
(http://www.ncbi.nlm.nih.gov/refseq/),
OMIM (http://www.ncbi.nlm.nih.gov/omim), TargetScan
(www.targetscan.org), GWAS (http://www.gwascentral.org/) and KEGG (http://www.genome.jp/kegg/) were selected by IPA. The
trial version of IPA software was used. Genes from the dataset that
met the log ratio cutoff of 2.0 were considered for analysis.
Reverse transcription-quantitative
polymerase chain reaction (RT-qPCR) validation
To validate the microarray results from different
experimental groups, four significant differentially expressed
genes in PBMCs were selected as target genes to undergo RT-qPCR.
Total RNA was isolated from PBMCs (Table
I), and prepared in the same method as for oligonucleotide
microarray analysis. mRNA was converted into cDNA using superscript
II reverse transcriptase (Invitrogen; Thermo Fisher Scientific,
Inc.) and random primers. qPCR was performed using 2.0 µl cDNA and
the SYBR® Premix Ex Taq™ II kit (Takara Bio, Inc., Otsu,
Japan) on the ABI7500 Real-Time PCR system (Applied Biosystems,
Foster City, CA, USA) according to the manufacturer's instructions.
The PCR cycling conditions were as follows: 95°C for 30 sec,
followed by 40 cycles of 95°C for 5 sec and 60°C for 30 sec. The
primer sequences were as follows: CCL3 forward,
5′-TTCCGTCACCTGCTCAGAAT-3′ and reverse, 5′-TGGCTGCTCGTCTCAAAGTA-3′;
B2M forward, 5′-TGGGTTTCATCCATCCGACA-3′ and reverse,
5′-ATGCGGCATCTTCAAACCTC-3′; HBA2 forward,
5′-CAGCTCTTGCTGCTGCTGTG-3′ and reverse,
5′-AAGGATGATCTTGCAGGCAGAA-3′; BIRC3 forward,
5′-GACTCAGGTGTTGGGAATCTGGA-3′ and reverse,
5′-TGAGGGTAACTGGCTTGAACTTGAC-3′; and β-actin forward,
5′-CGGAGTCAACGGATTTGGTCGTAT-3′ and reverse,
5′-AGCCTTCTCCATGGTGGTGAAGAC-3′. Relative fold-change for each
individual gene was calculated using the comparative threshold
cycle equation 2−∆∆Cq. Cq values of target genes were
normalized against the Cq values of β-actin. The PCR results were
analyzed using the Bio-Rad iQ5 software, version 2.1 (Bio-Rad
Laboratories, Inc., Hercules, CA, USA). Mann-Whitney Wilcoxon Test
was performed to determine significance levels of expression
differences for the selected genes between KBD and healthy
controls.
Results
Different expressed genes between KBD
and OA
Using the SAM 4.01 analysis, 82 differentially
expressed genes were identified from microarrays of KBD compared to
the control. Among these genes, 78 were upregulated and four
downregulated. These genes are primarily involved in eight
functions, including transport, transmembrane receptor, cytokine,
ion channel, transcription regulator, enzymes and growth factors.
Compared with the 89 differentially expressed genes of OA
identified by Ramos et al (12), BIRC3, IL-1β, NFKBIA, EGR1 and CXCL8
are identified as common differentially expressed genes (Table II).
| Table II.List of five common expression genes
in PBMCs of KBD and OA patients. |
Table II.
List of five common expression genes
in PBMCs of KBD and OA patients.
|
|
|
| Fold change |
|---|
|
|
|
|
|
|---|
| Gene | Symbol | NCBI ID | KBD | OA |
|---|
| baculoviral IAP
repeat containing 3 | BIRC3 | NM_001165 | 2.23 | 2.01 |
| interleukin 1,
beta | IL-1β | NM_000576 | 2.03 | 1.76 |
| nuclear factor of
kappa light polypeptide gene enhancer in B-cells inhibitor,
alpha | NFKBIA | NM_020529 | 2.01 | 1.75 |
| Early growth
response 1 | EGR1 | NM_001964 | 2.13 | 5.35 |
| Chemokine (C-X-C
motif) ligand 8 | CXCL8 | NM_000584 | 2.11 | 3.07 |
IPA analyses of KBD and OA
Based on 82 different expressed genes in KBD, 51
significant pathways and five most common molecular and cellular
biofunctions, including cell death and survival (29 genes were
involved), lipid metabolism, molecular transport, micro-molecule
biochemistry and cell movement (Table
III) were identified by IPA. Regarding OA, based on 89
different expressed genes, 50 significant pathways and five most
common molecular and cellular biofunctions were identified by IPA.
The five most common molecular and cellular biofunctions were
primarily associated with cell growth and proliferation (42 genes
were involved), intercellular signaling and interaction, cell
migration, gene expression and cell movement (Table III). There are nine common
significant pathways between KBD and OA including NF-κB, IL-6,
IL-10, apoptosis, death receptor, TWEAK, p38 MAPK, TNFR1 and TNFR2
signaling pathways (Table IV). In
additional, five most common networks of KBD and five of OA were
identified using IPA, including cell-to-cell signaling and
interaction, cellular movement, immune cell trafficking; cellular
development, cellular growth and proliferation, organ morphology;
lipid metabolism, molecular transport, small molecule biochemistry;
hematological disease, hereditary disorder, organism injury and
abnormalities; cancer, reproductive system disease and cell
morphology (Table V).
| Table III.Biological functions of genes
identified in PBMCs of KBD and OA patients compared with healthy
controlsa. |
Table III.
Biological functions of genes
identified in PBMCs of KBD and OA patients compared with healthy
controlsa.
| Function | Molecules | P-value range |
|---|
| KBD |
|
|
| Cell
death and survival | 29 |
2.67×10−71.43×10−2 |
| Lipid
metabolism | 12 |
6.55×10⁻⁷-1.43×10⁻² |
|
Molecular transport | 20 |
6.55×10⁻⁷-1.43×10⁻² |
| Small
molecule biochemistry | 15 |
6.55×10⁻⁷-1.43×10⁻² |
|
Cellular movement | 15 |
1.06×10⁻⁶-1.43×10⁻² |
| OA |
|
|
|
Cellular growth and
proliferation | 42 |
5.35×10⁻⁷-4.24×10⁻³ |
|
Cell-to-cell signaling and
interaction | 20 |
5.91×10⁻⁷-4.24×10⁻³ |
|
Cellular movement | 23 |
5.91×10⁻⁷-4.24×10⁻³ |
| Gene
expression | 26 |
1.24×10⁻⁶-4.24×10⁻³ |
|
Cellular development | 38 |
1.75×10⁻⁶-4.24×10⁻³ |
| Table IV.Nine common significantly canonical
pathways in PBMCs of KBD and OA patientsa. |
Table IV.
Nine common significantly canonical
pathways in PBMCs of KBD and OA patientsa.
|
|
| Genes regulated
(n) | P-value |
|---|
|
|
|
|
|
|---|
| Signaling
pathway | Genes in pathway
(n) | KBD | OA | KBD | OA |
|---|
| NF-κB | 164 | 5 | 3 |
1.58×10⁻³ |
3.25×10⁻² |
| IL-6 | 116 | 5 | 3 |
3.02×10⁻² |
1.32×10⁻² |
| IL-10 | 68 | 4 | 2 |
1.05×10⁻³ |
3.37×10⁻² |
| Apoptosis | 87 | 3 | 3 |
2.38×10⁻³ |
6.00×10⁻³ |
| Death receptor | 91 | 2 | 3 |
1.04×10⁻² |
6.80×10⁻³ |
| TWEAK | 33 | 3 | 3 |
5.00×10⁻³ |
3.64×10⁻⁴ |
| P38 MAPK | 115 | 3 | 4 |
1.24×10⁻³ |
1.44×10⁻³ |
| TNFR1 | 47 | 2 | 3 |
4.18×10⁻⁴ |
1.04×10⁻³ |
| TNFR2 | 28 | 3 | 2 |
2.10×10⁻² |
6.24×10⁻³ |
| Table V.Ingenuity pathway analysis of the
most common networks in KBD and OA. |
Table V.
Ingenuity pathway analysis of the
most common networks in KBD and OA.
| Pairs | Molecules in
network | Scorea | Molecules | Most common
functions |
|---|
| KBD |
|
| 1 | Ap1, BCR, ↑†BIRC3,
↑CAMP, caspase, ↑CCL3, ↑CCL4, CD3, ↑CD69, Cg, ↑CXCL1, ↑CXCL8,
↑DEFA1, Fcer1, Focal adhesion kinase, ↑GOS2, ↑GZMB, Hsp27, IgG,
ILL, ↑IL7, IL12, ↑IL1B, ↑IL1R2, Immunoglobulin, ↑IVL, Jnk, Mapk,
NFκB, ↑NFKBIA, Nr1h, PI3K, Pkc(s), ↑RUNX1T1, TCR | 28 | 16 | Cell-to-cell
signaling and interaction, cellular movement, immune cell
trafficking; |
| 2 | ↑ALK, ↑BDP1, ↓Cebp,
↓‡CELF1, ↓DYRK1A, ↑GMNM, ↓HBA1/HBA2, ↓HBB, ↑HBG1, ↓HGF, IL2, ↑IL10,
↑IRX5, ↑KLRC1, ↑KLRC2, ↑KRR1, ↑MAPK1, ↓MAPK8, ↑MCM6, ↑MTA2, ↑NR3C1,
↓PGK1, ↑PLK2, ↑PMS1, ↓PPP2R1A, ↑RBBP6, ↑RFC1, ↑S100P, ↑SMARCA4,
↑TNFAIP2, ↑TNFSF9, ↓TP53, ↓TPT1, ↓UBE2D1, ↑ZNF678 | 23 | 14 | Cellular
development, cellular growth and proliferation, organ
morphology |
| 3 | 26s Proteasome,
↑ADRBK2, Akt, ↓B2M, ↑CCL21, ↑CD1D, Creb, ↑EGR1, ERK, ERK1/2,
estrogen receptor, ↑FGF19, ↑FGF21, ↑GBA, ↑GRP, ↓HBB, Histone h3,
Histone h4, HNF4A, ↓HPSE, ↑KLB, ↓NPC1L1, P38 MAPK, PDGF BB,
PI3K(family), PTGFR, ↑PTPRC, RNA polymerase II, SHP, ↑SMG1, ↓SNCA,
↑TGFA, ↑TTAL1, Vegf, ↓ZFP36 | 11 | 8 | Lipid metabolism,
molecular transport, small molecule biochemistry |
| 4 | miR-146a-5p,
↑IL1F10 | 2 | 1 | Hematological
disease, hereditary disorder, organismal injury and
abnormalities |
| 5 | NUPR1,
↑TCEANC2 | 2 | 1 | Cancer,
reproductive system disease, cell morphology |
| OA |
|
| 1 | ↑AP3M1, ↑AKAP17A,
↑BCDIN3D, CXXC4, C19orf70, CCDC71, EVX1, EZH2, ↑FRYL, ↑GPR18,
↑HIST2H2BE, ↑HCP5, ↑HIST1H3H, HLX, ↑H3F3A/H3F3B, ↑LCMT2, MAD2L2,
MT1A, ↑PTPN4, PARP10, ↑PSMC6, ↑PLEKHF1, P2RY6, ↑PELO, PRG2,
↑RF2BP2, ↑RAB22A, RB1, SATB1, ↑SIAH1, TSPY1, UBC, VRK1, ↑ZNF217,
↑ZNF564 | 41 | 19 | Cellular assembly
and organization, cellular function and maintenance, cardiovascular
system development and function |
| 2 | 26s Proteasome,
↑ABCA7, ↑BIRC3, ↑caspase, Cytokine, cytochrome C, ↑CASP3, ↑CDKN2D,
Calcineurin protein, ↑Hsp70, Hsp90, HDL, Hdac, ↑HSPA1A/HSPA1B,
Interferon alpha, Ifn gamma, ↑Ikb, IKK, Jnk, ↑NFE2L2, NfkB-RelA,
NFκB, ↑NFKBIA, ↑Proinflammatory Sod, PRKAA, ↑PPM1B, RAB4, ↑RABEP1,
↑TINF2, ↑TGFBR3, TCR, Tlr, U biqutin, ↑UBE2L3 | 23 | 16 | Cell death and
survival, renal necrosis/cell death, post-translational
modification |
| 3 | Adaptor protein 2,
↑Atf, ↑ATHL1, ↑CSRNP1, CHRM4, Ck2, ↑CX3CR1, CCKAR, CARTPT, ↑DUB,
GCHFR, H35, hydroquinone, hemoglobin, Ifi47, ↑IL1B, IL26, IL37,
Icam, KLK1, mi-R-3065-3p, mir-375, ↑MAX, ↑NBPF10, ↑OSM, Proinsulin,
RPAD, RNA polymerase II, ↑TM2D3, ↑USP24, ↑USP36, UCN3, USP33,
USP50 | 18 | 12 | Endocrine system
development and function, molecular transport, small molecule
biochemistry |
| 4 | Ap1, Alp, Akt,
↑ATF4, ↑ADRB, Alpha catenin, ADCY, Cg, CaMKII, ↑CSE1L, Collagen(s),
Collagen type IV, Collagen type I,Cbp/p300, ↑Creb, ↑EGR1,
Fibrinogen, Growth hormone, Hsp27, ↑IL1, Importin alpha, Lamnin,
Lh, ↑LIMS1, Mek, ↑MPL, Mapk, Notch, PP2A, ↑PPP1R15A, PDGFBB, Pdgf,
↑SRSF5, ↑ RNMT, ↑VCL | 16 | 12 | Cell morphology,
tissue morphology, hematological system development and
function |
| 5 | ADRA1D, ADAM21,
ADRA1A, ADRA2C, ADCY2, AIFM3, ARF4, ARRDC3, ARF4, CACNA1H, CNNM3,
CHRM2, CRYGS, DCY3, ELAVL1, ↑FAM117B, ↑FAM43A, GPRC5B, ↑KCNJ2,
↑LFNG, ↑LEPROT, mi-149-3p, miR-96-5p, miR-92-3p, miR-296-5p, NUP93,
↑P2RY13, ↑PVRIG, ↑PLAGL2, PRDX5, RAB8A, ↑RSBN1, RGS17, SLC12A5,
STARD3, TMX1 | 16 | 9 | Respiratory
disease, inflammatory disease, cardiac arrhythmia |
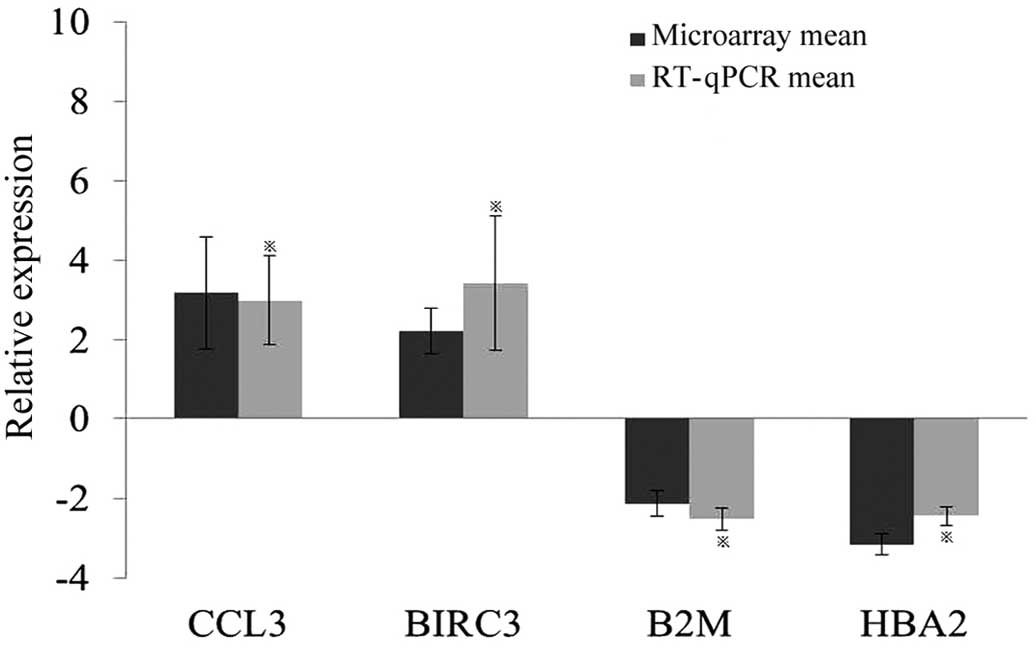
RT-qPCR verification
To validate the microarray data, four differentially
expressed genes were selected for RT-qPCR analysis using PBMC
samples from an additional 10 KBD patients. The expression levels
of BIRC3, CCL3, B2M and HBA2, in the PBMCs of KBD patients were
shown to be significantly different from the normal controls
(Fig. 1). Notably, the changes were
consistent with those indicated by the microarray data.
Discussion
In the present study, five differentially expressed
genes and nine significant pathways in common between KBD and OA
were identified, which may prove useful for investigating the early
diagnosis and pathogenesis of each condition. Compared with
cartilage, peripheral blood is easier to collect and results in
reduced wounding. In addition, peripheral blood may respond to
rapidly to changes in disease status (8). Therefore, differentially expressed
genes in the peripheral blood may be useful results for improving
the early diagnosis of KBD.
The present study identified five genes that were
recurrently differentially expressed in the peripheral blood of
patients with KBD and OA. BIRC3 is a member of BIRC family,
apoptosis regulation is among the most important functions of their
encoded proteins (16,17). Furthermore, BIRC2, BIRC3 and TRAF2
have been identified as critical genes for the activation of NF-κB
signaling in TNF pathway (18). In
the present study, BIRC3 was significantly upregulated in KBD and
OA compared with control, suggesting that BIRC3 may be a critical
gene involved in NF-κB signaling.
The protein encoded by EGR1 is a type of C2H2 zinc
finger of the EGR family, primary functions of which involve
transcriptional regulation (19).
EGR1 is able to activate the expression of TGF-β, which has been
associated with the proliferation and differentiation of
chondrocyte (19). It has been
observed that EGR1 is upregulated in the synovial cells of patients
with rheumatoid arthritis (RA) (20), but downregulated in chondrocytes of
OA patients (21). However, in the
present study, EGR1 was upregulated in the peripheral blood of KBD
and OA patients. Therefore, this gene may play a role in the
etiology of KBD; however, further studies involving chondrocytes
may be required to assess whether EGR1 could be a biomarker of
KBD.
Inflammation as manifested in OA and RA has not been
observed in KBD to date; however, associated genes such as CXCL8
and IL-1β were identified as being differential expressed commonly
in OA and KBD in the present study. Chemokine CXCL8 is involved in
decomposition pathway of cartilage extracellular matrix, and IL-1β
may cause cartilage damage by inducing the decomposition of
extracellular matrix (22–25). These genes showed dysregulated
expression in the serum and synovial fluid of patients with OA and
rheumatic arthritis (26). According
to the IPA analyses, inflammation associated pathways such as IL-6
and IL-10 were identified in the peripheral blood of KBD and OA
patients, indicating that inflammatory change occurs in the
peripheral blood of KBD in degree I or advanced patients. These
findings require further study to verify whether there is similar
inflammatory change in the peripheral blood and cartilage of KBD in
the early stage.
There were 82 differentially expressed genes and 51
significant pathways identified in KBD, while 89 differentially
expressed genes and 50 significant pathways were identified in OA.
Among these pathways, nine significant pathways were found to be
common between KBD and OA, including NF-κB, IL-6, IL-10, apoptosis,
death receptor etc., as described in the results. The NF-κB
signaling pathway consists of numerous types of transcription
factors which specifically bind to the enhancer κB on κ light chain
of immunoglobulin (27). NF-κB
transcription factor has an important role in the cell response to
damage, stress and inflammation (27). In addition, it has been associated
with tissue damage, stress, cell differentiation and apoptosis
(27–29). The pathological activation of NF-κB
signaling pathway is involved in various inflammatory and rheumatic
diseases, including OA and RA (30).
NF-κB1 and RelA proteins were observed to be significantly
increased in the cells of OA synovium (31). A previous animal study indicated that
NF-κB and ERK1/2 of MAPK participate in reducing the expression of
collagen type II while promoting the expression of TNF-α protein
gene in prechondroblasts and articular chondrocytes (32). Furthermore, during OA pathogenesis,
NF-κB signaling pathway was shown to be significant in maintaining
the normal physiological conditions of chondrocytes, mRNA and
protein expression patterns, and the metabolic balance of cartilage
matrix (31). Consequently, it may
be considered to be a critical pathway for the etiological study
and targeted therapeutic investigation of KBD and OA.
Apoptosis is programmed death under physiological or
pathological conditions in which a series of mechanisms have been
enacted by multiple signal transmissions (33). In recent years, chondrocyte apoptosis
has been demonstrated to be crucial in cartilage matrix degradation
and in the inhibition of matrix synthesis during the articular
cartilage degradation process of OA (34). Chondrocyte apoptosis has been
detected in the middle layer of articular cartilage of KBD and
significantly decreased number of chondrocyte in infant patients,
and notably decreased synthesis of collagenase type II, which may
induce excessive apoptosis of chondrocytes (34–36). In
the present study, the apoptosis signaling pathway was the common
different signaling pathway in PBMCs from patients with KBD and OA,
and the apoptosis signaling pathway was identified in the
differentially expressed genes in PBMCs of infant KBD patients
using performed IPA analysis (unpublished). Therefore, the cell
apoptosis was identified in the cartilage, the target organ of KBD,
in addition to the PBMCs.
In conclusion, nine signaling pathways and five
differentially expressed genes were screened using IPA analysis,
which were common between peripheral blood of KBD and OA patients.
NF-κB and apoptosis may be critical signaling pathways of KBD in
etiology investigation. Furthermore, changes in the IL-6 and IL-10
pathways suggest that there may be inflammatory reaction in the
peripheral blood of patients KBD, which may indicate a diagnosis of
KBD in the early stages of the disease.
Acknowledgements
This study was supported by the National Natural
Science Foundation of China (grant no. 81472924 and 81620108026).
The authors thank the Disease Control Center of Yong-shou and
Lin-you counties for support in the collection of blood from
subjects. The authors thank Ms. Shulan He, Miss Chunyan Li, Ms. Pan
Wang and Ms. Yan Wen for assistance with laboratory
experiments.
References
|
1
|
Duan C, Guo XO, Zhang XD, Yu HJ, Yan H,
Gao Y, Ma WJ, Gao ZQ, Xu P and Lammi M: Comparative analysis of
gene expression profiles between primary knee osteoarthritis and an
osteoarthritis endemic to northwestern china, Kashin-beck disease.
Arthritis Rheum. 62:771–780. 2010. View Article : Google Scholar : PubMed/NCBI
|
|
2
|
Hinsenkamp M: Kashin-Beck disease.
International Orthopaedics. 25:133. 2001. View Article : Google Scholar : PubMed/NCBI
|
|
3
|
Wang SJ, Guo X, Zuo H, Zhang YG, Xu P,
Ping ZG, Zhang Z and Geng D: Chondrocyte apoptosis and expression
of Bcl-2, Bax, Fas and iNOS in articular cartilage in patients with
Kashin-Beck disease. J Rheumatol. 33:615–619. 2006.PubMed/NCBI
|
|
4
|
Fang H, Guo X, Farooq U, Xia C and Dong R:
Development and validation of a quality of life instrument for
Kashin-Beck disease: An endemic osteoarthritis in China.
Osteoarthritis Cartilage. 20:630–637. 2012. View Article : Google Scholar : PubMed/NCBI
|
|
5
|
Guo X, Ma WJ, Zhang F, Ren FL, Qu CJ and
Lammi MJ: Recent advances in the research of an endemic
osteochondropathy in China: Kashin-Beck disease. Osteoarthritis
Cartilage. 22:1774–1783. 2014. View Article : Google Scholar : PubMed/NCBI
|
|
6
|
Ministry of Health of the P.R China, . The
standard of Medicine sanitary in P.R China-Diagnosis of Kashin-Beck
disease [WS/T 207–2010]. http://www.moh.gov.cn/zwgkzt/s9500/201006/47920.shtmlAccessed
June 25, 2015.
|
|
7
|
Wang S, Guo X, Wu XM and Lammi MJ:
Genome-wide gene expression analysis suggests an important role of
suppressed immunity in pathogenesis of Kashin-Beck disease. Plos
One. 7:e284392012. View Article : Google Scholar : PubMed/NCBI
|
|
8
|
Ma J and Liew CC: Gene profiling
identifies secreted protein transcripts from peripheral blood cells
in coronary artery disease. J Mol Cell Cardiol. 35:993–998. 2003.
View Article : Google Scholar : PubMed/NCBI
|
|
9
|
Barnes MG, Aronow BJ, Luyrink LK, Moroldo
MB, Pavlidis P, Passo MH, Grom AA, Hirsch R, Giannini EH, Colbert
RA, et al: Gene expression in juvenile arthritis and
spondyloarthropathy: Pro-angiogenic ELR+ chemokine genes relate to
course of arthritis. Rheumatology (Oxford). 43:973–979. 2004.
View Article : Google Scholar : PubMed/NCBI
|
|
10
|
Niimoto T, Nakasa T, Ishikawa M, Okuhara
A, Izumi B, Deie M, Suzuki O, Adachi N and Ochi M: MicroRNA-146a
expresses in interleukin-17 producing T cells in rheumatoid
arthritis patients. Bmc Musculoskeletal Disord. 11:2092010.
View Article : Google Scholar
|
|
11
|
Prasad NB, Somervell H, Tufano RP, Dackiw
AP, Marohn MR, Califano JA, Wang Y, Westra WH, Clark DP, Umbricht
CB, et al: Identification of genes differentially expressed in
benign versus malignant thyroid tumors. Clinical Cancer Res.
14:3327–3337. 2008. View Article : Google Scholar
|
|
12
|
Ramos YF, Bos SD, Lakenberg N, Böhringer
S, den Hollander WJ, Kloppenburg M, Slagboom PE and Meulenbelt I:
Genes expressed in blood link osteoarthritis with apoptotic
pathways. Ann Rheum Dis. 73:1844–1853. 2014. View Article : Google Scholar : PubMed/NCBI
|
|
13
|
Wang WZ, Guo X, Duan C, Ma WJ, Zhang YG,
Xu P, Gao ZQ, Wang ZF, Yan H, Zhang YF, et al: Comparative analysis
of gene expression profiles between the normal human cartilage and
the one with endemic osteoarthritis. Osteoarthritis Cartilage.
17:83–90. 2009. View Article : Google Scholar : PubMed/NCBI
|
|
14
|
China MoPHo China Health Statistics
Yearbook. 2012.57:2013.
|
|
15
|
Tusher VG, Tibshirani R and Chu G:
Significance analysis of microarrays applied to the ionizing
radiation response. Proc Natl Acad Sci USA. 98:5116–5121. 2001.
View Article : Google Scholar : PubMed/NCBI
|
|
16
|
Gyrd-Hansen M and Meier P: IAPs: From
caspase inhibitors to modulators of NF-kappaB, inflammation and
cancer. Nat Rev Cancer. 10:561–574. 2010. View Article : Google Scholar : PubMed/NCBI
|
|
17
|
Tan BM, Zammit NW, Yam AO, Slattery R,
Walters SN, Malle E and Grey ST: Baculoviral inhibitors of
apoptosis repeat containing (BIRC) proteins fine-tune TNF-induced
nuclear factor κB and c-Jun N-terminal kinase signalling in mouse
pancreatic beta cells. Diabetologia. 56:520–532. 2013. View Article : Google Scholar : PubMed/NCBI
|
|
18
|
Rothe M, Pan MG, Henzel WJ, Ayres TM and
Goeddel DV: The TNFR2-TRAF signaling complex contains two novel
proteins related to baculoviral-inhibitor of apoptosis proteins.
Cell. 83:1243–1252. 1995. View Article : Google Scholar : PubMed/NCBI
|
|
19
|
Swirnoff AH and Milbrandt J: DNA-binding
specificity of NGFI-A and related zinc-finger transcription
factors. Mol Cell Biol. 15:2275–2287. 1995. View Article : Google Scholar : PubMed/NCBI
|
|
20
|
Aicher WK, Heer AH, Trabandt A, Bridges SL
Jr, Schroeder HW Jr, Stransky G, Gay RE, Eibel H, Peter HH and
Siebenlist U: Overexpression of zinc-finger transcription factor
Z-225/Egr-1 in synoviocytes from rheumatoid-arthritis patients. J
Immunol. 152:5940–5948. 1994.PubMed/NCBI
|
|
21
|
Wang FL, Connor JR, Dodds RA, James IE,
Kumar S, Zou C, Lark MW, Gowen M and Nuttall ME: Differential
expression of egr-1 in osteoarthritic compared to normal adult
human articular cartilage. Osteoarthritis Cartilage. 8:161–169.
2000. View Article : Google Scholar : PubMed/NCBI
|
|
22
|
Assirelli E, Pulsatelli L, Dolzani P,
Platano D, Olivotto E, Filardo G, Trisolino G, Facchini A, Borzì RM
and Meliconi R: Human osteoarthritic cartilage shows reduced in
vivo expression of IL-4, a chondroprotective cytokine that
differentially modulates IL-1β-stimulated production of chemokines
and matrix-degrading enzymes in vitro. Plos One. 9:e969252014.
View Article : Google Scholar : PubMed/NCBI
|
|
23
|
Fernandes JC, Martel-Pelletier J and
Pelletier JP: The role of cytokines in osteoarthritis
pathophysiology. Biorheology. 39:237–246. 2002.PubMed/NCBI
|
|
24
|
Kapoor M, Martel-Pelletier J, Lajeunesse
D, Pelletier JP and Fahmi H: Role of proinflammatory cytokines in
the pathophysiology of osteoarthritis. Nat Rev Rheumatol. 7:33–42.
2011. View Article : Google Scholar : PubMed/NCBI
|
|
25
|
Burguera EF, Vela-Anero A, Magalhães J,
Meijide-Failde R and Blanco FJ: Effect of hydrogen sulfide sources
on inflammation and catabolic markers on interleukin 1β-stimulated
human articular chondrocytes. Osteoarthritis Cartilage.
22:1026–1035. 2014. View Article : Google Scholar : PubMed/NCBI
|
|
26
|
Borzì RM, Mazzetti I, Marcu KB and
Facchini A: Chemokines in cartilage degradation. Clin Orthop Relat
Res. (Suppl 427). S53–S61. 2004. View Article : Google Scholar : PubMed/NCBI
|
|
27
|
Hayden MS and Ghosh S: Shared principles
in NF-kappaB signaling. Cell. 132:344–362. 2008. View Article : Google Scholar : PubMed/NCBI
|
|
28
|
Tilstra JS, Clauson CL, Niedernhofer LJ
and Robbins PD: NF-kappaB in aging and disease. Aging Dis.
2:449–465. 2011.PubMed/NCBI
|
|
29
|
Niedernhofer LJ and Robbins PD: Signaling
mechanisms involved in the response to genotoxic stress and
regulating lifespan. Int J Biochem Cell Biol. 40:176–180. 2008.
View Article : Google Scholar : PubMed/NCBI
|
|
30
|
Karin M, Cao Y, Greten FR and Li ZW:
NF-kappaB in cancer: From innocent bystander to major culprit. Nat
Rev Cancer. 2:301–310. 2002. View
Article : Google Scholar : PubMed/NCBI
|
|
31
|
Beg AA, Sha WC, Bronson RT, Ghosh S and
Baltimore D: Embryonic lethality and liver degeneration in mice
lacking the rela component of Nf-Kappa-B. Nature. 376:167–170.
1995. View
Article : Google Scholar : PubMed/NCBI
|
|
32
|
Pulai JI, Chen H, Im HJ, Kumar S, Hanning
C, Hegde PS and Loeser RF: NF-kappa B mediates the stimulation of
cytokine and chemokine expression by human articular chondrocytes
in response to fibronectin fragments. J Immunol. 174:5781–5788.
2005. View Article : Google Scholar : PubMed/NCBI
|
|
33
|
Nicholson DW and Thornberry NA: Caspases:
Killer proteases. Trends Biochem Sci. 22:299–306. 1997. View Article : Google Scholar : PubMed/NCBI
|
|
34
|
Roach HI, Erenpreisa J and Aigner T:
Osteogenic differentiation of hypertrophic chondrocytes involves
asymmetric cell divisions and apoptosis. J Cell Biol. 131:483–494.
1995. View Article : Google Scholar : PubMed/NCBI
|
|
35
|
Heraud F, Heraud A and Harmand MF:
Apoptosis in normal and osteoarthritic human articular cartilage.
Ann Rheum Dis. 59:959–965. 2000. View Article : Google Scholar : PubMed/NCBI
|
|
36
|
Hashimoto S, Ochs RL, Komiya S and Lotz M:
Linkage of chondrocyte apoptosis and cartilage degradation in human
osteoarthritis. Arthritis Rheum. 41:1632–1638. 1998. View Article : Google Scholar : PubMed/NCBI
|