Hepatocellular carcinoma (HCC) is a malignant tumor
that has become the third leading cause of cancer-associated cases
of mortality (1). Sorafenib, an oral
multitarget tyrosine kinase inhibitor, targets various molecular
mechanisms, including tumor growth and angiogenesis (2). It is the only systemic therapy drug for
HCC that is approved by the USA Food and Drug Administration and as
such has been applied in the clinic extensively (3). The clinical efficacy of sorafenib is
limited and patients face poor prognosis; no difference in
recurrence-free survival between sorafenib and a placebo-controlled
group has been reported (4).
Furthermore, time-to-tumor progression and overall survival were
not observed to be different for patients treated with
transarterial chemoembolization (TACE) in conjunction with
sorafenib over the TACE placebo group in a stent-protected
angioplasty vs. carotid endarterectomy trial (5). Several potential mechanisms of
sorafenib resistance were proposed. The processes of
epithelial-mesenchymal transition (EMT) and mesenchymal-epithelial
transition, along with critical growth factors and signaling
pathways, exhibit an impact on sorafenib resistance, including
activation of the phosphatidylinositol 3-kinase/Akt signaling
pathway (6). Additionally, cancer
stem cells (CSCs) and CSC-like cells, which retain strong
proliferation ability, multi-directional differentiation capacity
and high drug-resistance properties, may not be completely cleared
by sorafenib but differentiate and develop into novel cancer
tissues, resulting in the metastasis and recurrence of HCC
(6). Biological processes involved
in tumor microenvironment, inflammation, fibrosis, angiogenesis,
hypoxia, autophagy, viral reactivation and oxidative stress may
serve a pivotal role in the resistance to sorafenib (6). However, the resistance mechanisms for
sorafenib remain unclear and novel research may provide insight
into the discovery of an effective treatment or personalized
therapy for advanced HCC.
High-throughput microarray technology has been
widely used to analyze the gene expression data of various cancer
types (7). It has been a promising
method to screen for potential biomarkers in tumor diagnosis and
pathways involved in tumorigenesis and drug resistance (7–9). In the
current study, microarray data for GSE73571 facilitated the
investigation of differentially expressed genes (DEGs) in
sorafenib-sensitive and sorafenib-resistant tumors. Gene ontology
(GO) and Kyoto Encyclopedia of Genes and Genomes (KEGG) analysis
were performed and a protein-protein interaction (PPI) network was
constructed, identifying hub genes. The bioinformatics analysis of
crucial genes or pathways in sorafenib-resistant HCC revealed
potential strategies for improving clinical efficacy.
Gene expression profile data (GSE73571) were
obtained from Gene Expression Omnibus (GEO, http://www.ncbi.nlm.nih.gov/geo). Four
sorafenib-acquired resistant HCC and three sorafenib-sensitive
phenotypes were included. The array data were acquired from
Affymetrix Human Gene 1.0 ST Array [GPL6244; transcript (gene)
version].
GO enrichment and KEGG pathway analysis of the
screened DEGs was performed using the Database of Annotation
Visualization and Integrated Discovery (DAVID; http://david.abcc.ncifcrf.gov/). DAVID contains a
series of functional annotation programs to explore abundant
biological messages of genes and information mapped in DAVID was
important for the completion of high-throughput gene functional
analysis (11). P<0.05 was
considered to indicate a statistically significant difference
(12).
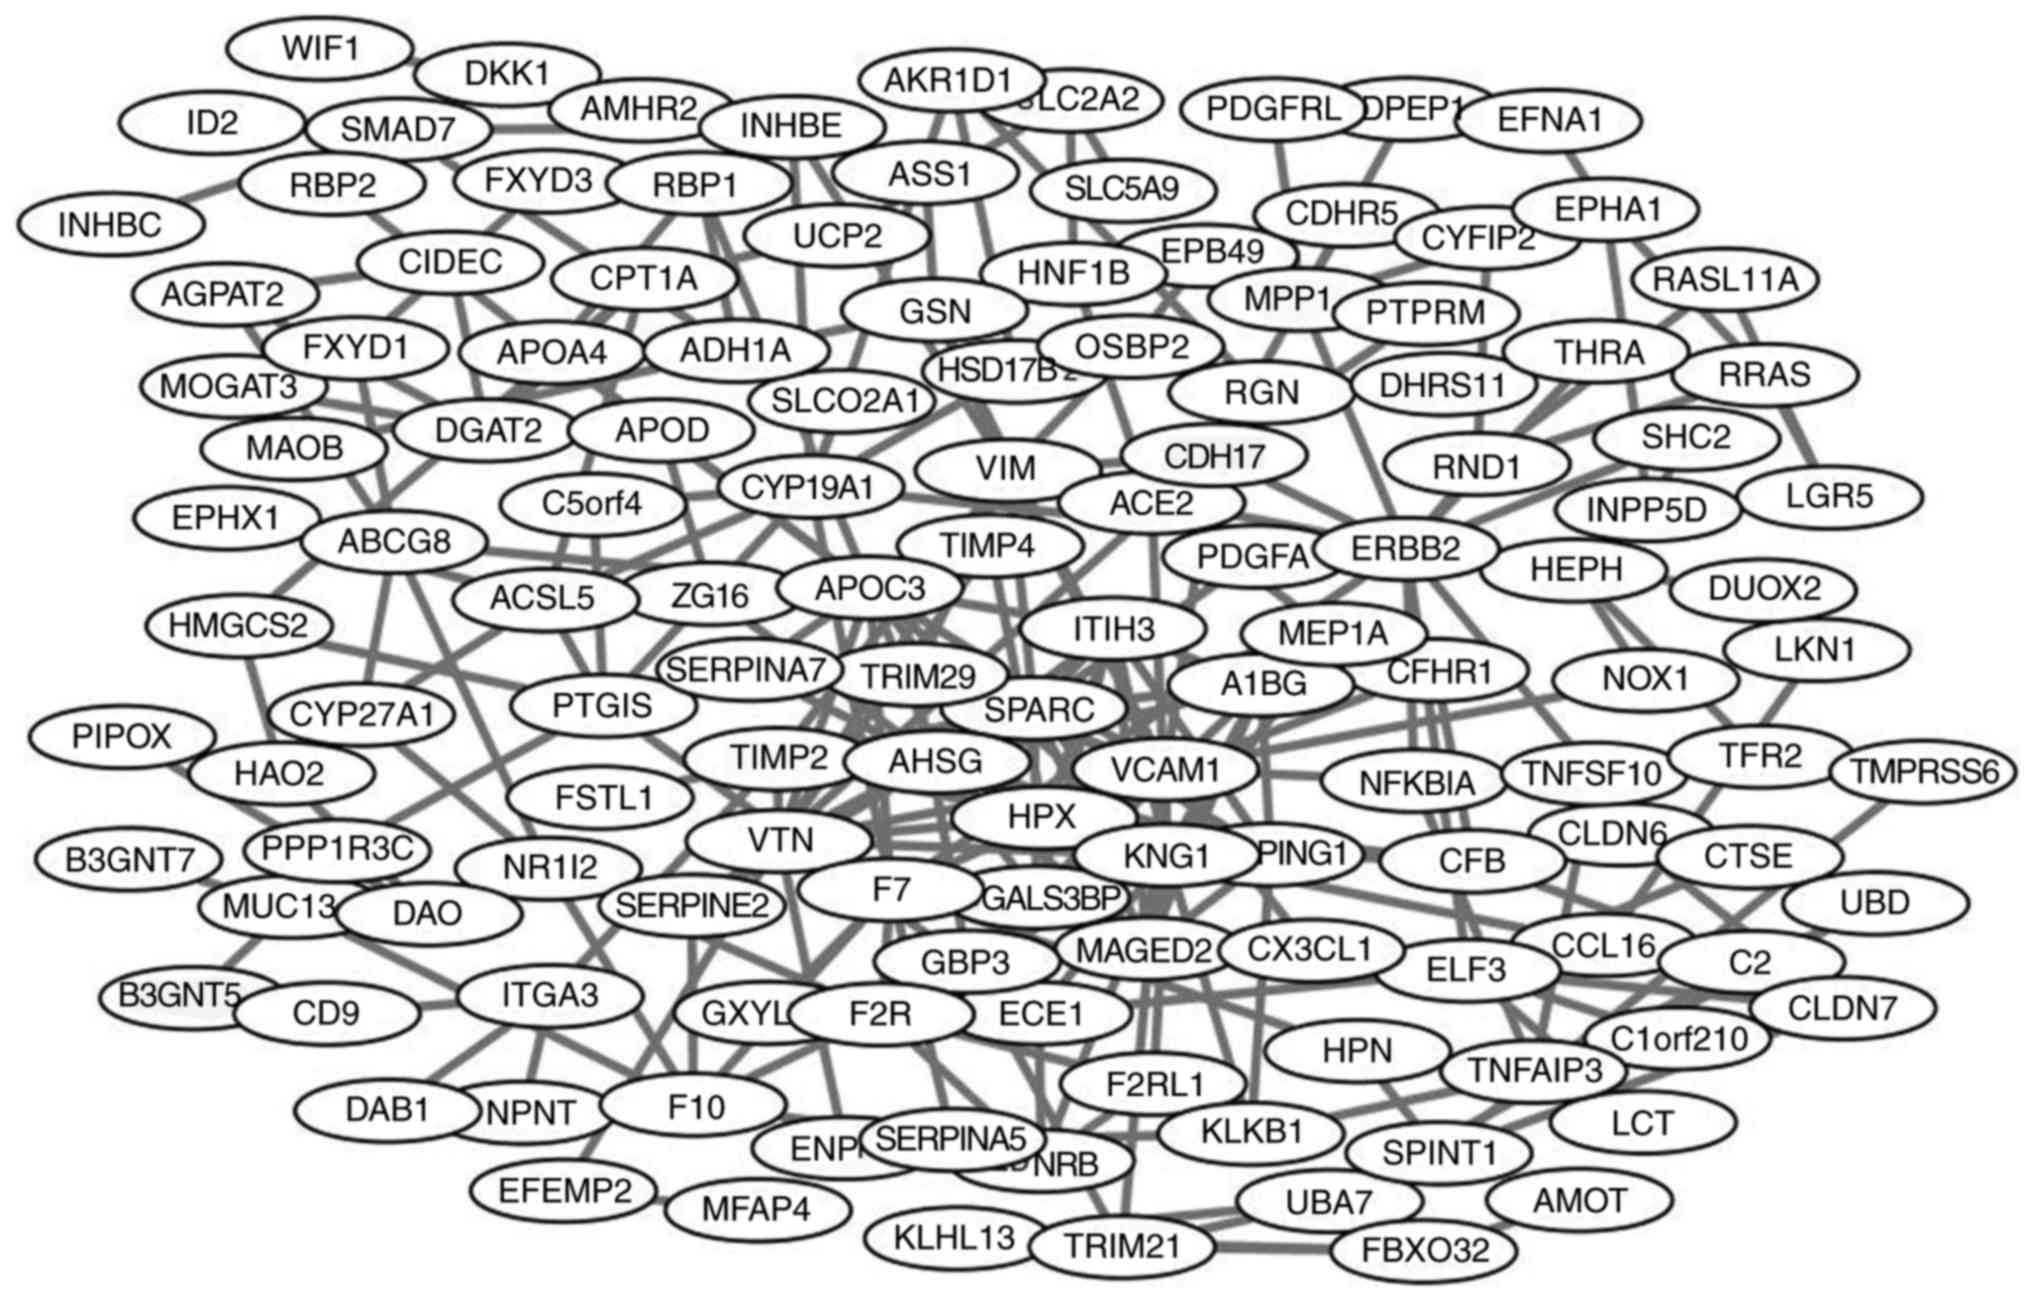
PPI network analysis was performed using the Search
Tool for the Retrieval of Interacting Genes (STRING; http://string-db.org/). STRING provides information
associated with predicted and proven interactions between large
numbers of proteins. Identified DEGs were imported into STRING.
Genes with a combined score of >0.4 were identified as
significant. The PPI network was built using Cytoscape (http://www.cytoscape.org/). In addition, higher-degree
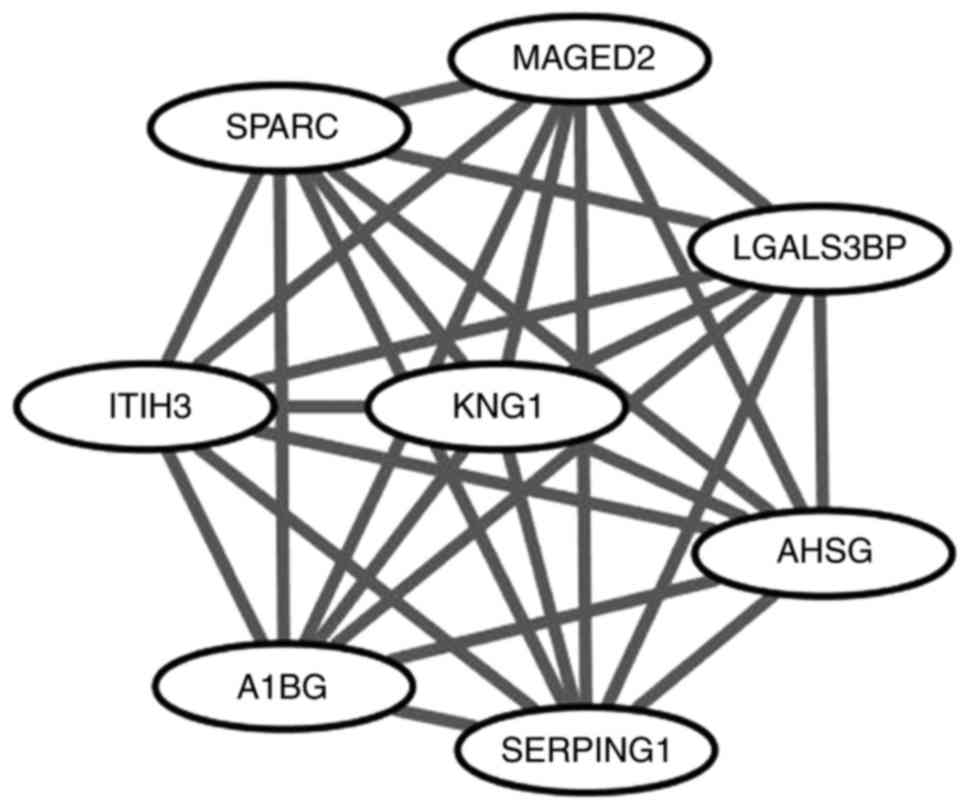
nodes were regarded as hub nodes (12). Sub-modules of the PPI network were
analyzed by Molecular Complex Detection (MCODE; Version 1.4.2; by
Bader Lab, department of Biochemistry, University of Toronto;
Toronto, Canada) (13), with the
criteria set as follows: number of nodes >4 and MCODE score
>3. GO enrichment and KEGG pathway analysis of DEGs of the sub
modules was finished by DAVID.
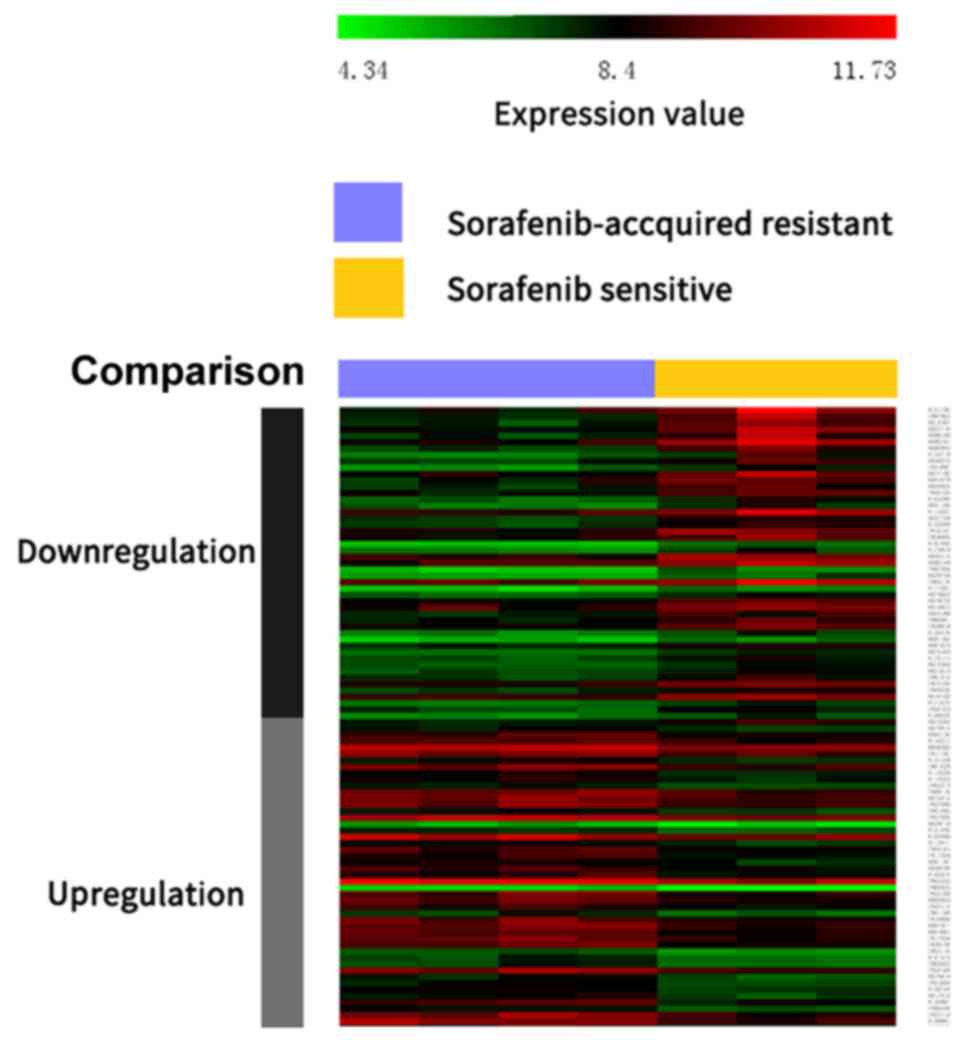
According to the cut-off criteria (P<0.05 and
|log2FC|≥2), a total of 1,319 DEGs from sorafenib-resistant and
sorafenib-sensitive specimens were identified, with 593 up- and 726
downregulated genes. A heat map of the top 50 up- and downregulated
DEGs is presented in Fig. 1.
GO enrichment analysis was performed by DAVID. GO
biological processes analysis revealed that upregulated DEGs were
associated with negative regulation of endopeptidase activity,
cholesterol homeostasis and fibrinolysis and downregulated DEGs
were associated with DNA replication and repair (Table I). For molecular function,
upregulated genes were enriched in collagen and receptor binding
and serine-type endopeptidase activity, while downregulated genes
were enriched in poly(A) RNA binding, helicase activity and ATP
binding. Additionally, GO cell component analysis revealed that
upregulated genes were primarily located in the extracellular
space, extracellular exosome and extracellular region and the
location of downregulated DEGs was primarily in nucleolus,
nucleoplasm and centrosome.
To gain a deeper understanding of significant DEGs,
a pathway enrichment analysis was performed. As presented in
Table II, upregulated genes were
enriched in pathways of coagulation cascades, insulin resistance
and metabolic pathways, while downregulated DEGs were significantly
associated with pathways of RNA transport and cell cycle.
In the present study, gene expression data of
GSE73571 were extracted from the GEO database. Four
sorafenib-resistant and three sorafenib-sensitive HCC samples were
selected for analysis. A total of 593 downregulated and 726
upregulated DEGs were identified among the sorafenib-sensitive and
sorafenib-resistant phenotypes with HCC. Function annotation
revealed that these DEGs were primarily associated with complement
and coagulation cascades, DNA replication, synthesis and repair.
PPI network analysis suggested that eight hub genes exhibited
higher degrees of interaction, which may describe new targets in
sorafenib resistance.
GO term analysis reveled that upregulated DEGs were
primarily associated with negative regulation of endopeptidase
activity, cholesterol homeostasis and fibrinolysis. Peptidases are
crucial in tumor formation and development in various ways,
including regulating the process of neoplastic growth, as adhesion
molecules, through involvement in intracellular signaling and
extracellular matrix degradation (14). Various studies indicated that the
expression of various peptidases, including circulating
aminopeptidase N/CD13, varies among cancer types at different
stages (15–18). Cholesterol metabolites are related to
the development of various cancers (19,20).
Management of cholesterol homeostasis may lead to lower risks of
non-Hodgkin lymphoma, melanoma, breast and endometrial cancers
(21–23). The fibrinolytic system was verified
to promote tumor growth and it may be involved in apoptosis
inhibition, angiogenesis, cell proliferation and extracellular
matrix (24,25). Downregulated DEGs were primarily
involved in DNA replication and repair. DNA replication and repair
may be involved in the development of certain types of cancer, by
regulating the cell cycle, angiogenesis, cell differentiation and
cell signaling (26–29). Additionally, KEGG pathway analysis of
upregulated genes revealed involvement in complement and
coagulation cascades, insulin resistance and metabolic pathways.
KEGG pathway analysis of downregulated DEGs exhibited participation
in RNA transport and cell cycle. A previous study reported that
constituents of the coagulation cascade could affect cancer
progression (30) and the complement
and coagulation cascade pathway enrichment in colorectal cancer
(CRC) and HCC has been described (31,32).
Poor glycemic control is a prognostic element in patients with HCC
and diabetes (33) and insulin
resistance is considered as a risk factor in HCC development
(34). Metabolic pathways, cell
cycle and RNA transport have been associated with carcinogenesis,
cancer cell survival and growth (35–37).
Therefore, the identification of the above mentioned pathways may
lead to novel prognostic and therapeutic methods in HCC and
sorafenib-resistant HCC.
In the present study, the following eight hub genes
were identified through PPI network construction and analysis:
KNG1, VCAM1, APOC3, AHSG, ERBB2, SPARC, VTN and VIM. KNG1, a
cysteine proteinase inhibitor, exhibited the highest degree of
connectivity in the PPI network. It participates in blood
coagulation, inflammatory response, apoptosis regulation and the
prevention process of metastasis in cancer cells (38,39).
KNG1 is overexpressed in CRC and HCC (40) and is regarded as a potential
prognostic marker for CRC, as patients with increased KNG1
expression exhibit decreased survival rates when compared with
lower KNG1 expression patients (39,41).
Additional studies reported that KNG1 may be involved in
cholesterol and lipoprotein metabolism disturbance and take part in
the complex interplay between the hemostatic system and immune
response in hepatitis C virus (HCV)-associated HCC (39,40).
Differences in KNG1 expression were observed among patients with
multidrug-resistant and drug-sensitive tuberculosis and healthy
control patients, and it is suspected that blood coagulation serves
a role in the resistant ability of KNG1 (42).
The second hub gene is VCAM1, a mediator of
angiogenesis, which serves a critical function in endothelium
development during angiogenesis (43,44). It
promotes cancer cell adhesion to the endothelium and is associated
with immune and inflammatory responses of tumors (45). High VCAM1 serum levels have been
reported for various cancer types, including HCC, chronic liver
disease, breast cancer and CRC, and VCAM1 is considered a potential
predictor for cancer prognosis (46–50). The
amount of VCAM1 in the serum is dependent on tumor stage and
neoplasm metastasis (51). VCAM1
expression decreased following carboplatin intervention in mice
with platinum-sensitive ovarian cancer, while high-level expression
was maintained in mice with platinum-resistant tumors (52). VCAM1 has been recognized as a
response monitor in the treatment of ovarian cancer and as a
molecular biomarker in chemotherapy-associated sensitivity, which
allows for earlier alterations in treatment decisions (52).
APOC3, the third hub gene, is expressed in the liver
and participates in very low-density lipoprotein (VLDL)
triglyceride (TG) metabolism by inhibiting VLDL-TG clearance in
vivo and promoting absorption of intestinal TG and VLDL-TG
production (53). APOC3 polymorphism
is considered to be an independent risk factor of
hepatocarcinogenesis and HCC development in patients with chronic
hepatitis B (54). It was suggested
that APOC3 may be involved in HCC familial aggregation in China
(55). There is no evidence
indicating an association between APOC3 and sorafenib or other drug
resistance, making it a potential target for further research.
AHSG, a serum glycoprotein, is produced by
hepatocytes and is involved in several metabolic disorders,
including non-alcoholic fatty liver disease (56,57),
genesis of diabetes (58) and
metabolic syndrome (59). It is
significantly increased in HCC when compared with normal patients.
AHSG is also an important biomarker of recent mortality in liver
cirrhosis and liver cancer patients (60). AHSG is associated with cancer
progression through regulation of the transforming growth factor-β
signaling pathway (61,62). In the present study, dysregulation of
AHSG was observed, which is in accordance with a previous study
describing that the upregulation of AHSG in HCC drug-resistant cell
lines may be a predictor for HCC with chemotherapeutic drug
resistance (63). The levels of AHSG
and five other selected serum biomarkers were proposed to predict
resistance to neoadjuvant chemotherapy in breast cancers (64). The differences in complement system
and LDL oxidation may contribute to this phenomenon (64).
Another hub gene, ERBB2, encodes for a receptor
tyrosine kinase, a member of the epidermal growth factor receptor
(EGFR) family, and is involved in fixation and propagation of
oncogene mutations (65).
Comprehensive studies have demonstrated that increased ERBB2
expression in breast and ovarian cancer is associated with poor
prognosis (66,67). ERBB2 was upregulated in the current
study and has been regarded as a potential critical regulator for
malignant transformations in early HCC (68). In specific studies on HCC, the
percentage of control cases expressing ErbB2 ranged from 0–30%
(69–72). ERBB2 expression level potentially
refers to different HCC stages (71,73).
Cetuximab and panitumumab, EGFR-targeted antibodies, are treatments
for metastatic CRC (74). The
amplification of ERBB2 contributes to the primary (de novo)
resistance to anti-EGFR treatment, the mechanism of which is
associated with the activation of the MEK-ERK cascade (74).
The other three identified hub genes in the current
study were SPARC, VTN and VIM. SPARC encodes a protein involved in
numerous biological processes, which are associated with various
cancer mechanisms, including development, cell apoptosis,
angiogenesis, cell differentiation, cell proliferation, cell
adhesion and migration (75,76). Lau et al (77) reported high SPARC expression in HCC
compared with non-tumorous liver. Elevated SPARC expression
promotes tumor aggressiveness of melanoma (78), glioblastoma (79) and prostate cancer (80). The association between high SPARC
mRNA expression and low pathological response rate in breast tumor
cells following neoadjuvant anthracycline treatment has been
confirmed (81). VTN, a
representative acute-phase glycoprotein, is expressed and secreted
by hepatocytes (82). Interactions
with integrins may enhance cell adhesion and the spread in serum
and extracellular matrix (82).
Increased VTN was described as a poor prognostic tool for patients
with HCC as it is a primary component of the stroma and accelerates
leucocyte accumulation (83) and
cell migration (84). VTN has an
adverse effect on HCC development in HCV-infected patients with
liver cirrhosis (85). Additionally,
VTN adhesion was previously suggested to contribute to drug
resistance in chemotherapy-treated myeloma cells through Notch
signaling activation (86). Elevated
VIM expression was observed in small size HCC (≤2 cm) (87). It has been suggested that the
circulating level of VIM may be more sensitive and specific
compared with AFP in detecting small tumors and VIM expression has
been recognized as a potential biomarker for HCC diagnosis
(87). VIM is overexpressed in CRC
cells with butyrate or histone deacetylase inhibitor resistance,
which is likely to mediate cell signaling/gene expression cascades
and to integrate the EMT process in drug-resistant CRC cells
(88).
The genes identified in the current study may be
associated with HCC genesis, development and prognosis and
potentially contribute to sorafenib resistance in HCC. Future
research into these genes may provide information on the mechanism
of sorafenib-resistant HCC and hold potential for novel therapeutic
methods for drug-resistant HCC.
In conclusion, a comprehensive bioinformatics
analysis of DEGs was performed, revealing genes that may be
involved in the biological process of sorafenib-resistant HCC. A
series of potential targets has been provided, which may be
considered for future exploration.
Not applicable.
The study was supported by the Scientific Research
Project of Medical Service of National Clinical Research Base of
Traditional Chinese Medicine of State Administration of Traditional
Chinese Medicine (grant no. JDZX2015173) and the National Natural
Science Foundation of China (grant no. 21675177).
Data and materials have been provided as part of the
submitted article.
HY, DH and ZC conceived the present study; WY, HL
and SL analyzed and interpreted chip data; DH, SL and HL drafted
the manuscript; and. HY and ZC revised the article. All authors
have given final approval of the version to be published.
Not applicable.
Not applicable.
The authors declare that they have no competing
interests.
|
1
|
Torre LA, Bray F, Siegel RL, Ferlay J,
Lortet-Tieulent J and Jemal A: Global cancer statistics, 2012. CA
Cancer J Clin. 65:87–108. 2015. View Article : Google Scholar : PubMed/NCBI
|
|
2
|
Le Grazie M, Biagini MR, Tarocchi M,
Polvani S and Galli A: Chemotherapy for hepatocellular carcinoma:
The present and the future. World J Hepatol. 9:907–920. 2017.
View Article : Google Scholar : PubMed/NCBI
|
|
3
|
Tovar V, Cornella H, Moeini A, Vidal S,
Hoshida Y, Sia D, Peix J, Cabellos L, Alsinet C, Torrecilla S, et
al: Tumour initiating cells and IGF/FGF signalling contribute to
sorafenib resistance in hepatocellular carcinoma. Gut. 66:530–540.
2017. View Article : Google Scholar : PubMed/NCBI
|
|
4
|
Bruix J, Takayama T, Mazzaferro V, Chau
GY, Yang J, Kudo M, Cai J, Poon RT, Han KH, Tak WY, et al: Adjuvant
sorafenib for hepatocellular carcinoma after resection or ablation
(STORM): A phase 3, randomised, double-blind, placebo-controlled
trial. Lancet Oncol. 16:1344–1354. 2015. View Article : Google Scholar : PubMed/NCBI
|
|
5
|
Lencioni R, Llovet JM, Han G, Tak WY, Yang
J, Guglielmi A, Paik SW, Reig M, Kim DY, Chau GY, et al: Sorafenib
or placebo plus TACE with doxorubicin-eluting beads for
intermediate stage HCC: The SPACE trial. J Hepatol. 64:1090–1098.
2016. View Article : Google Scholar : PubMed/NCBI
|
|
6
|
Chen J, Jin R, Zhao J, Liu J, Ying H, Yan
H, Zhou S, Liang Y, Huang D, Liang X, et al: Potential molecular,
cellular and microenvironmental mechanism of sorafenib resistance
in hepatocellular carcinoma. Cancer Lett. 367:1–11. 2015.
View Article : Google Scholar : PubMed/NCBI
|
|
7
|
Nannini M, Pantaleo MA, Maleddu A, Astolfi
A, Formica S and Biasco G: Gene expression profiling in colorectal
cancer using microarray technologies: Results and perspectives.
Cancer Treat Rev. 35:201–209. 2009. View Article : Google Scholar : PubMed/NCBI
|
|
8
|
Mok SC, Bonome T, Vathipadiekal V, Bell A,
Johnson ME, Wong KK, Park DC, Hao K, Yip DK, Donninger H, et al: A
gene signature predictive for outcome in advanced ovarian cancer
identifies a survival factor: Microfibril-associated glycoprotein
2. Cancer Cell. 16:521–532. 2009. View Article : Google Scholar : PubMed/NCBI
|
|
9
|
Kadioglu O, Saeed M, Kuete V, Greten HJ
and Efferth T: Oridonin targets multiple drug-resistant tumor cells
as determined by in silico and in vitro analyses. Front Pharmacol.
9:3552018. View Article : Google Scholar : PubMed/NCBI
|
|
10
|
Li L, Wang G, Li N, Yu H, Si J and Wang J:
Identification of key genes and pathways associated with obesity in
children. Exp Ther Med. 14:1065–1073. 2017. View Article : Google Scholar : PubMed/NCBI
|
|
11
|
Xu Z, Zhou Y, Cao Y, Dinh TL, Wan J and
Zhao M: Identification of candidate biomarkers and analysis of
prognostic values in ovarian cancer by integrated bioinformatics
analysis. Med Oncol. 33:1302016. View Article : Google Scholar : PubMed/NCBI
|
|
12
|
Liang B, Li C and Zhao J: Identification
of key pathways and genes in colorectal cancer using bioinformatics
analysis. Med Oncol. 33:1112016. View Article : Google Scholar : PubMed/NCBI
|
|
13
|
Bader GD and Hogue CW: An automated method
for finding molecular complexes in large protein interaction
networks. BMC Bioinformatics. 4:22003. View Article : Google Scholar : PubMed/NCBI
|
|
14
|
Carl-McGrath S, Lendeckel U, Ebert M and
Röcken C: Ectopeptidases in tumor biology: A review. Histol
Histopathol. 21:1339–1353. 2006.PubMed/NCBI
|
|
15
|
Cordero OJ, Ayude D, Nogueira M,
Rodriguez-Berrocal FJ and de la Cadena MP: Preoperative serum CD26
levels: Diagnostic efficiency and predictive value for colorectal
cancer. Br J Cancer. 83:1139–1146. 2000. View Article : Google Scholar : PubMed/NCBI
|
|
16
|
Ikeda N, Nakajima Y, Tokuhara T, Hattori
N, Sho M, Kanehiro H and Miyake M: Clinical significance of
aminopeptidase N/CD13 expression in human pancreatic carcinoma.
Clin Cancer Res. 9:1503–1508. 2003.PubMed/NCBI
|
|
17
|
Murakami H, Yokoyama A, Kondo K, Nakanishi
S, Kohno N and Miyake M: Circulating aminopeptidase N/CD13 is an
independent prognostic factor in patients with non-small cell lung
cancer. Clin Cancer Res. 11:8674–8679. 2005. View Article : Google Scholar : PubMed/NCBI
|
|
18
|
Larrinaga G, Blanco L, Sanz B, Perez I,
Gil J, Unda M, Andrés L, Casis L and López JI: The impact of
peptidase activity on clear cell renal cell carcinoma survival. Am
J Physiol Renal Physiol. 303:F1584–F1591. 2012. View Article : Google Scholar : PubMed/NCBI
|
|
19
|
McDonnell DP, Park S, Goulet MT, Jasper J,
Wardell SE, Chang CY, Norris JD, Guyton JR and Nelson ER: Obesity,
cholesterol metabolism, and breast cancer pathogenesis. Cancer Res.
74:4976–4982. 2014. View Article : Google Scholar : PubMed/NCBI
|
|
20
|
Lin CY, Huo C, Kuo LK, Hiipakka RA, Jones
RB, Lin HP, Hung Y, Su LC, Tseng JC, Kuo YY, et al: Cholestane-3β,
5α, 6β-triol suppresses proliferation, migration, and invasion of
human prostate cancer cells. PLoS One. 8:e657342013. View Article : Google Scholar : PubMed/NCBI
|
|
21
|
Murtola TJ, Visvanathan K, Artama M,
Vainio H and Pukkala E: Statin use and breast cancer survival: A
nationwide cohort study from finland. PLoS One. 9:e1102312014.
View Article : Google Scholar : PubMed/NCBI
|
|
22
|
Cardwell CR, Hicks BM, Hughes C and Murray
LJ: Statin use after colorectal cancer diagnosis and survival: A
population-based cohort study. J Clin Oncol. 32:3177–3183. 2014.
View Article : Google Scholar : PubMed/NCBI
|
|
23
|
Jacobs EJ, Newton CC, Thun MJ and Gapstur
SM: Long-term use of cholesterol-lowering drugs and cancer
incidence in a large United States cohort. Cancer Res.
71:1763–1771. 2011. View Article : Google Scholar : PubMed/NCBI
|
|
24
|
Zhuo H, Lyu Z, Su J, He J, Pei Y, Cheng X,
Zhou N, Lu X, Zhou S and Zhao Y: Effect of lung squamous cell
carcinoma tumor microenvironment on the CD105+ endothelial cell
proteome. J Proteome Res. 13:4717–4729. 2014. View Article : Google Scholar : PubMed/NCBI
|
|
25
|
Han B, Nakamura M, Mori I, Nakamura Y and
Kakudo K: Urokinase-type plasminogen activator system and breast
cancer (Review). Oncol Rep. 14:105–112. 2005.PubMed/NCBI
|
|
26
|
Tsunoda T, Nakamura T, Ishimoto K, Yamaue
H, Tanimura H, Saijo N and Nishio K: Upregulated expression of
angiogenesis genes and down regulation of cell cycle genes in human
colorectal cancer tissue determined by cDNA macroarray. Anticancer
Res. 21:137–143. 2001.PubMed/NCBI
|
|
27
|
Romero-Cordoba SL, Salido-Guadarrama I,
Rodriguez-Dorantes M and Hidalgo-Miranda A: miRNA biogenesis:
Biological impact in the development of cancer. Cancer Biol Ther.
15:1444–1455. 2014. View Article : Google Scholar : PubMed/NCBI
|
|
28
|
Perez R, Wu N, Klipfel AA and Beart RW Jr:
A better cell cycle target for gene therapy of colorectal cancer:
Cyclin G. J Gastrointest Surg. 7:884–889. 2003. View Article : Google Scholar : PubMed/NCBI
|
|
29
|
Tominaga O, Nita ME, Nagawa H, Fujii S,
Tsuruo T and Muto T: Expressions of cell cycle regulators in human
colorectal cancer cell lines. Jpn J Cancer Res. 88:855–860. 2003.
View Article : Google Scholar
|
|
30
|
van den Berg YW, Osanto S, Reitsma PH and
Versteeg HH: The relationship between tissue factor and cancer
progression: Insights from bench and bedside. Blood. 119:924–932.
2012. View Article : Google Scholar : PubMed/NCBI
|
|
31
|
Pesson M, Volant A, Uguen A, Trillet K, De
La Grange P, Aubry M, Daoulas M, Robaszkiewicz M, Le Gac G, Morel
A, et al: A gene expression and pre-mRNA splicing signature that
marks the adenoma-adenocarcinoma progression in colorectal cancer.
PLoS One. 9:e877612014. View Article : Google Scholar : PubMed/NCBI
|
|
32
|
Tsai TH, Song E, Zhu R, Di Poto C, Wang M,
Luo Y, Varghese RS, Tadesse MG, Ziada DH, Desai CS, et al:
LC-MS/MS-based serum proteomics for identification of candidate
biomarkers for hepatocellular carcinoma. Proteomics. 15:2369–2381.
2015. View Article : Google Scholar : PubMed/NCBI
|
|
33
|
Turati F, Talamini R, Pelucchi C, Polesel
J, Franceschi S, Crispo A, Izzo F, La Vecchia C, Boffetta P and
Montella M: Metabolic syndrome and hepatocellular carcinoma risk.
Br J Cancer. 108:222–228. 2013. View Article : Google Scholar : PubMed/NCBI
|
|
34
|
Baffy G, Brunt EM and Caldwell SH:
Hepatocellular carcinoma in non-alcoholic fatty liver disease: An
emerging menace. J Hepatol. 56:1384–1391. 2012. View Article : Google Scholar : PubMed/NCBI
|
|
35
|
Boroughs LK and DeBerardinis RJ: Metabolic
pathways promoting cancer cell survival and growth. Nat Cell Biol.
17:351–359. 2015. View Article : Google Scholar : PubMed/NCBI
|
|
36
|
Jiang W, Huang H, Ding L, Zhu P, Saiyin H,
Ji G, Zuo J, Han D, Pan Y, Ding D, et al: Regulation of cell cycle
of hepatocellular carcinoma by NF90 through modulation of cyclin E1
mRNA stability. Oncogene. 34:4460–4470. 2015. View Article : Google Scholar : PubMed/NCBI
|
|
37
|
Clawson GA, Feldherr CM and Smuckler EA:
Nucleocytoplasmic RNA transport. Mol Cell Biochem. 67:87–99. 1985.
View Article : Google Scholar : PubMed/NCBI
|
|
38
|
Quesada-Calvo F, Massot C, Bertrand V,
Longuespée R, Blétard N, Somja J, Mazzucchelli G, Smargiasso N,
Baiwir D, De Pauw-Gillet MC, et al: OLFM4, KNG1 and Sec24C
identified by proteomics and immunohistochemistry as potential
markers of early colorectal cancer stages. Clin Proteomics.
14:92017. View Article : Google Scholar : PubMed/NCBI
|
|
39
|
Wang J, Wang X, Lin S, Chen C, Wang C, Ma
Q and Jiang B: Identification of kininogen-1 as a serum biomarker
for the early detection of advanced colorectal adenoma and
colorectal cancer. PLoS One. 8:e705192013. View Article : Google Scholar : PubMed/NCBI
|
|
40
|
Wahab Abdel AHA, El-Halawany MS, Emam AA,
Elfiky A and Elmageed Abd ZY: Identification of circulating protein
biomarkers in patients with hepatocellular carcinoma concomitantly
infected with chronic hepatitis C virus. Biomarkers. 22:621–628.
2017.PubMed/NCBI
|
|
41
|
He X, Wang Y, Zhang W, Li H, Luo R, Zhou
Y, Liao CL, Huang H, Lv X, Xie Z and He M: Screening differential
expression of serum proteins in AFP-negative HBV-related
hepatocellular carcinoma using iTRAQ -MALDI-MS/MS. Neoplasma.
61:17–26. 2014. View Article : Google Scholar : PubMed/NCBI
|
|
42
|
Wang C, Liu CM, Wei LL, Shi LY, Pan ZF,
Mao LG, Wan XC, Ping ZP, Jiang TT, Chen ZL, et al: A group of novel
serum diagnostic biomarkers for multidrug-resistant tuberculosis by
iTRAQ-2D LC-MS/MS and solexa sequencing. Int J Biol Sci.
12:246–256. 2016. View Article : Google Scholar : PubMed/NCBI
|
|
43
|
Koch AE, Halloran MM, Haskell CJ, Shah MR
and Polverini PJ: Angiogenesis mediated by soluble forms of
E-selectin and vascular cell adhesion molecule-1. Nature.
376:517–519. 1995. View Article : Google Scholar : PubMed/NCBI
|
|
44
|
Byrne GJ, Ghellal A, Iddon J, Blann AD,
Venizelos V, Kumar S, Howell A and Bundred NJ: Serum soluble
vascular cell adhesion molecule-1: Role as a surrogate marker of
angiogenesis. J Natl Cancer Inst. 92:1329–1336. 2000. View Article : Google Scholar : PubMed/NCBI
|
|
45
|
Yoong KF, McNab G, Hubscher SG and Adams
DH: Vascular adhesion protein-1 and ICAM-1 support the adhesion of
tumor-infiltrating lymphocytes to tumor endothelium in human
hepatocellular carcinoma. J Immunol. 160:3978–3988. 1998.PubMed/NCBI
|
|
46
|
Alexiou D, Karayiannakis AJ, Syrigos KN,
Zbar A, Kremmyda A, Bramis I and Tsigris C: Serum levels of
E-selectin, ICAM-1 and VCAM-1 in colorectal cancer patients:
Correlations with clinicopathological features, patient survival
and tumour surgery. Eur J Cancer. 37:2392–2397. 2001. View Article : Google Scholar : PubMed/NCBI
|
|
47
|
Kang X, Wang F, Xie JD, Cao J and Xian PZ:
Clinical evaluation of serum concentrations of intercellular
adhesion molecule-1 in patients with colorectal cancer. World J
Gastroenterol. 11:4250–4253. 2005. View Article : Google Scholar : PubMed/NCBI
|
|
48
|
O'Hanlon DM, Fitzsimons H, Lynch J, Tormey
S, Malone C and Given HF: Soluble adhesion molecules (E-selectin,
ICAM-1 and VCAM-1) in breast carcinoma. Eur J Cancer. 38:2252–2257.
2002. View Article : Google Scholar : PubMed/NCBI
|
|
49
|
Ho JW, Poon RT, Tong CS and Fan ST:
Clinical significance of serum vascular cell adhesion molecule-1
levels in patients with hepatocellular carcinoma. World J
Gastroenterol. 10:2014–2018. 2004. View Article : Google Scholar : PubMed/NCBI
|
|
50
|
Iliaz R, Akyuz U, Tekin D, Serilmez M,
Evirgen S, Cavus B, Soydinc H, Duranyildiz D, Karaca C, Demir K, et
al: Role of several cytokines and adhesion molecules in the
diagnosis and prediction of survival of hepatocellular carcinoma.
Arab J Gastroenterol. 17:164–167. 2016. View Article : Google Scholar : PubMed/NCBI
|
|
51
|
Diaz-Sanchez A, Matilla A, Nunez O, Rincon
D, Lorente R, Iacono Lo O, Merino B, Hernando A, Campos R, Clemente
G and Bañares R: Serum level of soluble vascular cell adhesion
molecule in patients with hepatocellular carcinoma and its
association with severity of liver disease. Ann Hepatol.
12:236–247. 2013.PubMed/NCBI
|
|
52
|
Scalici JM, Thomas S, Harrer C, Raines TA,
Curran J, Atkins KA, Conaway MR, Duska L, Kelly KA and Slack-Davis
JK: Imaging VCAM-1 as an indicator of treatment efficacy in
metastatic ovarian cancer. J Nucl Med. 54:1883–1889. 2013.
View Article : Google Scholar : PubMed/NCBI
|
|
53
|
Ito Y, Azrolan N, O'Connell A, Walsh A and
Breslow JL: Hypertriglyceridemia as a result of human apo CIII gene
expression in transgenic mice. Science. 249:790–793. 1990.
View Article : Google Scholar : PubMed/NCBI
|
|
54
|
Chan AW, Wong GL, Chan HY, Tong JH, Yu YH,
Choi PC, Chan HL, To KF and Wong VW: Concurrent fatty liver
increases risk of hepatocellular carcinoma among patients with
chronic hepatitis B. J Gastroenterol Hepatol. 32:667–676. 2017.
View Article : Google Scholar : PubMed/NCBI
|
|
55
|
Zhong DN, Ning QY, Wu JZ, Zang N, Wu JL,
Hu DF, Luo SY, Huang AC, Li LL and Li GJ: Comparative proteomic
profiles indicating genetic factors may involve in hepatocellular
carcinoma familial aggregation. Cancer Sci. 103:1833–1838. 2012.
View Article : Google Scholar : PubMed/NCBI
|
|
56
|
Haukeland JW, Dahl TB, Yndestad A,
Gladhaug IP, Løberg EM, Haaland T, Konopski Z, Wium C, Aasheim ET,
Johansen OE, et al: Fetuin A in nonalcoholic fatty liver disease:
In vivo and in vitro studies. Eur J Endocrinol. 166:503–510. 2012.
View Article : Google Scholar : PubMed/NCBI
|
|
57
|
Yilmaz Y, Yonal O, Kurt R, Ari F, Oral AY,
Celikel CA, Korkmaz S, Ulukaya E, Ozdogan O, Imeryuz N, et al:
Serum fetuin A/α2HS-glycoprotein levels in patients with
non-alcoholic fatty liver disease: Relation with liver fibrosis.
Ann Clin Biochem. 47:549–553. 2010. View Article : Google Scholar : PubMed/NCBI
|
|
58
|
Zhao ZW, Lin CG, Wu LZ, Luo YK, Fan L,
Dong XF and Zheng H: Serum fetuin-A levels are associated with the
presence and severity of coronary artery disease in patients with
type 2 diabetes. Biomarkers. 18:160–164. 2013. View Article : Google Scholar : PubMed/NCBI
|
|
59
|
Kaushik SV, Plaisance EP, Kim T, Huang EY,
Mahurin AJ, Grandjean PW and Mathews ST: Extended-release niacin
decreases serum fetuin-A concentrations in individuals with
metabolic syndrome. Diabetes Metab Res Rev. 25:427–434. 2009.
View Article : Google Scholar : PubMed/NCBI
|
|
60
|
Kalabay L, Jakab L, Prohaszka Z, Füst G,
Benkö Z, Telegdy L, Lörincz Z, Závodszky P, Arnaud P and Fekete B:
Human fetuin/alpha2HS-glycoprotein level as a novel indicator of
liver cell function and short-term mortality in patients with liver
cirrhosis and liver cancer. Eur J Gastroenterol Hepatol.
14:389–394. 2002. View Article : Google Scholar : PubMed/NCBI
|
|
61
|
Guillory B, Sakwe AM, Saria M, Thompson P,
Adhiambo C, Koumangoye R, Ballard B, Binhazim A, Cone C,
Jahanen-Dechent W and Ochieng J: Lack of fetuin-A
(alpha2-HS-glycoprotein) reduces mammary tumor incidence and
prolongs tumor latency via the transforming growth factor-beta
signaling pathway in a mouse model of breast cancer. Am J Pathol.
177:2635–2644. 2010. View Article : Google Scholar : PubMed/NCBI
|
|
62
|
Swallow CJ, Partridge EA, Macmillan JC,
Tajirian T, DiGuglielmo GM, Hay K, Szweras M, Jahnen-Dechent W,
Wrana JL, Redston M, et al: alpha2HS-glycoprotein, an antagonist of
transforming growth factor beta in vivo, inhibits intestinal tumor
progression. Cancer Res. 64:6402–6409. 2004. View Article : Google Scholar : PubMed/NCBI
|
|
63
|
Xiang Y, Liu Y, Yang Y, Hu H, Hu P, Ren H
and Zhang D: A secretomic study on human hepatocellular carcinoma
multiple drug-resistant cell lines. Oncol Rep. 34:1249–1260. 2015.
View Article : Google Scholar : PubMed/NCBI
|
|
64
|
Hyung SW, Lee MY, Yu JH, Shin B, Jung HJ,
Park JM, Han W, Lee KM, Moon HG, Zhang H, et al: A serum protein
profile predictive of the resistance to neoadjuvant chemotherapy in
advanced breast cancers. Mol Cell Proteomics. 10(M111):
0110232011.PubMed/NCBI
|
|
65
|
Kirschbaum MH and Yarden Y: The ErbB/HER
family of receptor tyrosine kinases: A potential target for
chemoprevention of epithelial neoplasms. J Cell Biochem Suppl.
34:52–60. 2000. View Article : Google Scholar : PubMed/NCBI
|
|
66
|
Slamon DJ, Godolphin W, Jones LA, Holt JA,
Wong SG, Keith DE, Levin WJ, Stuart SG, Udove J and Ullrich A:
Studies of the HER-2/neu proto-oncogene in human breast and ovarian
cancer. Science. 244:707–712. 1989. View Article : Google Scholar : PubMed/NCBI
|
|
67
|
Press MF, Pike MC, Chazin VR, Hung G,
Udove JA, Markowicz M, Danyluk J, Godolphin W, Sliwkowski M and
Akita R: Her-2/neu expression in node-negative breast cancer:
Direct tissue quantitation by computerized image analysis and
association of overexpression with increased risk of recurrent
disease. Cancer Res. 53:4960–4970. 1993.PubMed/NCBI
|
|
68
|
Colak D, Chishti MA, Al-Bakheet AB,
Al-Qahtani A, Shoukri MM, Goyns MH, Ozand PT, Quackenbush J, Park
BH and Kaya N: Integrative and comparative genomics analysis of
early hepatocellular carcinoma differentiated from liver
regeneration in young and old. Mol Cancer. 9:1462010. View Article : Google Scholar : PubMed/NCBI
|
|
69
|
Nakopoulou L, Stefanaki K, Filaktopoulos D
and Giannopoulou I: C-erb-B-2 oncoprotein and epidermal growth
factor receptor in human hepatocellular carcinoma: An
immunohistochemical study. Histol Histopathol. 9:677–682.
1994.PubMed/NCBI
|
|
70
|
Hamazaki K, Yunoki Y, Tagashira H, Mimura
T, Mori M and Orita K: Epidermal growth factor receptor in human
hepatocellular carcinoma. Cancer Detect Prev. 21:355–360.
1997.PubMed/NCBI
|
|
71
|
Prange W and Schirmacher P: Absence of
therapeutically relevant c-erbB-2 expression in human
hepatocellular carcinomas. Oncol Rep. 8:727–730. 2001.PubMed/NCBI
|
|
72
|
Altimari A, Fiorentino M, Gabusi E,
Gruppioni E, Corti B, D'Errico A and Grigioni WF: Investigation of
ErbB1 and ErbB2 expression for therapeutic targeting in primary
liver tumours. Dig Liver Dis. 35:332–338. 2003. View Article : Google Scholar : PubMed/NCBI
|
|
73
|
Ito Y, Takeda T, Sakon M, Tsujimoto M,
Higashiyama S, Noda K, Miyoshi E, Monden M and Matsuura N:
Expression and clinical significance of erb-B receptor family in
hepatocellular carcinoma. Br J Cancer. 84:1377–1383. 2001.
View Article : Google Scholar : PubMed/NCBI
|
|
74
|
Misale S, Di Nicolantonio F,
Sartore-Bianchi A, Siena S and Bardelli A: Resistance to anti-EGFR
therapy in colorectal cancer: From heterogeneity to convergent
evolution. Cancer Discov. 4:1269–1280. 2014. View Article : Google Scholar : PubMed/NCBI
|
|
75
|
Vaz J, Ansari D, Sasor A and Andersson R:
SPARC: A potential prognostic and therapeutic target in pancreatic
cancer. Pancreas. 44:1024–1035. 2015. View Article : Google Scholar : PubMed/NCBI
|
|
76
|
Nagaraju GP, Dontula R, El-Rayes BF and
Lakka SS: Molecular mechanisms underlying the divergent roles of
SPARC in human carcinogenesis. Carcinogenesis. 35:967–973. 2014.
View Article : Google Scholar : PubMed/NCBI
|
|
77
|
Lau CP, Poon RT, Cheung ST, Yu WC and Fan
ST: SPARC and Hevin expression correlate with tumour angiogenesis
in hepatocellular carcinoma. J Pathol. 210:459–468. 2006.
View Article : Google Scholar : PubMed/NCBI
|
|
78
|
Massi D, Franchi A, Borgognoni L, Reali UM
and Santucci M: Osteonectin expression correlates with clinical
outcome in thin cutaneous malignant melanomas. Hum Pathol.
30:339–344. 1999. View Article : Google Scholar : PubMed/NCBI
|
|
79
|
Golembieski WA, Ge S, Nelson K, Mikkelsen
T and Rempel SA: Increased SPARC expression promotes U87
glioblastoma invasion in vitro. Int J Dev Neurosci. 17:463–472.
1999. View Article : Google Scholar : PubMed/NCBI
|
|
80
|
Thomas R, True LD, Bassuk JA, Lange PH and
Vessella RL: Differential expression of osteonectin/SPARC during
human prostate cancer progression. Clin Cancer Res. 6:1140–1149.
2000.PubMed/NCBI
|
|
81
|
Wang T, Srivastava S, Hartman M, Buhari
SA, Chan CW, Iau P, Khin LW, Wong A, Tan SH, Goh BC and Lee SC:
High expression of intratumoral stromal proteins is associated with
chemotherapy resistance in breast cancer. Oncotarget.
7:55155–55168. 2016.PubMed/NCBI
|
|
82
|
Seiffert D, Geisterfer M, Gauldie J, Young
E and Podor TJ: IL-6 stimulates vitronectin gene expression in
vivo. J Immunol. 155:3180–3185. 1995.PubMed/NCBI
|
|
83
|
Edwards S, Lalor PF, Tuncer C and Adams
DH: Vitronectin in human hepatic tumours contributes to the
recruitment of lymphocytes in an alpha v beta3-independent manner.
Br J Cancer. 95:1545–1554. 2006. View Article : Google Scholar : PubMed/NCBI
|
|
84
|
Nejjari M, Hafdi Z, Gouyss G, Fiorentino
M, Béatrix O, Dumortier J, Pourreyron C, Barozzi C, D'errico A,
Grigioni WF and Scoazec JY: Expression, regulation, and function of
alpha V integrins in hepatocellular carcinoma: An in vivo and in
vitro study. Hepatology. 36:418–426. 2002. View Article : Google Scholar : PubMed/NCBI
|
|
85
|
Ferrin G, Ranchal I, Llamoza C,
Rodríguez-Perálvarez ML, Romero-Ruiz A, Aguilar-Melero P,
López-Cillero P, Briceño J, Muntané J, Montero-Álvarez JL and De la
Mata M: Identification of candidate biomarkers for hepatocellular
carcinoma in plasma of HCV-infected cirrhotic patients by 2-D DIGE.
Liver Int. 34:438–446. 2014. View Article : Google Scholar : PubMed/NCBI
|
|
86
|
Ding Y and Shen Y: Notch increased
vitronection adhesion protects myeloma cells from drug induced
apoptosis. Biochem Biophys Res Commun. 467:717–722. 2015.
View Article : Google Scholar : PubMed/NCBI
|
|
87
|
Sun S, Poon RT, Lee NP, Yeung C, Chan KL,
Ng IO, Day PJ and Luk JM: Proteomics of hepatocellular carcinoma:
Serum vimentin as a surrogate marker for small tumors (<or=2
cm). J Proteome Res. 9:1923–1930. 2010. View Article : Google Scholar : PubMed/NCBI
|
|
88
|
Lazarova DL and Bordonaro M: Vimentin,
colon cancer progression and resistance to butyrate and other
HDACis. J Cell Mol Med. 20:989–993. 2016. View Article : Google Scholar : PubMed/NCBI
|