Introduction
Budd-Chiari syndrome (BCS) is a serious clinical
syndrome caused by the obstruction of hepatic venous outflow from
the hepatic venules to the atriocaval junction (1–3). Without
any active and effective treatment, the symptoms themselves are not
relieved and are progressively aggravated. The natural prognosis of
patients with BCS is poor. Patients with BCS may die from liver
failure in the acute phase. In the chronic phase, due to
hepatocirrhosis, BCS may cause life-threatening gastrointestinal
bleeding, refractory ascites and liver cancer (4). BCS is a type of congestive liver
disease (5), which has a different
pathogenesis, pathophysiological changes, clinical manifestations,
and prognosis from those of common liver injuries caused by alcohol
abuse, poisoning and viruses. As the worldwide incidence rate of
BCS is only 1 in a million (1),
research focusing on its pathogenesis is limited.
The essence of liver injury in BCS is passive
hepatic congestion caused by hepatic venous outflow obstruction
(HVCC) (5). In theory, hepatic
congestion and hypoxia induce the pathological damage typical of
BCS; however, there is a notable lack of empirical evidence in this
field. However, studies on other types of HVCC suggest that liver
hypoxia is associated with liver injury (5). It has been reported that congestive
heart failure leads to passive hepatic congestion and forms a link
between abnormal liver function and cardiovascular disease
(6–8). In the present study, it was
hypothesized that BCS may occur due to similar mechanisms.
Hypoxia-induced injury may be an important contributor to BCS due
to factors including ischemia and hypoxia in the liver at early
stages. Chronic hypoxia may result in the production of excessive
reactive oxygen species (ROS) and consequently oxidative stress
(OS) (9), which are known to have an
important role in various types of liver injury (10–12).
Therefore, OS may also be involved in the formation of BCS
lesions.
The most recognized predicative markers for OS are
malonaldehyde (MDA) and superoxide dismutase (SOD). MDA is a
product of lipid peroxidation and the most representative indicator
of OS in the body, while SOD is representative of the body's
antioxidant system, and its function is to clear ROS. These two
markers indirectly reflect the extent of OS in the body (13). Endotoxin (ET) is closely associated
with OS. When hepatic congestion occurs, intestinal ET enters the
portal vein ectopically (14,15).
Early studies have reported that ET participates in liver
congestion injury (16,17). According to the present hypothesis,
OS also has an important role in BCS, but studies to evidence this
are currently lacking. MDA and SOD reflect the level of OS after
liver congestion in BCS. ET caused by liver congestion and
intestinal congestion due to BCS may affect OS. The aim of the
present study was to detect the intrahepatic and extrahepatic
levels of these markers at multiple time-points after establishment
of a BCM model in order to clarify their significance in BCS, which
has not been reported previously. In the present study, the method
by Akiyoshi and Terada (18) was
used to partially narrow the inferior vena cava (IVC) to establish
a BCS animal model in rats. By analyzing changes in the
hypoxia-associated markers MDA, SOD and ET in the serum of BCS
patients and in the serum and liver homogenates of experimental
animals at multiple time-points, the present study endeavored to
explore the possible correlations between their levels and
predicating BCS.
Materials and methods
Human samples
A total of 30 patients with BCS who presented at
Anhui Provincial Hospital (Hefei, China) between January and June
2017 were randomly selected (all were diagnosed as having BCS by
magnetic resonance imaging and Doppler ultrasound and the duration
of BCS-associated symptoms at admission exceeded three months) as
the patient group (males/females, 17/13; age, 45.2±11.3 years).
Furthermore, 30 healthy volunteers who took part in health
examinations at Anhui Provincial Hospital Medical Center (Hefei,
China) served as the healthy control group (males/females, 6/4;
age, 46.7±11.5 years). None of the subjects had any history of
alcoholism, exposure to poison, pulmonary heart disease, viral
hepatitis, immune hepatitis or other associated diseases. Blood
samples (5 ml) from control healthy volunteers or BCS patients
prior to treatment was collected from the elbow vein and
centrifuged at 1,500 × g at 4°C for 15 min to obtain the serum,
which was stored at −80°C. All samples were obtained with informed
consent and the analyses were approved by the Ethics Review
Committee at Anhui Provincial Hospital (Hefei, China).
Animal model establishment
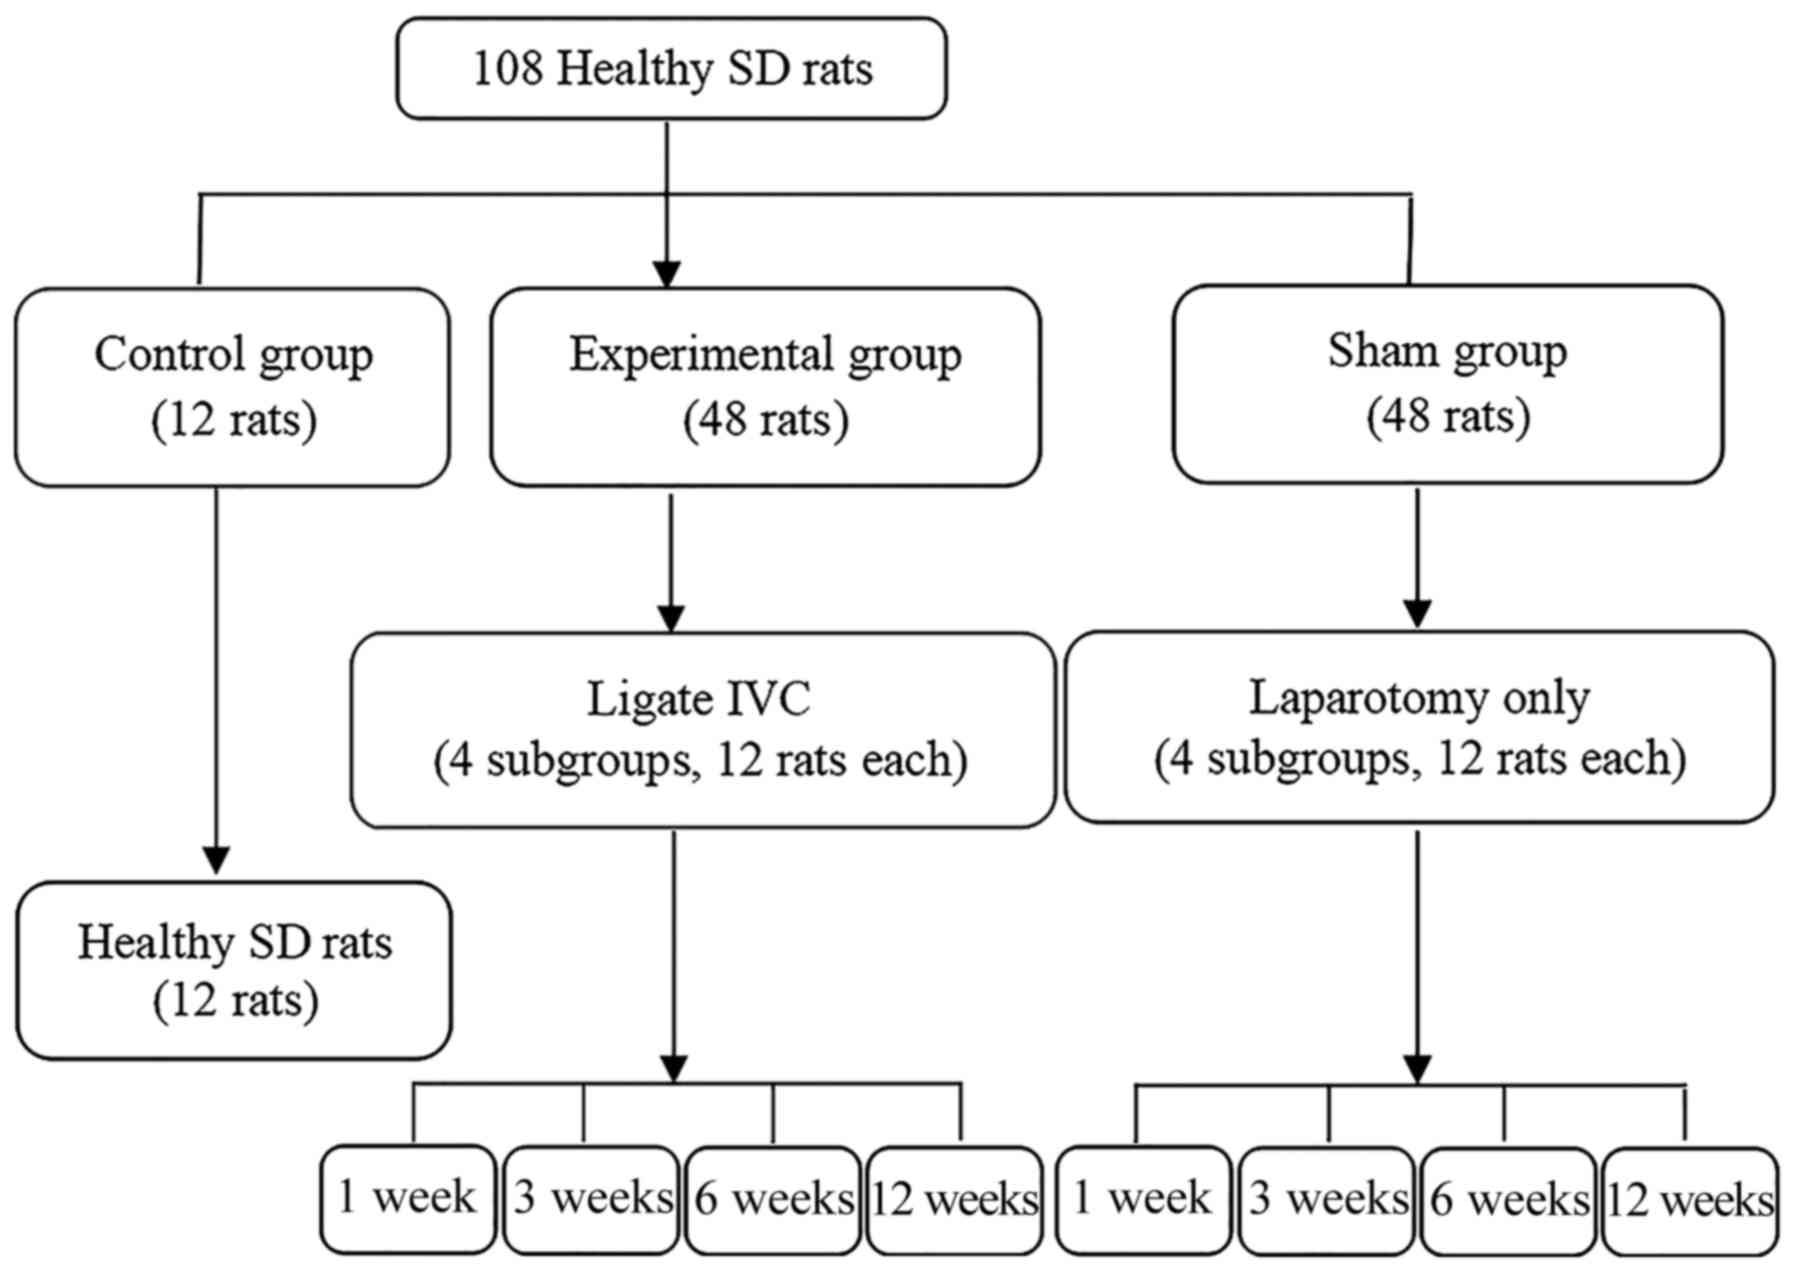
A total of 108 healthy adult male Sprague Dawley
(SD) rats (weight, 185–235 g; age, 5–6 weeks), were purchased from
Anhui Provincial Hospital Experimental Animal Center. All rats were
housed under pathogen-free conditions at room temperature
(15–25°C), a humidity of 50–60% with a 12-h light/dark cycle, and
were provided with free access to food and water. All rats were
divided into three groups according to a random number table
(Fig. 1). The present study was
approved by the Committee on the Ethics of Animal Experiments of
Anhui Provincial Hospital. To establish the BCS model, 48 SD rats
in the experimental group were fasted for 1 day (water provided)
prior to routine disinfection and anesthesia. An open incision was
made from the median incision of the xiphoid to separate the
sickle-shaped ligament of the liver, exposing the IVC posterior to
the liver. A 3F microcatheter was placed in close contact with the
IVC and withdrawn after being tightly wrapped with a 0-gauge wire.
Subsequently, the abdomen was sutured layer by layer. Rats in the
Sham group underwent the same procedure except for the IVC
ligation. All experimental group and Sham rats were intramuscularly
injected with penicillin (20 U/day) for five consecutive days. The
control rats were housed under normal conditions and were not
subjected to any procedures.
Imaging and sample collection
A total of 9 rats from the sham and experimental
groups were euthanized at the following time-points: 1, 3, 6 and 12
weeks post-surgery. Control rats were euthanized together with the
rats from the sham and experimental groups at 6 weeks. The rats in
each group were examined by digital subtraction angiography (DSA) 1
day prior to being sacrificed, and the blood flow through the
hepatic vein, portal vein and IVC was observed. Blood samples were
collected from the eye socket vein and centrifuged at 1,500 × g at
4°C for 15 min to obtain the serum. After the rats were sacrificed,
the liver was quickly removed and rinsed in saline at 4°C. After
being dried with filter paper, 0.5 g of liver tissue from each rat
was homogenized and centrifuged at 1,125 × g for 10 min and the
supernatant was collected for further analysis. Part of the liver
tissue from each rat was fixed in 10% formalin and then embedded in
paraffin. All samples were stored at −80°C until further
analysis.
Hematoxylin and eosin (H&E)
staining
Specimens were sliced into 5-µm thick sections,
stained with H&E and the pathological changes in the liver
tissues were observed with a light microscope at a magnification of
×400 (11,14).
Measurement of hypoxia indicators
MDA (rat, cat. no. xy-E12532; human, cat. no.
xy-060c), SOD (rat, cat. no. xy-E12533; human, cat. no. xy-E10003)
and ET (rat, cat. no. xy-E12516; human, cat. no. xy-E10857) levels
in serum and liver homogenate were detected by double antigen
sandwich assays (Shanghai Xin Yu Biological Technology Co., Ltd.,
Shanghai, China) according to the manufacturers' protocols.
Statistical analysis
Values are expressed as the mean ± standard
deviation, and statistical analysis was performed using SPSS
version 22.0 statistical software (IBM Corp., Armonk, NY, USA). The
Kolmogorov-Smirnov test was used to evaluate data normality. For
multiple-group comparisons, analysis of variance was performed,
followed by Tukey's honest significant difference test. The Pearson
correlation coefficient was calculated for determining the
correlations among hypoxia indicators. P<0.05 was considered to
indicate a statistically significant difference.
Results
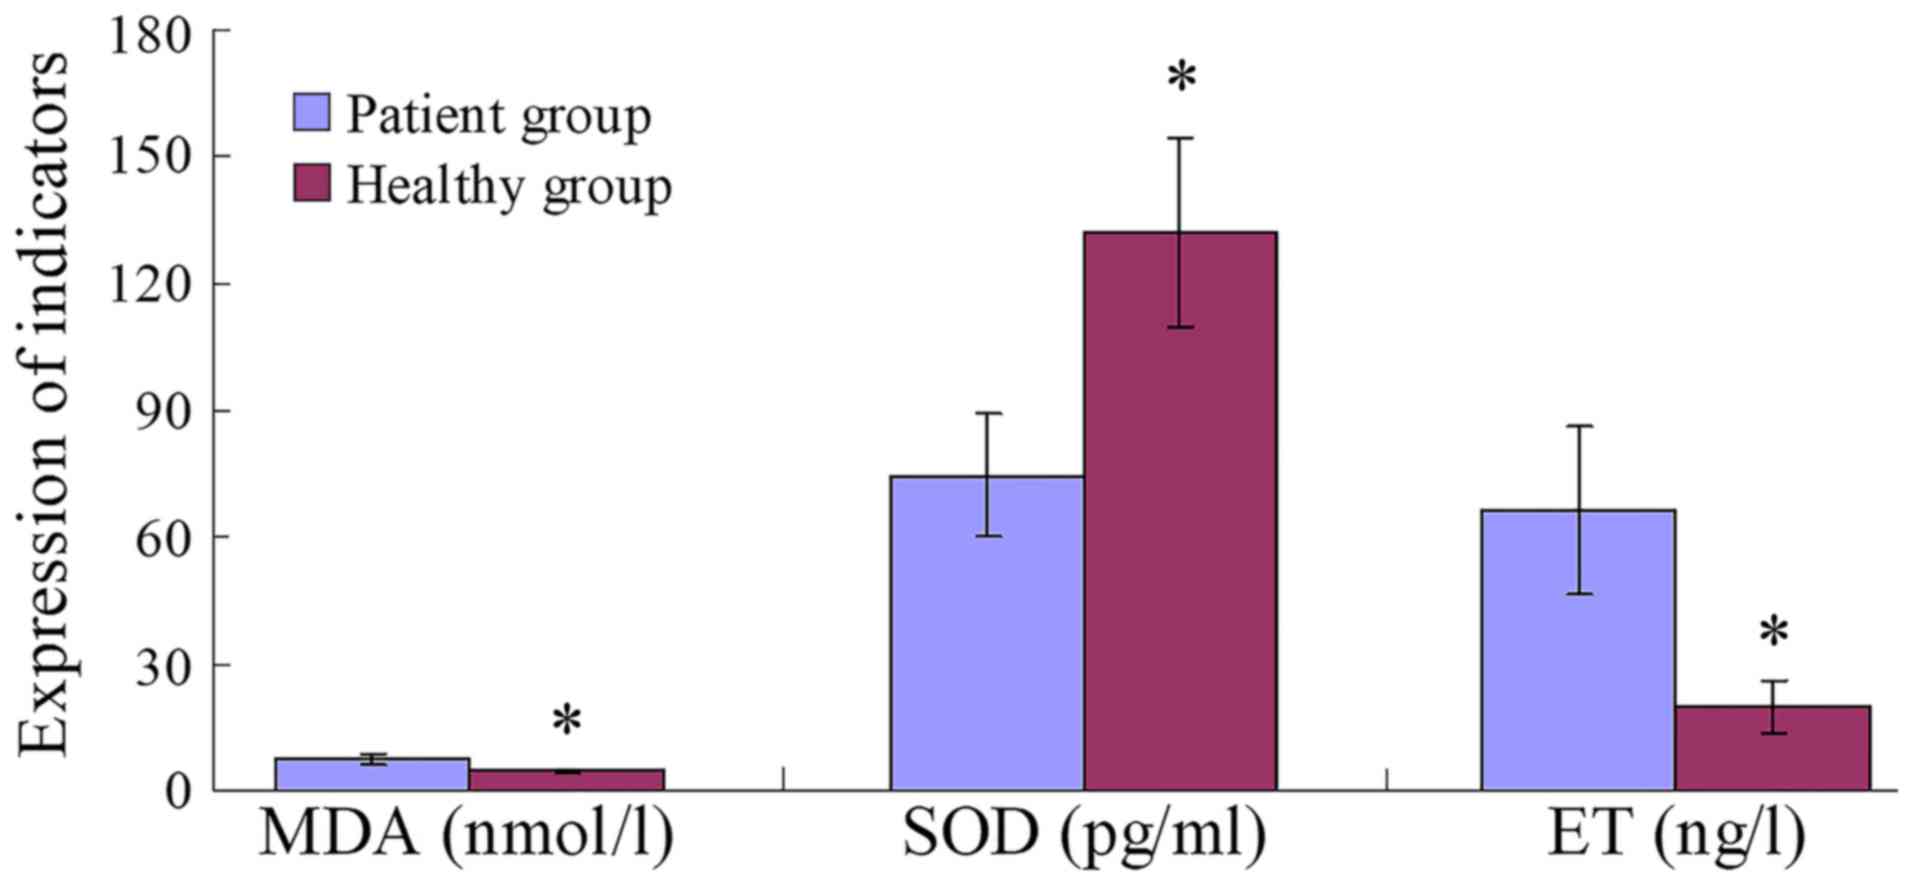
Levels of hypoxia indicators in human
serum
Serum MDA and ET levels in the patient group were
significantly higher than those in the healthy group (both
P=0.001), whereas SOD levels were significantly lower (P=0.001;
Fig. 2).
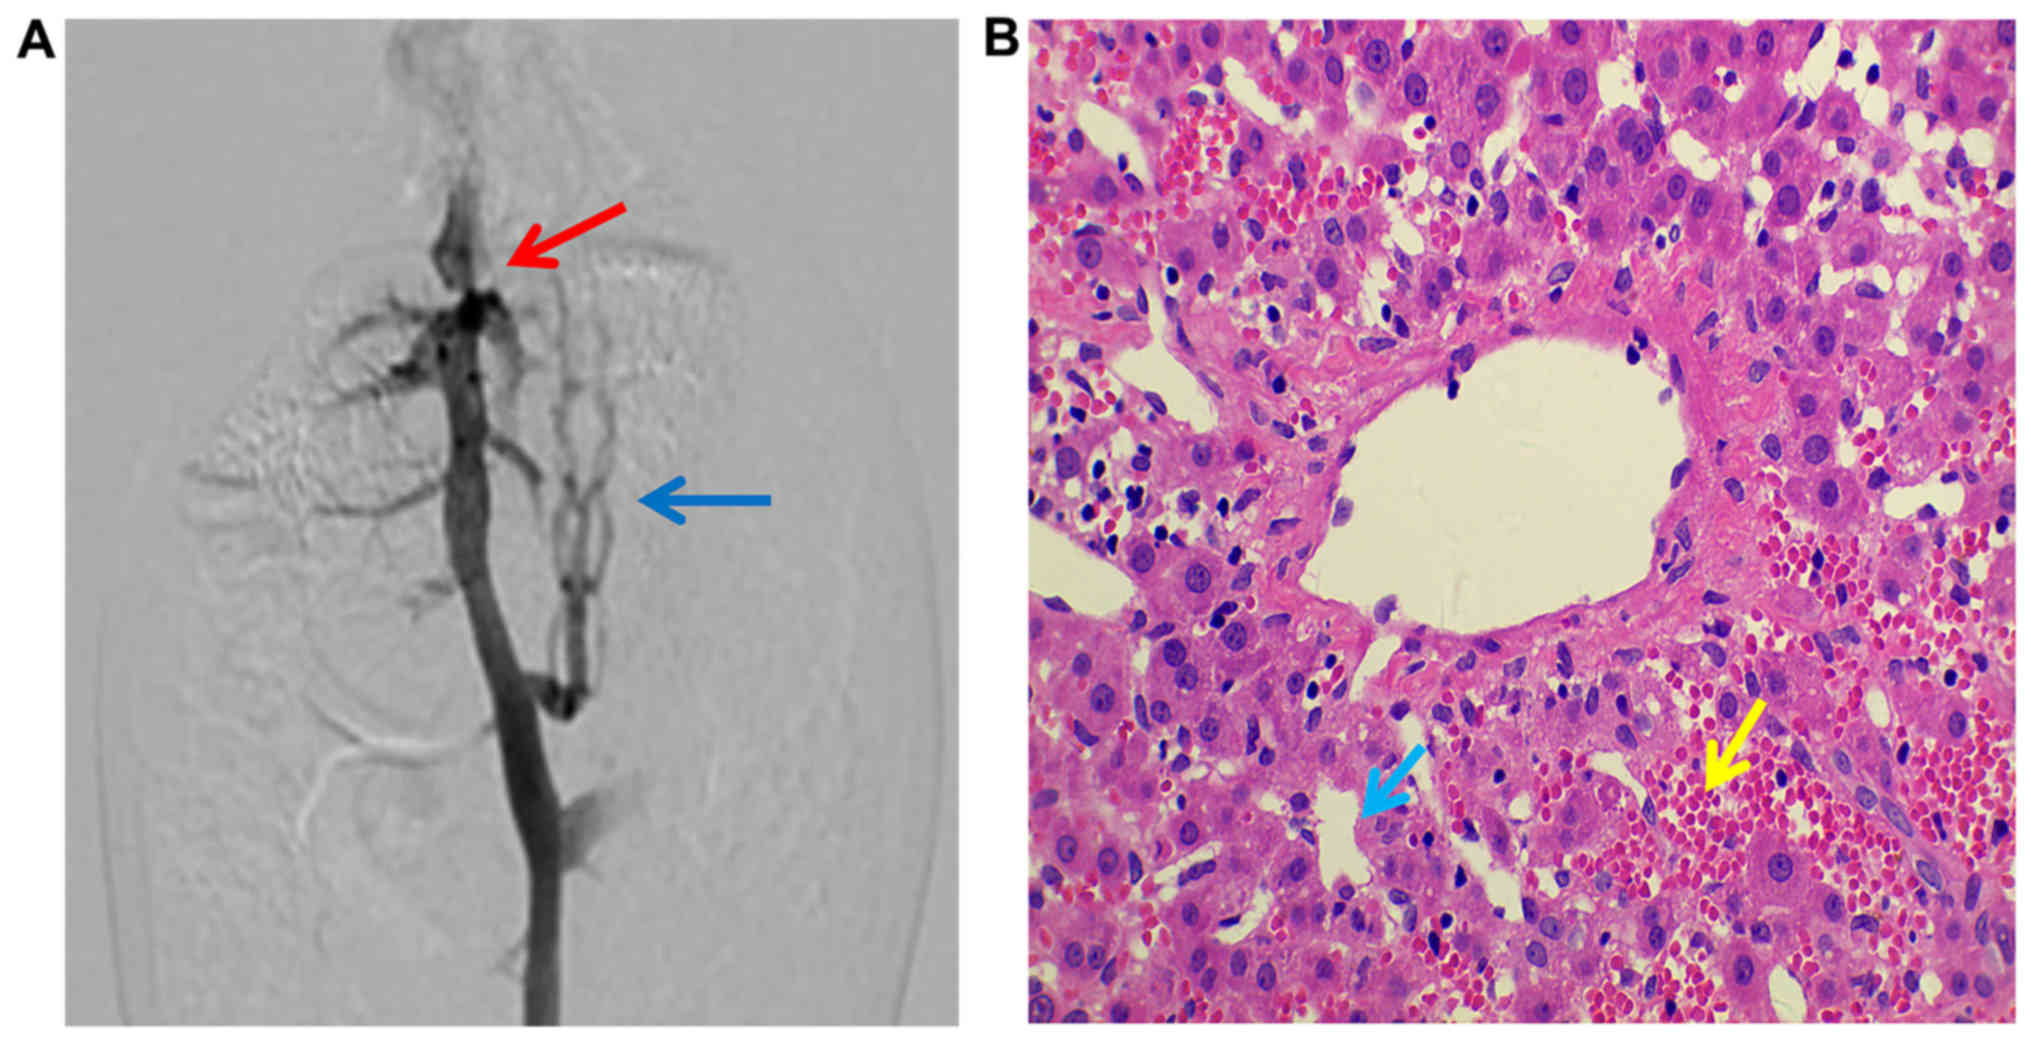
Establishment of the animal model
Successful model establishment in the experimental
group was confirmed by DSA, with narrowing of the IVC posterior to
the liver, distal lumen expansion and collateral circulation
observed at 3–12 weeks post-surgery (Fig. 3A). Livers from each subgroup
exhibited different degrees of pathological injury with liver
fibrosis observed at 12 weeks (Fig.
3B). No pathological injury was observed in the sham or control
groups.
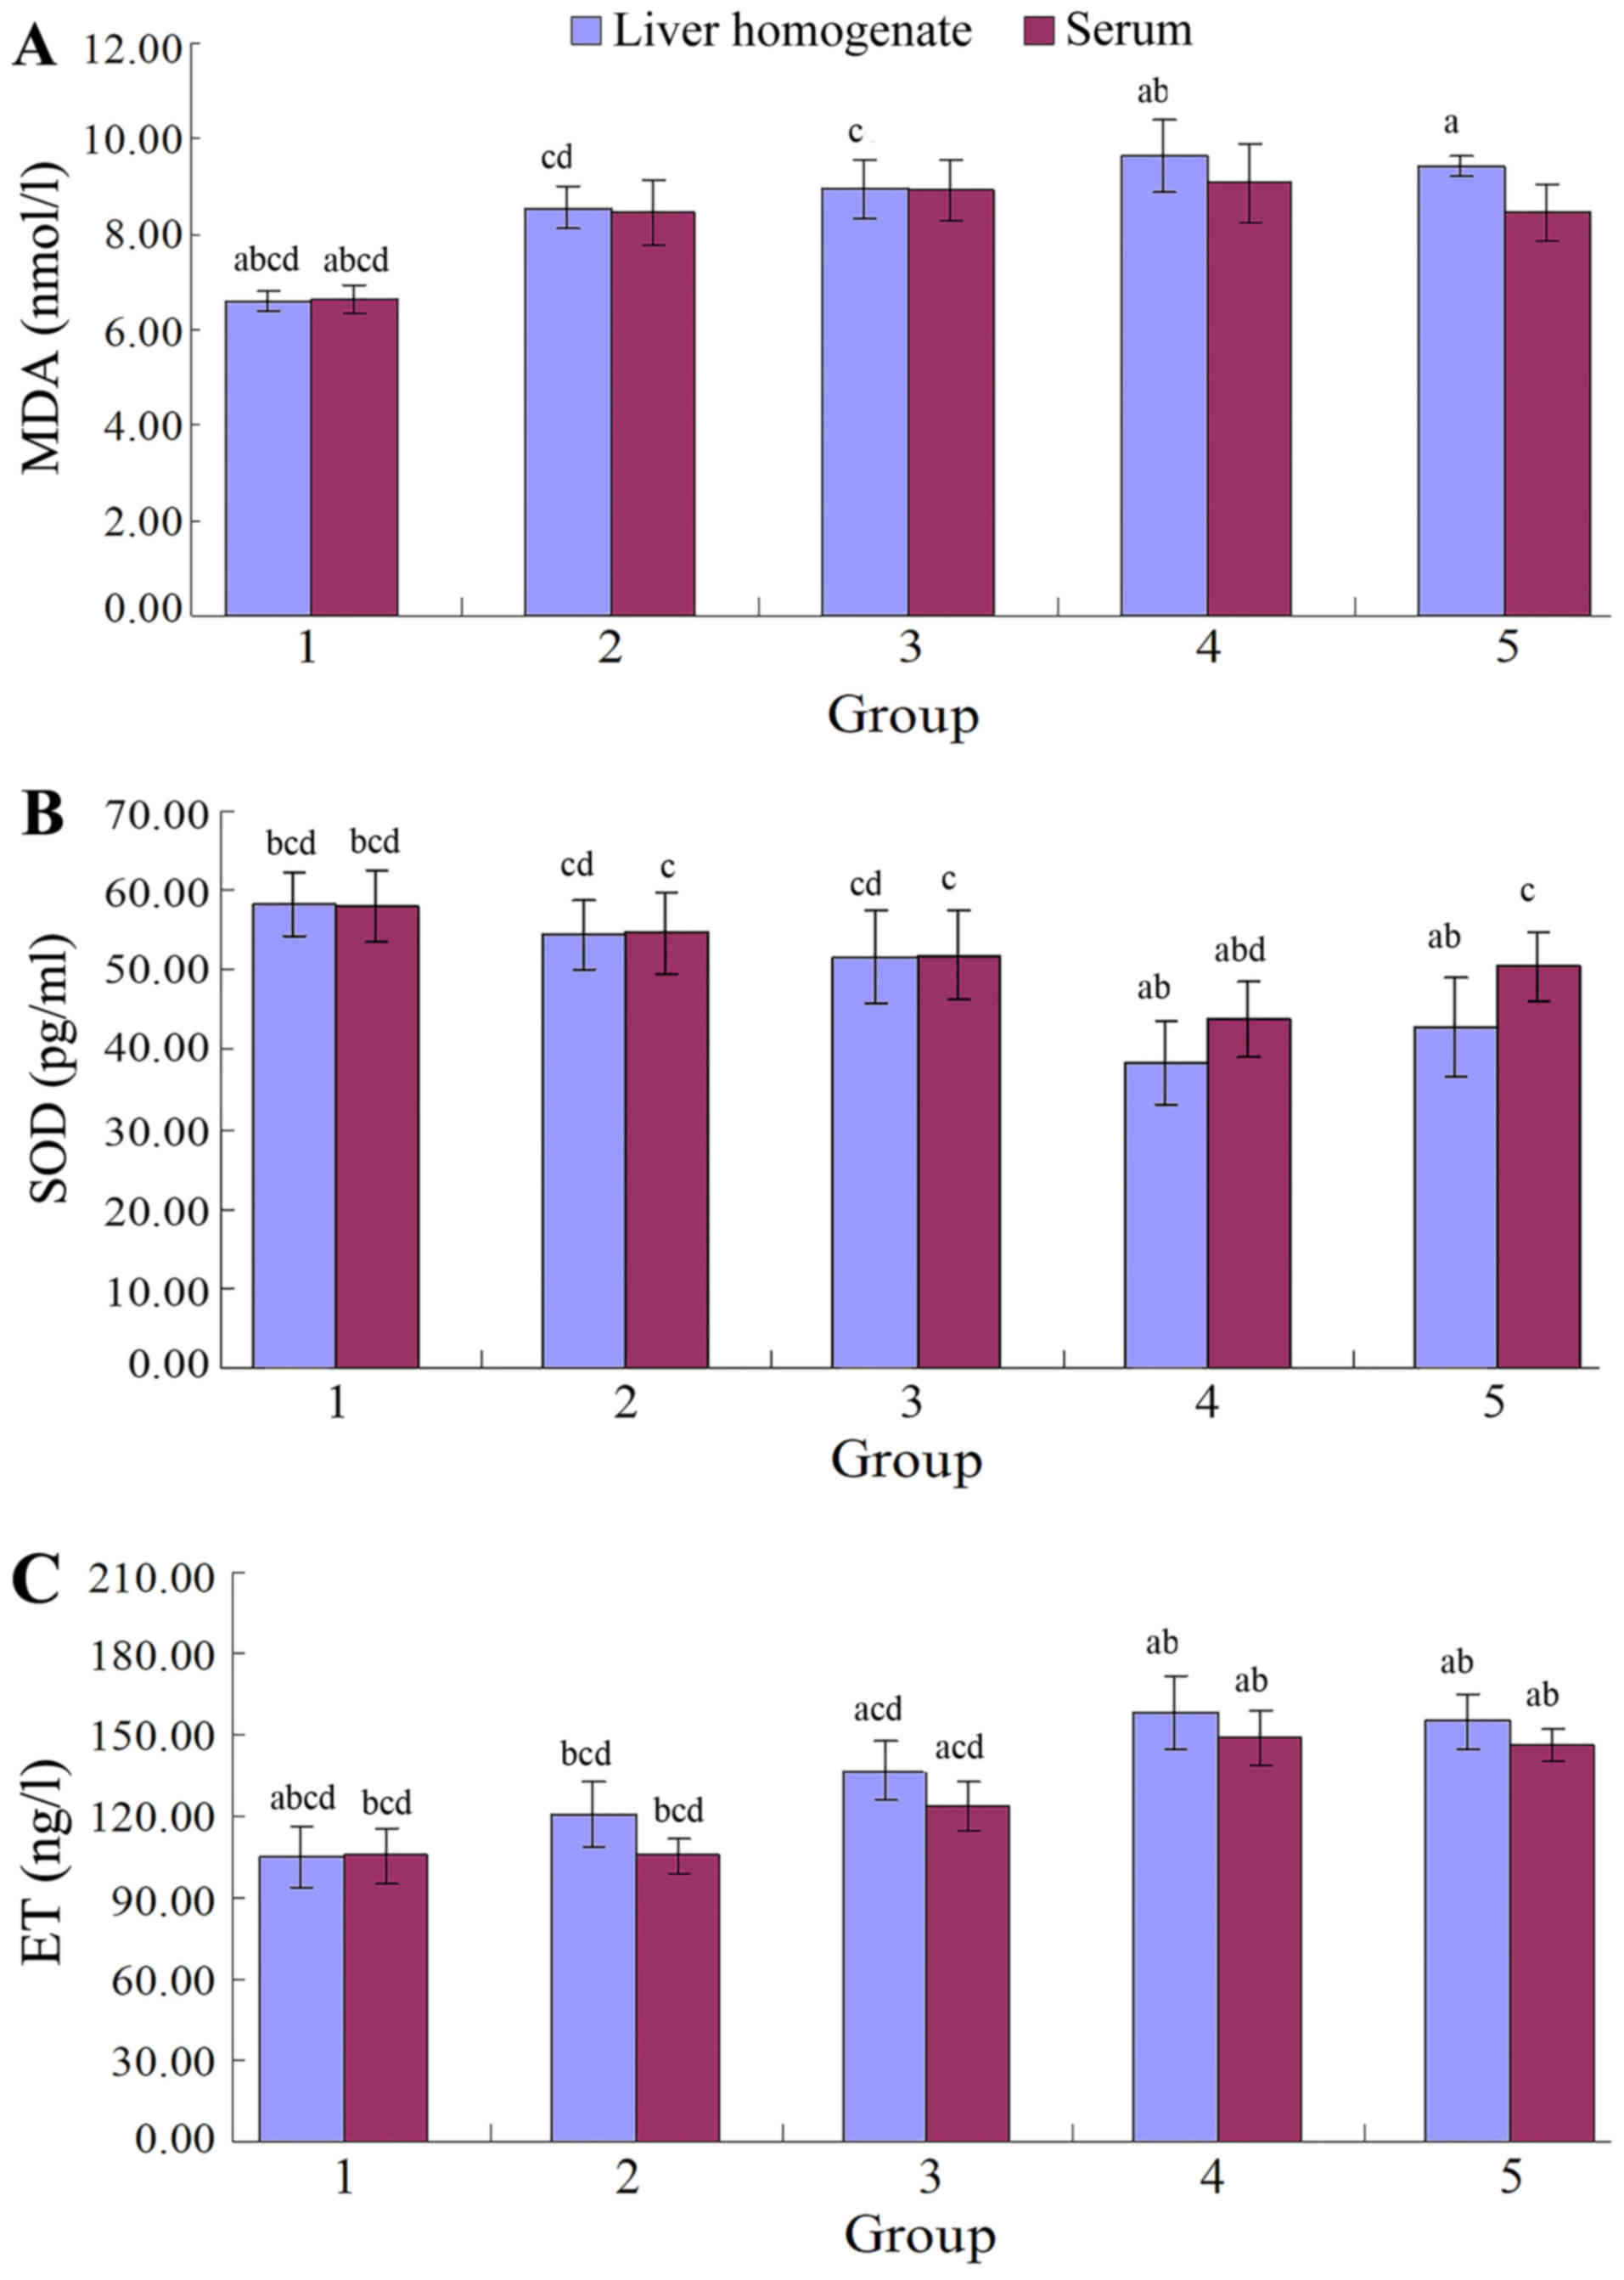
Hypoxia indicator levels in BSC
rats
The levels of MDA and ET in rat liver homogenate and
serum were lower, and the SOD was higher in the sham group compared
with the experimental group at 1, 3, 6 and 12 weeks
post-operatively (MDA: P<0.001; ET: P<0.001; SOD: P<0.001;
Fig. 4, Tables I–VI). The MDA, ET, and SOD levels in both
the liver homogenate and serum in the control group (Tables I–VI)
were not significantly different from those of the sham group at 1,
3, 6 and 12 weeks post-operatively (MDA: P=0.950, 0.916; ET:
P=0.941, 0.976; SOD: P=0.994, 0.994, respectively).
 | Table I.Comparison of MDA levels (nmol/l) in
the experimental animals (n=9 per group) in liver homogenate. |
Table I.
Comparison of MDA levels (nmol/l) in
the experimental animals (n=9 per group) in liver homogenate.
| Week | Sham group | Experimental
group | F-value | P-value |
|---|
| 1 | 6.49±0.39 |
8.55±0.45c,d | 109.158 | 0.001 |
| 3 | 6.61±0.43 |
8.94±0.61c | 88.601 | 0.001 |
| 6 | 6.48±0.57 |
9.65±0.77a,b | 99.146 | 0.001 |
| 12 | 6.55±0.48 |
9.41±0.21a | 267.812 | 0.001 |
| F-value | 0.141 | 7.176 |
|
|
| P-value | 0.935 | 0.001 |
|
|
| Table VI.Comparison of ET (ng/l) levels in
serum in the experimental animals (n=9 per group). |
Table VI.
Comparison of ET (ng/l) levels in
serum in the experimental animals (n=9 per group).
| Week | Sham group | Experimental
group | F-value | P-value |
|---|
| 1 | 104.87±6.54 |
105.56±7.77b,c,d | 0.041 | 0.842 |
| 3 | 107.31±9.06 |
123.67±12.77a,c,d | 9.832 | 0.006 |
| 6 | 106.72±10.23 |
148.97±8.46a,b | 91.193 | 0.000 |
| 12 | 105.66±6.02 |
145.91±9.21a,b | 120.323 | 0.000 |
| F-value | 0.160 | 39.372 |
|
|
| P-value | 0.923 | 0.001 |
|
|
Comparing MDA, ET and SOD levels in the experimental
group to those of the sham group at the same time-points, the
levels of MDA and ET in rat liver homogenate and serum were lower,
and the SOD was higher in the sham group compared with the
experimental group at 3, 6 and 12 weeks (Tables I–VI).
In the serum, the overall differences in MDA levels
in the experimental group at the different time-points were not
statistically significant (P=0.139), but those determined in the
liver homogenate were significant (P=0.001). The MDA levels in the
6 weeks subgroup were significantly higher than those detected in
the 1 and 3 weeks subgroups (P=0.001 and 0.010, respectively;
Tables I and II).
| Table II.Comparison of serum MDA levels
(nmol/l) in the experimental animals (n=9 per group). |
Table II.
Comparison of serum MDA levels
(nmol/l) in the experimental animals (n=9 per group).
| Week | Sham group | Experimental
group | F-value | P-value |
|---|
| 1 | 6.63±0.68 | 8.44±0.67 | 32.392 | 0.001 |
| 3 | 6.69±0.38 | 8.91±0.64 | 79.224 | 0.001 |
| 6 | 6.49±0.53 | 9.06±0.82 | 63.134 | 0.001 |
| 12 | 6.57±0.41 | 8.44±0.59 | 61.039 | 0.001 |
| F-value | 0.257 | 1.965 |
|
|
| P-value | 0.856 | 0.139 |
|
|
In the serum, the overall differences in SOD and ET
levels in the 6 weeks subgroup was significantly lower and higher,
respectively, compared with the 1 and 3 weeks subgroups (all
P<0.05; Tables III–VI). The liver homogenate results were the
same as those in the serum.
| Table III.Comparison of SOD (pg/ml) levels in
the experimental animals (n=9 per group) in liver homogenate. |
Table III.
Comparison of SOD (pg/ml) levels in
the experimental animals (n=9 per group) in liver homogenate.
| Week | Sham group | Experimental
Group | F-value | P-value |
|---|
| 1 | 58.03±2.94 |
54.48±4.40c,d | 4.047 | 0.061 |
| 3 | 57.82±2.23 |
51.68±5.86c,d | 8.629 | 0.010 |
| 6 | 57.83±3.86 |
38.32±5.26a,b | 80.465 | 0.001 |
| 12 | 58.43±4.75 |
42.79±6.23a,b | 35.888 | 0.001 |
| F-value | 0.058 | 17.053 |
|
|
| P-value | 0.981 | 0.001 |
|
|
Correlations between MDA, SOD and ET
levels
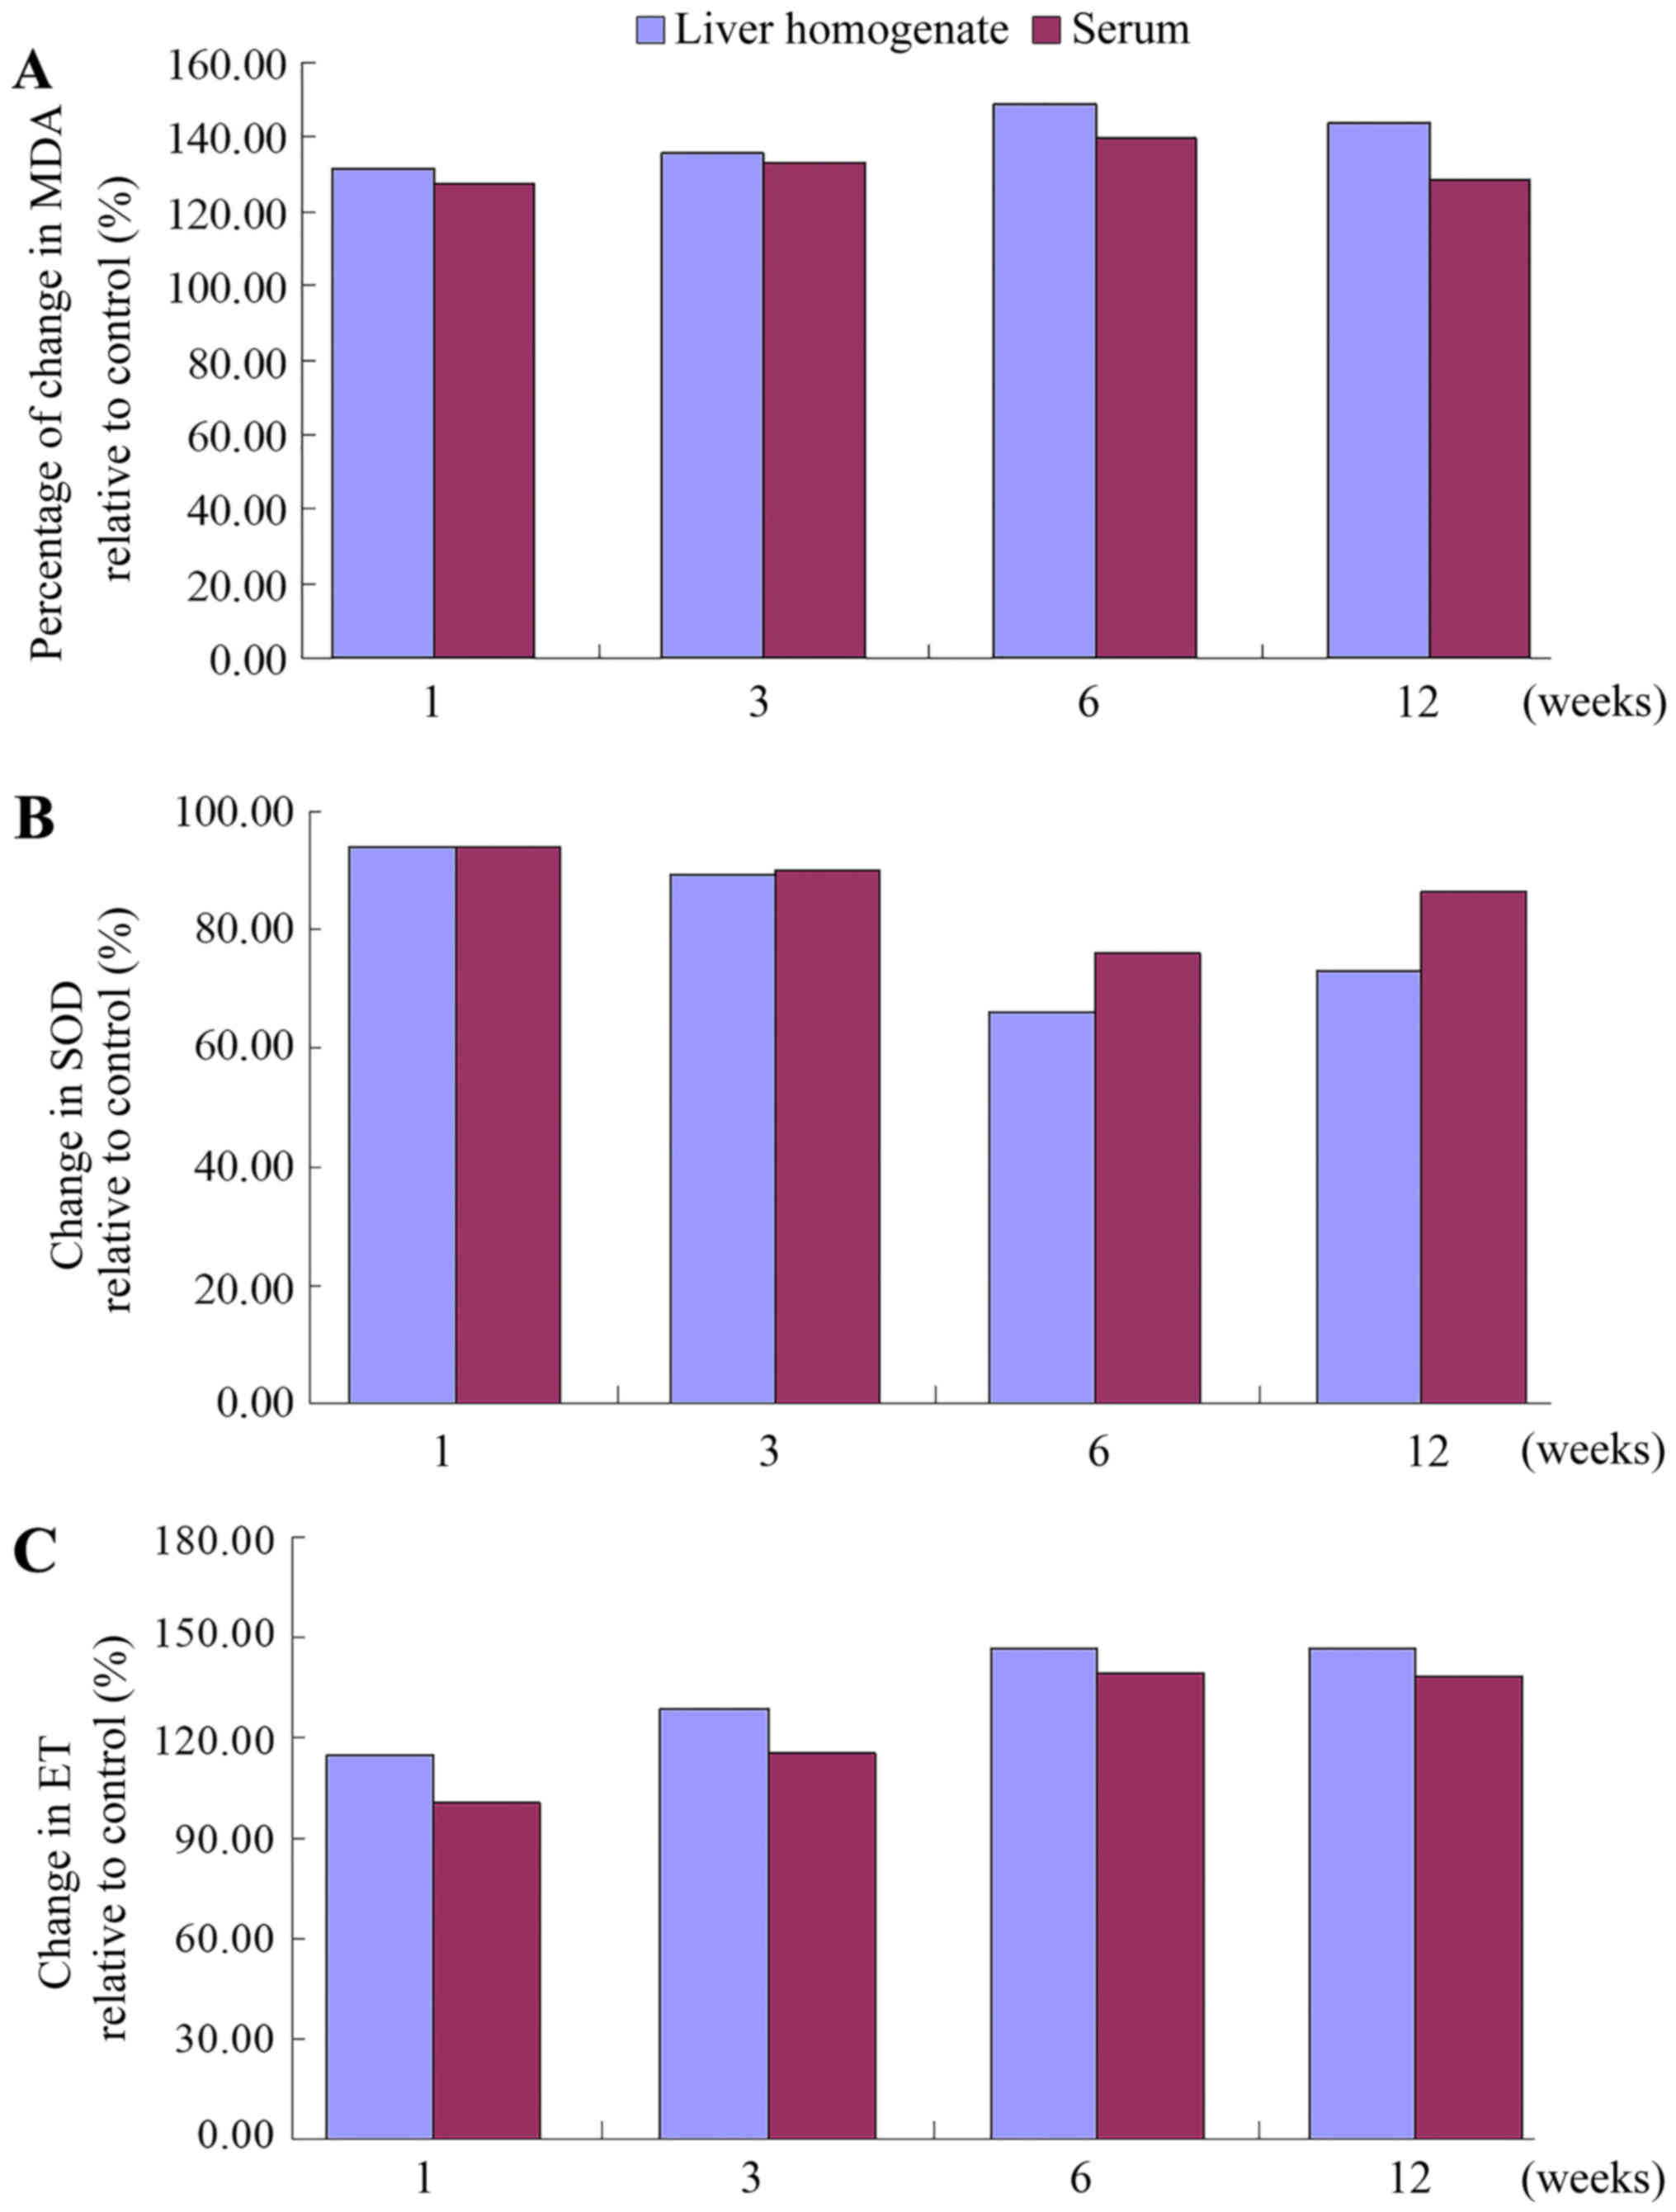
The time-dependent curves of MDA levels in the liver
homogenate and sera in the experimental group were similar to the
profiles recorded for the ET levels, all increasing from 1 week
post-operatively, reaching a peak by 6 weeks, with a slight
decrease by 12 weeks. The levels of MDA and ET in the experimental
group at 1, 3, 6 and 12 weeks were higher than those in sham group,
with a more pronounced increase rate (expressed data in
experimental group/sham group ×100% at each time-point) in the
liver homogenate than in the serum (Fig.
5). The time-dependent curves of the SOD levels in serum and
liver homogenate were similar, with a decrease at 1 week
post-operatively, reaching a valley by 6 weeks, prior to slightly
increasing by 12 weeks. The SOD levels in the experimental
subgroups were all lower than those in the sham group at each
time-point, and the rate of the decline (expressed data in
experimental group/sham group ×100% at each time-point) was higher
in the liver homogenate than in the serum.
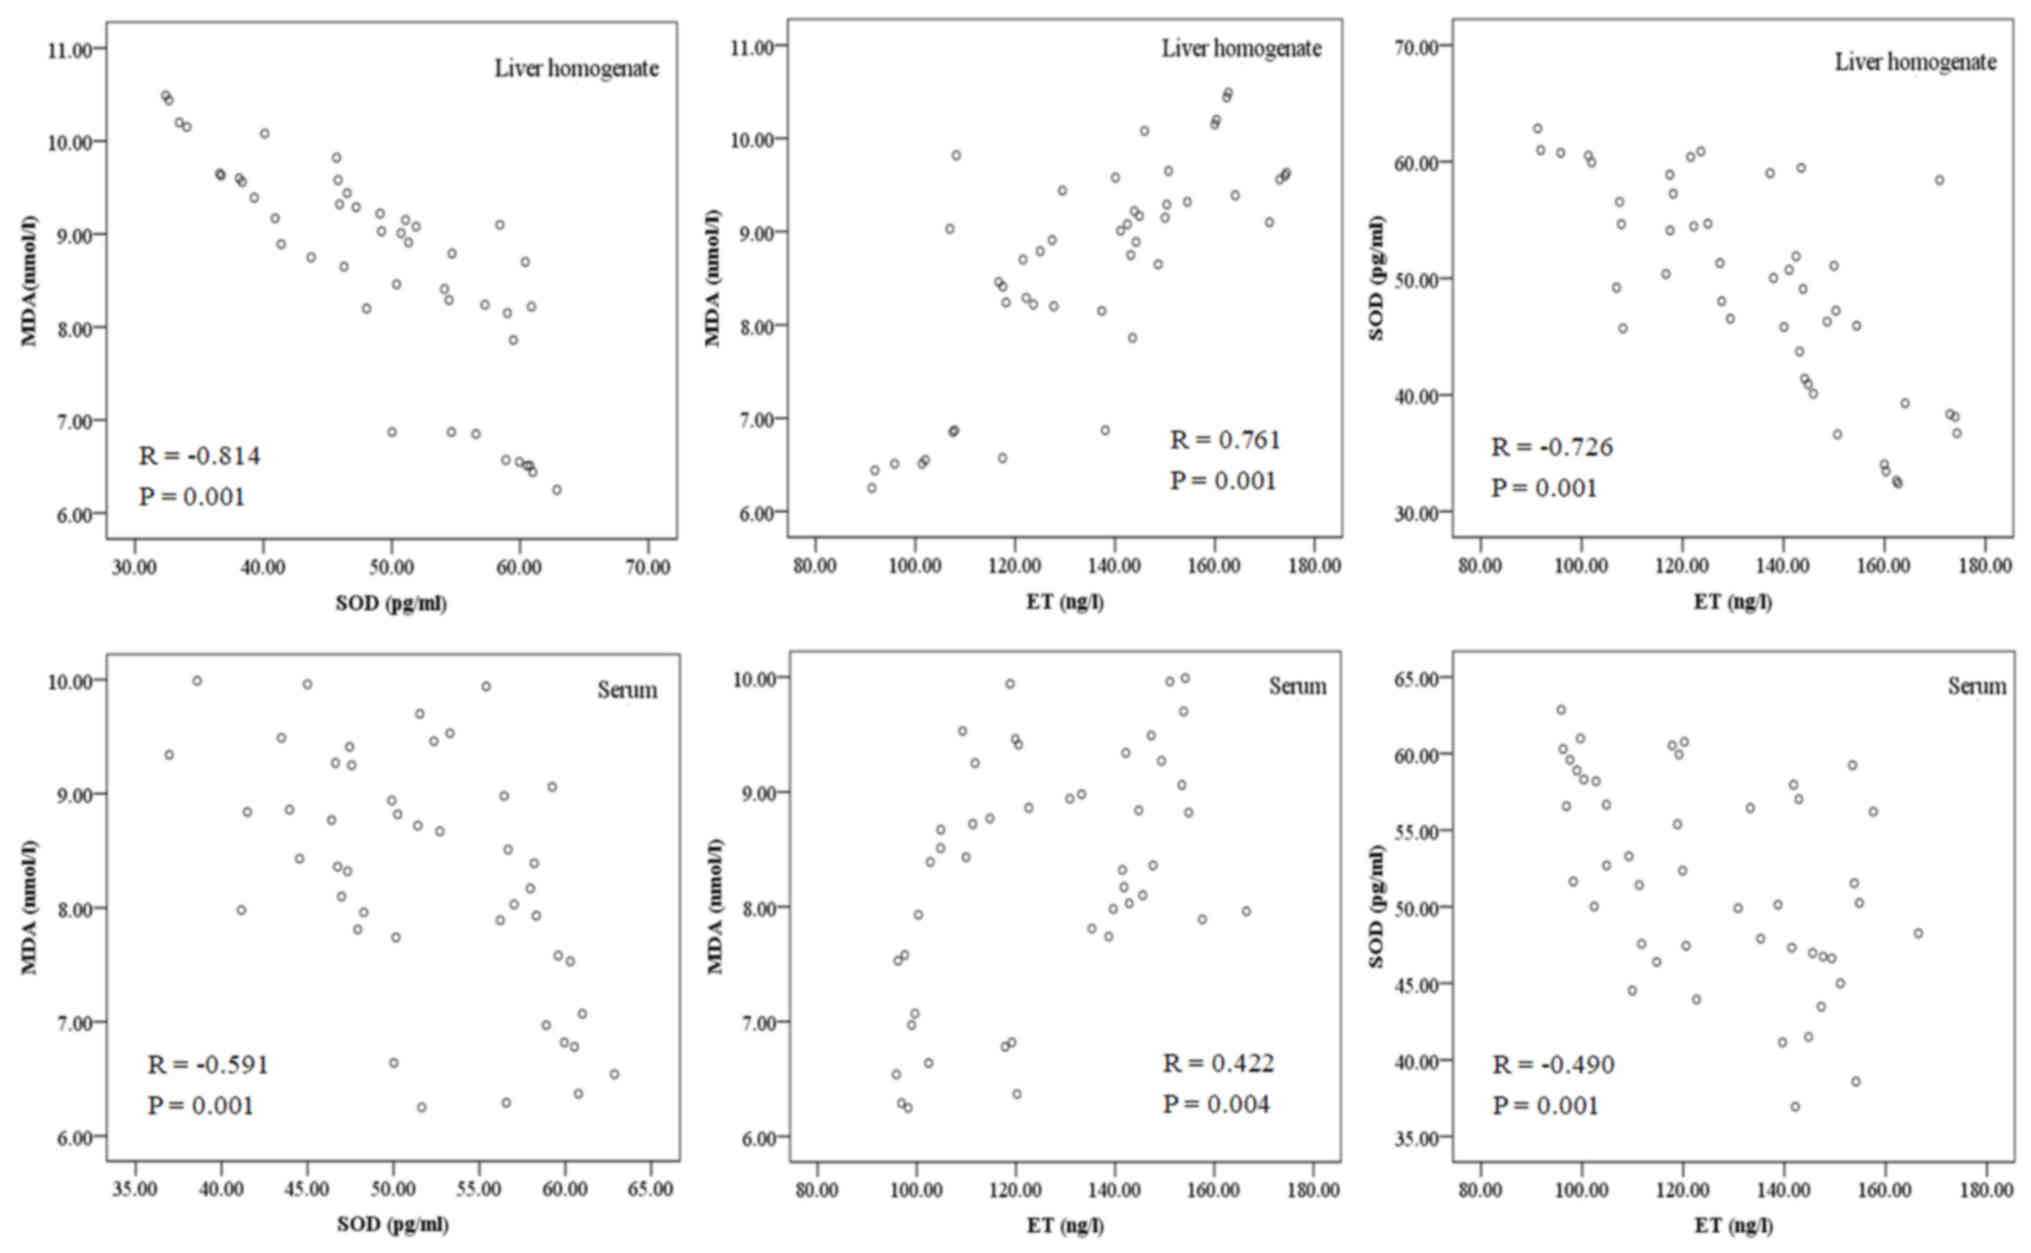
A negative correlation was determined between MDA
and SOD in the liver homogenate and serum (r=−0.814 and r=−0.591,
respectively; both P=0.001; Fig. 6),
while a positive correlation was identified between MDA and ET
(r=0.761 and r=0.422; P=0.004 and P=0.001, respectively), and a
negative correlation was determined between SOD and ET (r=−0.726
and r=−0.490, respectively; both P=0.001; Table VII and Fig. 6).
| Table VII.Correlation analysis of hypoxia
indicators. |
Table VII.
Correlation analysis of hypoxia
indicators.
| Correlation | MDA and SOD | MDA and ET | SOD and ET |
|---|
| Serum | R=−0.591,
P=0.001 | R=0.422,
P=0.004 | R=−0.490,
P=0.001 |
| Liver
homogenate | R=−0.814,
P=0.001 | R=0.761,
P=0.001 | R=−0.726,
P=0.001 |
Discussion
The body uses oxygen as an electron acceptor in
aerobic metabolism, producing ROS. ROS are closely associated with
most metabolic, physiological and pathological processes in the
body. When tissues are damaged by factors including ischemia and
hypoxia, excessive ROS are produced, leading to OS (19). Electron transfer systems to produce
ATP are the major source of ROS in the mitochondrial respiratory
chain complex (20). The fact that
the liver is rich in mitochondria makes it the major target organ
for ROS-induced damage (10,21). ROS have an important role in hepatic
injury caused by congestion, hypoxia, virus infection, alcohol and
poisoning (10–12). In early-stage BCS, disturbance of
hepatic vein reflux may cause liver ischemia and hypoxia.
Therefore, hypoxia may be the initiating factor of hepatic fibrosis
and cirrhosis in BCS. In the present study, changes in indicators
of hypoxia/OS were detected in BCS patients, and the results
demonstrated that their levels were significantly different from
those in healthy subjects, indicating that hypoxia/OS is associated
with BCS. Furthermore, an animal model was established to study
variations of these hypoxia-associated indicators in the
progression of BCS.
MDA is one of the most commonly used representative
indicators of OS injury (13). It is
able to activate Kupffer cells to secrete numerous cytokines,
activate hepatic stellate cells (HSC), and mediate HSC
differentiation, proliferation and collagen synthesis (22). Another indicator of OS injury is SOD,
which scavenges ROS, a representative of the body's antioxidant
system (13). The
increased/decreased levels of MDA/SOD in the experimental vs. those
in the control group indicated that the hepatic vein occlusion
induced intra- and extrahepatic lipid peroxidation injury. The
increase in the levels of MDA and the decrease in the levels of SOD
in liver homogenate were higher than those in the serum, which
suggested that the liver in BCS had severe OS damage. This is
mainly due to IVC obstruction of the hepatic vein outflow, leading
to hepatic vein and IVC reflux disorders, which in turn causes
obstacles in venous return to the liver in the lower extremities
and various organs in the pelvic cavity. Due to the large volume
directly located in the opening of the hepatic veins rich in
mitochondria (10,21), the liver suffers the heaviest degree
of damage, which is consistent with the BCS-associated liver damage
features that patients are clinically diagnosed with (1–3).
In the experimental group of the present study, MDA
levels increased first and then decreased, which may be due to the
direct oxidation of unsaturated fatty acids in the cell membrane to
generate MDA during liver congestion and hypoxia, changing the
fluidity and permeability of the cell membrane and leading to acute
injury (23). Due to the innate
antioxidant system, OS injury was not severe within the first three
weeks of surgery. After three weeks, as ROS directly oxidize
proteins, DNA and biological macromolecules, enzymes and
non-enzymatic antioxidants were consumed in large quantities,
aggravating the OS injury (24),
resulting in a hypoxic injury peak by 6 weeks. Thereafter, the
levels of oxidative stress declined, which may have been due to
collateral circulation and compensatory blood supply alleviating
the damage caused by ROS and the pressure of the portal vein.
However, the level of MDA was still significantly higher than that
of the control and sham groups, and the pathological liver damage
was aggravated, indicating that collateral circulation compensation
only temporarily alleviated OS damage, it did not fundamentally
solve the BCS congestion and hypoxia-associated injury (25). Therefore, only the removal of the IVC
obstruction was effective to treat the injury caused by congestion,
which also confirmed the necessity for IVC angioplasty
re-canalization in the clinical treatment of BCS (25,26).
In the present study, intra- and extrahepatic ET
levels in the experimental groups were higher than normal. The
levels of ET in the liver homogenate were higher than those in the
serum. This may be due to IVC obstruction directly leading to an
increased pressure of the portal vein, resulting in
gastrointestinal vein obstruction of blood backflow. In turn, this
results in severe intestinal capillary blood flow stasis, rendering
the intestine ischemic and hypoxic, leading to intestinal mucosal
barrier dysfunction, followed by the translocation of intestinal
bacteria and endotoxins (14,15). ET
entering the portal vein from the intestine is detoxified primarily
by liver Kupffer cells, making the liver the predominant organ for
ET aggregation (27). At one week
post-operatively, no significant change in ET levels was noted in
the experimental group. The reason for this may be that within the
first week post-operatively, ET is confined to the portal vein and
still in the clearance capacity range of the hepatic Kupffer cells,
so that ET levels in the serum do not significantly increase in the
short-term. However, the ET rapidly increased thereafter, which may
be due to persistent hypoxia and portal hypertension secondary to
IVC obstruction, causing the liver to gather excessive ET (14,15,27),
beyond the influence of detoxifying Kupffer cells after entering
the systemic circulation. The level of ET decreased slightly after
6 weeks, indicating that the initiation of the collateral
circulation temporarily relieved endotoxemia.
In the present study, the ET levels in the liver
homogenate and serum of BCS rats was positively correlated with MDA
levels and negatively correlated with SOD levels, suggesting that
ET may damage the liver through OS, which is supported by the
results of studies on other types of liver injury (16). This is due to ligation of the IVC
posterior to the liver resulting in an obstruction of outflow from
the hepatic veins and IVC, leading to hepatic congestion and
hypoxia, resulting in the production of a large number of ROS,
which may activate hypoxia-inducible factor (HIF)-1, nuclear factor
(NF)-κB, and various cytokines, consequently activating HSC to
cause hepatic fibrosis (22).
Furthermore, after ligation of the IVC, the portal pressure
continues to rise and large amounts of ET enter the blood system.
The ET degradation product lipid A inhibits ATP synthesis,
affecting mitochondrial energy synthesis and respiratory chain
electron transport, and inducing the generation of ROS, which in
turn aggravates liver injury (14).
In addition, ET enhances the expression of CD14 and Toll-like
receptor 4 in Kupffer cells, inducing the production of a large
number of cytokines, including tumor necrosis factor-α. This may
increase the inflammatory reaction (17), which increases intrahepatic
resistance and splanchnic blood flow, leading to further increases
in venous pressure, hepatic venous congestion and hypoxia (15). These results demonstrate that after
IVC ligation posterior to the liver, a self-aggravating cycle of
congestion, hypoxia-induced ROS and rising ET levels was generated.
This may be the mechanism of the sustained liver injury observed in
BCS patients, and may explain why BCS patients have a low clinical
self-healing capacity.
The results of the present study indicate that IVC
obstruction in BSC rats increases hypoxia-associated ROS and ET
levels, leading to OS and endotoxemia, which may be the dominant
causes of BCS-associated liver injury. However, how hypoxia induces
the activation of nuclear transcription factors (HIF-1α, HIF-2α and
NF-κB) and regulates the expression of downstream target genes,
which in turn influence the integrity of the extracellular matrix,
angiogenesis, growth factors and their receptors, and the molecular
mechanisms that eventually lead to congestive cirrhosis, remain to
be fully elucidated and should be further investigated.
In conclusion, in the early stages of BCS, reflux
disorders of the hepatic vein and IVC cause congestion and hypoxia,
particularly in the liver. With disease progression, congestion and
hypoxia tended to worsen, but were slightly relieved with the
emergence of collateral circulation during the later stages, while
they still remained at levels that were higher than normal. Thus,
hypoxia is a common factor that is involved during all stages of
BCS, and may be the principal factor in the initiation and
aggravation of BCS.
Acknowledgements
Not applicable.
Funding
This project was supported by Natural Science
Foundation of Anhui Province (grant no. 1708085QH218).
Availability of data and materials
The datasets used and/or analyzed during the current
study are available from the corresponding author on reasonable
request.
Authors' contributions
D-LC, NZ and C-TL designed the study. D-LC, W-WF,
C-LL performed the experiments. D-LC, NZ and YL collected and
analyzed the data. W-WF, NZ and C-LL contributed to sample
collection and inputted the data into the computer. D-LC and NZ
drafted and wrote the manuscript. W-FL, C-LL and C-TL gave advice
on the experimental design, interpreted the results and critically
revised the manuscript. All authors read and approved the final
version of the manuscript.
Ethics approval and consent to
participate
The present study was approved by the Ethics Review
Committee at Anhui Provincial Hospital. All procedures were
performed in accordance with the ethical standards of the
responsible committee on human experimentation (institutional and
national) and with the Helsinki Declaration of 1975, as revised in
2008 (5). Informed consent was
obtained from all patients for being included in the study.
Patient consent for publication
Not applicable.
Competing interests
The authors declare that they have no competing
interests.
References
|
1
|
Martens P and Nevens F: Budd-Chiari
syndrome. United European Gastroenterol J. 3:489–500. 2015.
View Article : Google Scholar : PubMed/NCBI
|
|
2
|
Aydinli M and Bayraktar Y: Budd-Chiari
syndrome: Etiology, pathogenesis and diagnosis. World J
Gastroenterol. 13:2693–2696. 2007. View Article : Google Scholar : PubMed/NCBI
|
|
3
|
Pavri TM, Herbst A, Reddy R and Forde KA:
Budd-Chiari syndrome: A single-center experience. World J
Gastroenterol. 20:16236–16244. 2014. View Article : Google Scholar : PubMed/NCBI
|
|
4
|
Akamatsu N, Sugawara Y and Kokudo N:
Budd-Chiari syndrome and liver transplantation. Intractable Rare
Dis Res. 4:24–32. 2015. View Article : Google Scholar : PubMed/NCBI
|
|
5
|
Bayraktar UD, Seren S and Bayraktar Y:
Hepatic venous outflow obstruction: Three similar syndromes. World
J Gastroenterol. 13:1912–1927. 2007. View Article : Google Scholar : PubMed/NCBI
|
|
6
|
Maleki M, Vakilian F and Amin A: Liver
diseases in heart failure. Heart Asia. 3:143–149. 2011.PubMed/NCBI
|
|
7
|
Fouad YM and Yehia R: Hepato-cardiac
disorders. World J Hepatol. 6:41–54. 2014. View Article : Google Scholar : PubMed/NCBI
|
|
8
|
Waseem N and Chen PH: Hypoxic hepatitis: A
review and clinical update. J Clin Transl Hepatol. 4:263–268.
2016.PubMed/NCBI
|
|
9
|
Debevec T, Millet GP and Pialoux V:
Hypoxia-induced oxidative stress modulation with physical activity.
Front Physiol. 8:842017. View Article : Google Scholar : PubMed/NCBI
|
|
10
|
Li S, Tan HY, Wang N, Zhang ZJ, Lao L,
Wong CW and Feng Y: The role of oxidative stress and antioxidants
in liver diseases. Int J Mol Sci. 16:26087–26124. 2015. View Article : Google Scholar : PubMed/NCBI
|
|
11
|
Feng Y, Wang N, Ye X, Li H, Feng Y, Cheung
F and Nagamatsu T: Hepatoprotective effect and its possible
mechanism of Coptidis rhizoma aqueous extract on carbon
tetrachloride-induced chronic liver hepatotoxicity in rats. J
Ethnopharmacol. 138:683–690. 2011. View Article : Google Scholar : PubMed/NCBI
|
|
12
|
Singal AK, Jampana SC and Weinman SA:
Antioxidants as therapeutic agents for liver disease. Liver Int.
31:1432–1448. 2011. View Article : Google Scholar : PubMed/NCBI
|
|
13
|
Bajpai J, Prakash V, Kant S, Verma AK,
Srivastava A, Bajaj DK, Ahmad MK and Agarwal A: Study of oxidative
stress biomarkers in chronic obstructive pulmonary disease and
their correlation with disease severity in north Indian population
cohort. Lung India. 34:324–329. 2017. View Article : Google Scholar : PubMed/NCBI
|
|
14
|
Xu H, Xiong J, Xu J, Li S, Zhou Y, Chen D,
Cai X, Ping J, Deng M and Chen J: Mosapride stabilizes intestinal
microbiota to reduce bacterial translocation and endotoxemia in
CCl4-induced cirrhotic rats. Dig Dis Sci. 62:2801–2811.
2017. View Article : Google Scholar : PubMed/NCBI
|
|
15
|
Zhao TY, Su LP, Ma CY, Zhai XH, Duan ZJ,
Zhu Y, Zhao G, Li CY, Wang LX and Yang D: IGF-1 decreases portal
vein endotoxin via regulating intestinal tight junctions and plays
a role in attenuating portal hypertension of cirrhotic rats. BMC
Gastroenterol. 15:772015. View Article : Google Scholar : PubMed/NCBI
|
|
16
|
Abdel-Salam OME, Morsy SMY and Sleem AA:
The effect of different antidepressant drugs on oxidative stress
after lipopolysaccharide administration in mice. EXCLI J.
10:290–302. 2011.PubMed/NCBI
|
|
17
|
Miao CM, He K, Li PZ, Liu ZJ, Zhu XW, Ou
ZB, Ruan XZ, Gong JP and Liu CA: LXRα represses LPS-induced
inflammatory responses by competing with IRF3 for GRIP1 in Kupffer
cells. Int Immunopharmacol. 35:272–279. 2016. View Article : Google Scholar : PubMed/NCBI
|
|
18
|
Akiyoshi H and Terada T: Centrilobular and
perisinusoidal fibrosis in experimental congestive liver in the
rat. J Hepatol. 30:433–43. 1999. View Article : Google Scholar : PubMed/NCBI
|
|
19
|
Kuksal N, Chalker J and Mailloux RJ:
Progress in understanding the molecular oxygen paradox-function of
mitochondrial reactive oxygen species in cell signaling. Biol Chem.
398:1209–1227. 2017. View Article : Google Scholar : PubMed/NCBI
|
|
20
|
Kadlec AO, Beyer AM, Ait-Aissa K and
Gutterman DD: Mitochondrial signaling in the vascular endothelium:
Beyond reactiveoxygen species. Basic Res Cardiol. 111:262016.
View Article : Google Scholar : PubMed/NCBI
|
|
21
|
Sánchez-Valle V, Chávez-Tapia NC, Uribe M
and Méndez-Sánchez N: Role of oxidative stress and molecular
changes in liver fibrosis: A review. Curr Med Chem. 19:4850–4860.
2012. View Article : Google Scholar : PubMed/NCBI
|
|
22
|
Cong T, Jin XY, Zhao L, Ma L, Li RS, Zhao
P and Guo CJ: Anti-fibrotic effects of the Masson pine pollen
aqueous extract on hepatic fibrosis rat model. Int J Clin Exp
Pathol. 8:4651–4661. 2015.PubMed/NCBI
|
|
23
|
Sharma A, Sharma MK and Kumar M:
Modulatory role of Emblica officinalis fruit extract against
arsenic induced oxidative stress in Swiss albino mice. Chem Biol
Interact. 180:20–30. 2009. View Article : Google Scholar : PubMed/NCBI
|
|
24
|
Anavi S, Ni Z, Tirosh O and Fedorova M:
Steatosis-induced proteins adducts with lipid peroxidation products
and nuclear electrophilic stress in hepatocytes. Redox Biol.
4:158–168. 2015. View Article : Google Scholar : PubMed/NCBI
|
|
25
|
Fu Y, Sun YL, Ma XX, Xu PQ, Feng LS, Tang
Z, Guan S, Wang ZW and Luo CH: Necessity and indications of
invasive treatment for Budd-Chiari syndrome. Hepatobiliary Pancreat
Dis Int. 10:254–60. 2011. View Article : Google Scholar : PubMed/NCBI
|
|
26
|
Qi XS, Ren WR, Fan DM and Han GH:
Selection of treatment modalities for Budd-Chiari Syndrome in
China: A preliminary survey of published literature. World J
Gastroenterology. 20:10628–10636. 2014. View Article : Google Scholar
|
|
27
|
Thomas P, Hayashi H, Lazure D, Burke PA,
Bajenova O, Ganguly A and Forse RA: Inhibition of LP-S activation
of Kupffer cells by transition metals. J Surg Res. 148:116–120.
2008. View Article : Google Scholar : PubMed/NCBI
|