Introduction
Osteoarthritis (OA) is characterized by excessive
production of cytokines and metalloproteinases, resulting in the
degeneration of articular cartilage tissue (1). During the last century, it was believed
that human osteoarthritis was a ‘wear-and-tear’ mechanically-driven
focal musculoskeletal disorder associated with aging, and no
medical treatment provided a ‘cure’, aside from arthroplasty
(2). However, over 10 years ago,
when Pelletier et al (3)
re-conceptualized OA as an arthritis joint disease, its
inflammation was deemed ‘non-classic’. OA can occur in any joint,
but predominantly occurs in the knees, hips, hands and spine
(4). The main features of OA are
joint cavity stenosis, subchondral bone remodeling, synovitis and
cartilage degeneration (5). OA is
the most common type of arthritis, and its incidence is associated
with age, sex, obesity and joint injury (6). The incidence of OA is increasing
(7). Therefore the demand for
diagnosis and treatment of the disease is also increasing.
Matrix metalloproteinase (MMP)-1 and MMP-13, and A
disintegrin and metalloproteinase with thrombospondin motifs
(ADAMTS)-4 and ADAMTS-5 can degrade the extracellular cartilage
matrix (8). During joint development
in adults, chondrocytes promote the mineralization of cartilage
through a final differentiation step, similar to the process of
bone f formation (9).
Pro-inflammatory cytokines are vital mediators that lead to
metabolic disorder and increased catabolism of joint tissue
associated with OA (10).
Interleukin (IL)-1β, tumor necrosis factor-α (TNF-α) and IL6 are
considered to be the major pro-inflammatory cytokines involved in
the pathophysiology of OA (11).
Vitamin D has been well researched for its effects
on calcium metabolism, and has also been reported to have a
significant immunomodulatory effect. For instance, treatment of
dendritic cells (DCs) with 1,25-dihydroxyvitamin D3
[1,25(OH)2D3] (vitD3) inhibited lipopolysaccharide
(LPS)-induced inflammation (12).
LPS has been demonstrated to promote DC maturation, which generates
tolerogenic DCs (tolDCs), a maturation-resistant form of the cells
with tolerogenic function (11,13).
Characteristics of tolDCs include high expression of co-stimulatory
molecules and major histocompatibility complex (MHC) class II, and
low production of pro-inflammatory cytokines, such as IL-12, IL-6
and TNF-α (14). tolDCs have been
increasingly studied as a cell-based treatment and have produced
promising results in mouse models of autoimmune diseases, including
diabetes and inflammatory arthritis (15). They can induce and maintain
peripheral T cell tolerance through multiple mechanisms, including
induction of T cell deletion, anergy, cytokine deviation and
induction of regulatory T cells (Tregs) (16). In the current study, DCs from
patients with OA were treated with dexamethasone (Dex)/vitD3 and
their phenotype and function as tolDCs was assessed to determine
whether the protein kinase B (Akt) and p38 mitogen-activated
protein kinase (MAPK) signaling pathways were involved in the
induction of tolDCs when stimulated with Dex and vitD3.
Materials and methods
Patients
A total of 30 patients with OA (57–75 years old)
were enrolled in the study, of which 17 were female and 13 male.
The OA subjects were diagnosed according to the Western Ontario
McMaster University Osteoarthritis Index (17), and the study was conducted by the
First Affiliated Hospital of Anhui Medical University, Hefei,
China. Clinical and laboratory examinations were performed after
obtaining informed written consent from the OA patients from
January 2017 to January 2018. The inclusion criteria for the
diagnosis of OA were as follows: i) ~1 month of repeated joint pain
with >15 incidents of knee pain; ii) having bone fricative; iii)
morning stiffness lasting <30 min; iv) age at diagnosis >38
years; v) presentation of bony enlargement(s). Subjects exhibited
some associated complications, including joint pain, tenderness,
stiffness, joint effusion, limited mobility, joint deformities and
local inflammation of varying degrees; this was in accord with the
general characteristics of OA (17).
Excluded patients were those with rheumatoid arthritis or
gout-induced arthritis. The patients were not receiving any
treatments prior to diagnosis. The study was approved by the Ethics
Committee of Anhui Medical University.
Generation of Dex/vitD3-treated
DCs
Peripheral blood mononuclear cells (PBMCs) and
cluster of differentiation CD14+ monocytes were
separated from 5 ml fresh venous blood by density centrifugation
using Ficoll-Paque (GE Healthcare Life Sciences, Shanghai, China)
and magnetic microbeads (Miltenyi Biotec GmbH, Bergisch Gladbach,
Germany), respectively. In the presence of 50 ng/ml
granulocyte-macrophage colony-stimulating factor and 25 ng/ml IL-4
(PeproTech, Inc., Rocky Hill, NJ, USA), monocyte-derived immature
DCs were produced by culture of monocytes at 1×10⁶
cells/ml for 7 days, and the medium was refreshed or pretreatment
performed on day 4. Mature DCs were generated by addition of 100
ng/ml LPS (Sigma-Aldrich; Merck KGaA, Darmstadt, Germany) on day 6
for 24 h (DC + LPS). Dex/vitD3-DCs were generated by adding 1 µM
Dex to DCs on day 4, and 1 µM Dex plus 0.1 nM vitD3 on day 5,
followed by addition of 100 ng/ml LPS on day 6 for 24 h. Cells were
cultured in RPMI-1640 medium (Hyclone; GE Healthcare Life Sciences,
Logan, UT, USA) containing 10% fetal bovine serum (FBS, Gibco;
Thermo Fisher Scientific, Inc., Waltham, MA, USA), 2 mM glutamine,
and 1% penicillin and streptomycin at 37°C with 5%
CO2.
DC-T cell co-culture experiments
CD4+ naive T cells
(CD4+CD45RA+CD45RO−) were
separated using an Untouched CD4+ T Cell kit (Miltenyi
Biotec GmbH). A total of 1×10⁵ autologous DCs were
co-cultured with 1×10⁶ autologous naive T cells (1:10)
in six well plates from the same individual. Cells were cultured in
RPMI-1640 containing 10% FBS, 2 mM glutamine, and 1% penicillin and
streptomycin at 37°C with 5% CO2 for 5 days. Assessment
of T cell proliferation was performed with 1 µCi/well
[3H]-thymidine in the last 16 h of culture using
scintigraphy (PerkinElmer, Inc., Waltham, MA, USA).
T cell differentiation
CD4+ naive T cells (1×10⁶)
were co-cultured with 1×10⁵ autologous DCs in 1 ml of
X-vivo 15 medium (Lonza Group, Ltd., Basel, Switzerland) for 6 days
at 37°C with 5% CO2. Recombinant human IL-2 (rhIL-2; 20
U/ml; cat. no. CTP0021; Thermo Fisher Scientific, Inc.) was added
on day 6, and cells were cultured for a further 6 days. T cells
were collected after 12 days, then washed, and their cellular
functions were analyzed. T cells co-cultured with immature DCs were
termed T [DC], co-cultured with mature DCs as T [DC + LPS],
co-cultured with Dex/vitD3-DCs as T [DC + Dex/vitD3] and
co-cultured with LPS-induced Dex/vitD3-DCs as T [DC + Dex/vitD3 +
LPS].
T cell proliferation and
suppression
To assess the ability of these T cells to inhibit
proliferation and/or cytokine generation, allogeneic mature DCs
(10:1; 1×10⁴ T cells: 1×10³ DCs) were used to
stimulate CD4+ naive T cells with or without autologous
T [DC], T [DC + LPS], T [DC + Dex/vitD3)] or T [DC + Dex/vitD3 +
LPS)] cells (1:1 ratio) in a final volume of 200 µl RPMI-1640
containing 10% FBS in 96-well plates. Neutralizing anti-IL-10
receptor (IL-10R; 1:200 dilution; cat. no. 556012; BD Biosciences,
San Jose, CA, USA), anti-IL-10 (1:200 dilution; cat. no. 554703; BD
Pharmingen; BD Biosciences) or anti-transforming growth factor-β
(TGF-β; 1:300 dilution; cat. no. MAB1835-100; R&D Systems,
Inc., Minneapolis, MN, USA) monoclonal antibodies were added into
cultures. Cells were cultured at 37°C with 5% CO2 for 5
days with 1 µCi/well [3H]-thymidine was added to the
cultures in the last 16 h for measurement of proliferation by
scintigraphy.
Chondrocyte isolation and
identification
Cartilage specimens were acquired from the femoral
condyles of the aformentioned patients with knee OA that had
undergone total knee arthroplasty between January 2017 and 2018.
The fragments were washed thoroughly in Dulbecco's modified Eagle's
medium (DMEM; Thermo Fisher Scientific, Inc.) containing 1%
penicillin/streptomycin solution (Sigma-Aldrich; Merck KGaA), then
samples were cut into small pieces and digested with various
enzymes. The tissue pieces were treated with 0.1% hyaluronidase for
20 min, 0.5% pronase for 1 h and 0.2% collagenase for 1 h (Gibco;
Thermo Fisher Scientific, Inc.) at 37°C. Subsequently, the cell
suspension was filtered through a 100-µm Celltrics filter (EMD
Millipore, Billerica, MA, USA), washed and then centrifuged at 200
× g for 10 min at 4°C. Human primary chondrocytes were cultured
with DMEM containing 10% FBS at 37°C in a 5% CO2
incubator for 2 weeks. The culture medium was replenished every 5
days. Chondrocytes were seeded on glass coverslips in 6-well plates
at 1×10⁵ cells/well and then harvested. The sections
were washed 2–3 times, and then were stained with 1% toluidine blue
for 10 min at room temperature, and then observed under an optical
microscope. The coverslips with the chondrocytes were fixed with 4%
(v/v) paraformaldehyde for 30 min at 37°C, then permeablized with
0.1% Triton X-100 for 20 min at room temperature, washed three
times and incubated with anti-collagen II antibody (1:300 dilution;
cat. no. Ab34712; Abcam, Cambridge, MA, USA) overnight at 4°C. The
subsequent day, horseradish peroxidase-labeled secondary antibodies
(1:100; cat. no. A0208; Beyotime Institute of Biotechnology,
Haimen, China) was added for 1 h at 37°C. This was followed by
immunostaining with 3,3-diaminobenzidine tetrahydrochloride for 1–3
min at room temperature. The coverslips were counterstained with
hematoxylin for 30–60 sec at room temperature, and then rinsed
under light running water. Images of these cells were captured at
×200 magnification in light microscope (Olympus IX73; Olympus
Corporation, Tokyo, Japan).
DC-chondrocyte or T cell-chondrocyte
co-culture experiments
An aliquot of first generation chondrocytes was
seeded in 24-well plates at 5×10⁴ cells per well. Cells
cultured with 20 ng/ml TNF-α for 12 h were rinsed, and co-cultured
with the autologous DC or Tregs at a ratio of 10:1 (chondrocytes:
DC or T cells) in DMEM containing 10% FBS at 37°C in a 5%
CO2 incubator for 24 h.
Flow cytometry
DCs or T cells were incubated with Human TruStain
FcX™ (Fc Receptor Blocking Solution; Miltenyi Biotec GmbH) for 10
min, and then with primary antibodies on ice for 30 min. Human
leukocyte antigen-antigen D related-phycoerythrin (HLA-DR-PE; cat.
no. 560943), CD86-fluorescein isothiocyanate (FITC; cat. no.
560958), CD40-peridinin chlorophyll protein complex-cyanin 5
(Pe-Cv5; cat. no. 560963), CD83-allophycocyanin and isotypic
controls (APC; cat. no. 561960; all BD Biosciences) were used for
flow cytometry. The intracellular cytokine profile was assessed
using the monoclonal antibodies interferon-γ (IFN-γ)-FITC (cat. no.
552882), FoxP3-Alexa-647 (cat. no. 561184), IL-10-PE (cat. no.
559330) and IL-17-PE (cat. no. 560486; all BD Biosciences). A total
of 1×10⁶ cells were permeabilized and fixed using 30 µl
cytofix/cytoperm buffers (eBioscience; Thermo Fisher Scientific,
Inc.) for 30 min at 4°C. Then the cells were resuspended in 200 µl
antibody solution (1:200) and 30 µl 1X Perm/Wash buffer (cat. no.
554723; BD Biosciences). The cells were incubated with the
antibodies for 30 min at 4°C and wash twice in 200 µl 1X Perm/Wash
Buffer. Golgistop (1:1,500 dilution; cat. no. 554724; BD
Biosciences) was added at 37°C in a 5% CO2 incubator for
4–6 h. Samples were analyzed by flow cytometry (BD FACSCalibur; BD
Biosciences) and results were analyzed using FlowJo software 7.6.2
(FlowJo LLC, Ashland, OR, USA).
Phospho flow cytometry
Cells (1×10⁶) were fixed with 4%
paraformaldehyde for 15 min at 37°C, then washed three times,
permeabilized with cytofix/cytoperm buffers for 30 min on ice and
stained with either anti-Akt (pS473)-Alexa Fluor® 488
(cat. no. 560404) or with anti-p38 MAPK (pT180/pY182)-Alexa Fluor
647 (cat. no. 612595; both 1:200; BD Biosciences) for 30 min at
4°C. Flow cytomery analysis was performed as previously
described.
ELISA
Supernatants were harvested from DC cultures, DC or
T cell-chondrocyte co-cultures and stored at −80°C for subsequent
cytokine measurements. Cytokines concentations were measured by
ELISA using the following kits: human TNF-α (cat. no. DTA00C),
human TGF-β (cat. no. DB100B), human IL1β (cat. no. DLB50), human
IL-6 (cat. no. D6050), human IL-10 kit (cat. no. D1000B), MMP-1
(cat. no. DMP100) and MMP-13 (cat. no. DM1300; all R&D Systems,
Inc.) according to the manufacturer's protocol. Absorbance was
determined using a Thermo Scientific Microplate Reader (Thermo
Fisher Scientific, Inc.).
Reverse transcription-quantitative
polymerase chain reaction (RT-qPCR)
Total RNAs were extracted from DC-primed naive T
cells using TRIzol® Reagent (Sigma-Aldrich; Merck KGaA).
First-strand cDNAs were then synthesized using a
SuperScript® III Reverse Transcriptase kit (Invitrogen;
Thermo Fisher Scientific, Inc.) and then converted into cDNA on a
Mastercycler® nexus (Eppendorf, Hamburg, Germany) using
a PrimeScript® RT reagent kit (Takara Bio, Inc., Otsu,
Japan), according to the manufacturer's protocol. qPCR was
conducted using SYBR Green PCR Master mix (with Rox; Invitrogen;
Thermo Fisher Scientific, Inc.) on LightCycler® 480
(Roche Diagnostics, Basel, Switzerland). β-actin was used as an
internal reference for mRNA expression. Primer sequences were as
follows: T-box 21 (T-bet), forward, 5′-GGTAACATGCCAGGGAACAGGA-3′
and reverse, 5′-TGGTCTATTTTTAGCTGGGTGATGTCTG-3′; GATA binding
protein 3 (Gata-3), forward, 5′-CCAAAAACAAGGTCATGTTCAGAAGG-3′ and
reverse, 5′-TGGTGAGAGGTCGGTTGATATTGTG-3′; forkhead box P3 (Foxp3),
forward, 5′-GCAACCAGCCTTTTCCACAAGC-3′ and reverse,
5′-GACTATATGGATGCTTCCCAGTA-3′; RAR related orphan receptor γ 2
(RORγt), forward, 5′-ACCTCCACTGCCAGCTGTGTGCTGTC-3′ and reverse,
5′-TCATTTCTGCACTTCTGCATGTAGACTGTCCC-3′; ADAMTS-4, forward,
5′-TGCCGCTAAAGCCTTTAAACACAGCCA-3′ and reverse,
5′-AGAAGCTGCGTAGGGTCTGG-3′; ADAMTS-5, forward,
5′-CAAGCGTTTAATGTCTTCAATCCTTA-3′ and reverse,
5′-ACTGCTGGGTGGCATCGT-3′; β-actin, forward
5′-CTCCATCCTGGCCTCGCTGT-3′ and reverse, 5′-GCTGTCACCTTCACCGTTCC-3′.
The primers were purchased from Sangon Biotech Co., Ltd. (Shanghai,
China). The PCR reaction conditions were: 95°C for 5 min, followed
by 35 cycles of denaturation at 95°C for 15 sec and
annealing/elongation at 55°C for 30 sec. Results were computed
using the 2−ΔΔCq method with normalization to β-actin
(18).
Western blotting
Following the aforementioned treatments,
1×10⁶ cells were seeded in 6-well plates and washed with
ice-cold phosphate-buffered saline, and then suspended in 150 µl
radioimmunoprecipitation assay lysis buffer (Beyotime Institute of
Biotechnology). The protein concentration was determined using a
bicinchoninic acid assay kit (Beyotime Institute of Biotechnology).
An equal quantity of protein (40 µg) was loaded per lane and
separated using 10% SDS-PAGE, followed by transfer to
nitrocellulose membranes. Subsequently, the membranes were blocked
with 5% skim milk for 2 h at room temperature, then incubated with
rabbit anti-Akt (phospho S473; cat. no. ab81283), rabbit
anti-p38MAPK (phospho T180 + Y182; cat. no. ab4822) or rabbit
anti-Akt (cat. no. ab8805; Abcam) and rabbit anti-p38MAPK (cat. no.
ab170099; all 1:1,000; Abcam) primary antibodies overnight at 4°C.
Following three washes with tris-buffered saline-Tween solution,
the membranes were incubated with horseradish peroxidase-labeled
goat anti-rabbit immunoglobulin G (1:5,000; cat. no. A0208;
Beyotime Institute of Biotechnology) for 1 h at room temperature.
Finally, bands were detected using enhanced chemiluminescence
reagents (Wuhan Boster Biological Technology, Ltd., Wuhan, China)
on Amersham Imager 600 System (GE Healthcare Life Sciences).
Protein expression levels were analyzed with Image-Pro Plus
software 6.0 (Media Cybernetics, Inc., Rockville, MD, USA).
Statistical analysis
All data in the present study are expressed as mean
± standard error of the mean. Statistical analysis was conducted
using SPSS 19.0 (IBM Corp., Armonk, NY, USA). Statistical
significance was determined by one-way analysis of variance with
Bonferroni post-hoc tests. P-values are presented for individual
experiments and four repetitions of each experiment were conducted.
P<0.05 was considered to indicate a statistically significant
difference.
Results
DCs generated from OA samples
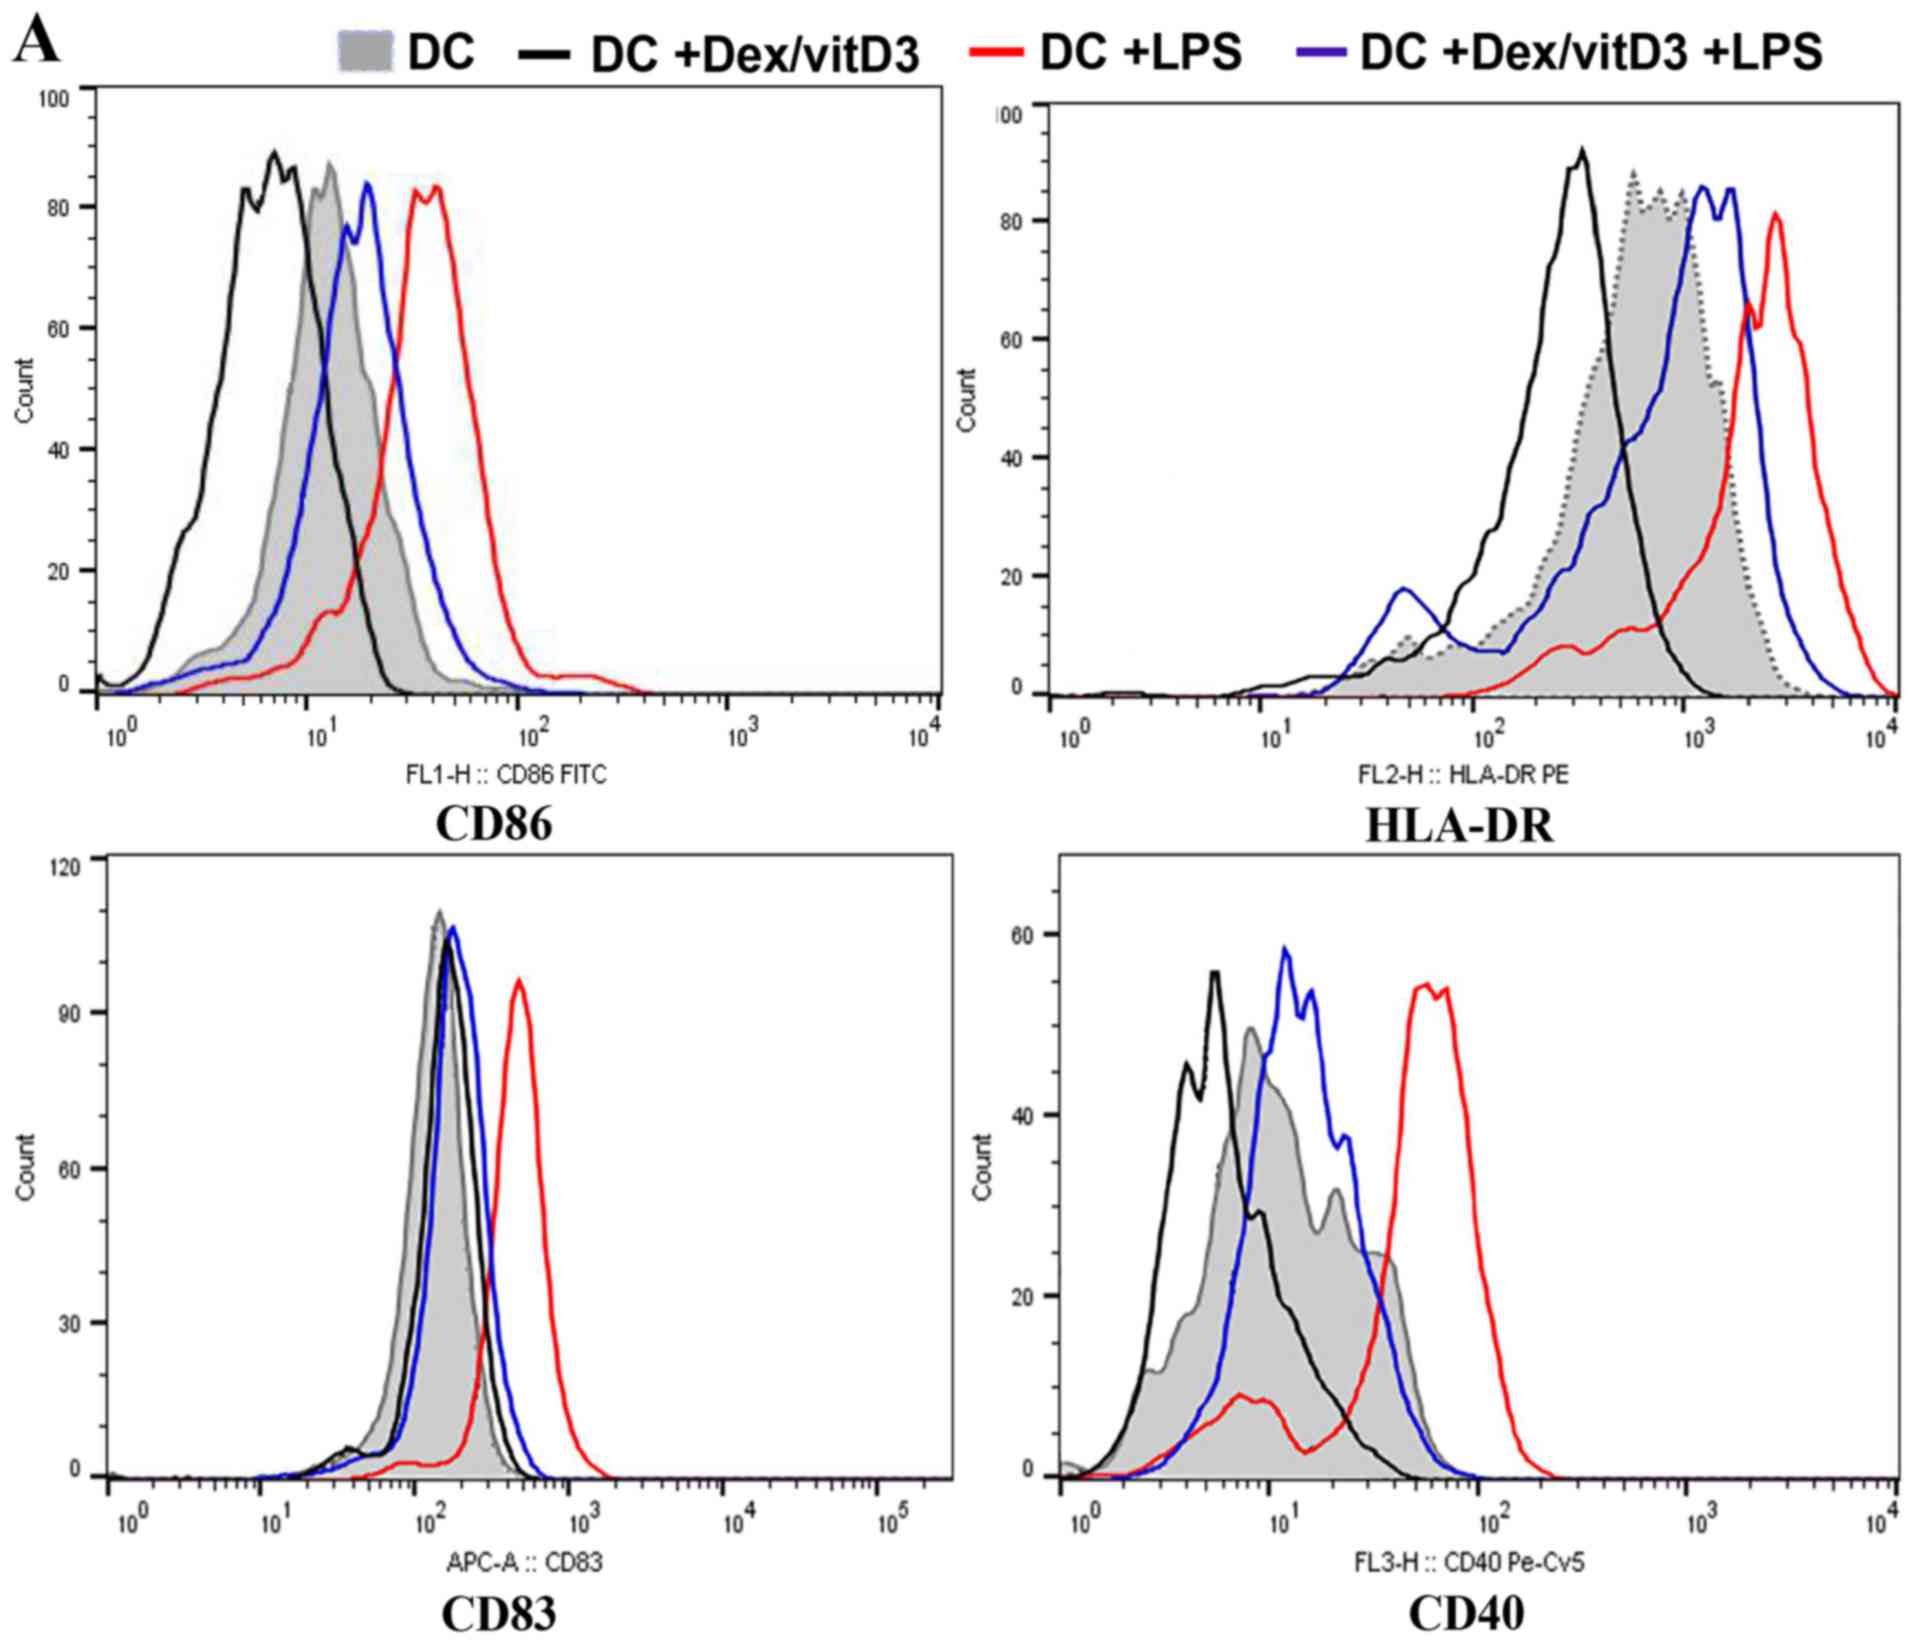
Expression of co-stimulatory molecules and
maturation markers (CD86, CD83, CD40 and HLA-DR) in Dex/vitD3-DCs
obtained from patients with OA was determined by flow cytometry. In
the presence of Dex/vitD3, the upregulation of co-stimulatory
molecules induced by LPS stimulation was abrogated (Fig. 1A). Dex/vitD3-DCs expressed markedly
lower CD83 than mature DCs. These findings indicated that the
Dex/vitD3-DCs had a semi-mature phenotype. Similar results were
observed in Dex/vitD3-DCs from normal subjects (data not shown). In
order to characterize the effect of Dex/vitD3 on DC function, the
generation of cytokines by DCs was analyzed. DCs induced by LPS,
when compared with untreated immature DCs (the DC group), the LPS +
DC group exhibited increased secretion of TNF-α (389±34 vs. 27±9
pg/ml, respectively; n=16; P<0.01), IL-1β (486±35 vs. 31±9
pg/ml, respectively; n=16; P<0.01) and IL-6 (585±66 vs. 27±11
pg/ml, respectively; n=16; P<0.01; Fig. 1B-D). A low amount of IL-10 was
detected in the DC group and the LPS + DC group (25±5 and 34±5
pg/ml, respectively; n=16). The DC + Dex/vitD3 + LPS group
significantly inhibited the production of TNF-α (107±14 pg/ml),
IL-1β (102±20 pg/ml) and IL-6 (135±32 pg/ml; n=16; P<0.01;
Fig. 1B-D). However, IL-10 (202±17
vs. 26±5 pg/ml, respectively; n=16; P<0.01; Fig. 1E) significantly increased secretion
in the Dex/vitD3 + DC group compared with the DC group.
Additionally, IL-10 production in the DC + Dex/vitD3 + LPS group
was significantly inhibited compared with the DC + Dex/vitD3 group
(58±11 pg/ml; n=16; P<0.01). Notably, compared with the DC
group, the LPS + DC group slightly and significantly increased
TGF-β (62±14 vs. 26±8 pg/ml, respectively; n=16; P<0.05)
secretion, and Dex/vitD3 potentiated this production to 190±31
pg/ml compared with the LPS + DC group (n=16; P<0.01; Fig. 1F).
Dex/vitD3-DCs attenuate autologous T
cell proliferation
To assess the proliferation of autologous T cells
when cultured with Dex/vitD3-DCs, the thymidine incorporation assay
were performed. Compared with DC-T cell co-cultures, LPS + DC
increased autologous T cell proliferation (n=6; P<0.01; Fig. 1G). When compared with the LPS + DC
group, the proliferation of autologous T cell in the
DC+Dex/vitD3+LPS group was signifcantly reduced (n=6; P<0.01;
Fig. 1G).
Dex/vitD3-DCs reduce the
differentiation of naive T cells to Th1 and Th17 cells, and induce
differentiation to IL-10 producing cells
The mRNA level of transcription factors that serve
as markers of Th1 (T-bet), Th2 (Gata-3), Th17 (RORγt) and Treg
(Foxp3) cell differentiation were determined by RT-qPCR in
DC-primed naive T cells. Compared with T cells stimulated by mature
DCs (DC + LPS), T cells primed by DC + Dex/vitD3 + LPS exhibited
significantly lower T-bet (n=6; P<0.01; Fig. 2A). No significance was identified in
Gata3 mRNA expression between the DC, DC + LPS and DC + Dex/vitD3 +
LPS groups (n=6; Fig. 2B). Compared
with the DC + LPS group, the DC + Dex/vitD3 + LPS group exhibited
significantly lower RORγt mRNA expression and higher Foxp3 levels
(n=6; P<0.01; Fig. 2C and D).
Compared with the DC group, intracellular staining of T cells
following stimulation with DC + LPS revealed a considerable
proportion of the T-cells were IFN-γ- and IL-17-producing cells
(n=6; P<0.01; Fig. 2E and F).
When Dex/vitD3 were added in the DC + LPS group, the percentage of
IL-10- and FoxP3-producing cells decreased significantly compare
with the DC + Dex/vitD3 group (n=6; P<0.01). Compared with T
cells in the DC group, T cells stimulated by DC + Dex/vitD3, termed
T [DC + Dex/vitD3], contained a significantly greater proportion of
IL-10-producing cells (n=6; P<0.01) and had slightly and
significantly increased expression of Foxp3 (n=6; P<0.01).
However, the DC + Dex/vitD3 + LPS group also exhibited a decreased
proportion of IL-10- and Foxp3-producing T cells compared with the
DC + Dex/vitD3 group (n=6; P<0.01; Fig. 2E and F). These results demonstrated
that OA Dex/vitD3-DCs inhibited the activation and proliferation of
naive T cells. Naive T cells differentiated into IL-10-producing
effector cells and the pro-inflammatory phenotype was reduced.
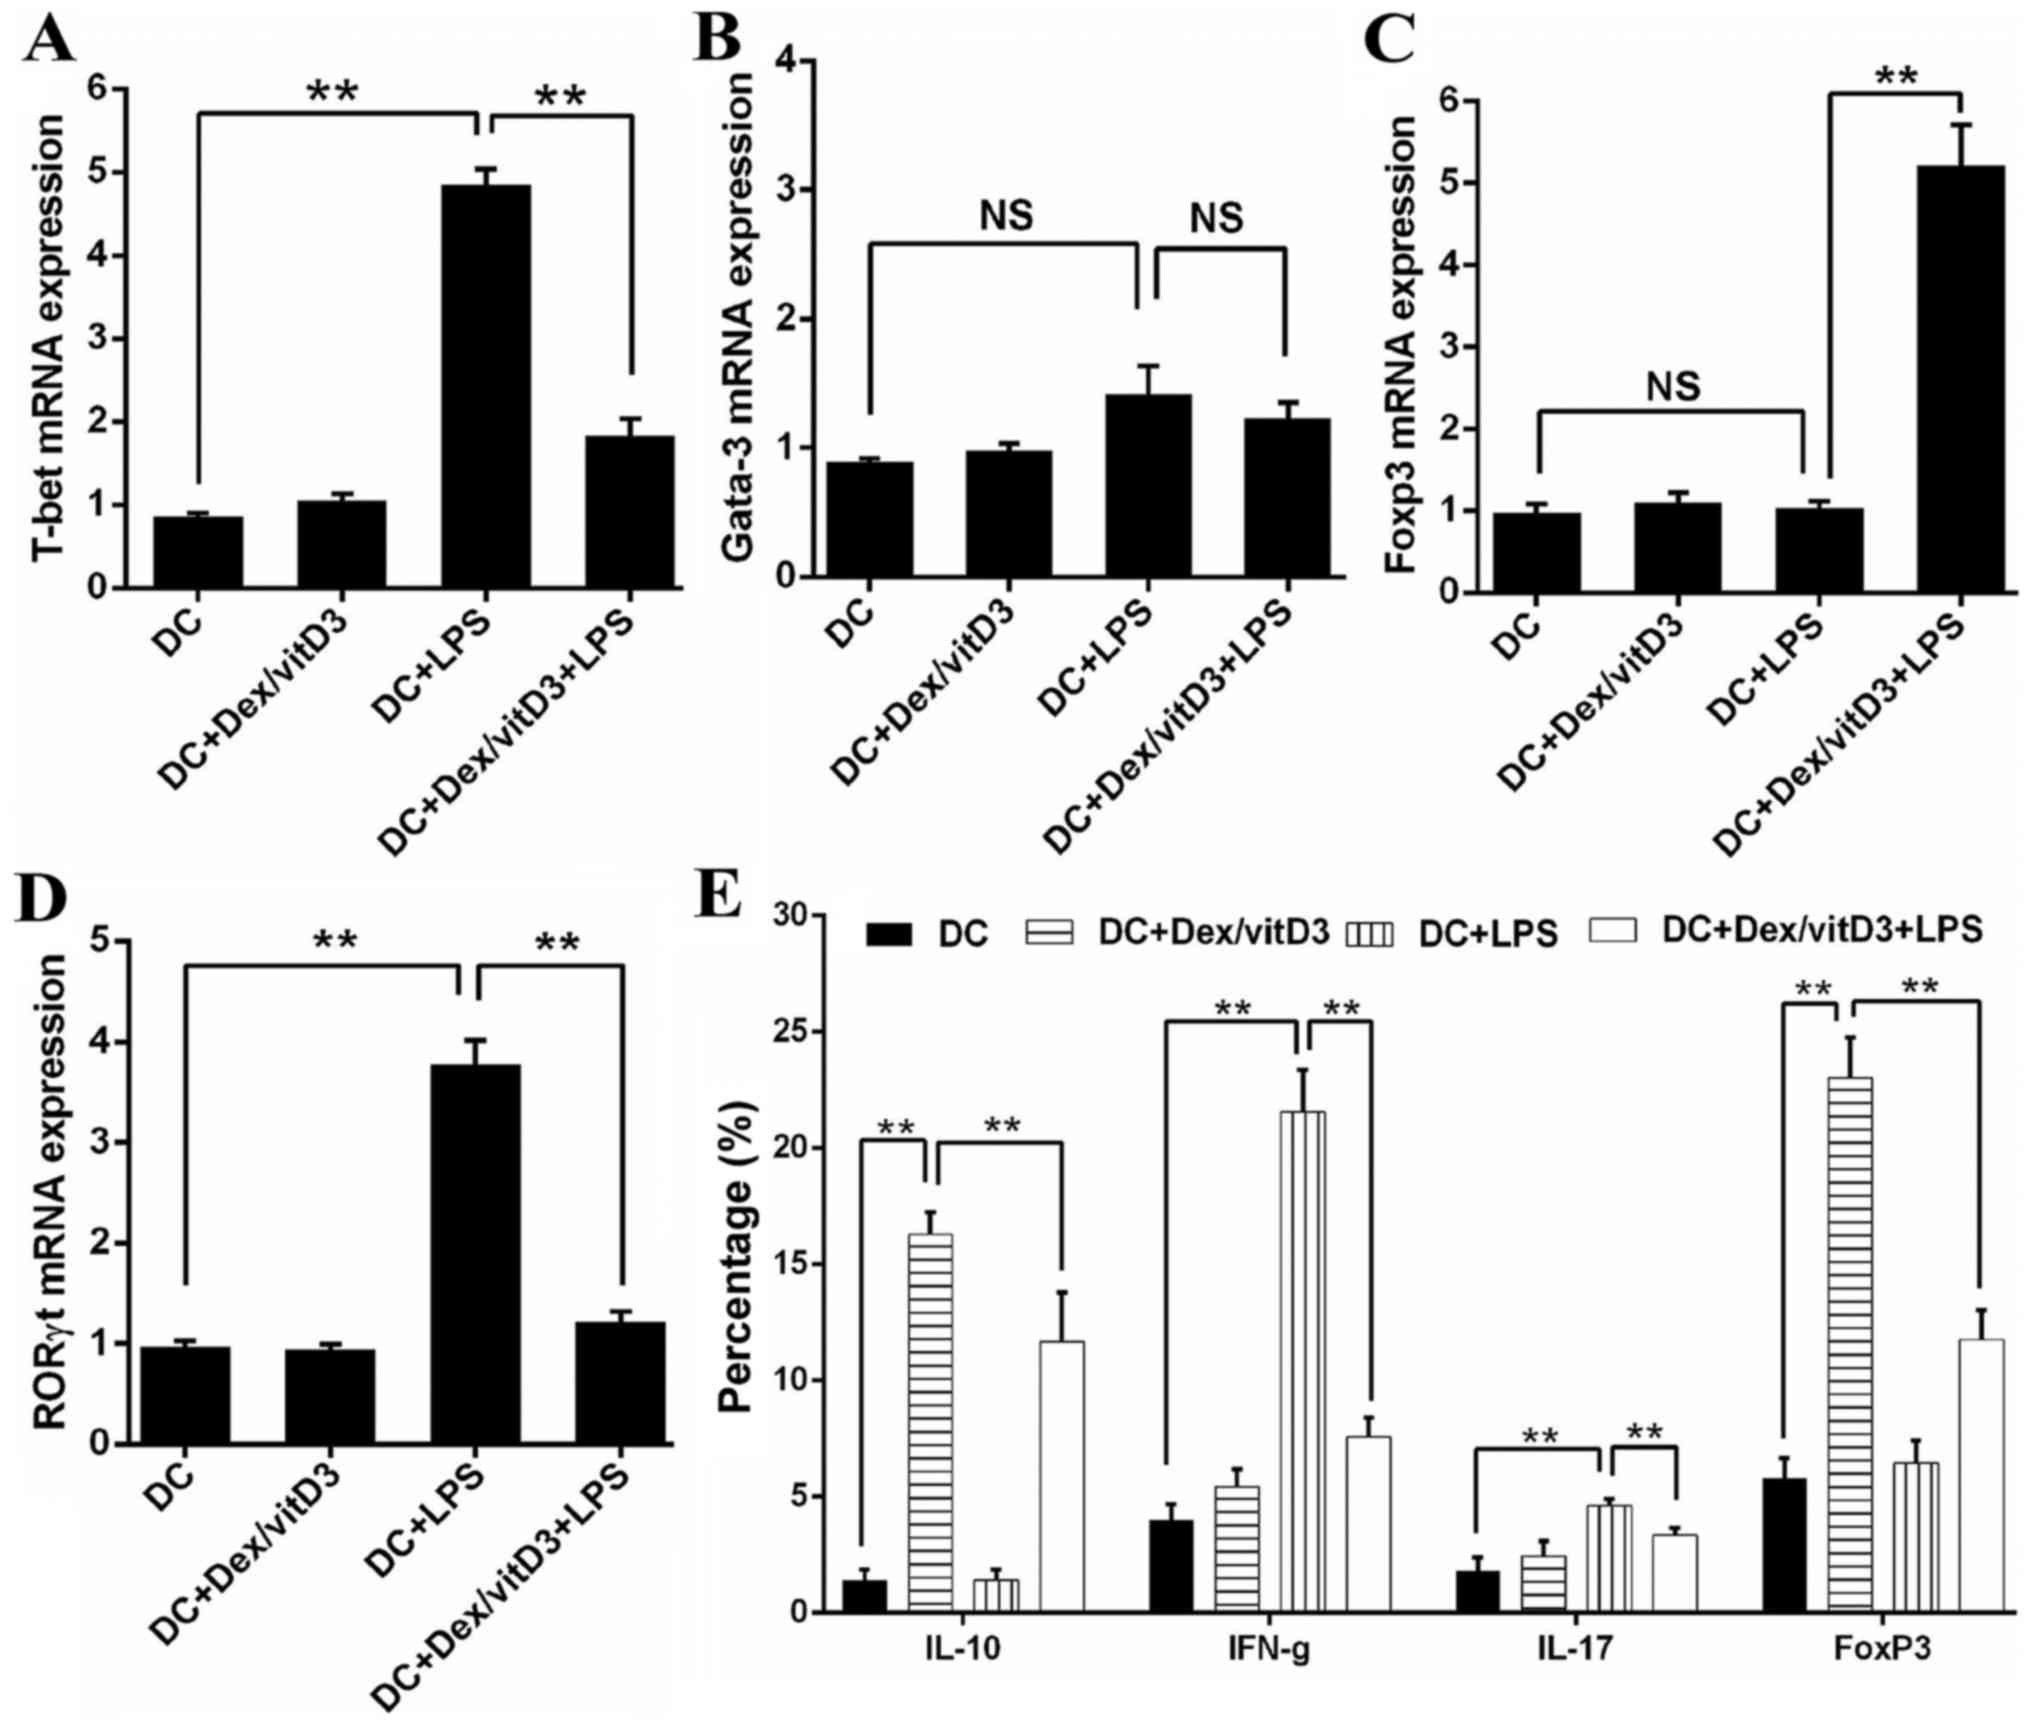 | Figure 2.Dex/vitD3-treated DCs induce the
generation of IL-10-producing T cells. (A-D) The mRNA levels of T
cell polarized transcription factors (including T-bet, Gata-3,
RORγt and Foxp3) were detected. Results are presented as the mean
concentration ± standard error of the mean of six independent
experiments. (E) Summary of six independent experiments. (F)
Intracellular staining of cytokine production assessed by flow
cytometry. These data provided the percentage of IFN-γ-, IL-17- and
IL-10-producing cells in T [DC], T [DC + LPS] or T [DC + Dex/vitD3
+ LPS] cells. A representative experiment out of six is presented.
**P<0.01. Dex, dexamethasone; vitD3, vitamin D3; DC, dendritic
cell; IL, interleukin; T-bet, T-box 21; Gata-3, GATA binding
protein 3; RORγt, RAR related orphan receptor γ 2; Foxp3, forkhead
box P3; LPS, lipopolysaccharide; IFN-γ, interferon-γ; T, T
cells. |
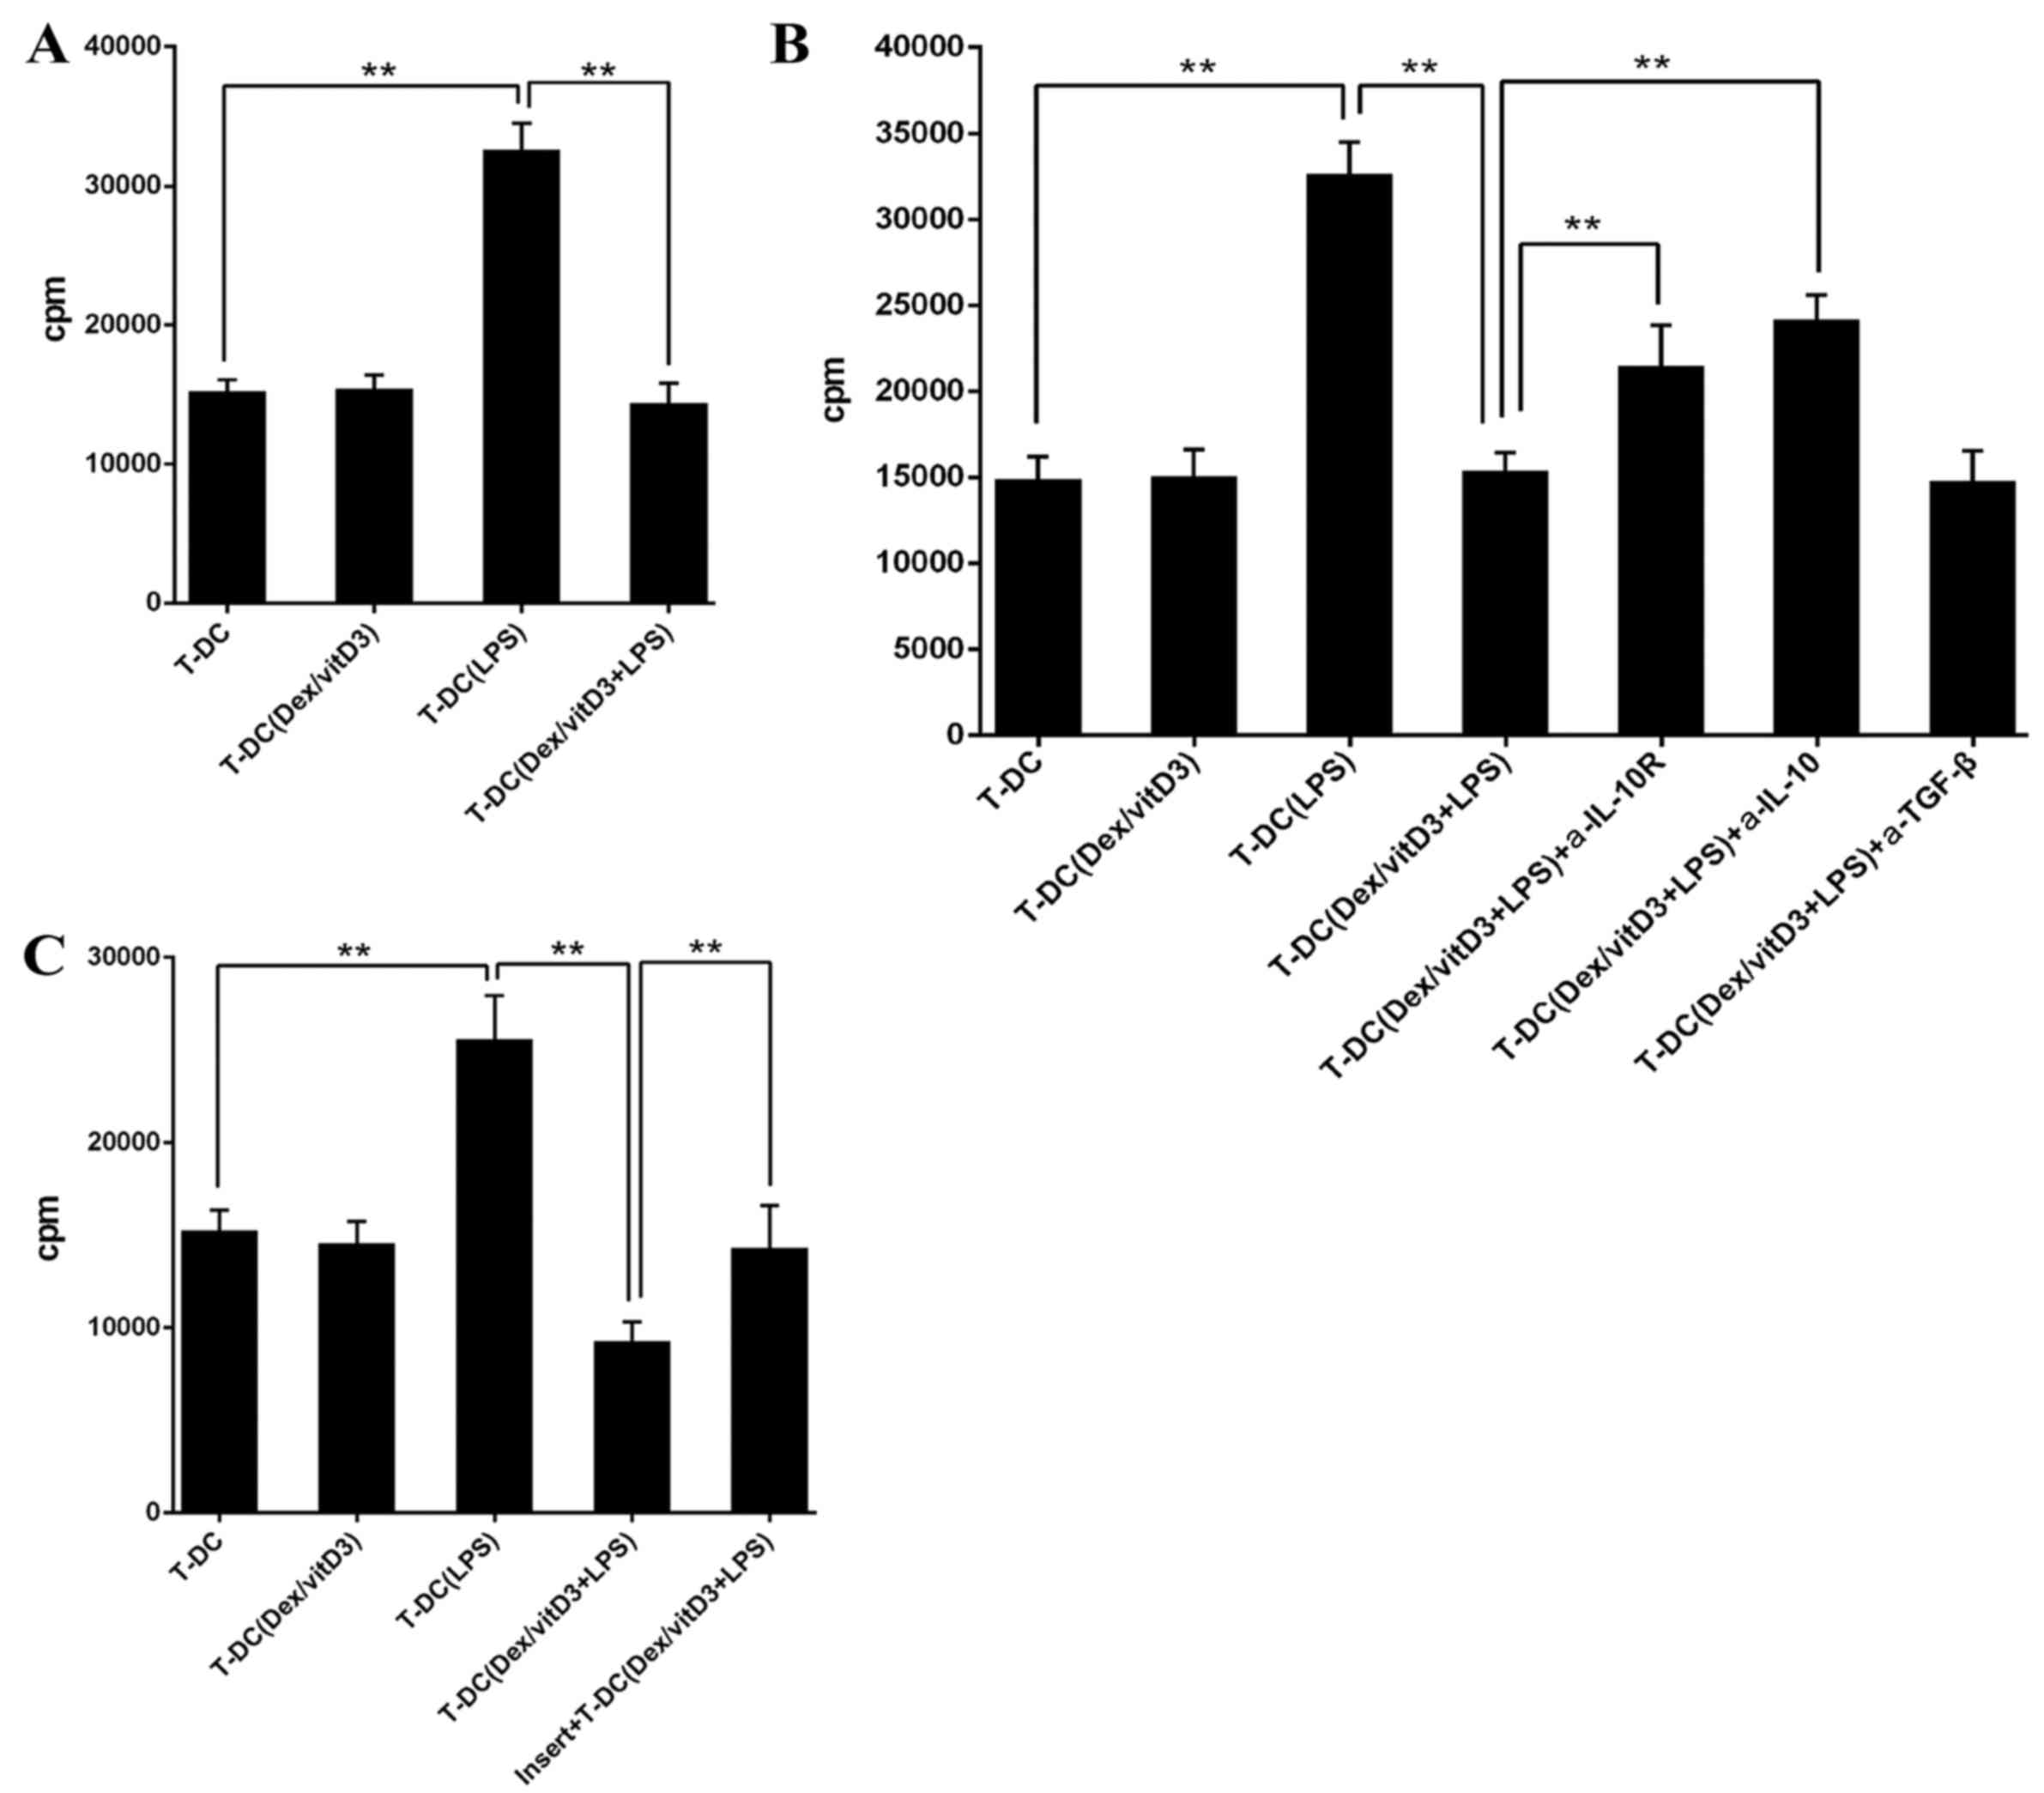
Dex/vitD3-DCs induce IL-10-producing T
cells with regulatory functions
Following the addition of T [DC + Dex/vitD3 + LPS]
cells in a 10:1 ratio, the proliferation of naive CD4+ T
cells stimulated with mature DCs was markedly decreased compared
with the T-DC group (n=6; P<0.01; Fig. 3A). Therefore, T cells stimulated with
LPS + DC inhibited the responses of naive T cells. The addition of
neutralizing anti-IL-10R or anti-IL-10 monoclonal antibodies
diminished the suppression on T cell proliferation caused by T-DC
[Dex/vitD3 + LPS] cells compared with the T-DC (Dex/vitD3 +
LPS)+IL-10R group or the T-DC (Dex/vitD3 + LPS) + IL-10 group
(P<0.01; Fig. 3B). In addition,
T-DC [Dex/vitD3 + LPS] cells required cell-cell contact for their
suppressive activity, which was confirmed in the thymidine
incorporation assays (n=6; P<0.01; Fig. 3C). Together, these results indicated
that T cells stimulated by Dex/vitD3-DCs exhibited function
equivalent to that of Tregs.
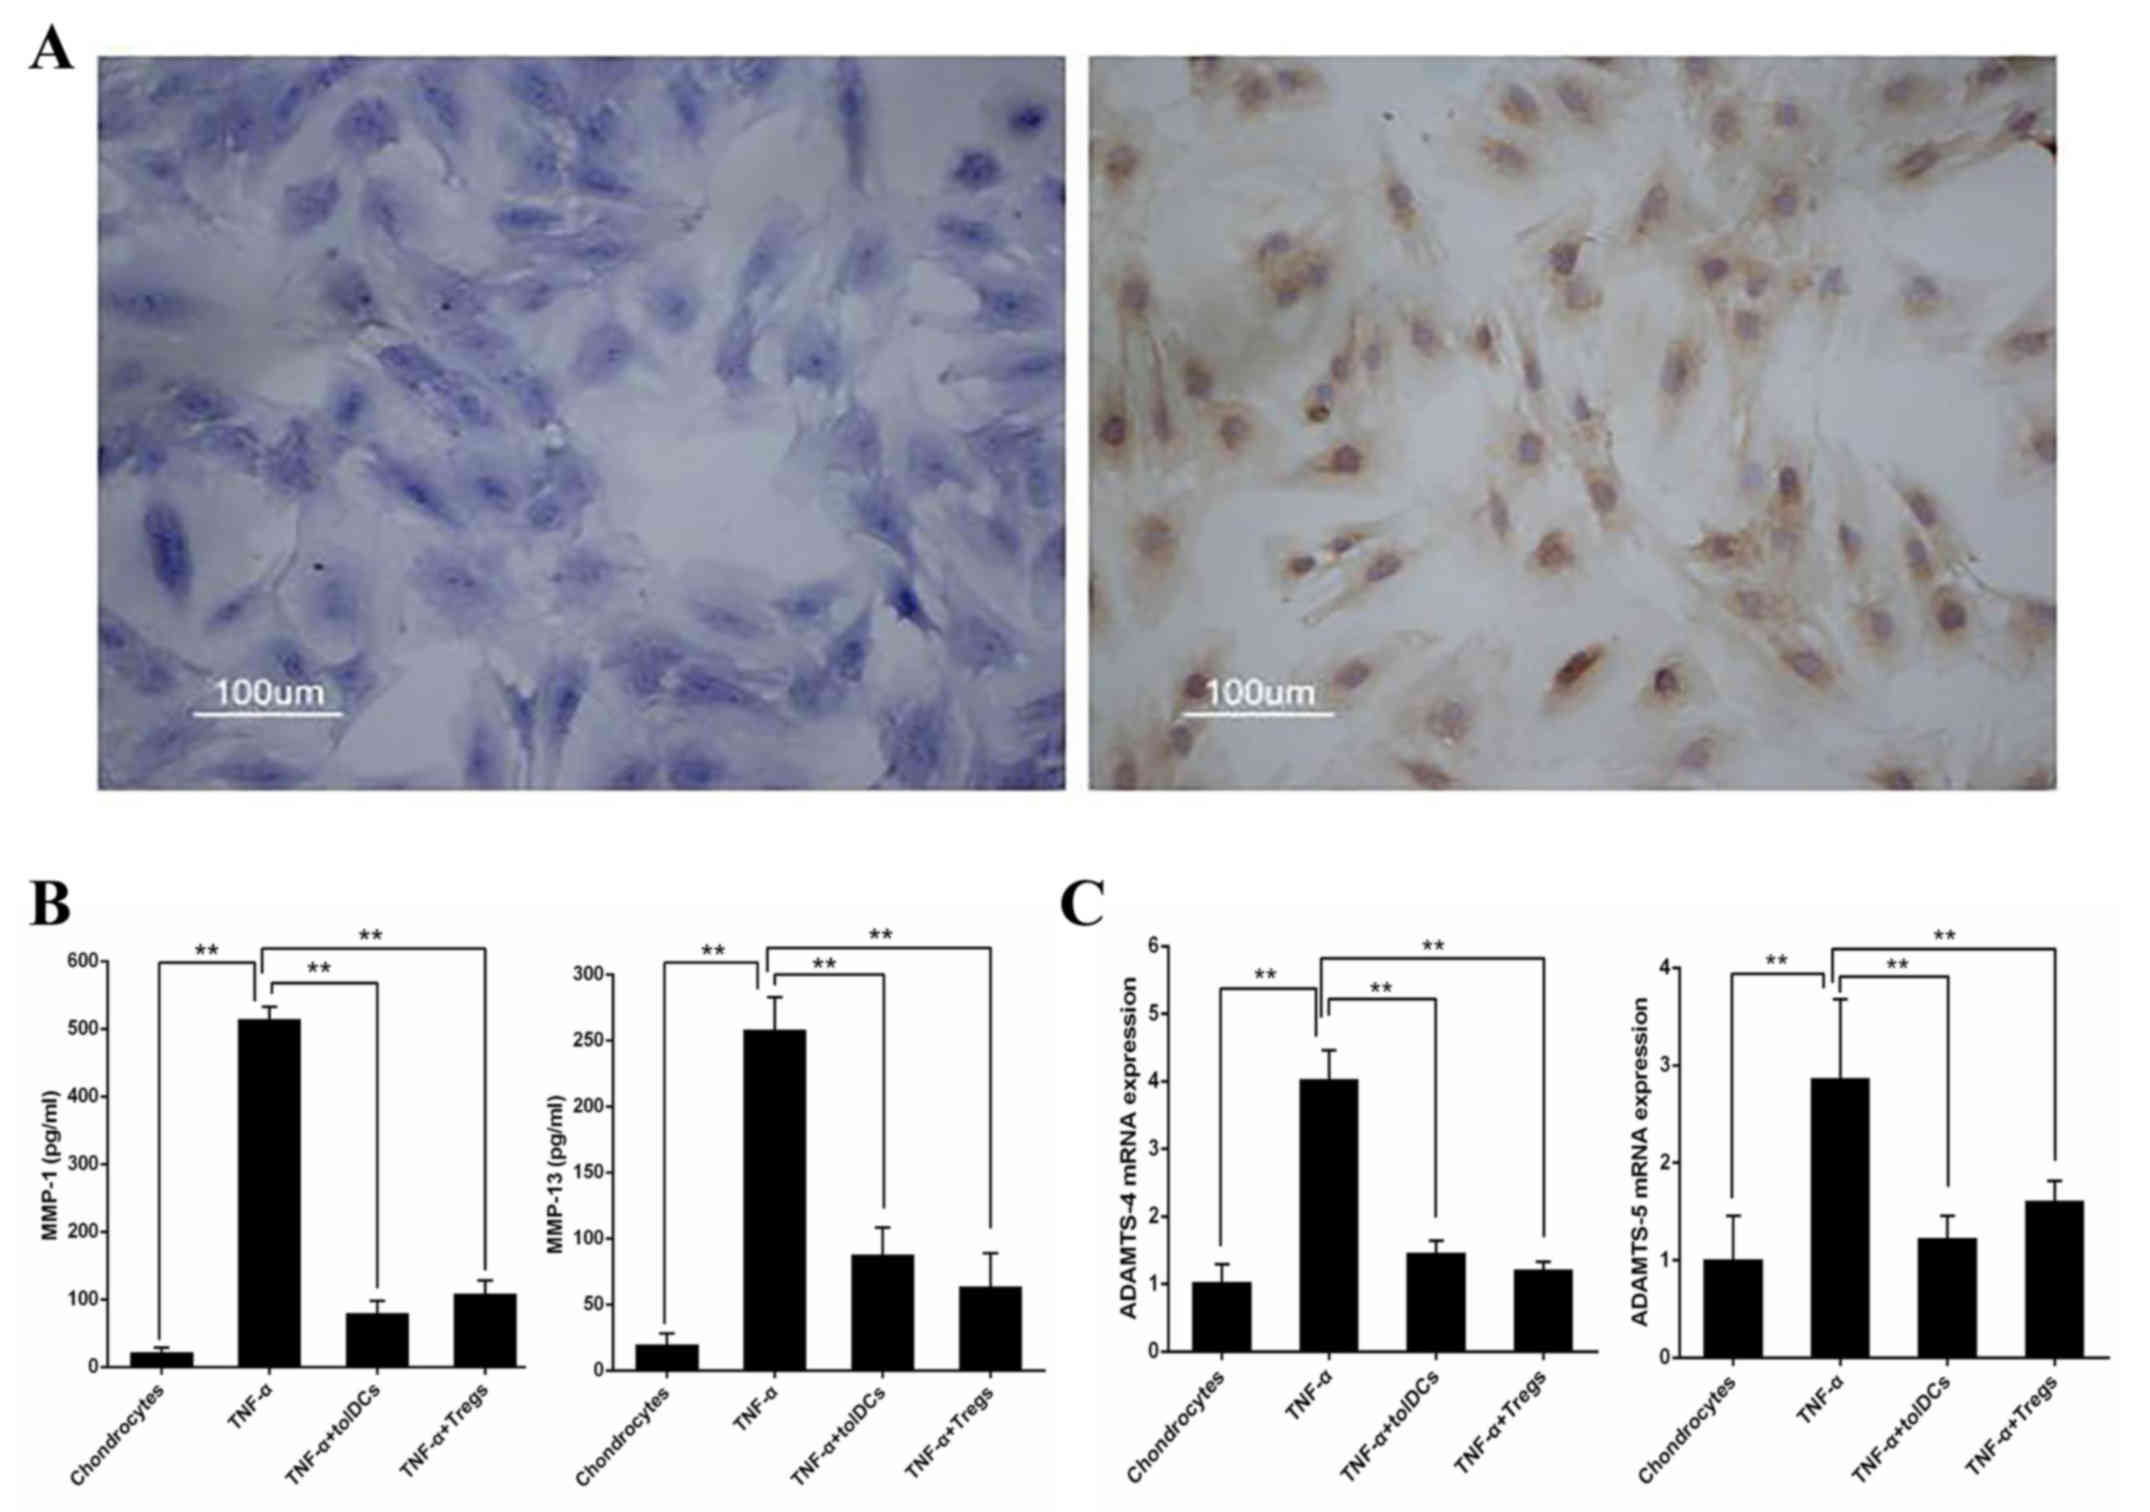
Dex/vitD3-DCs (tolDCs) and
IL-10-producing Tregs repress the production of MMPs by
chondrocytes
Toluidine blue and II-collagen antibody staining of
cartilage cells was performed, resulting in light blue and brown
chondrocyte staining (Fig. 4A). To
characterize the effects of Dex/vitD3-DCs and IL-10-producing Tregs
on chondrocytes, TNF-α-pretreated chondrocytes were co-cultured
with the autologous Dex/vitD3-DCs (considered tolDCs) or T [DC +
Dex/vitD3 + LPS) cells (considered Tregs). TNF-α induction
significantly increased secretion of MMP-1 and MMP-13 (n=8;
P<0.01) compared with untreated chondrocytes (Fig. 4B). TolDCs and Tregs inhibited the
production of MMP-1 and MMP-13 (n=8; P<0.01) in chondrocyte
cultures compared with the TNF-α-induced levels (Fig. 4B). Furthermore, mRNA levels of
ADAMTS-4 and ADAMTS-5 were determined by RT-qPCR. TNF-α
significantly increased the expression of ADAMTS-4 and ADAMTS-5
compared with those in the untreated chondrocytes group.
Chondrocytes co-cultured with tolDCs and Tregs exhibited marked
reduction in ADAMTS-4 and ADAMTS-5 (n=8; P<0.01) compared with
those treated with TNF-α (Fig.
4C).
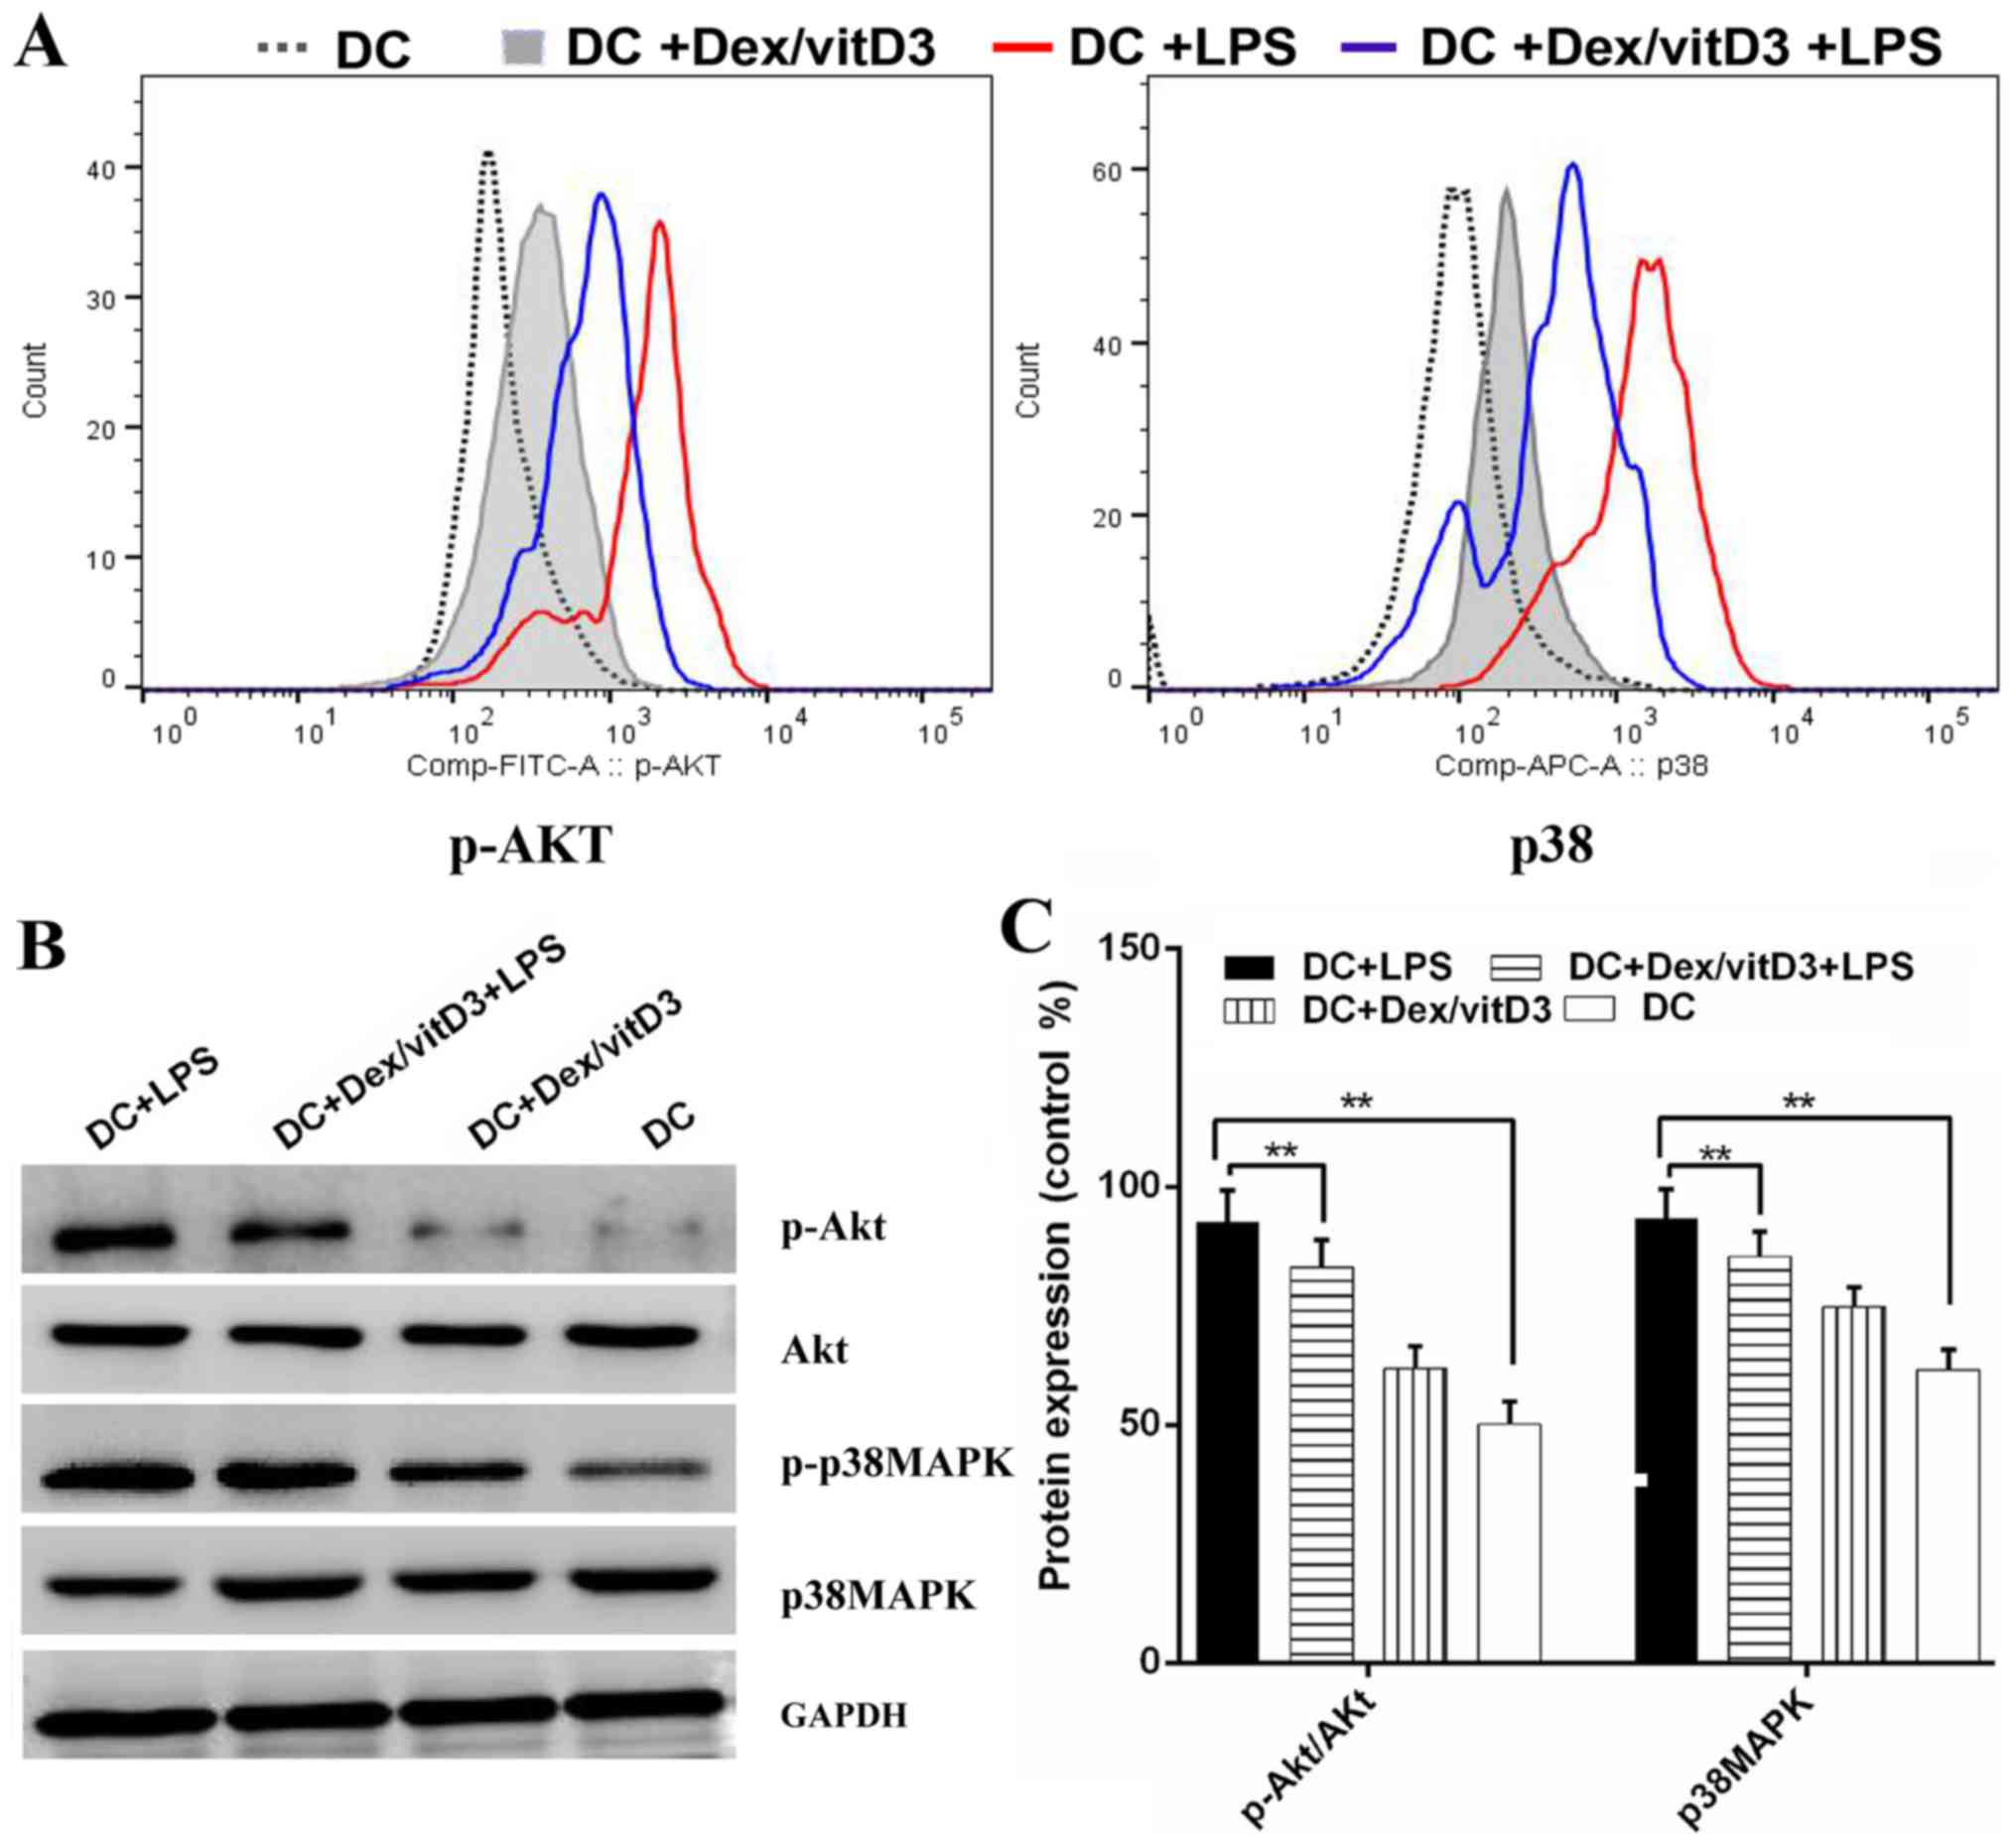
Akt and p38 MAPK phosphorylation are
involved in the effect of Dex/vitD3
The underlying mechanisms of tolerogenicity in
Dex/vitD3-DCs were investigated. The phosphorylated forms of Akt
and p38 MAPK were detected by phospho flow. LPS-induced
phosphorylation of Akt and p38 MAPK was reduced by Dex and vitD3
(Fig. 5A). Additionally, compared
with the DC group, the DC + LPS group exhibited significantly
increased phosphorylation of Akt and p38MAPK protein, (n=6;
P<0.01; Fig. 5B and C). However,
compared with the DC + LPS group, the DC + Dex/vitD3 + LPS
exhibited significantly reduced Akt and p38MAPK protein
phosphorylation levels (n=6; P<0.01; Fig. 5B and C).
Discussion
Dex/vitD3-DCs were generated using PBMCs from
patients with OA. The PBMCs were treated with Dex and vitD3, which
was followed by LPS-induced differentiation in vitro. Dex
increases the expression of the vitamin D receptor, which makes T
cells more susceptible to vitD3 stimulation (15,16). In
the current study, the expression of the vitamin D receptor on DCs
was increased following the treatment with Dex (data not shown).
Additionally, as reportedly previously, Dex/vitD3-DCs produced from
patients with OA exhibited low expression of co-stimulatory
molecules, MHC class II and maturation markers, compared with
tolDCs derived from healthy volunteers (19), and OA Dex/vitD3-DCs attenuated
autologous T cell activation and proliferation.
Naive T cells that were exposed to OA Dex/vitD3-DCs
exhibited a less pro-inflammatory phenotype and reduced production
of IFN-γ and IL-17. The low level of IL-6 produced by Dex/vitD3-DCs
likely facilitated the differentiation of Tregs into Th17 cells
(20). Additionally, differentiation
of T cells to IL-10-generating Tregs appeared to be induced by the
vitD3/Dex, and these cells suppressed autologous T cell activation
and proliferation. Notably, the IL-10-producing Tregs, which had
increased expression of Foxp3, were different from type 1 Tregs
described previously (19,21,22).
IL-10 production and cell-cell contact were required to mediate the
regulatory functions of T cells in the present study. To
investigate the molecular mechanisms involved in the effect of
Dex/vitD3, several signaling pathways, including the
phosphoinositide 3-kinase (PI3K), p38 MAPK and extracellular
signal-regulated kinase 1/2 pathways, have been investigated
(11). In line with recent findings
(23), the results of the current
study demonstrated that the p38 MAPK was involved in the effects of
Dex/vitD3. PI3K signaling may also serve a function in
Dex/vitD3-induced effects (24).
OA, the most common joint disease worldwide, is a
progressive inflammatory disease characterized by cartilage
destruction, synovitis and subchondral bone reconstruction
(3,11). Changes in innate and adaptive
immunity also appear to be involved in OA, as activated T cells are
present in the synovial tissue of articular specimens from patients
with OA (25). In fact, study has
indicated that immune-mediated inflammation is common in OA
synovial tissue, where immune cell infiltration and cytokine
secretion are prominent manifestations (26). Pro-inflammatory cytokines, including
IL-1β, TNF-α and IL-6, are involved in the pathophysiology of OA.
IL-1β levels are generally elevated in OA synovial fluid (17). The levels of serum IL-6 and
C-reactive protein are increased, and consistently higher in
individuals diagnosed with radiographic knee OA than in healthy
controls (27). Furthermore, the
levels of IL-6 and TNF-α in serum have been previously reported to
be associated with loss of cartilage in elderly patients with OA
(28). Barker et al (29) reported that early OA of the knee was
associated with increased serum levels of TNF-α, IL-5, IL-6 and
IL-12. Additionally, the level of IL-17 has been demonstrated to be
higher in serum and synovial fluid of patients with OA compared
with controls (30).
Pro-inflammatory cytokines that stimulate the
expression of MMPs and ADAMTS proteins in human chondrocytes
cultures are also significantly elevated in the synovial fluid of
patients with OA (31).
Osteoarthritic cartilage degradation initiates structural changes
within the joints, which can considerably impact joint function
(3). The loss of chondrocyte
extracellular matrix proteins, collagen II and aggrecan, is a
hallmark of OA (32). ADAMTS-4 and
ADAMTS-5 have an important role in the degradation of aggrecan in
cartilage, which occurs early in OA pathogenesis (33). MMPs are enzymes that can degrade
collagen II, and are secreted in response to various stimuli,
including cytokines and growth factors, in arthritic joints
(34).
To the best of our knowledge, the findings of the
current study are the first to demonstrate the generation of tolDCs
from patients with OA by stimulation with vitD3 and dex. Each of
vitD3 and Dex have been previously shown to induce tolDCs (21,22) and
may extend the survival time of organ allografts (35). Indeed, Dex/vitD3-stimulated DCs
exhibited better tolerance than using vitD3 or Dex individually
(36), or other pharmacological
agents (19). It has been reported
that Dex/vitD3-DCs have beneficial therapeutic effects in
antigen-specific models, including collagen-induced arthritis
(30). Considering the important
role of T cells and chondrocytes in the pathogenesis of OA
(37), the present study
demonstrated the beneficial immunomodulatory effects of
Dex/vitD3-DCs on T cells from patients with OA, with reduced
production of Th1 and Th17 cytokines in the pro-inflammatory
profile. Both the Dex/vitD3-treated DCs, and the subsequently
generated IL-10-producing Tregs, exhibited a protective effect on
chondrocytes, suppressing the expression of ADAMTS-4 and ADAMTS-5
and reducing the production of MMP-1 and MMP-13. Therefore,
combination of vitD3 and Dex followed by LPS maturation may be an
effective strategy for induction of tolDCs in patients with OA, and
thus have therapeutic potential.
Acknowledgements
Not applicable.
Funding
The present study was supported by grants from the
National Natural Science Foundation of China (grant no. 81373421)
and Anhui Province Natural Science Youth Funding Projects (grant
no. 1808085QH241).
Availability of data and materials
The datasets used and/or analyzed during the current
study are available from the corresponding author on reasonable
request.
Authors' contributions
GW performed the statistical analysis and wrote the
manuscript. YF extracted peripheral blood from the patients, and
separated autologous T cell and naive T cells. JZ performed the
co-cultured cells experiments and submitted the manuscript. WC
performed the experiments. BX and XC designed the study and revised
the manuscript.
Ethics approval and consent to
participate
Clinical and laboratory examinations were performed
after obtaining informed written consent from all patients and
approval from the Ethics Committee of Anhui Medical University,
Hefei, China.
Patient consent for publication
Not applicable.
Competing interests
The authors declare that they have no competing
interests.
References
|
1
|
Felson DT: Clinical practice.
Osteoarthritis of the knee. N Engl J Med. 354:841–848. 2006.
View Article : Google Scholar : PubMed/NCBI
|
|
2
|
Hügle T, Geurts J, Nüesch C, Müller-Gerbl
M and Valderrabano V: Aging and osteoarthritis: An inevitable
encounter? J Aging Res. 2012:9501922012. View Article : Google Scholar : PubMed/NCBI
|
|
3
|
Pelletier JP, Martel-Pelletier J and
Abramson SB: Osteoarthritis, an inflammatory disease: Potential
implications for the selection of new therapeutic targets.
Arthritis Rheum. 44:1237–1247. 2001. View Article : Google Scholar : PubMed/NCBI
|
|
4
|
Goode AP, Nelson AE, Kraus VB, Renner JB
and Jordan JM: Biomarkers reflect differences in osteoarthritis
phenotypes of the lumbar spine: The Johnston County Osteoarthritis
Project. Osteoarthritis Cartilage. 25:1672–1679. 2017. View Article : Google Scholar : PubMed/NCBI
|
|
5
|
Delco ML, Bonnevie ED, Szeto HS, Bonassar
LJ and Fortier LA: Mitoprotective therapy preserves chondrocyte
viability and prevents cartilage degeneration in an ex vivo model
of posttraumatic osteoarthritis. J Orthop Res. 2018. View Article : Google Scholar
|
|
6
|
Roos EM and Arden NK: Strategies for the
prevention of knee osteoarthritis. Nat Rev Rheumatol. 12:92–101.
2016. View Article : Google Scholar : PubMed/NCBI
|
|
7
|
Hulet C, Menetrey J, Beaufils P, Chambat
P, Djian P, Hardy P, Potel JF, Servien E and Seil R: French
Arthroscopic Society (SFA): Clinical and radiographic results of
arthroscopic partial lateral meniscectomies in stable knees with a
minimum follow up of 20 years. Knee Surg Sports Traumatol Arthrosc.
23:225–231. 2015. View Article : Google Scholar : PubMed/NCBI
|
|
8
|
Verma P and Dalal K: ADAMTS-4 and
ADAMTS-5: Key enzymes in osteoarthritis. J Cell Biochem.
112:3507–3514. 2011. View Article : Google Scholar : PubMed/NCBI
|
|
9
|
Wang P, Ying J, Luo C, Jin X, Zhang S, Xu
T, Zhang L, Mi M, Chen D, Tong P and Jin H: Osthole promotes bone
fracture healing through activation of BMP signaling in
chondrocytes. Int J Biol Sci. 13:996–1007. 2017. View Article : Google Scholar : PubMed/NCBI
|
|
10
|
Wang T and He C:
Pro-inflammatorycytokines: The link between obesity
andosteoarthritis. Cytokine Growth Factor Rev.
S1359-6101(18)30119-9. 2018. View Article : Google Scholar : PubMed/NCBI
|
|
11
|
Kapoor M, Martel-Pelletier J, Lajeunesse
D, Pelletier JP and Fahmi H: Role of proinflammatory cytokines in
the pathophysiology of osteoarthritis. Nat Rev Rheumatol. 7:33–42.
2011. View Article : Google Scholar : PubMed/NCBI
|
|
12
|
Chen YH, Yu Z, Fu L, Wang H, Chen X, Zhang
C, Lv ZM and Xu DX: Vitamin D3 inhibits lipopolysaccharide-induced
placental inflammation through reinforcing interaction between
vitamin D receptor and nuclear factor kappa B p65 subunit. Sci Rep.
5:108712015. View Article : Google Scholar : PubMed/NCBI
|
|
13
|
Anderson AE, Swan DJ, Sayers BL, Harry RA,
Patterson AM, von Delwig A, Robinson JH, Isaacs JD and Hilkens CM:
LPS activation is required for migratory activity and antigen
presentation by tolerogenic dendritic cells. J Leukoc Biol.
85:243–250. 2009. View Article : Google Scholar : PubMed/NCBI
|
|
14
|
Feili-Hariri M, Dong X, Alber SM, Watkins
SC, Salter RD and Morel PA: Immunotherapy of NOD mice with bone
marrow-derived dendritic cells. Diabetes. 48:2300–2308. 1999.
View Article : Google Scholar : PubMed/NCBI
|
|
15
|
Charbonnier LM, Van Duivenvoorde LM,
Apparailly F, Cantos C, Han WG, Noël D, Duperray C, Huizinga TW,
Toes RE, Jorgensen C and Louis-Plence P: Immature dendritic cells
suppress collagen-induced arthritis by in vivo expansion of CD49b+
regulatory T cells. J Immunol. 177:3806–3813. 2006. View Article : Google Scholar : PubMed/NCBI
|
|
16
|
Lutz MB and Schuler G: Immature,
semi-mature and fully mature dendritic cells: Which signals induce
tolerance or immunity? Trends Immunol. 23:445–449. 2002. View Article : Google Scholar : PubMed/NCBI
|
|
17
|
Malemud CJ: Anticytokine therapy for
osteoarthritis: Evidence to date. Drugs Aging. 27:95–115. 2010.
View Article : Google Scholar : PubMed/NCBI
|
|
18
|
Livak KJ and Schmittgen TD: Analysis of
relative gene expression data using real-time quantitative PCR and
the 2(-Delta Delta C(T)) method. Methods. 25:402–408. 2001.
View Article : Google Scholar : PubMed/NCBI
|
|
19
|
Volchenkov R, Karlsen M, Jonsson R and
Appel S: Type 1 regulatory T cells and regulatory B cells induced
by tolerogenic dendritic cells. Scand J Immunol. 77:246–254. 2013.
View Article : Google Scholar : PubMed/NCBI
|
|
20
|
Kimura A and Kishimoto T: IL-6: Regulator
of Treg/Th17 balance. Eur J Immunol. 40:1830–1835. 2010. View Article : Google Scholar : PubMed/NCBI
|
|
21
|
Unger WW, Laban S, Kleijwegt FS, Van Der
Slik AR and Roep BO: Induction of Treg by monocyte-derived DC
modulated by vitamin D3 or dexamethasone: Differential role for
PD-L1. Eur J Immunol. 39:3147–3159. 2009. View Article : Google Scholar : PubMed/NCBI
|
|
22
|
Xia CQ, Peng R, Beato F and Clare-Salzler
MJ: Dexamethasone induces IL-10-producing monocyte-derived
dendritic cells with durable immaturity. Scand J Immunol. 62:45–54.
2005. View Article : Google Scholar : PubMed/NCBI
|
|
23
|
Dáňová K, Klapetková A, Kayserová J,
Šedivá A, Špíšek R and Jelínková LP: NF-kB, p38 MAPK, ERK1/2, mTOR,
STAT3 and increased glycolysis regulate stability of
paricalcitol/dexamethasone-generated tolerogenic dendritic cells in
the inflammatory environment. Oncotarget. 6:14123–14138. 2015.
View Article : Google Scholar : PubMed/NCBI
|
|
24
|
Yang J, Chen Q, Tian S, Song S, Liu F,
Wang Q and Fu Z: The role of 1,25-dyhydroxyvitaminD3in mouse liver
ischemia reperfusion injury: Regulation of autophagy through
activation of MEK/ERK signaling and PTEN/PI3K/Akt/mTORC1 signaling.
Am J Transl Res. 7:2630–2645. 2015.PubMed/NCBI
|
|
25
|
Anderson AE, Sayers BL, Haniffa MA, Swan
DJ, Diboll J, Wang XN, Isaacs JD and Hilkens CM: Differential
regulation of naive and memory CD4+ T cells by alternatively
activated dendritic cells. J Leukoc Biol. 84:124–133. 2008.
View Article : Google Scholar : PubMed/NCBI
|
|
26
|
Banchereau J, Pascual V and Palucka AK:
Autoimmunity through cytokine-induced dendritic cell activation.
Immunity. 20:539–550. 2004. View Article : Google Scholar : PubMed/NCBI
|
|
27
|
Livshits G, Zhai G, Hart DJ, Kato BS, Wang
H, Williams FM and Spector TD: Interleukin-6 is a significant
predictor of radiographic knee osteoarthritis: The Chingford Study.
Arthritis Rheum. 60:2037–2045. 2009. View Article : Google Scholar : PubMed/NCBI
|
|
28
|
Stannus O, Jones G, Cicuttini F,
Parameswaran V, Quinn S, Burgess J and Ding C: Circulating levels
of IL-6 and TNF-α are associated with knee radiographic
osteoarthritis and knee cartilage loss in older adults.
Osteoarthritis Cartilage. 18:1441–1447. 2010. View Article : Google Scholar : PubMed/NCBI
|
|
29
|
Barker T, Rogers VE, Henriksen VT, Aguirre
D, Trawick RH, Rasmussen GL and Momberger NG: Serum cytokines are
increased and circulating micronutrients are not altered in
subjects with early compared to advanced knee osteoarthritis.
Cytokine. 68:133–136. 2014. View Article : Google Scholar : PubMed/NCBI
|
|
30
|
Chen B, Deng Y, Tan Y, Qin J and Chen LB:
Association between severity of knee osteoarthritis and serum and
synovial fluid interleukin 17 concentrations. J Int Med Res.
42:138–144. 2014. View Article : Google Scholar : PubMed/NCBI
|
|
31
|
Su YP, Chen CN, Huang KC, Chang HI, Lee
KC, Lo CM and Chang SF: Leptin induces MMP1/13 andADAMTS4
expressions through bone morphogenetic protein-2 autocrine effect
in human chondrocytes. J Cell Biochem. 119:3716–3724. 2018.
View Article : Google Scholar : PubMed/NCBI
|
|
32
|
Wieland HA, Michaelis M, Kirschbaum BJ and
Rudolphi KA: Osteoarthritis-an untreatable disease? Nat Rev Drug
Discov. 4:331–344. 2005. View Article : Google Scholar : PubMed/NCBI
|
|
33
|
Lee AS, Ellman MB, Yan D, Kroin JS, Cole
BJ, van Wijnen AJ and Im HJ: A current review of molecular
mechanisms regarding osteoarthritis and pain. Gene. 527:440–447.
2013. View Article : Google Scholar : PubMed/NCBI
|
|
34
|
Vincenti MP and Brinckerhoff CE:
Transcriptional regulation of collagenase (MMP-1, MMP-13) genes in
arthritis: Integration of complex signaling pathways for the
recruitment of gene-specific transcription factors. Arthritis Res.
4:157–164. 2002. View
Article : Google Scholar : PubMed/NCBI
|
|
35
|
Emmer PM, van der Vlag J, Adema GJ and
Hilbrands LB: Dendritic cells activated by lipopolysaccharide after
dexamethasone treatment induce donor-specific allograft
hyporesponsiveness. Transplantation. 81:1451–1459. 2006. View Article : Google Scholar : PubMed/NCBI
|
|
36
|
Ferreira GB, Kleijwegt FS, Waelkens E,
Lage K, Nikolic T, Hansen DA, Workman CT, Roep BO, Overbergh L and
Mathieu C: Differential protein pathways in 1,25-dihydroxyvitamin
d(3) and dexamethasone modulated tolerogenic human dendritic cells.
J Proteome Res. 11:941–971. 2012. View Article : Google Scholar : PubMed/NCBI
|
|
37
|
Bian Q, Wang YJ, Liu SF and Li YP:
Osteoarthritis: Genetic factors, animal models, mechanisms, and
therapies. Front Biosci. 4:74–100. 2012. View Article : Google Scholar
|