Introduction
Peak bone mass (PBM), the highest bone mass obtained
during the life of a person, is a critical determinant of
osteoporosis (1,2). It has been reported that gaining a high
PBM in the first 30 years could effectively prevent osteoporosis
(3,4). Circulating monocytes are important
cells that serve as early progenitors of osteoclasts and has been
reported to be a suitable model for bone-related research (5,6). Deng
et al have identified and confirmed five proteins [ras
suppressor protein1 (RSU1), gelsolin (GSN), manganese-containing
superoxide dismutase (SOD2), glutathione peroxidase 1 (GPX1), and
prolyl 4-hydroxylase β subunit (P4HB)] that may involve in
differential osteoclastogenesis by a comparative protein expression
profiling study and western blot analysis of circulating monocytes
in premenopausal females with extremely discordant bone mineral
density (7). Lei et al
identified three novel risk genes (GBP1, STAT1 and
CXCL10) that may be involved in the differentiation of PBM
at the monocyte stage (1). Although
there have been some studies on the role of circulating monocytes
in osteoporosis development, the relationship between circulating
monocytes and the pathogenesis of osteoporosis remains poorly
understood.
Gibbs sampling, also called Gibbs sampler, is a
Markov chain Monte Carlo (MCMC) algorithm for getting a sequence of
observations that are approximated from a specified multivariate
probability distribution (8). It can
be used to identify perturbed pathways and hub genes which may be
closely related to occurrence and development of the disease. In
this research, we aimed to identify the differential pathways and
hub genes in circulating monocytes of healthy Chinese women with
high PBM and low PBM using Gibbs sampling, attempting to promote
our understanding of the function of circulating monocytes in
osteoporosis.
Materials and methods
Data collection and preprocessing
Transcription profiling of human circulating
monocytes was obtained from the ArrayExpress database (http://www.ebi.ac.uk/arrayexpress/) and the
accession number was E-GEOD-7158. The database consists of 26
samples, including 14 samples from healthy Chinese females with
extremely high PBM and 12 samples from healthy Chinese females with
extremely low PBM. Followed by preprocessing (9,10), the
expression profile was converted from probe level to gene symbol
level and the duplicated symbols were removed. The remaining genes
were used for subsequent analysis.
Kyoto Encyclopedia of Genes and
Genomes (KEGG) metabolic pathway enrichment
The KEGG database was used in this study (11). A total of 287 pathways, including
6,894 genes were downloaded from the KEGG database. The genes in
the transcription profile were enriched to the KEGG pathways.
Pathways with gene counts ≥5 were screened out for the next
analysis.
Construction of path initial
state
The average expression values of the genes in the
pathways under high and low PBM conditions were calculated,
respectively, and considered as the expression of this pathway.
High PBM condition was regarded as the initial state of the pathway
and low PBM condition was regarded as a priori value of the
pathway.
According to the Markov chain theory, we deduced the
initial transition probability from the expression of state 1 and
state 2. Then state n is derived from state n-1 and the state n is
only associated with state n-1. The original state of the system
has no connection with the other Markov processes.
Gibbs sampling
Gibbs sampling was implemented to form a Markov
chain. First, an empty Gibbs sampling set was defined followed by
storing the initial state and a priori value of the pathways into
the Gibbs sample empty set. Secondly, a k-dimensional vector (k
=280) was initialized randomly and k-1 of these vectors were fixed
accompanied by extracting the remaining one vector. The posterior
value of this vector was calculated. After repeating this process
for k times, a new k-dimensional vector was obtained and defined as
state 3. After repeating this whole process 10,000 times, a Markov
chain was obtained. The vectors generated after 2,000 times are
considered to follow the distribution of the real samples, which is
a satisfactory convergence.
Identifying key pathways
After gaining the posterior values of all the
pathways, the probability (α) of occurrence of each pathway
was calculated using the following formula 1.
α = ∑i = 200010000Pi10000 − 2000 +1
Pi represents the posterior value of this pathway in
the ith sample.
According to the expression level of the pathway in
different states, the P-value of the pathway is calculated by
Student's t-test. All the pathways were then ranked according to
their P-value. Subsequently, the correction coefficient c
was calculated using the following formula 2.
In formula 2, ranki represents the rank
of pathway i and n represents the number of samples.
c = 1 − rankin
Next the adjusted probability of each pathway was
calculated as follows: αadj = α × c. After
accomplishing all the adjusted calculation probabilities, the
pathways were all ranked according to their αadj
value and pathways with αadj ≥0.8 were selected
as differentially expressed pathways (12).
Identifying hub genes
After identifying the differentially expressed
pathways, we proceeded to find the hub genes in these pathways by
Gibbs sampling. The process of finding hub genes was the same with
the identification of differentially expressed pathways. Firstly,
the genes in the identified pathways were transformed into Markov
chains. Secondly, Gibbs sampling was performed to obtain a new
Markov chain and the posterior values of these genes. Thirdly, the
probability (α) of occurrence of each gene was calculated.
Then, the P-values were calculated by t-test according to gene
expression differences between high group and low group and the
genes were ranked basing on the P-value. Next, the correction
coefficient c was calculated and the adjusted probability of
each gene was calculated. Finally, the genes with
αadj ≥0.8 were selected as hub genes.
Results
Data preprocessing and pathway
enrichment
The transcription profile was downloaded from the
ArrayExpress database, including 12 samples from healthy Chinese
female with extremely low PBM and 14 samples from healthy Chinese
female with extremely high PBM. After pretreatment, we obtained a
total of 20,514 genes used for the next analysis.
All human pathways (287) were downloaded from the
KEGG database and 280 pathways were selected by screening pathways
with a gene intersection ≥5.
Key pathways screened by Gibbs
sampling
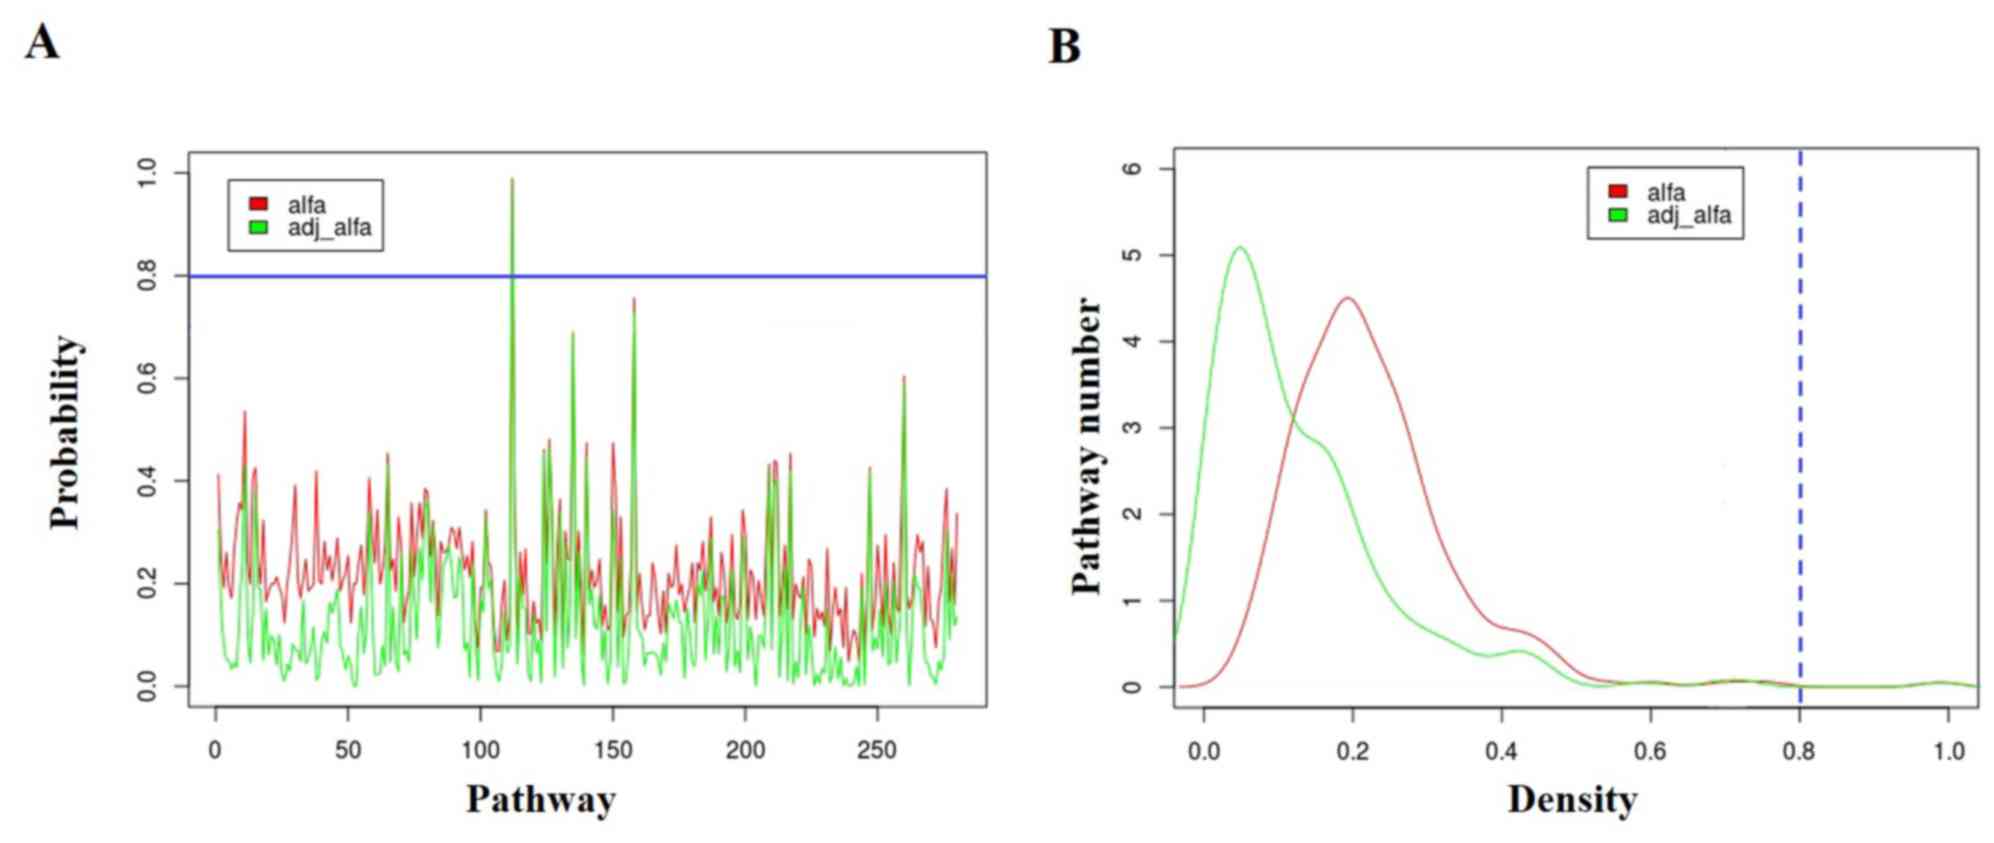
The posterior probabilities of the 280 pathways were
obtained by Gibbs sampling and then the probabilities of the 280
pathways were calculated and adjusted. Fig. 1 shows the probability distribution of
the 280 pathways. The blue line indicates the threshold value of
probability of 0.80. All 280 pathways were ranked according to
their adjusted probability and the top five pathways with the
highest αadj are listed in Table I. Under the criterion of
αadj ≥0.8, neuroactive ligand-receptor
interaction (hsa04080) which ranked at first with
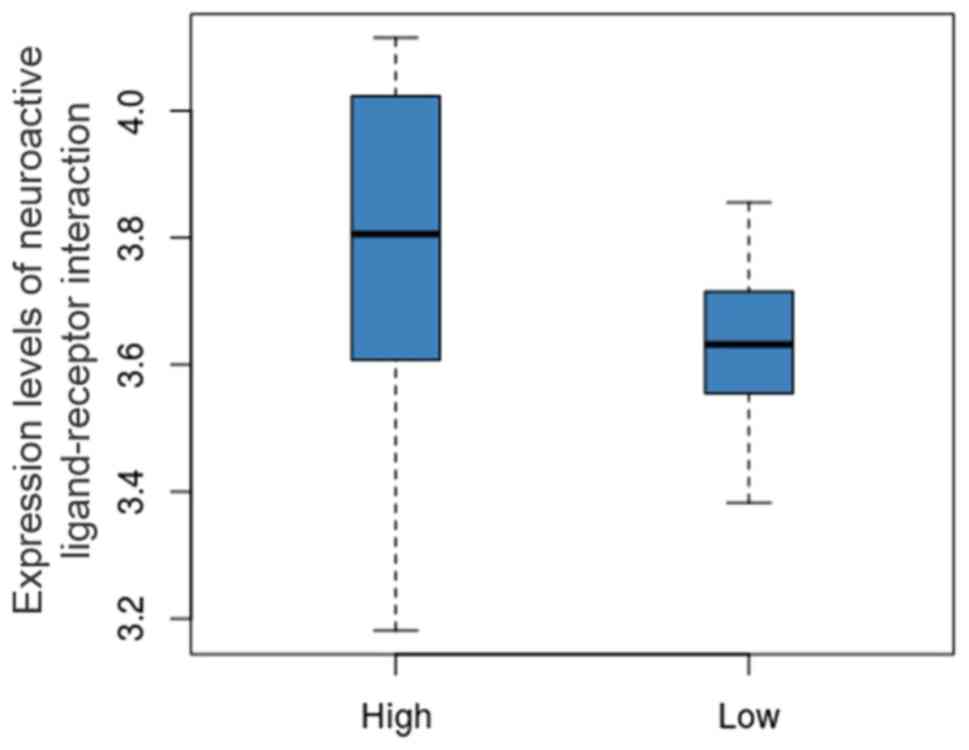
αadj = 0.986 was screened out as the key pathway.
The expression levels of hsa04080 in the high and low groups are
shown in Fig. 2. We can identify
that the expression level of hsa04080 was obviously decreased in
the low group compared to that in the high group.
 | Table I.The top 5 pathways ranked according to
αadj value. |
Table I.
The top 5 pathways ranked according to
αadj value.
| Pathway | P-value | Rank p | R-value | α |
αadj |
|---|
| Neuroactive
ligand-receptor interaction (hsa04080) | 0.002 | 1 | 0.996 | 0.990 | 0.986 |
| Natural killer
cell-mediated cytotoxicity (hsa04650) | 0.068 | 11 | 0.961 | 0.756 | 0.726 |
| Hedgehog signaling
pathway (hsa04340) | 0.038 | 3 | 0.989 | 0.701 | 0.694 |
| Basal cell
carcinoma (hsa05217) | 0.053 | 7 | 0.975 | 0.605 | 0.590 |
| PI3K-Akt signaling
pathway (hsa04151) | 0.054 | 8 | 0.971 | 0.481 | 0.467 |
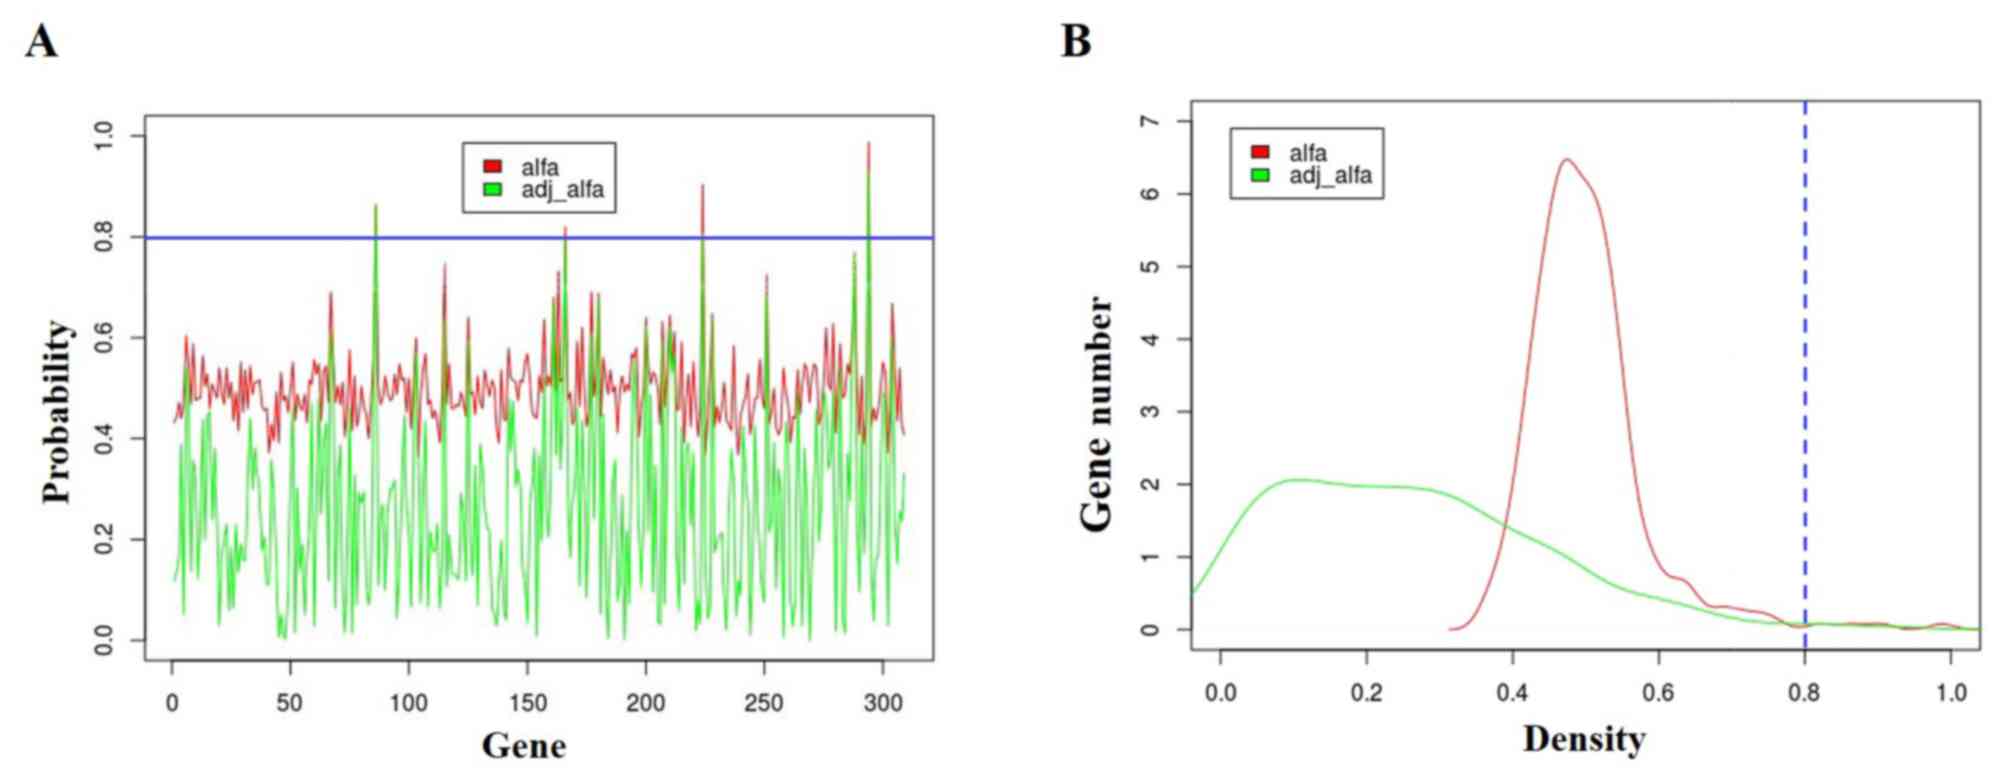
Hub genes in the key pathway
By analyzing the key pathway identified previously,
we found 309 genes in the neuroactive ligand-receptor interaction.
Gibbs sampling was performed again on these pathway genes. The
probability distribution of genes are shown in Fig. 3. The blue line represents the
threshold value of probability of 0.80. All 309 genes were ranked
according to their αadj and Table II shows the top five genes with the
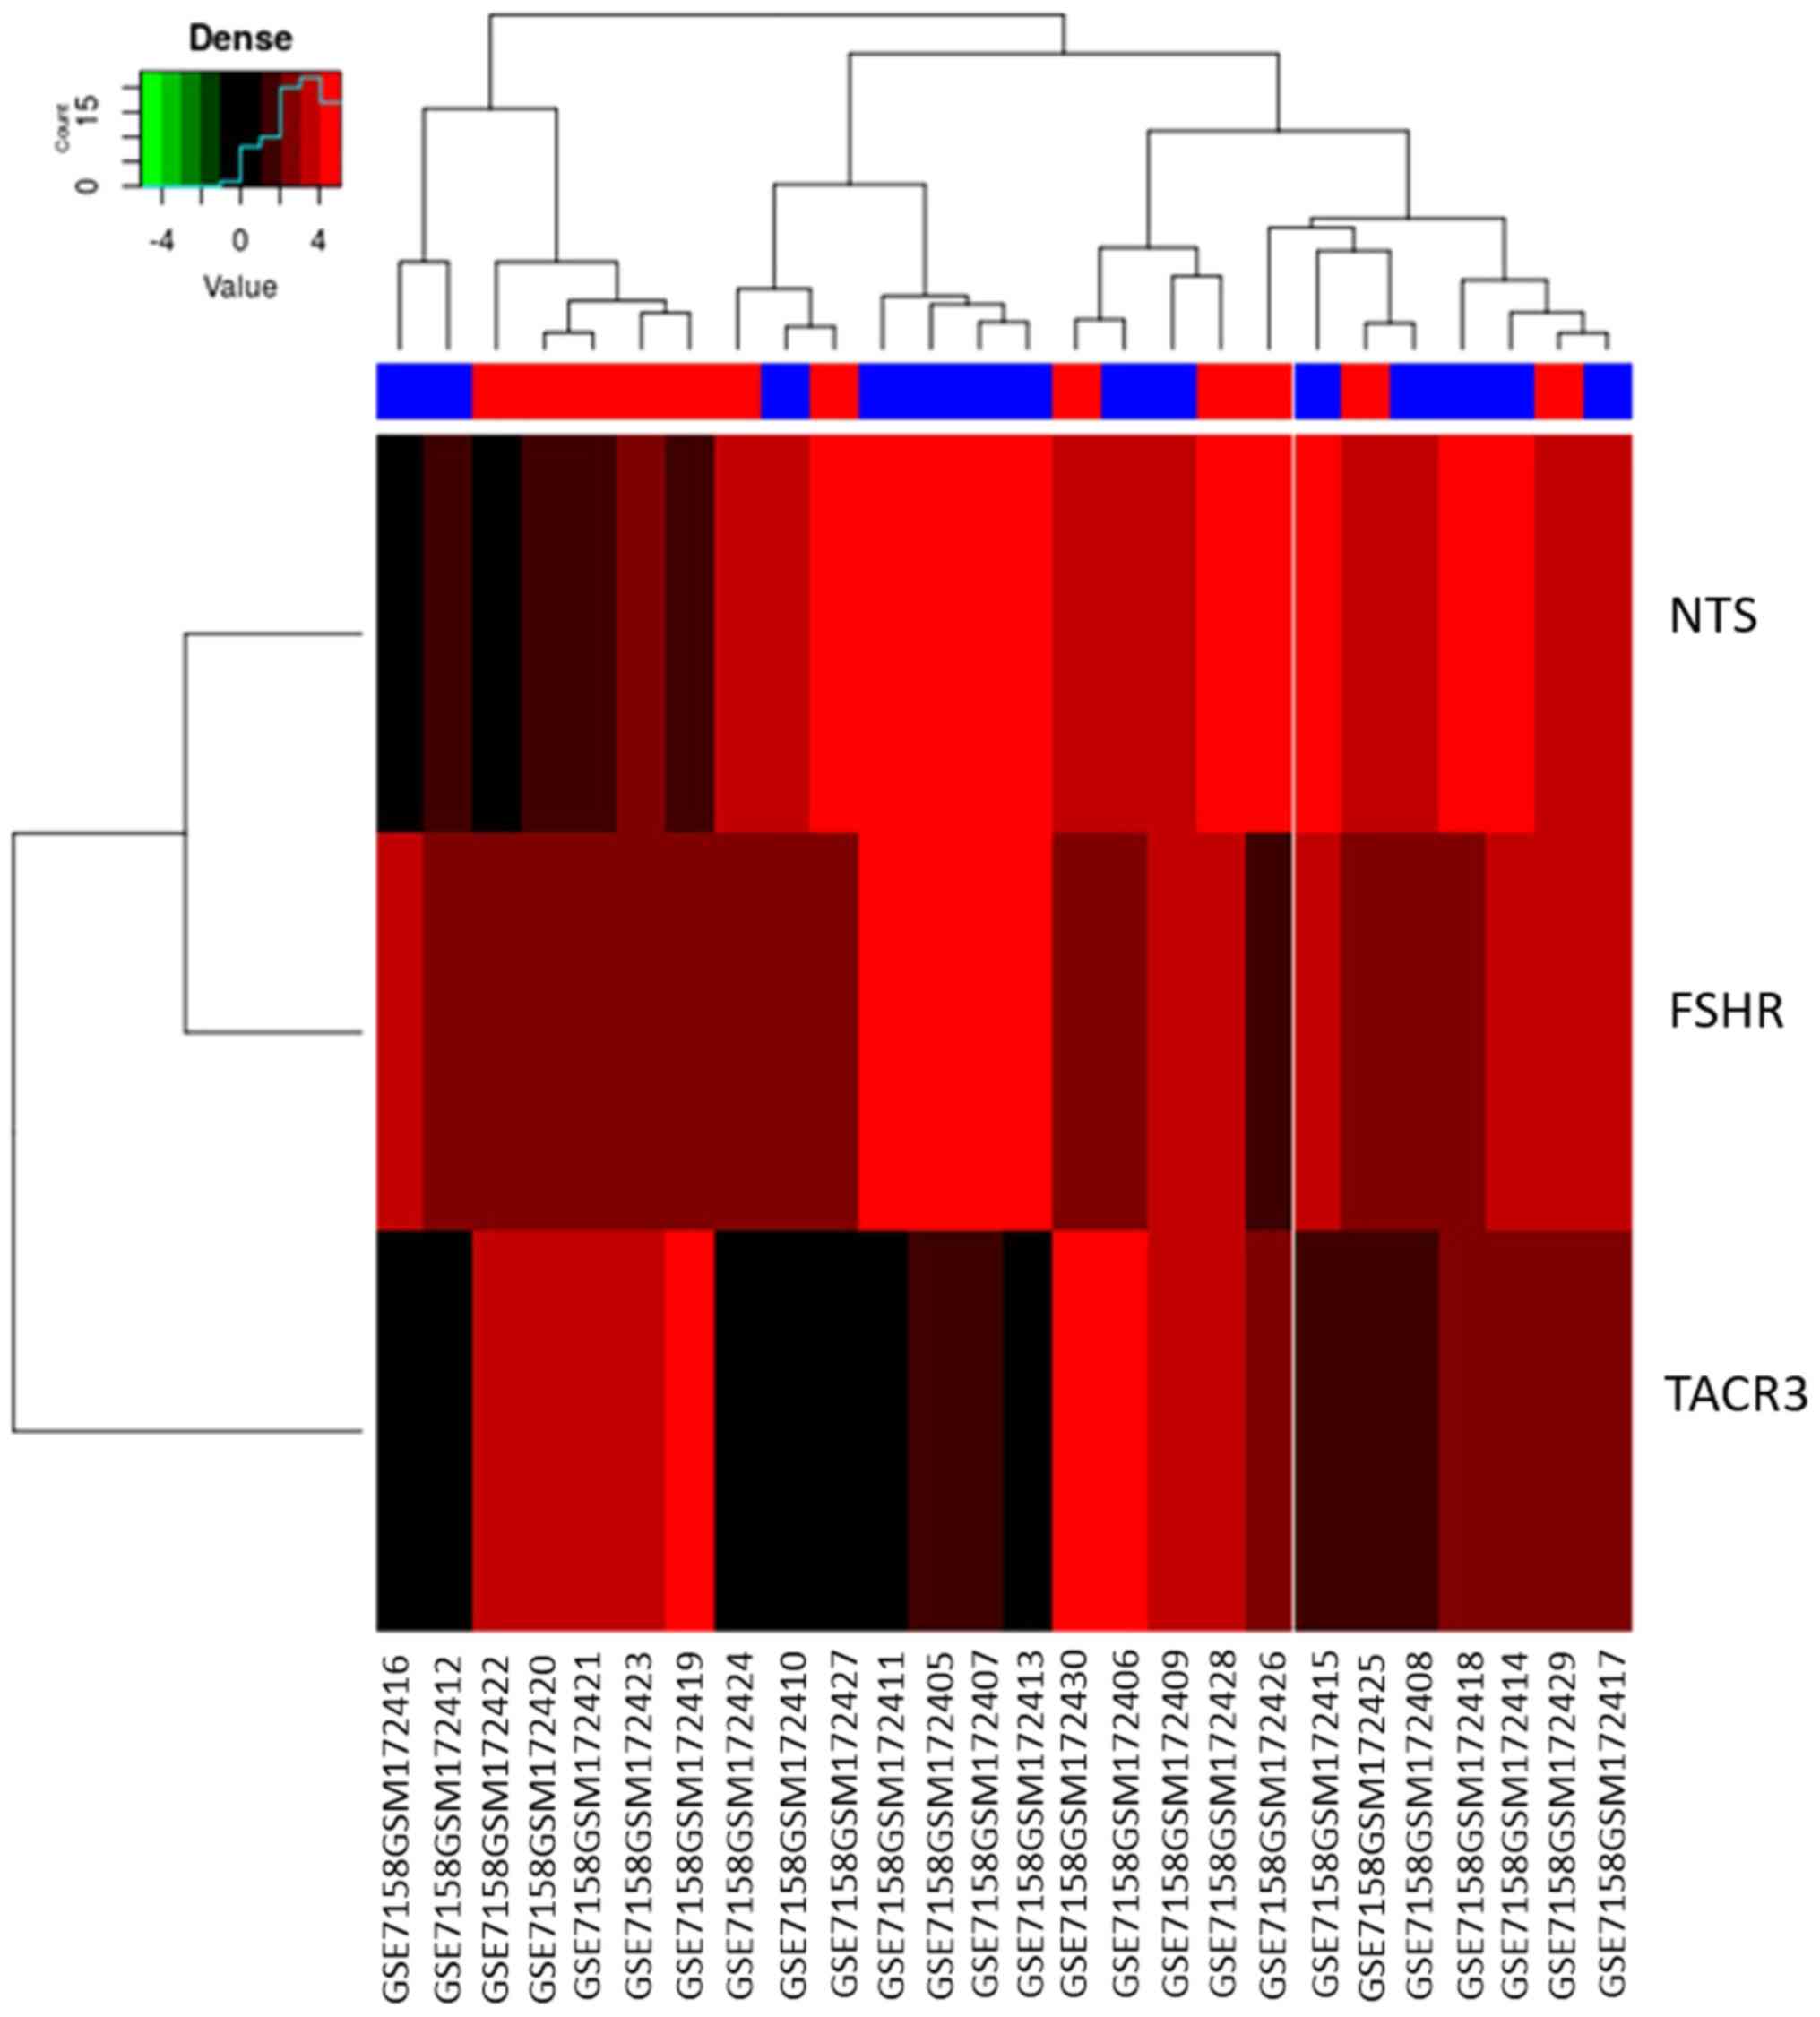
highest αadj value. Neurotensin (NTS),
tachykinin receptor 3 (TACR3), follicle-stimulating hormone
receptor (FSHR) with αadj value ≥0.8 were
considered as the hub genes. Of the three genes, TACR3
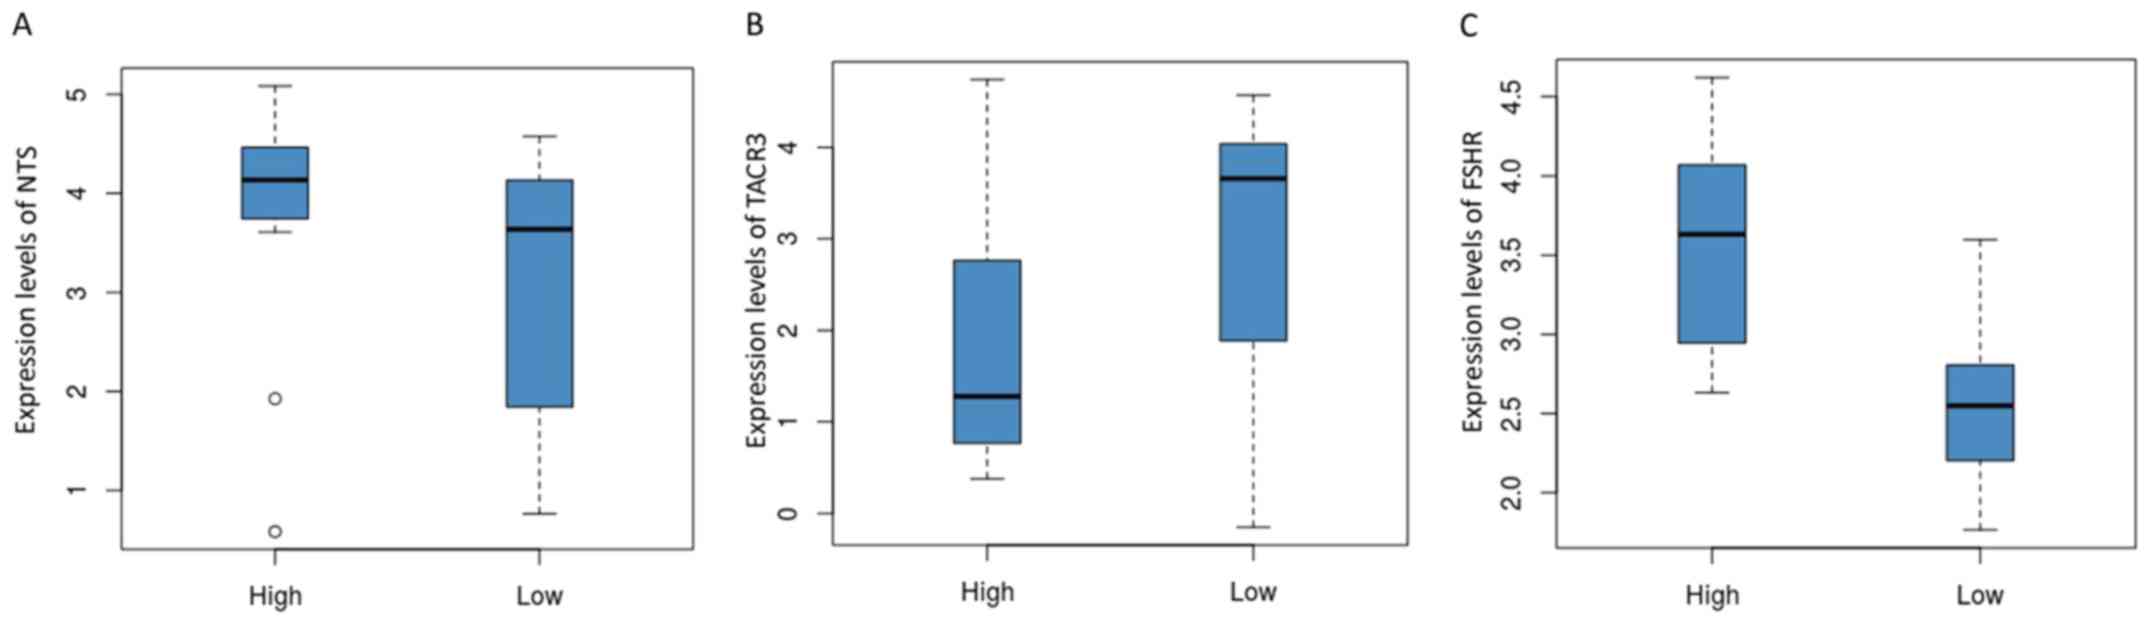
gained the highest αadj value (0.930). The
expression levels of the three genes were analyzed (Fig. 4). The expression level of NTS
was reduced in the low group compared to that in the high group
(Fig. 4A). The expression level of
TACR3 was significantly increased in the low group compared
with that in the high group (Fig.
4B). By contrast, the expression level of FSHR was
significantly decreased in the low group compared to the high group
(Fig. 4C). Heatmap of the three
hubgenes is shown in Fig. 5, and the
results were consistent with those of Fig. 4.
| Table II.The top 5 genes in neuroactive
ligand-receptor interaction ranked according to
αadj value. |
Table II.
The top 5 genes in neuroactive
ligand-receptor interaction ranked according to
αadj value.
| Gene | P-value | Rank p | R-value | α |
αadj |
|---|
| TACR3 | 0.065 | 18 | 0.942 | 0.988 | 0.930 |
| FSHR | 0.00028 | 1 | 0.997 | 0.864 | 0.861 |
| NTS | 0.109 | 33 | 0.893 | 0.904 | 0.807 |
| HCRTR2 | 0.029 | 10 | 0.968 | 0.819 | 0.793 |
| TAAR8 | 0.028 | 9 | 0.971 | 0.760 | 0.738 |
Discussion
Circulating monocytes, which possess the potential
to differentiate into osteoclasts and to produce potent
pro-inflammatory and anti-inflammatory cytokines, are likely to
play vital roles in bone metabolism (5). Previously, the analysis of key genes
that may be associated with osteoporosis in circulating monocytes
has been conducted by a traditional method based on Package linear
models for microarray data of R (13). Herein, an MCMC algorithm based on
Bayesian theory (Gibbs sampling) was performed for the first time
to identify differentially expressed pathways and hub genes which
probably associated with osteoclasts in circulating monocytes.
After Gibbs sampling, neuroactive ligand-receptor
interaction (hsa04080) with the highest αadj
(0.986) was identified as a differentially expressed pathway in
circulating monocytes that may relate to osteoporosis development.
A total of 309 genes were found in this pathway and Gibbs sampling
was performed again to identify the key genes among these 309
genes. Finally, three genes (NTS, TACR3 and FSHR)
with αadj >0.8 were identified as hub genes
that may be associated with osteoporosis.
NTS is a neuropeptide composed of 13 amino acids
(14) found in the brain and
secreted mainly by neurons and astrocytes (15). Later, researchers found that NT was
also expressed in the intestine (16). NTS in the central nervous system was
associated with Parkinson's disease, eating disorders,
schizophrenia, substance dependence and neurodegeneration, sexually
transmitted diseases and other neuropsychiatric disorders (17,18). In
the intestine, it involved in regulating intestinal function. In
the present study, NTS was differentially expressed in
circulating monocytes of high group and low group and was
identified as a hub gene by Gibbs sampling. However, only few
reports have demonstrate the relationship between NTS,
circulating monocytes and osteoporosis. TACR3, a member of
genes which function as receptors for TACs, are mainly detected in
the central nervous system and play vital roles in physiological
development and human reproductive system (19,20).
Recently, it has been reported that the expression of TACR3
was significantly evaluated in Human Oral Squamous Cell Carcinoma
compared with normal epithelium (19). However, the roles of TACR3 in
circulating monocytes remain unknown. Further studies of the role
of NTS and TACR3 in circulating monocytes may uncover new mechanism
and provide new target for osteoporosis.
FSH is a heterodimeric glycoprotein which plays a
role in controlling follicle development and steroidogenesis by
binding to the FSHR located in ovarian granulosa cells (21). Allan et al reported that FSH
could increase bone mass in female mice (21). By contrast, Wang et al
demonstrated FSH serum concentrations were increased in
postmenopausal women with osteoporosis suggesting that FSH may
increase the risk of postmenopausal osteoporosis (22). Additionally, FSH receptors were found
in osteoclasts cultured in vitro and may promote
osteoporosis in postmenopausal women (23). Furthermore, it has been reported that
lacking either FSHβ or FSHR in female mice could protect from bone
loss despite hypogonadism (24). In
the present study, FSHR was identified as a hub gene in
circulating monocytes and its expression level in low group is
significantly lower than that in high group, indicating that this
gene may closely relate to the development of osteoporosis and it
has the potential to be a therapeutic target for osteoporosis.
In conclusion, we identified a differentially
expressed pathway (neuroactive ligand-receptor interaction) and
three hub genes (NTS, TACR3 and FSHR) by analyzing
the expression profiling of human circulating monocytes using Gibbs
sampling. These findings provide insights into understanding the
role of circulating monocytes in osteoporosis development. However,
further experiments are needed to confirm these findings.
Acknowledgements
Not applicable.
Funding
No funding was received.
Availability of data and materials
The datasets used and/or analyzed during the present
study are available from the corresponding author on reasonable
request.
Authors' contributions
YX conceived the study, acquired and analyzed the
data, and drafted the manuscript. XPZ helped to explain the results
and revised the manuscript. Both authors approved the final
study.
Ethics approval and consent to
participate
Not applicable.
Patient consent for publication
Not applicable.
Competing interests
The authors declare that they have no competing
interests.
References
|
1
|
Lei SF, Wu S, Li LM, Deng FY, Xiao SM,
Jiang C, Chen Y, Jiang H, Yang F, Tan LJ, et al: An in vivo genome
wide gene expression study of circulating monocytes suggested GBP1,
STAT1 and CXCL10 as novel risk genes for the differentiation of
peak bone mass. Bone. 44:1010–1014. 2009. View Article : Google Scholar : PubMed/NCBI
|
|
2
|
Cooper C, Westlake S, Harvey N, Javaid K,
Dennison E and Hanson M: Developmental origins of osteoporotic
fracture (Review). Osteoporos Int. 17:337–347. 2006. View Article : Google Scholar : PubMed/NCBI
|
|
3
|
Lu J, Shin Y, Yen MS and Sun SS: Peak bone
mass and patterns of change in total bone mineral density and bone
mineral contents from childhood into young adulthood. J Clin
Densitom. 19:180–191. 2016. View Article : Google Scholar : PubMed/NCBI
|
|
4
|
Heaney RP, Abrams S, Dawson-Hughes B,
Looker A, Marcus R, Matkovic V and Weaver C: Peak bone mass.
Osteoporos Int. 11:985–1009. 2000. View Article : Google Scholar : PubMed/NCBI
|
|
5
|
Zhou Y, Deng HW and Shen H: Circulating
monocytes: An appropriate model for bone-related study. Osteoporos
Int. 26:2561–2572. 2015. View Article : Google Scholar : PubMed/NCBI
|
|
6
|
Jiménez-Ortega RF, Ramírez-Salazar EG,
Parra-Torres AY, Muñoz-Montero SA, Rangel-Escareňo C,
Salido-Guadarrama I, Rodriguez-Dorantes M, Quiterio M, Salmerón J
and Velázquez-Cruz R: Identification of microRNAs in human
circulating monocytes of postmenopausal osteoporotic Mexican
Mestizo women: A pilot study. Exp Ther Med. 14:5464–5472.
2017.PubMed/NCBI
|
|
7
|
Deng FY, Liu YZ, Li LM, Jiang C, Wu S,
Chen Y, Jiang H, Yang F, Xiong JX, Xiao P, et al: Proteomic
analysis of circulating monocytes in Chinese premenopausal females
with extremely discordant bone mineral density. Proteomics.
8:4259–4272. 2008. View Article : Google Scholar : PubMed/NCBI
|
|
8
|
Walsh B: Markov Chain Monte Carlo and
Gibbs Sampling. http://staff.ustc.edu.cn/~jbs/mcmc-gibbs-intro.pdfMarch
5–2017
|
|
9
|
Bolstad BM, Irizarry RA, Astrand M and
Speed TP: A comparison of normalization methods for high density
oligonucleotide array data based on variance and bias.
Bioinformatics. 19:185–193. 2003. View Article : Google Scholar : PubMed/NCBI
|
|
10
|
Irizarry RA, Bolstad BM, Collin F, Cope
LM, Hobbs B and Speed TP: Summaries of Affymetrix GeneChip probe
level data. Nucleic Acids Res. 31:e152003. View Article : Google Scholar : PubMed/NCBI
|
|
11
|
Kanehisa M and Goto S: KEGG: Kyoto
encyclopaedia of genes and genomes. Nucleic Acids Res. 28:27–30.
2000. View Article : Google Scholar : PubMed/NCBI
|
|
12
|
Chen P, Guo LH, Guo YK, Qu ZJ, Gao Y and
Qiu H: Identification of disturbed pathways in heart failure based
on Gibbs sampling and pathway enrichment analysis. Genet Mol Res.
15:2016.https://doi.org/10.4238/gmr.15027956.
|
|
13
|
Chen J, Wang L, Shen Y, Yu J, Ye T, Zhuang
C and Zhang W: Key genes associated with osteoporosis revealed by
genome wide gene expression analysis. Mol Biol Rep. 41:5971–5977.
2014. View Article : Google Scholar : PubMed/NCBI
|
|
14
|
Carraway R and Leeman SE: The amino acid
sequence of a hypothalamic peptide, neurotensin. J Biol Chem.
250:1907–1911. 1975.PubMed/NCBI
|
|
15
|
Patel AB, Tsilioni I, Leeman SE and
Theoharides TC: Neurotensin stimulates sortilin and mTOR in human
microglia inhibitable by methoxyluteolin, a potential therapeutic
target for autism. Proc Natl Acad Sci USA. E7049–E7058. 2016.
View Article : Google Scholar : PubMed/NCBI
|
|
16
|
Law IK, Bakirtzi K, Polytarchou C,
Oikonomopoulos A, Hommes D, Iliopoulos D and Pothoulakis C:
Neurotensin - regulated miR-133α is involved in proinflammatory
signalling in human colonic epithelial cells and in experimental
colitis. Gut. 64:1095–1104. 2015. View Article : Google Scholar : PubMed/NCBI
|
|
17
|
Mustain WC, Rychahou PG and Evers BM: The
role of neurotensin in physiologic and pathologic processes. Curr
Opin Endocrinol Diabetes Obes. 18:75–82. 2011. View Article : Google Scholar : PubMed/NCBI
|
|
18
|
Boules MM, Fredrickson P, Muehlmann AM and
Richelson E: Elucidating the role of neurotensin in the
pathophysiology and management of major mental disorders. Behav Sci
(Basel). 4:125–153. 2014. View Article : Google Scholar : PubMed/NCBI
|
|
19
|
Obata K, Shimo T, Okui T, Matsumoto K,
Takada H, Takabatake K, Kunisada Y, Ibaragi S, Nagatsuka H and
Sasaki A: Tachykinin receptor 3 distribution in human oral squamous
cell carcinoma. Anticancer Res. 36:6335–6341. 2016. View Article : Google Scholar : PubMed/NCBI
|
|
20
|
Karpouzis A, Avgeridis P, Tripsianis G,
Gatzidou E, Kourmouli N and Veletza S: Assessment of tachykinin
receptor 3′ gene polymorphism rs3733631 in Rosacea. Int Sch Res
Notices. 2015:4694022015.PubMed/NCBI
|
|
21
|
Allan CM, Kalak R, Dunstan CR, McTavish
KJ, Zhou H, Handelsman DJ and Seibel MJ: Follicle-stimulating
hormone increases bone mass in female mice. Proc Natl Acad Sci USA.
107:22629–22634. 2010. View Article : Google Scholar : PubMed/NCBI
|
|
22
|
Wang J, Zhang W, Yu C, Zhang X, Zhang H,
Guan Q, Zhao J and Xu J: Follicle-stimulating hormone increases the
risk of postmenopausal osteoporosis by stimulating osteoclast
differentiation. PLoS One. 10:e01349862015. View Article : Google Scholar : PubMed/NCBI
|
|
23
|
Feng Y, Zhu S, Antaris AL, Chen H, Xiao Y,
Lu X, Jiang L, Diao S, Yu K, Wang Y, et al: Live imaging of
follicle stimulating hormone receptors in gonads and bones using
near infrared II fluorophore. Chem Sci (Camb). 8:3703–3711. 2017.
View Article : Google Scholar
|
|
24
|
Sun L, Peng Y, Sharrow AC, Iqbal J, Zhang
Z, Papachristou DJ, Zaidi S, Zhu LL, Yaroslavskiy BB, Zhou H, et
al: FSH directly regulates bone mass. Cell. 125:247–260. 2006.
View Article : Google Scholar : PubMed/NCBI
|