Introduction
As a major genetic cause of infant mortality, spinal
muscular atrophy (SMA) is a destructive and inherited
neurodegenerative disorder characterised by the loss of motor
neurons in the anterior horn of the spinal cord, resulting in
muscle wasting and weakness (1,2). It is
currently an incurable neuromuscular disorder. Survival motor
neuron 1 (SMN1) gene encodes SMN, which is widely expressed
in all the eukaryotic cells. Approximately 95% of SMA cases are
related to deletions or mutations of the SMN1 (3). Gene therapy research has made
significant progress over the past decade, and one of the rapidly
emerging neurological fields is the delivery of genes to the
central nervous system (CNS) through in vivo or in
vitro techniques (4). In
addition, a good understanding of pathological and molecular
mechanism underlying SMA may offer great help to explore effective
therapy of this complicated disease.
Particularly, the difference of gene expression
levels could reflect the propensity of many diseases, and thus
identifying gene functions has been an effective way to reveal the
pathological mechanism of a disease at molecular level (5). Zeng et al used a novel
correlation measure known as HeteSim in order to focus on candidate
disease genes (6). Establishing a
network-based approach to identify new genes that may be related to
infertility is imperative (7).
Furthermore, it has been demonstrated that gene function
predictions can be performed with very high statistical confidence
using variants based on guilt by association (GBA) algorithm, with
the hypothesis that the association in genetic data is necessary to
establishing guilt (8). Although
various techniques have been proposed for the purpose of extending
GBA to indirect connections, only slight effectiveness was
identified (9–11). Consequently, treatments targeting
only one gene are not always effective, because genes usually do
not work alone, but co-operate with others.
Therefore, in the present study, a new method was
proposed to predict key gene functions for progressive SMA
patients, by integrating the GBA algorithm and network-based
method. To achieve this aim, firstly, gene expression data and gene
ontology (GO) annotations were collected from the public databases,
respectively. Secondly, differentially expressed genes (DEGs) were
identified as gene lists and background GO terms were extracted as
gene sets. Thirdly, the co-expression matrix (CEM) was constructed
on gene lists by Spearman correlation coefficient (SCC) method.
Ultimately, gene functions were predicted by integrating the CEM
and GBA algorithm, of which the area under the receiver operating
characteristics curve (AUC) was applied to select the key gene
functions in SMA patients.
Materials and methods
Preparing gene expression data
In this study, gene expression data (GSE38417) for
human SMA, deposited on Affymetrix Gene Chip Human Genome HGU133
Plus 2 Array [HGU133_Plus_2], were obtained from the public-free
Gene Expression Omnibus (GEO) database (https://www.ncbi.nlm.nih.gov/geo/). First, we combined
multiple probes that corresponded to the same gene, and selected
the average value of the plurality of probes as the expression
value of the gene. Second, the annotation information was modified,
the column name corresponding to the line, renamed ‘groups’,
including control (6 samples) and SMA (16 samples). In order to
control the quality of the data, standard pretreatments were
performed (12,13).
Identifying DEGs
During this step, DEGs between control and SMA were
detected utilizing the linear models for microarray data (limma)
package. In detail, the lmFit function implemented in limma was
utilized to perform linear fitting, empirical Bayes statistics and
false discovery rate (FDR) calibration of the P-values on the data.
The thresholds for DEGs were set as P<0.95 and |log fold change
(FC)| ≥0.5.
Constructing CEM
To further investigate the correlations or
interactions among DEGs, a CEM for them was constructed based on
the SCC algorithm. To the best of our knowledge, SCC is a main
measure used to determine the correlation between two variables,
and its value is between −1 and +1 inclusive. If the SCC for a pair
of genes was positive, it would indicate a positive linear
correlation between the two genes. Similarly, a negative SCC refers
to a negative relationship of the gene pair. The absolute SCC value
of an interaction was denoted as its weight value. Furthermore, the
higher the weight value across two genes, the stronger the
interaction was, especially for 1. Otherwise, the 0 meant that
there was no interaction between two genes. As a result, a CEM was
constructed according to the weight. An assortativity coefficient
was calculated to assess degree assortative mixing pattern extent.
Assortativity coefficient, which is obtained by using R-package
igraph, is an intuitive inspection and measurement of the positive
and negative correlation of node relationships in a network. In
other words, according to the positive and negative values of the
network node, it can be discriminated whether it is a homogeneous
cluster or a heterogeneous cluster.
GO-term enrichment analysis
Human GO annotations were prepared from the Gene
Ontology Consortium (http://geneontology.org/), which is a community-based
bioinformatics resource that supplies information on gene product
function applying ontologies to represent biological knowledge
(14). Subsequently, we propagated
over the GO structure and filtered for GO terms on size so that
each remaining term had between 20 and 1,000 related genes, while
excluding those inferred from electronic annotation (15,16). For
purpose of making these retained GO terms more correlated to SMA,
we took the intersections between DEGs and GO terms. If the number
of DEGs for a GO term was <20, it would be removed. In other
words, only GO terms including ≥20 DEGs were reserved.
Network-based GBA algorithm
As mentioned above, we combined the GBA algorithm
with network to predict significant gene functions for progressors.
The principle of GBA is to use relational information (e.g.,
interactions) to predict new gene members in the functional call of
genes. Specifically, for a DEG in the CEM, we chose its adjacent
genes to enrich to a GO term. Based on these GO functional
annotations, a multi-functionality (MF) score was assigned
to each gene i in the CEM (4):
MF(i)=∑k|i∈GOk1Numink*Numoutk
Of which Numink
represented the number of genes within GO group k, whose
weighing had the impact of contributing to a GO group; and
Numoutk was the number of genes
outside the GO group k in the CEM, whose weighing provided a
corresponding weight to genes not within the GO group. It should be
noted that weighing referred to the effect of calculating
membership of a group based on the degree of gene contribution to
that GO group. Thus, 3-fold cross-validation was applied to
evaluate the scoring genes ranked in the MF score to determine how
well they belonged to the known gene set, and computed the AUC for
evaluating classification performances between progressors and
non-progressors. In the present study, to assess the predictive
power of machine learners in support vector machines (SVM) model,
AUC was considered a better measure than the accuracy of assessing
clinical classification performance. Most importantly, an AUC of
0.5 represents classification of the level of opportunity, while an
AUC of 1.0 represents the perfect classification (17). Thus, we defined GO terms of AUC
>0.7 as key gene functions for SMA patients in the present
study.
Results
Gene lists and gene sets
In the present study, differential co-expression
network and GO annotations were the two main necessary objects for
network-based function inference in SMA. To achieve this, we first
obtained the accessible expression data of SMA to identify the DEGs
and generate the gene co-expression. Based on 20,514 genes in
GSE38417, we identified 484 DEGs between control and DMN by limma
package when setting the thresholds as P<0.05 and |logFC| ≥0.5.
The top 10 DEGs are shown in Table
I. Then based on these DEGs, the SCC values among gene pairs
were calculated, and the SCC absolute values were defined as the
weight values. We constructed the co-expression adjacency matrix of
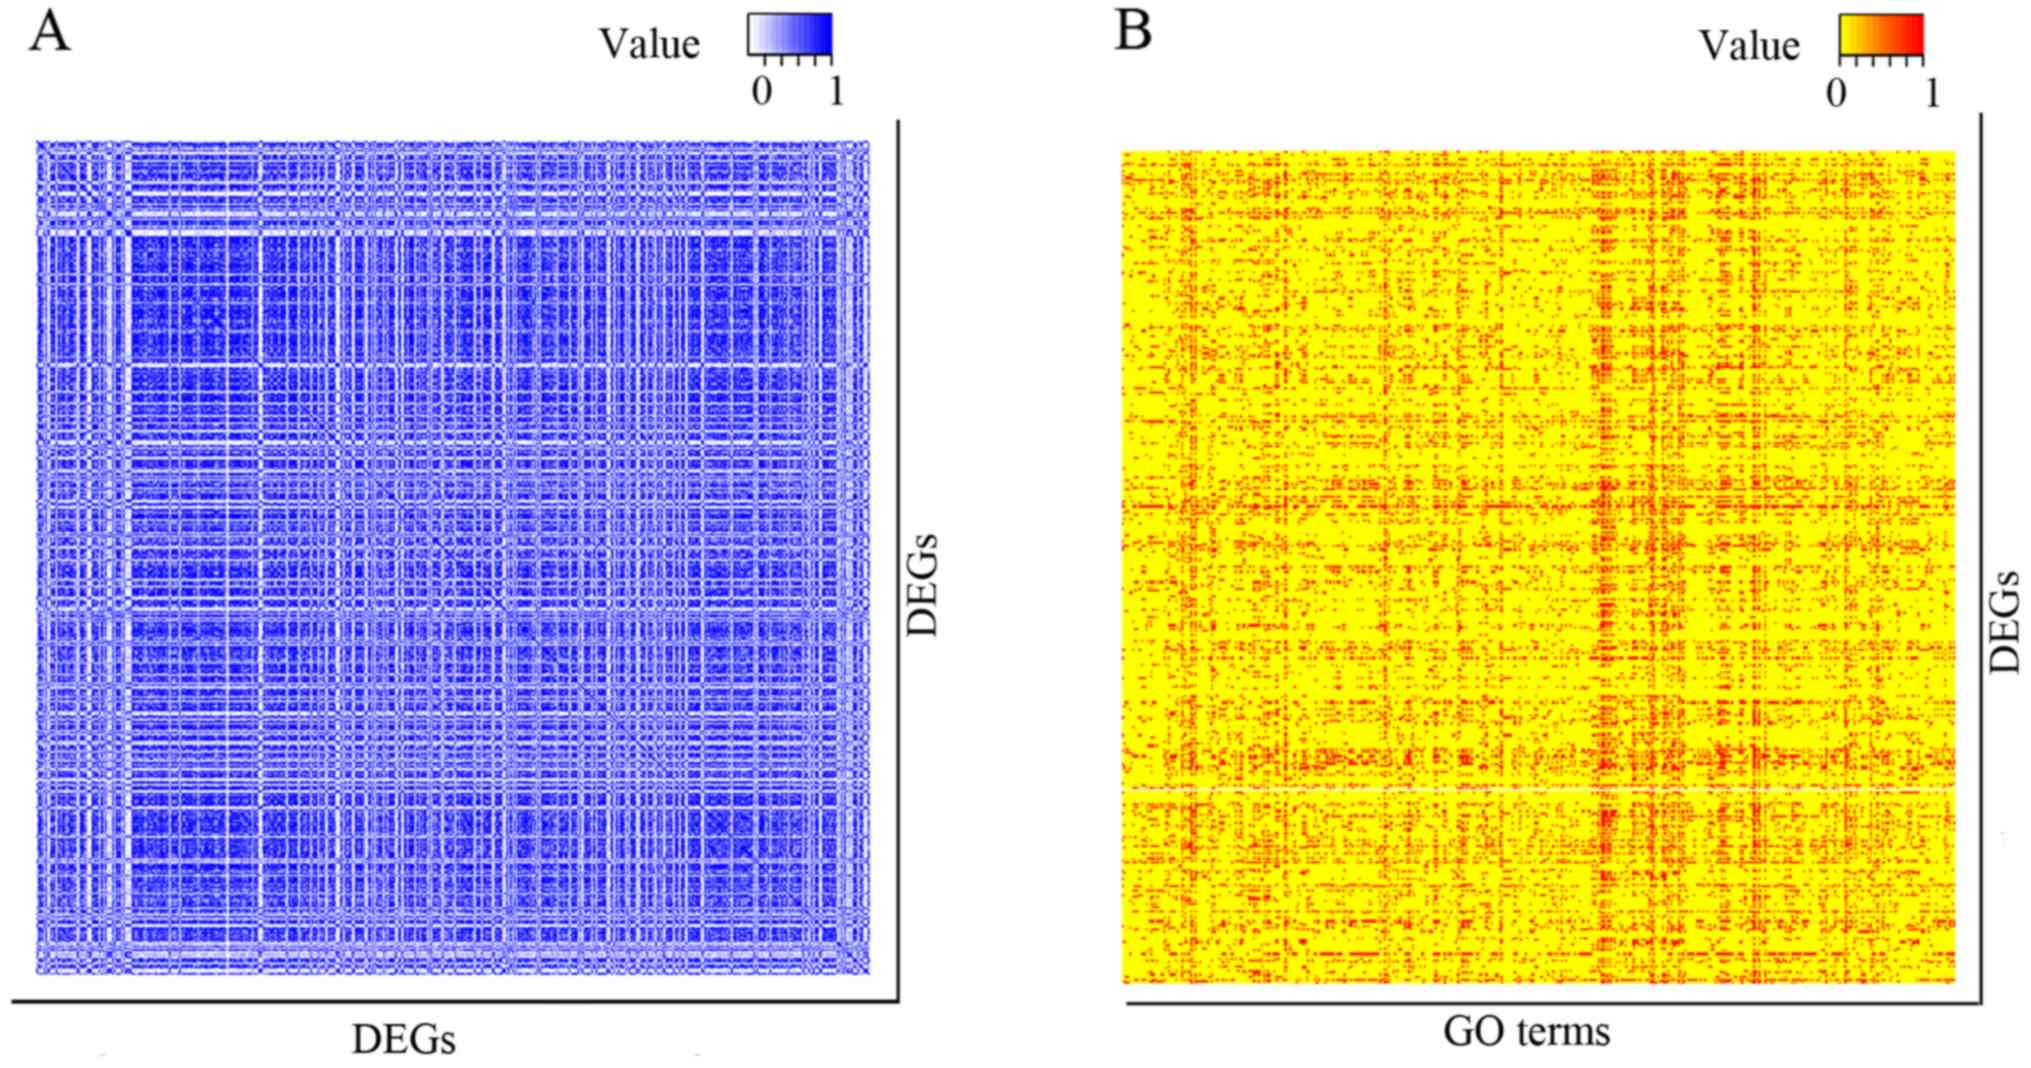
484 DEGs (covering 116,886 interactions), where the entry indicated
the connection between two genes (Fig.
1A). Only gene sets containing intersected DEGs of >20 were
left in the subsequent analysis. Thereafter, we defined the amount
of intersected DEGs as the count value of this term. As a result, a
total of 466 GO terms were determined. Subsequently, these GO terms
were represented as a binary vector, where each entry corresponded
to a differentially expressed gene, with a 1 indicating that the
differentially expressed gene was a member of this GO term, and 0
if it was not (Fig. 1B).
 | Table I.The top 10 DEGs. |
Table I.
The top 10 DEGs.
| Genes | |log (FC)| | t value | P-value | Adjusted
P-value |
|---|
| TYRP1 | −1.80647 | −51.642 |
2.65×10⁻²³ |
5.43×10⁻¹⁹ |
| ETNPPL | −1.5344 | −28.2636 |
5.60×10⁻¹⁸ |
5.46×10⁻¹⁴ |
| LGI1 | −1.53461 | −27.5554 |
9.33×10⁻¹⁸ |
5.46×10⁻¹⁴ |
| CFAP46 | −0.6102 | −27.3737 |
1.07×10⁻¹⁷ |
5.46×10⁻¹⁴ |
| FZD10 | 1.417835 | 26.67597 |
1.79×10⁻¹⁷ |
7.34×10⁻¹⁴ |
|
CRISPLD1 | 1.174577 | 26.21701 |
2.54×10⁻¹⁷ |
7.43×10⁻¹⁴ |
| FAM179A | −1.39983 | −25.5108 |
4.38×10⁻¹⁷ |
1.02×10⁻¹³ |
| COL3A1 | 0.503541 | 25.48533 |
4.47×10⁻¹⁷ |
1.02×10⁻¹³ |
| ERBB3 | 0.787361 | 24.45334 |
1.02×10⁻¹⁶ |
2.10×10⁻¹³ |
| SCGB1D2 | −1.48211 | −23.5802 |
2.11×10⁻¹⁶ |
3.94×10⁻¹³ |
CEM
To investigate biological correlations among DEGs, a
CEM with 484 nodes and 116,886 interactions was constructed based
on the SCC, of which each interaction possessed a weight value to
reveal the interacted strength between two genes. The weight
distribution for interactions in this CEM showed the characteristic
of good adjacent matrix that weighs on its diagonal was nearly
equal to 1, which suggested that the CEM had a good network scale
property. The greater the weight value, the more likely the
interaction was related to the occurrence of disease. In
particular, an edge between RASSF2 and LHFPL2 had the
highest weight of 0.998, which indicated that the edge or the two
genes may be associated with SMA. In addition, to further evaluate
the activities of genes in interactions of high weights,
topological degree centrality analysis was conducted on all the
nodes in the CEM. The assortativity coefficient for the CEM was
0.393, indicating that the network had perfect assortative mixing
patterns.
Generally speaking, a network with too many
interactions might be too generic and interactions with low weight
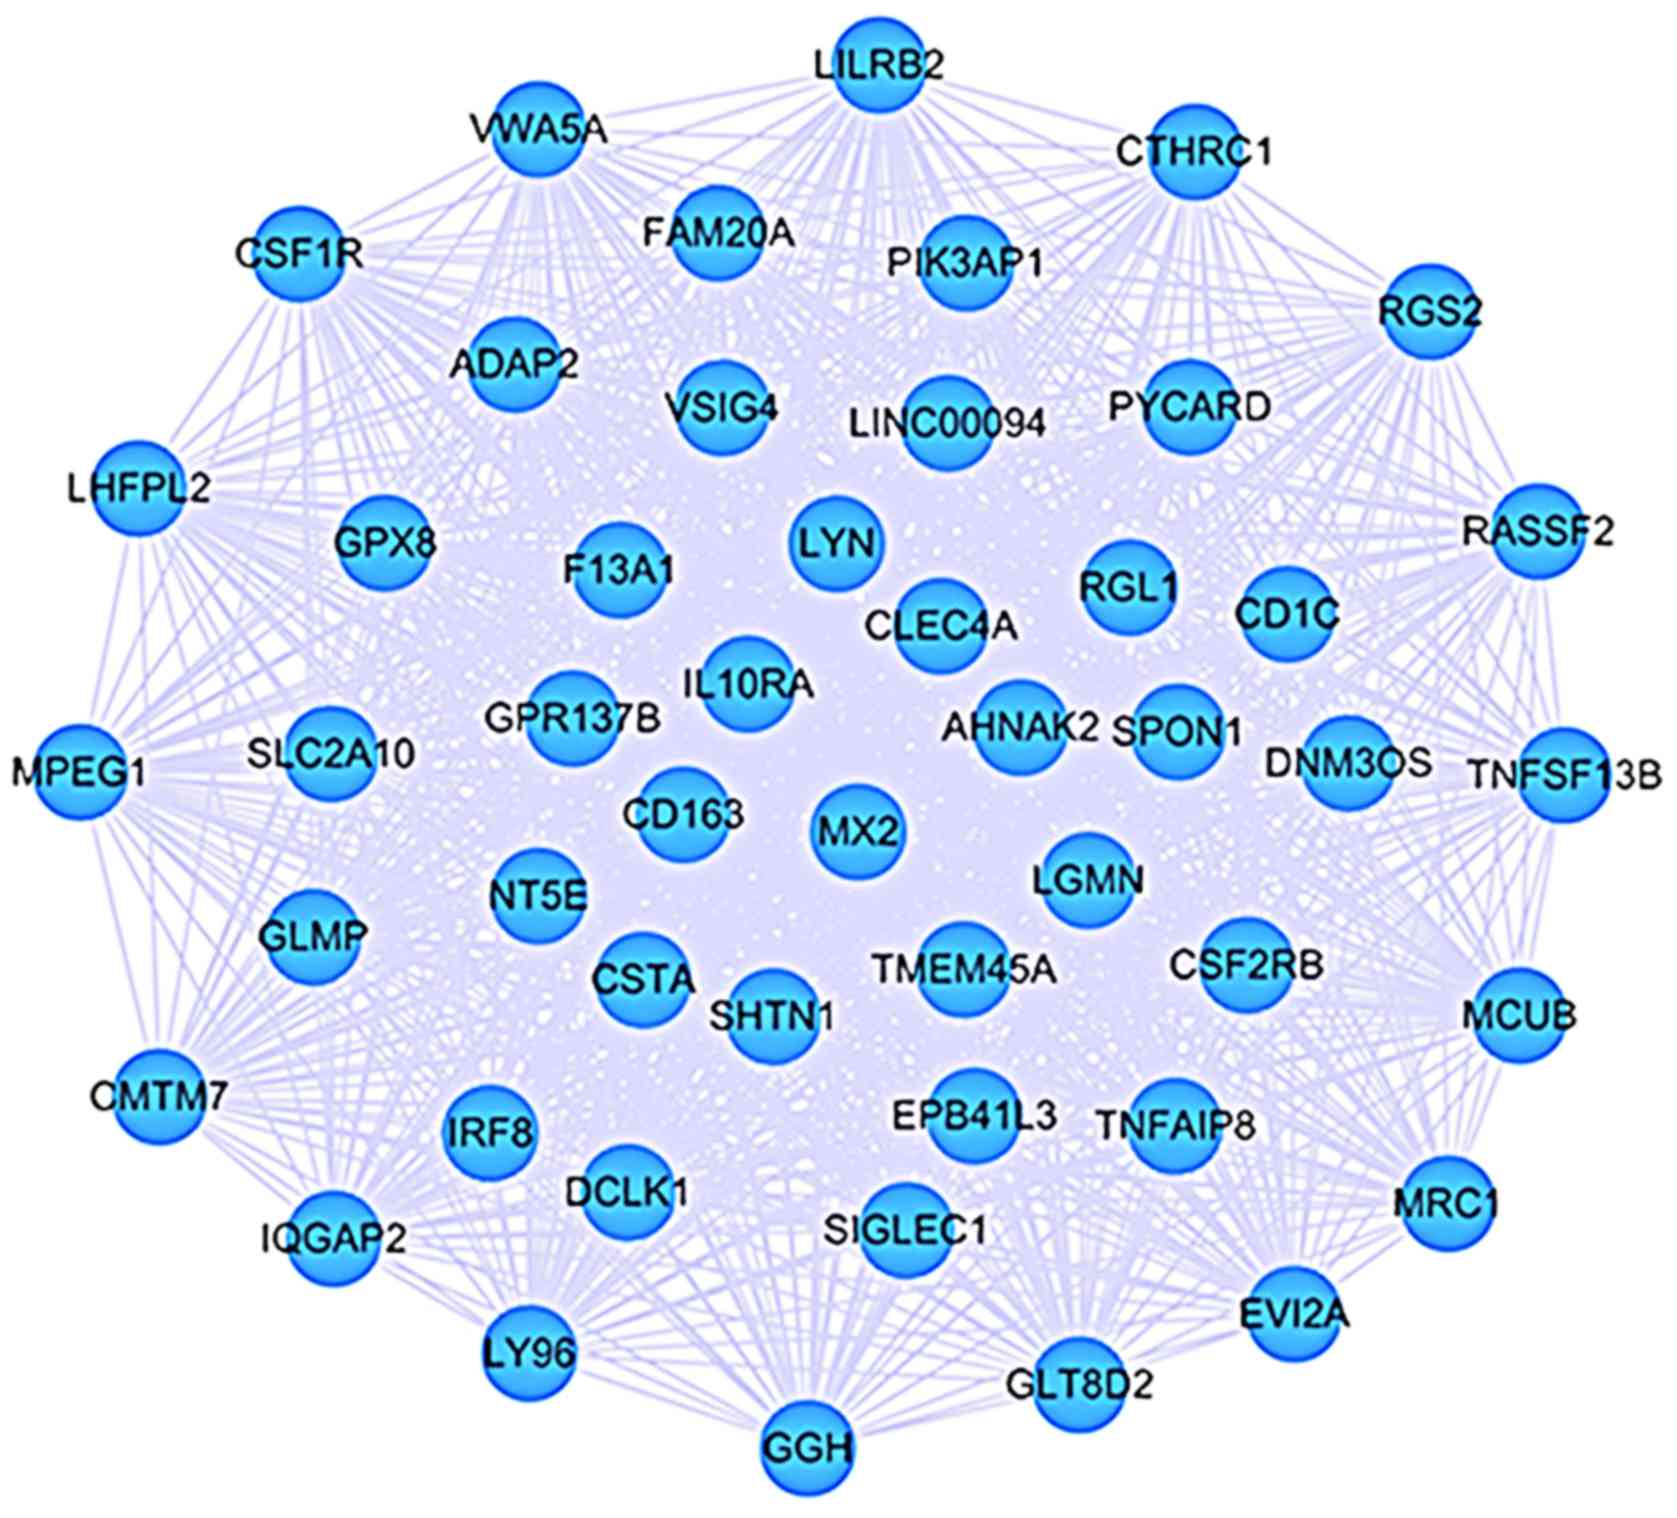
are not as significant as high ones. Thus, we extracted a
sub-network from the CEM by selecting those interactions with
weight >0.8 and visualized it by Cytoscape software (Fig. 2). There were 485 nodes and 1,146
edges, of which nodes were on the behalf of DEGs and edges
represented interactions between two DEGs with weight >0.8.
Gene function inference
Generally, genes with similar neighbors may share
common properties. Thus we performed the gene function inference
for SMA based on the differential co-expression network. Firstly,
neighbor voting algorithm was employed to perform the gene function
prediction by integrating differential co-expression network and GO
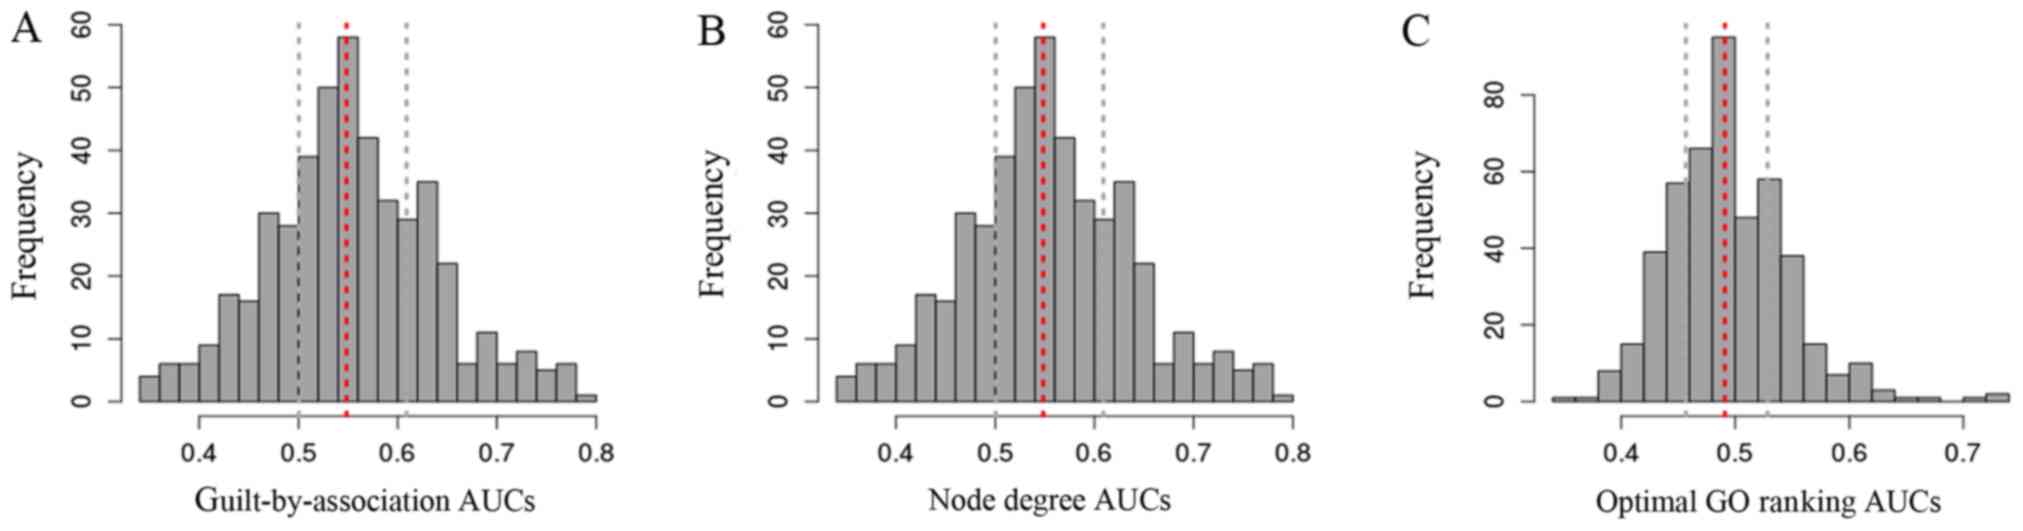
annotations. The AUC value was implemented to determine the
performance metric for each GO annotation, and GO terms with AUC
>0.7 was regarded as candidate gene functions. The distribution
of AUC scores from the neighbor voting algorithm is shown in
Fig. 3. Among 466 GO terms, 141
terms were identified under AUC >0.5. By calculating the
multifunctionality score for each DEG, we generated a list of genes
ranked by multifunctionality score, i.e., the optimal ranking gene
list. Based on the optimal ranking gene list, GO terms with AUC
>0.7 were defined as the optimal gene functions for SMA,
including cell morphogenesis (AUC = 0.724), cell morphogenesis
involved in differentiation (AUC = 0.724), ossification (AUC =
0.703). The details are shown in Table
II.
| Table II.Optimal gene functions for SMA. |
Table II.
Optimal gene functions for SMA.
| ID | Term | Domain | AUCs |
|---|
| GO:0000902 | Cell
morphogenesis |
Biological_process | 0.724619 |
| GO:0000904 | Cell morphogenesis
involved in differentiation |
Biological_process | 0.724619 |
| GO:0001503 | Ossification |
Biological_process | 0.703075 |
Discussion
In the present study, we aimed to predict key gene
functions in SMA patients by using a network-based GBA method,
since the network-based approach could systematically investigate
the molecular complexity of a particular disease and identify
potential signatures through bio-molecular networks rather than
individual genes (18).
Simultaneously, network co-expressed analysis enhances the
statistical confidence of individual connections, increases overlap
with protein interaction, and take advantage of mathematical
convenience. Moreover, previous studies have shown that GBA
variants can ingrease statistical confidence in predicting gene
function, assuming that the associations in the data of a gene are
necessary in establishing guilt (19). Notably, an integration of
co-expression network and the GBA algorithm would provide a new
manner to predict significant gene functions and reveal molecular
mechanism underlying SMA.
On the basis of SCC method, a CEM for progressors
was constructed on DEGs, and further a sub-network of weight
>0.8 was extracted from the CEM. Of note, we found that
TYRP1, ETNPPL and another top 10 genes had high degree both
in CEM and its sub-network, which indicated their importance as
progressors. The groups of Becker et al and Rousseau et
al thought that the dys-regulation of TYRP1 may disturb
the normal development of cells and tissues, resulting in brain
damage and even nervous system injury (20,21).
Veiga-da-Cunha et al suggest that the ETNPPL-mediated
degradation of ethanolaminephosphate could balance the
concentration of that metabolite, which might contribute to mental
disorders such as schizophrenia was in the CNS (22). LGI1 is mainly used for
cognitive dysfunction and seizures, and is mostly expressed in
neurons and serum LGI1 autoantibodies in patients with
limbic encephalitis (LE) (23,24). In
line with these findings, the expression of three genes was
associated with nervous system injury, which play an important role
in SMA.
The rest of the genes do not appear to be related to
SMA or nerves, for instance, FZD10 is the receptor for Wnt
molecules and is extensively involved in various cell processes
(25,26); Crispld1 acts in tissue culture
models of osteoarthritis (27);
FAM179A plays a role in detecting ALK fusion of patients
with non-small cell lung cancer (28); COL3A1 encodes the pro-α1
chains of type III collagen, which is found in extensible
connective tissues such as uterus, skin, lung, intestine and the
vascular system (29); ERBB3
has a neuregulin binding domain (30). To the best of our knowledge, this is
the first study to reveal the key role of these genes in human SMA
patients, which could be useful in future research in treatment and
prediction of SMA.
Particularly, 466 background GO terms were
identified as gene sets for the present study. Most significantly,
3 gene sets with AUC >0.7 were denoted as key gene functions for
SMA, including cell morphogenesis, cell morphogenesis involved in
differentiation and ossification. In detail, as the development of
shape or morphologies in cells or organisms, morphogenesis is a
fundamental but poorly understood process throughout biology
(31,32). SMA is a motor neuron disease that
degenerates the spinal cord and muscle. Studis confirmed that there
are some in vivo benefits of intrathecal injection of neural
stem-cell in severe SMA mice following differentiation of neural
stem cells to alter cell morphogenesis from mouse spinal cord
neurospheres (33,34). Therefore, our finding has important
implications for the molecular mechanisms of SMA.
Besides, molecular function represents elemental
activities, such as differentiation and ossification (35), describing the actions of a gene
product at the molecular level. It is a common phenomenon that a
given gene presents in one or more molecular functions (such as
TYRP1 described above), and two or more genes exhibit the same one
function (36,37). Genes with similar functions observe
similar annotation patterns in their neighborhood, regardless of
the distance between them in the interaction network. Using
single-stranded DNA oligonucleotides into the cells, Anderton and
Mastaglia (34) induced a genome
editing of SMN2 at the molecular level, thus modifying the
SMA-iPSC-derived motor neurons. Upon direct transplantation into a
severe SMA mouse model, muscle connections and ossification were
all ameliorated (34,38).
In conclusion, we have predicted 3 seed gene
functions for SMA compared with control utilizing network-based GBA
algorithm. The findings might give great insights to reveal
pathological and molecular mechanism underlying SMA. However, the
expression data used in this work was recruited from the open
access database, and the 3 seed gene functions are not validated.
In future research, these validations should be performed. Of note,
we are preparing the microarray data ourselves at present and
further study should be conducted on the role these validations are
to play.
Acknowledgements
Not applicable.
Funding
No funding was received.
Availability of data and materials
The datasets used and/or analyzed during the present
study are available from the corresponding author on reasonable
request.
Authors' contributions
WY and JH conceived the study and drafted the
manuscript. JM and YF acquired the data; QH, ZW and TY analyzed the
data and revised the manuscript. All authors read and approved the
final study.
Ethics approval and consent to
participate
Not applicable.
Patient consent for publication
Not applicable.
Competing interests
The authors declare that they have no competing
interests.
References
|
1
|
Nurputra DK, Lai PS, Harahap NI, Morikawa
S, Yamamoto T, Nishimura N, Kubo Y, Takeuchi A, Saito T, Takeshima
Y, et al: Spinal muscular atrophy: From gene discovery to clinical
trials. Ann Hum Genet. 77:435–463. 2013. View Article : Google Scholar : PubMed/NCBI
|
|
2
|
Grunseich C, Zukosky K, Kats IR, Ghosh L,
Harmison GG, Bott LC, Rinaldi C, Chen KL, Chen G, Boehm M, et al:
Stem cell-derived motor neurons from spinal and bulbar muscular
atrophy patients. Neurobiol Dis. 70:12–20. 2014. View Article : Google Scholar : PubMed/NCBI
|
|
3
|
Kirschner J, Schorling D, Hauschke D,
Rensing-Zimmermann C, Wein U, Grieben U, Schottmann G, Schara U,
Konrad K, Müller-Felber W, et al: Somatropin treatment of spinal
muscular atrophy: A placebo-controlled, double-blind crossover
pilot study. Neuromuscul Disord. 24:134–142. 2014. View Article : Google Scholar : PubMed/NCBI
|
|
4
|
Gillis J and Pavlidis P: The impact of
multifunctional genes on ‘guilt by association’ analysis. PLoS One.
6:e172582011. View Article : Google Scholar : PubMed/NCBI
|
|
5
|
Gillis J and Pavlidis P: ‘Guilt by
Association’ is the exception rather than the rule in gene
networks. PLoS Comput Biol. 8:e10024442012. View Article : Google Scholar : PubMed/NCBI
|
|
6
|
Zeng X, Liao Y, Liu Y and Zou Q:
Prediction and validation of disease genes using HeteSim Scores.
IEEE/ACM Trans Comput Biol Bioinformatics. 14:687–695. 2017.
View Article : Google Scholar
|
|
7
|
Wang S, Huang G, Hu Q and Zou Q: A
network-based method for the identification of putative genes
related to infertility. Biochim Biophys Acta 1860 (11 Pt B).
2716–2724. 2016.
|
|
8
|
Molet M, Stagner JP, Miller HC, Kosinski T
and Zentall TR: Guilt by association and honor by association: The
role of acquired equivalence. Psychon Bull Rev. 20:385–390. 2013.
View Article : Google Scholar : PubMed/NCBI
|
|
9
|
Vey G: Metagenomic guilt by association:
An operonic perspective. PLoS One. 8:e714842013. View Article : Google Scholar : PubMed/NCBI
|
|
10
|
Mulcahy PJ, Iremonger K, Karyka E,
Herranz-Martín S, Shum KT, Tam JK and Azzouz M: Gene therapy: A
promising approach to treating spinal muscular atrophy. Hum Gene
Ther. 25:575–586. 2014. View Article : Google Scholar : PubMed/NCBI
|
|
11
|
Raleigh DP: Guilt by association: The
physical chemistry and biology of protein aggregation. J Phys Chem
Lett. 5:2012–2014. 2014. View Article : Google Scholar : PubMed/NCBI
|
|
12
|
Verleyen W, Ballouz S and Gillis J:
Measuring the wisdom of the crowds in network-based gene function
inference. Bioinformatics. 31:745–752. 2014. View Article : Google Scholar : PubMed/NCBI
|
|
13
|
Levy PD: Guilt by association - A closer
look at calcium, heart failure, and mortality. J Card Fail.
21:628–629. 2015. View Article : Google Scholar : PubMed/NCBI
|
|
14
|
Ashburner M, Ball CA, Blake JA, Botstein
D, Butler H, Cherry JM, Davis AP, Dolinski K, Dwight SS, Eppig JT,
et al: The Gene Ontology Consortium. Gene ontology: Tool for the
unification of biology. Nat Genet. 25:25–29. 2000. View Article : Google Scholar : PubMed/NCBI
|
|
15
|
Huntley RP, Harris MA, Alam-Faruque Y,
Blake JA, Carbon S, Dietze H, Dimmer EC, Foulger RE, Hill DP,
Khodiyar VK, et al: A method for increasing expressivity of Gene
Ontology annotations using a compositional approach. BMC
Bioinformatics. 15:1552014. View Article : Google Scholar : PubMed/NCBI
|
|
16
|
Gene Ontology Consortium: Gene Ontology
Consortium: Going forward. Nucleic Acids Res 43 (D1). D1049–D1056.
2015. View Article : Google Scholar
|
|
17
|
Zou M, Liu Z, Zhang XS and Wang Y:
NCC-AUC: An AUC optimization method to identify multibiomarker
panel for cancer prognosis from genomic and clinical data.
Bioinformatics. 15:3330–3338. 2015. View Article : Google Scholar
|
|
18
|
Gillis J and Pavlidis P: The role of
indirect connections in gene networks in predicting function.
Bioinformatics. 27:1860–1866. 2011. View Article : Google Scholar : PubMed/NCBI
|
|
19
|
Willson DF: Outcomes and risk factors in
pediatric ventilator-associated pneumonia: Guilt by association.
Pediatr Crit Care Med. 16:299–301. 2015. View Article : Google Scholar : PubMed/NCBI
|
|
20
|
Becker D, Otto M, Ammann P, Keller I,
Drögemüller C and Leeb T: The brown coat colour of Coppernecked
goats is associated with a non-synonymous variant at the TYRP1
locus on chromosome 8. Anim Genet. 46:50–54. 2015. View Article : Google Scholar : PubMed/NCBI
|
|
21
|
Rousseau B, Larrieu-Lahargue F, Javerzat
S, Guilhem-Ducléon F, Beermann F and Bikfalvi A: The
tyrp1-Tag/tyrp1-FGFR1-DN bigenic mouse: a model for selective
inhibition of tumor development, angiogenesis, and invasion into
the neural tissue by blockade of fibroblast growth factor receptor
activity. Cancer Res. 64:2490–2495. 2004. View Article : Google Scholar : PubMed/NCBI
|
|
22
|
Veiga-da-Cunha M, Hadi F, Balligand T,
Stroobant V and Van Schaftingen E: Molecular identification of
hydroxylysine kinase and of ammoniophospholyases acting on
5-phosphohydroxy-L-lysine and phosphoethanolamine. J Biol Chem.
287:7246–7255. 2012. View Article : Google Scholar : PubMed/NCBI
|
|
23
|
Vives-Rodriguez A, Sivaraju A and Louis
ED: Drop attacks: A clinical manifestation of LGI1 encephalitis.
Neurol Clin Pract. 7:442–443. 2017. View Article : Google Scholar : PubMed/NCBI
|
|
24
|
Nikolaus M, Jackowski-Dohrmann S, Prüss H,
Schuelke M and Knierim E: Morvan syndrome associated with CASPR2
and LGI1 antibodies in a child. Neurology. 90:183–185. 2018.
View Article : Google Scholar : PubMed/NCBI
|
|
25
|
Chen Y, Huang Q, Zhou H, Wang Y, Hu X and
Li T: Inhibition of canonical WNT/β-catenin signaling is involved
in leflunomide (LEF)-mediated cytotoxic effects on renal carcinoma
cells. Oncotarget. 7:50401–50416. 2016.PubMed/NCBI
|
|
26
|
Chen Z, Gao Y, Yao L, Liu Y, Huang L, Yan
Z, Zhao W, Zhu P and Weng H: LncFZD6 initiates Wnt/β-catenin and
liver TIC self-renewal through BRG1-mediated FZD6 transcriptional
activation. Oncogene. 37:3098–3112. 2018. View Article : Google Scholar : PubMed/NCBI
|
|
27
|
Wan Y, Rogers MB and Szabo-Rogers HL: A
six-gene expression toolbox for the glands, epithelium and
chondrocytes in the mouse nasal cavity. Gene Expr Patterns.
27:46–55. 2018. View Article : Google Scholar : PubMed/NCBI
|
|
28
|
Cui S, Zhang W, Xiong L, Pan F, Niu Y, Chu
T, Wang H, Zhao Y and Jiang L: Use of capture-based next-generation
sequencing to detect ALK fusion in plasma cell-free DNA of patients
with non-small-cell lung cancer. Oncotarget. 8:2771–2780.
2017.PubMed/NCBI
|
|
29
|
Shojaati G, Khandaker I, Sylakowski K,
Funderburgh ML, Du Y and Funderburgh JL: Compressed collagen
enhances stem cell therapy for corneal scarring. Stem Cells Transl
Med. 7:487–494. 2018. View Article : Google Scholar : PubMed/NCBI
|
|
30
|
Drilon A, Somwar R, Mangatt BP, Edgren H,
Desmeules P, Ruusulehto A, Smith RS, Delasos L, Vojnic M,
Plodkowski AJ, et al: Response to ERBB3-directed targeted therapy
in NRG1-rearranged cancers. Cancer Discov. 8:686–695. 2018.
View Article : Google Scholar : PubMed/NCBI
|
|
31
|
Varner VD and Nelson CM: Cellular and
physical mechanisms of branching morphogenesis. Development.
141:2750–2759. 2014. View Article : Google Scholar : PubMed/NCBI
|
|
32
|
Wu M and Li J: Numb family proteins: Novel
players in cardiac morphogenesis and cardiac progenitor cell
differentiation. Biomol Concepts. 6:137–148. 2015. View Article : Google Scholar : PubMed/NCBI
|
|
33
|
Kolb SJ and Kissel JT: Spinal muscular
atrophy. Neurol Clin. 33:831–846. 2015. View Article : Google Scholar : PubMed/NCBI
|
|
34
|
Anderton RS and Mastaglia FL: Advances and
challenges in developing a therapy for spinal muscular atrophy.
Expert Rev Neurother. 15:895–908. 2015.PubMed/NCBI
|
|
35
|
Takahashi K, Satoh M, Takahashi Y, Osaki
T, Nasu T, Tamada M, Okabayashi H, Nakamura M and Morino Y:
Dysregulation of ossification-related miRNAs in circulating
osteogenic progenitor cells obtained from patients with aortic
stenosis. Clin Sci (Lond). 130:1115–1124. 2016. View Article : Google Scholar : PubMed/NCBI
|
|
36
|
Li J, Jiang D, Zhou H, Li F, Yang J, Hong
L, Fu X, Li Z, Liu Z, Li J, et al: Expression of
RNA-interference/antisense transgenes by the cognate promoters of
target genes is a better gene-silencing strategy to study gene
functions in rice. PLoS One. 6:e174442011. View Article : Google Scholar : PubMed/NCBI
|
|
37
|
Klie S, Nikoloski Z and Selbig J:
Biological cluster evaluation for gene function prediction. J
Comput Biol. 21:428–445. 2014. View Article : Google Scholar : PubMed/NCBI
|
|
38
|
Zanetta C, Nizzardo M, Simone C, Monguzzi
E, Bresolin N, Comi GP and Corti S: Molecular therapeutic
strategies for spinal muscular atrophies: Current and future
clinical trials. Clin Ther. 36:128–140. 2014. View Article : Google Scholar : PubMed/NCBI
|