Introduction
Mesenchymal stem cells (MSCs) are a type of adult
stem cell that are capable of multipotential differentiation. The
cells can be easily separated, extracted, cultured and amplified.
Through migration, proliferation and differentiation, MSCs form
osteoblasts (OBs) in the absorption areas of bones, and
subsequently mediate the formation of new bone tissue to maintain
the dynamic balance in bone function (1). The differentiation of MSCs to OBs is a
complex process that is regulated and controlled by multiple
signaling pathways, and with which the mitogen-activated protein
kinase (MAPK) signaling pathway is closely associated. In addition,
previous studies have indicated that the p38 MAPK, extracellular
signal-regulated kinase (ERK)1/2 and c-Jun NH2-terminal
kinase (JNK) signaling pathways play important roles in inducing
the differentiation of MSCs to OBs (2–4).
Quercetin is one of the most ubiquitous
bioflavonoids, occurring widely in plants in the form of glycosides
or aglycone, which exert a number of pharmacological effects,
functioning as antioxidants (5),
anti-inflammatory agents (6),
antitumor agents (7) and metabolic
regulators (8). Quercetin has also
been shown to exert a positive pharmacological effect on bone
metabolism (9–11), although the underlying mechanism of
action is yet to be fully elucidated. However, there have been a
limited number of studies investigating the effects of quercetin on
MSCs. In the present study, MSCs from Sprague Dawley rats were
treated with quercetin, with or without the presence of inhibitors
against p38 MAPK, ERK1/2 and JNK, in order to investigate the roles
of the p38 MAPK, ERK1/2 and JNK signaling pathways in
quercetin-induced osteogenic differentiation. Thus, the cellular
and molecular biological mechanisms of quercetin in protecting the
bone mass were clarified, and the cellular and molecular basis
underlying the activity of quercetin in preventing and treating
bone metabolic diseases, including osteoporosis, were defined.
Materials and methods
Animals and drugs
In total, five female specific-pathogen free Sprague
Dawley rats (age, 3 months; weight, 230±10 g), provided by the
Laboratory Animal Center of Southern Medical University (approval
no. Guangdong SCXK 2006–0015; Guangzhou, China), were used for the
extraction of MSCs. The present study was approved by the Animal
Ethics Committee of Jinan University (Guangzhou, China).
Quercetin was provided by the National Institute for
the Control of Pharmaceutical and Biological Products (Beijing,
China; lot no. 10081-2009072).
Reagents
Superior fetal bovine serum (FBS) was purchased from
Tianjin Haoyang Biological Manufacture Co., Ltd (Wuhan, China).
Minimum essential medium α (MEMα) was obtained from HyClone (GE
Healthcare, Logan, UT, USA), and an alkaline phosphatase (ALP)
assay kit was purchased from Nanjing Jiancheng Bioengineering
Institute (Nanjing, China). SB203580 (SB; inhibitor of p38 MAPK),
PD98059 (PD; inhibitor of ERK1/2) and SP600125 (SP; inhibitor of
JNK) were obtained from Millipore Corporation (Bedford, MA, USA).
Trypsin was purchased from Amresco LLC (Solon, OH, USA). Dimethyl
sulfoxide (DMSO) was from obtained from Sigma-Aldrich (St. Louis,
MO, USA) and TRIzol reagent was purchased from Invitrogen Life
Technologies (Carlsbad, CA, USA). Furthermore,
3-(4,5-dimethylthiazol-2-yl)-2,5-diphenyltetrazolium bromide (MTT)
and a bicinchoninic acid (BCA) Protein Assay kit were purchased
from the Beyotime Institute of Biotechnology (Haimen, China). A
rabbit anti-rat glyceraldehyde phosphate dehydrogenase polyclonal
antibody, rabbit anti-rat ERK1/2 and rabbit anti-rat phosphorylated
ERK1/2 (p-ERK1/2) primary antibodies and a goat anti-rabbit
secondary antibody were obtained from Cell Signaling Technology,
Inc. (Danvers, MA, USA). The SYBR® Green polymerase chain reaction
(PCR) Master Mix was purchased from Toyobo Co., Ltd. (Osaka,
Japan), and rat bone γ-carboxyglutamate protein (BGP) and rat
collagen type I (COL I) ELISA kits were purchased from Hebei
Bacarray Biotechnology Development Co., Ltd (Xingtai, China). An
enhanced chemiluminescence (ECL) western blotting detection system
was purchased from Pierce Biotechnology, Inc. (Rockford, IL, USA).
All other reagents and chemicals were of analytical grade and were
available commercially.
Extraction and culture of MSCs
Anesthesia was induced by an intramuscular injection
of 20% urethane (6 mg/kg; Aladdin Chemical, Shanghai, China). The
Sprague Dawley rats were sacrificed by cervical dislocation, and
steeped in 75% ethanol for 10 min. The tibias and femurs were
separated, and the soft tissues were removed. The bones were
further soaked in 75% ethanol for 10–30 sec on the benchtop. After
the tibias and femurs were washed five times with D-Hanks solution,
the metaphyses on both sides of the tibias and femurs were resected
and the marrow cavity was washed repeatedly with MEM/α containing
10% FBS using a 5-ml syringe. The cells were repeatedly pipetted
with a 1-ml syringe to form a single-cell suspension at a density
of 1.0×10⁹ cells/l. A 25-cm2 culture flask
was seeded with the single-cell suspension and placed in an
incubator at 37°C under 5% CO2. After 24 h, half the
medium was replaced, and after 48 h, all the medium was replaced.
The culture medium was changed every three days. The
third-generation cells were used for the subsequent
experiments.
MSC subculture and purification
After culture for 7–10 days, the first-generation
cells reached 90% confluence and the culture medium was discarded.
The cells were washed three times with D-Hanks solution and
digested with 0.25% trypsin for 1–2 min. Under an inverted optical
microscope (Olympus IX51; Olympus Optical Co. Ltd., Tokyo, Japan),
the adherent cells appeared contracted, almost circular and with
broad intercellular spaces. Fresh complete culture medium was
subsequently added (with a straw to avoid bubbles) to terminate the
digestion. The single-cell suspension was diluted 1:2 with the
culture medium, and seeded into two 25-cm2 culture
flasks. The culture flasks were placed in an incubator at a
constant temperature of 37°C, with 5% CO2 and saturated
humidity. The medium was replaced every three days. After 7–9 days,
when the cells had reached 70 or 80% confluence, the culture
process was repeated. This natural purification method was used to
purify the MSCs.
Identification of MSCs
The morphology of the MSCs cultured for 24 h, 3
days, 7 days or 12 days was observed with an inverted optical
microscope.
Cell induction
Cells of the third generation, at a density of
1.0×10⁵ cells/ml per well, were seeded in six-well
flat-bottomed plates (60 mm) with a coverslip in each well to
prepare the cell slides. The slides were used for electron
microscopic analysis to determine the phenotype of the MSCs.
Osteogenic differentiation
When the cells reached 80% confluence, the MSCs were
cultured in human mesenchymal stem cell osteogenic differentiation
medium (Cyagen Biosciences Inc., Santa Clara, CA, USA), which was
replaced every three days. The cells were induced with osteogenic
medium and cultured for 21 days. After induction for 12 days, the
cell slides containing the OBs were washed 3–5 times with D-Hanks
solution and fixed in acetone for 10 min. Subsequently, the slides
were washed 3–5 times with distilled water, incubated with
β-glycerophosphate at 37°C for 6 h, and washed several times with
distilled water. The slides were placed into 2% nitric acid cobalt
for 3–5 min, rinsed several times with distilled water and soaked
in 1% ammonium sulfide for 2 min. Finally, the slides were rinsed
with distilled water and dried naturally. Following osteogenic
induction for 21 days, the cell slides were washed 3–5 times with
D-Hanks solution, fixed with 75% alcohol for 15 min, washed 3–5
times with D-Hanks solution again, and stained with 0.2% Alizarin
red (Sigma-Aldrich) for 30 min to observe the mineralization nodes
at a magnification of ×3.
Adipogenic differentiation
The MSCs were subsequently cultured in adipogenic
differentiation medium (Cyagen Biosciences Inc.) which was replaced
every 3 days and cultured for 15 days. After 15 days, the cell
slides containing adipocytes were observed and photographed
microscopically. In addition, the cells were stained with Oil Red O
(Amresco LLC) to quantify the extent of adipogenic differentiation.
The cells were washed several times with distilled water prior to
photographing.
Detection of surface markers
The third-generation cells were digested with 0.25%
trypsin, and complete medium was added to terminate the digestion
reaction. The cell suspension was centrifuged at 800 × g to collect
the cells. The cells were subsequently resuspended in D-Hanks
solution and centrifuged three times 800 × g. D-Hanks solution was
then added to resuspend the cells as a single-cell suspension at a
density of 1×10⁶ cell/ml. An aliquot (500 ml) of the
single-cell suspension was placed in each of four 1.5-µl Eppendorf
tubes, and incubated with pure culture medium and monoclonal
antibodies (fluorescein-isothiocyanate-conjugated mouse anti-rat
CD29, CD34 or CD45; Cell Signaling Technology, Inc., Beverly, MA,
USA) at 37°C for 30 min. After the cells were washed three times
with D-Hanks solution, the cells were quantified by flow cytometry
on ice using an EPICS-XL flow cytometer (Beckman Coulter, Brea, CA,
USA).
MTT assay
Third-generation cells, digested with 0.25% trypsin,
were resuspended and seeded in 96-well plates at a density of
5.0×10⁶ cells/l per well. Following incubation at 37°C
under 5% CO2, the MSCs were divided into a control group
and groups treated with different concentrations of quercetin
(0.01, 0.1, 1, 10 or 100 µmol/l). Six replicate samples were
included in each group. The cells were incubated with MEM/α
containing 10% FBS for 24 h. The various concentrations of
quercetin were added to the respective groups, and the cells were
cultured with the same concentration of MEM/α for an additional 24
h. After the culture medium was discarded, the cells were cultured
with 20 µl MTT solution (5 mg/ml) in an incubator at 37°C under 5%
CO2 for 4 h. The MTT solution was subsequently discarded
and 100 µl DMSO was added to each well. The culture plate was
oscillated (E24 incubator shaker; Eppendorf AG, Hamburg, Germany)
at a low speed until the crystals were completely dissolved. The
absorbance value of each sample was measured with a microplate
reader (MK3; Thermo, Minnesota, MN, USA) at a wavelength of 490
nm.
ALP activity assay
MSCs were seeded in 96-well plates at a density of
1.0×10⁸ cells/l and cultured in an incubator at 37°C
under conditions of 5% CO2 until they reached 80%
confluence. After 24 h, the MSCs were divided into a control group
and different concentration quercetin treatment groups (0.01, 0.1,
1, 10 or 100 µmol/l), with six replicates in each group. The cells
were incubated with MEM/α containing 10% FBS for 24 h. Quercetin
was subsequently added to the respective groups, and the cells were
cultured with the same volume of MEM/α for 72 h. The culture medium
in each well was discarded and the cells were washed two or three
times with D-Hanks solution. A 1-ml sample of cell lysate was added
to each well and incubated at 4°C for 30 min, after which the cell
lysate was collected. The total concentration of protein was
determined using the BCA Protein Assay kit, while ALP activity was
measured using the ALP kit.
Groups and treatment methods
Cells were seeded in six 60-mm flat-bottomed plates
at a density of 1.0×10⁸ cells/l, and divided into a
control group, quercetin group, quercetin + PD group, quercetin +
SB group, quercetin + SP group and quercetin + PD + SB + SP group.
The cells were incubated with serum-free MEM/α for 24 h, and the
inhibitor-treated groups were incubated with the respective
inhibitors for 30 min. To inhibit the p38 MAPK, JNK or ERK1/2
signaling pathways, the cells were incubated with a p38 MAPK
inhibitor (SB), JNK inhibitor (SP) or ERK1/2 inhibitor (PD) for 30
min. Quercetin was then added to each well. The final
concentrations were as follows: PD ERK1/2 pathway inhibitor, 10
µmol/l; SB p38 MAPK pathway inhibitor, 3 µmol/l; and SP JNK pathway
inhibitor, 5 µmol/l. The final concentration of quercetin was 10
µmol/l.
ELISAs
After the cells were incubated with serum free MEM/α
for 24 h, the control group was incubated with the MEM/α medium and
the inhibitor-treated groups were incubated with the respective
inhibitors for 72 h. Quercetin was then added to the
inhibitor-treated wells and the final concentrations were as
previously described; the culture medium was discarded.
Subsequently, the cells were washed three times with D-Hanks
solution, and a 150-µl sample of cell lysate was added to each well
and incubated at 4°C for 30 min, after which the cell lysate was
collected. The BCA Protein Assay kit was used to determine the
total concentration of protein, and the ALP assay kit was used to
quantify the expression of ALP. In addition, ELISAs were performed
to quantify the protein expression of COL I and BGP.
Immunoblotting analysis
Inhibitors were added to the cell suspensions as
aforementioned. Following culture of the cells for 24 h, the
culture medium was discarded and the cells were washed three times
with D-Hanks solution. An aliquot (100 µl) of cell lysate was then
added to each well and the plates were incubated at 4°C for 30 min,
after which the cell lysate was collected. The BCA Protein Assay
kit was used to determine the total protein concentration. The cell
proteins (30 µg) were separated by sodium dodecyl sulfate-12%
polyacrylamide gel electrophoresis and transferred onto
polyvinylidene difluoride membranes, which were blocked with buffer
containing 0.05% Tween-20 and 5% defatted milk. Subsequently, the
membranes were reacted with the primary antibodies at 4°C for 12 h,
washed three times with D-Hanks solution and reacted with the
secondary antibodies at room temperature for 1 h. Next, the
membranes were washed and rinsed with ECL detection reagents, and
the banding patterns images were captured with ECL software
(ChemiDoc™ XRS+ system; Bio-Rad, Hercules, CA, USA). The
primary antibodies (all from Cell Signaling Technology, Inc.)
included rabbit anti-rat ERK1/2 (#4695), rabbit anti-rat JNK
(#9258), rabbit anti-rat p38 MAPK (#8690), rabbit anti-rat P-ERK1/2
(#4094), rabbit anti-rat P-p38 MAPK (#9215), rabbit anti-rat P-JNK
(#4668) and rabbit anti-rat glyceraldehyde 3-phosphate
dehydrogenase (GAPDH; #5174); all at a dilution of 1:1,000. The
goat anti-rabbit secondary antibody (#7074; Cell Signaling
Technology, Inc.) was applied to rabbit IgG-H&L (horseradish
peroxidase) at a dilution of 1:3,000. The immunoreactive bands were
visualized with enhanced chemiluminescent substrates on an X-ray
film (Eastman Kodak, Rochester, NY, USA), and the expression levels
of the proteins were detected with the system described in the
Quantity One 1-D® analysis software manual (Bio-Rad Laboratories,
Inc. Hercules, CA, USA).
Fluorescent quantitative PCR
MSCs were cultured for 24 h with the appropriate
inhibitors, as previously described. The total RNA was extracted
from the cells using TRIzol reagent and the total RNA (1 µg) was
reverse transcribed by conversion to cDNA using the iScript cDNA
Synthesis kit according to the manufacturer's instructions
(Bio-Rad). The cDNA was used as the template for fluorescent
quantitative PCR to detect the mRNA expression levels of
transforming growth factor (TGF)-β1, bone morphogenetic protein
(BMP)-2 and core binding factor (CBF)α1. The details of the primers
are provided in Table I.
Quantitative PCR was performed in 96-well plates with a reaction
volume of 20 µl per well, which included 10 µl 2X SYBR® Green PCR
Master Mix, 5 µl cDNA, 0.5 µl each of the forward and reverse
primers (10 µM) and 4 µl dH2O. An ABI PRISM® 7500
Sequence Detection System (Applied Biosystems Life Technologies,
Foster City, CA, USA) was used for the quantitative analysis under
the following conditions: Initial denaturation at 95°C for 5 min,
followed by 40 cycles of denaturation at 95°C for 15 sec, annealing
at 60°C for 15 sec and elongation at 72°C for 32 sec. The
fluorescent signal was collected at the end of the second step
during each cycle and plotted on a graph against the reaction cycle
index. Each sample was analyzed in triplicate and the average cycle
threshold (Ct) was used to analyze the mRNA expression levels of
each gene using the ΔΔCt quantification method.
 | Table I.Primer sequences used for fluorescent
quantitative PCR. |
Table I.
Primer sequences used for fluorescent
quantitative PCR.
| Gene name | Primer sequence |
|---|
| TGF-β1 | F:
5′-TGCTTCAGCTCCACAGAGAA-3′ |
|
| R:
5′-TGGTTGTAGAGGGCAAGGAC-3′ |
| BMP-2 | F:
5′-GTGAGGATTAGCAGGTCTTTG-3′ |
|
| R:
5′-CACCCCACATCACTGAAGTC-3′ |
| CBFα1 | F:
5′-GATGCCTTAGTGCCCAAATGT-3′ |
|
| R:
5′-GGCTGAAGGGTGAAGAAAGC-3′ |
| 18S rRNA | F:
5′-CCTGGATACCGCAGCTAGGA-3′ |
|
| R:
5′-GCGGCGCAATACGAATGCCCC-3′ |
Statistical analysis
SPSS 16.0 software (SPSS, Inc., Chicago, IL, USA)
was used to perform all statistical calculations. Data are
expressed as the mean ± standard deviation. One-way analysis of
variance was used to compare the differences between the
experimental groups, where P<0.05 was considered to indicate a
statistically significant difference.
Results
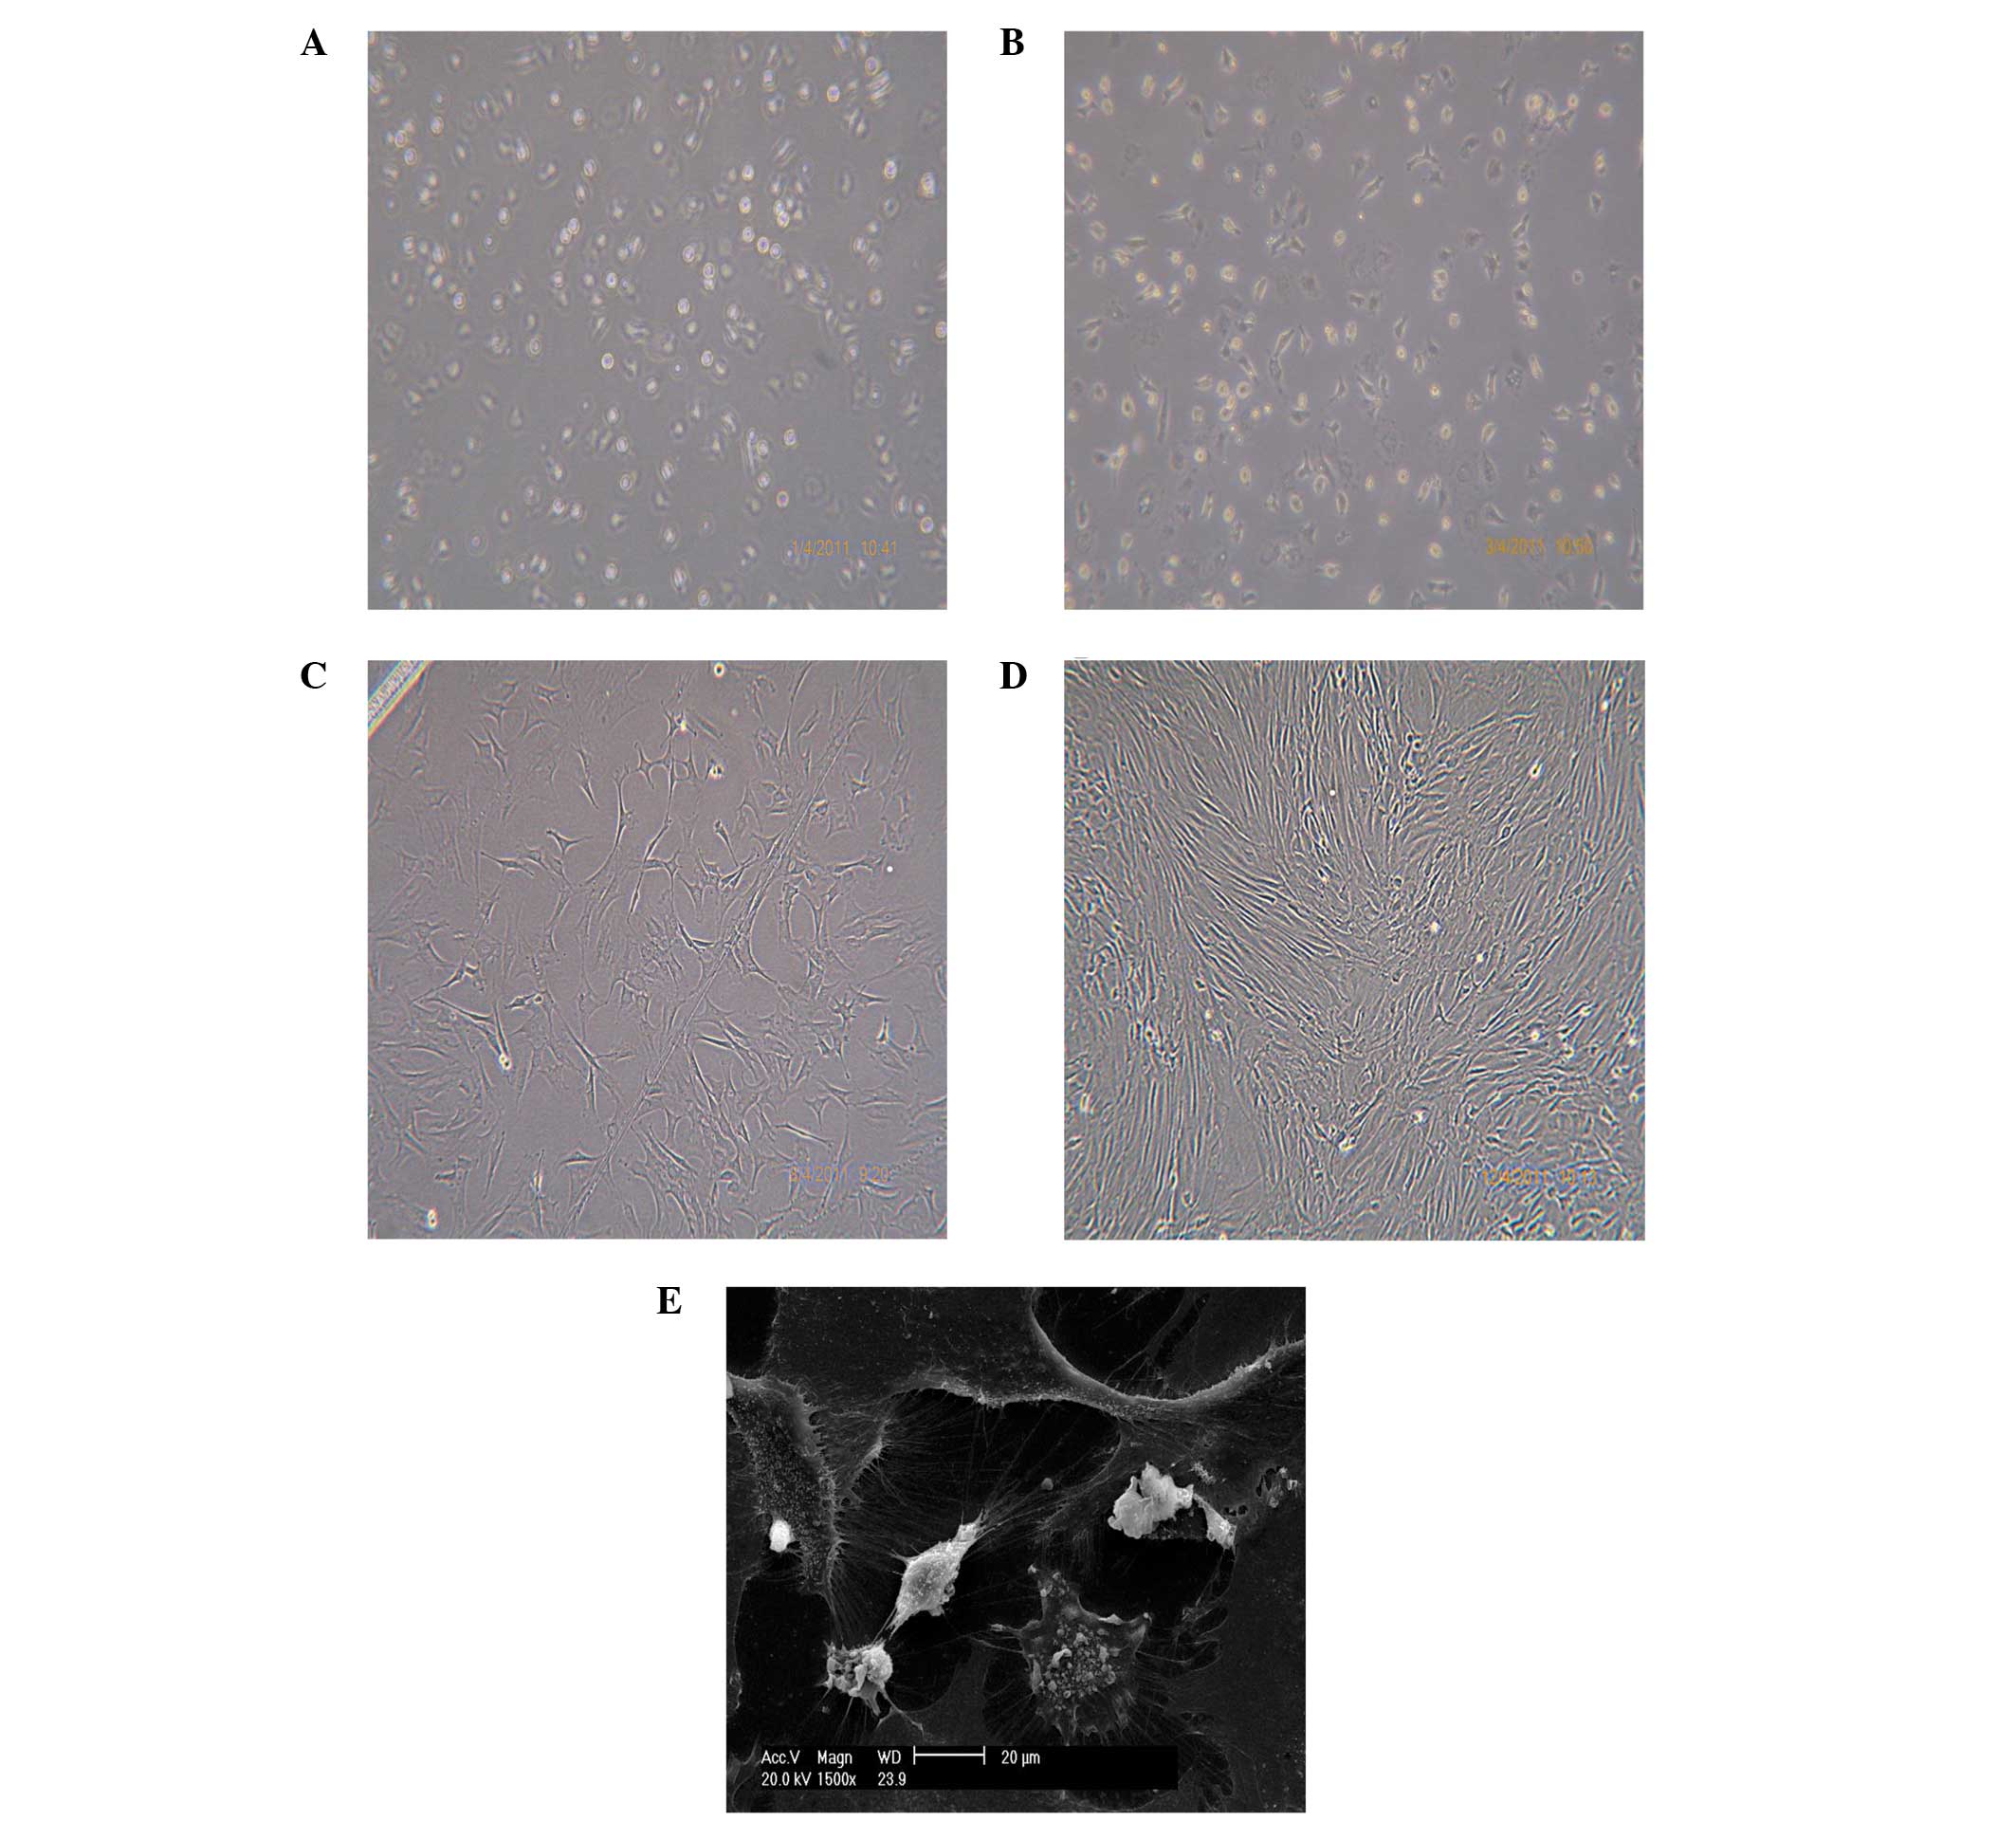
Cell morphology
Morphological assessment revealed that the MSCs
adhered 24 h after extraction. The non-adherent hematopoietic cells
were removed when the culture medium was totally replaced. The MSCs
began to adapt to the in vitro culture and had an almost
circular morphology, as shown in Fig.
1A. After 3 days, prominent filopodia extensions, short rod or
triangular cells, cellular protrusions and an oblate nuclear
morphology were observed, indicating that the cells had divided
rapidly, as shown in Fig. 1B. The
MSCs were stretched, and formed large clusters of stellate cells.
On day 7, the majority of the cells had gradually became fusiform,
with cell colonies beginning to form, and the cells undergoing
rapid proliferation. These cells were used for culture, as shown in
Fig. 1C. On day 12, the
second-generation MSCs had reached 90% confluence. The cells grew
in a swirl shape and established a stable-fibroblast-like
phenotype, as shown in Fig. 1D. On
day 15, scanning electron microscopy was used to observe the MSCs.
The cells appeared as long fusiform shapes or polygons, with a lot
of intracellular granular material and slender microspines and silk
on their surfaces, surrounded by a number of matrix components, as
shown in Fig. 1E.
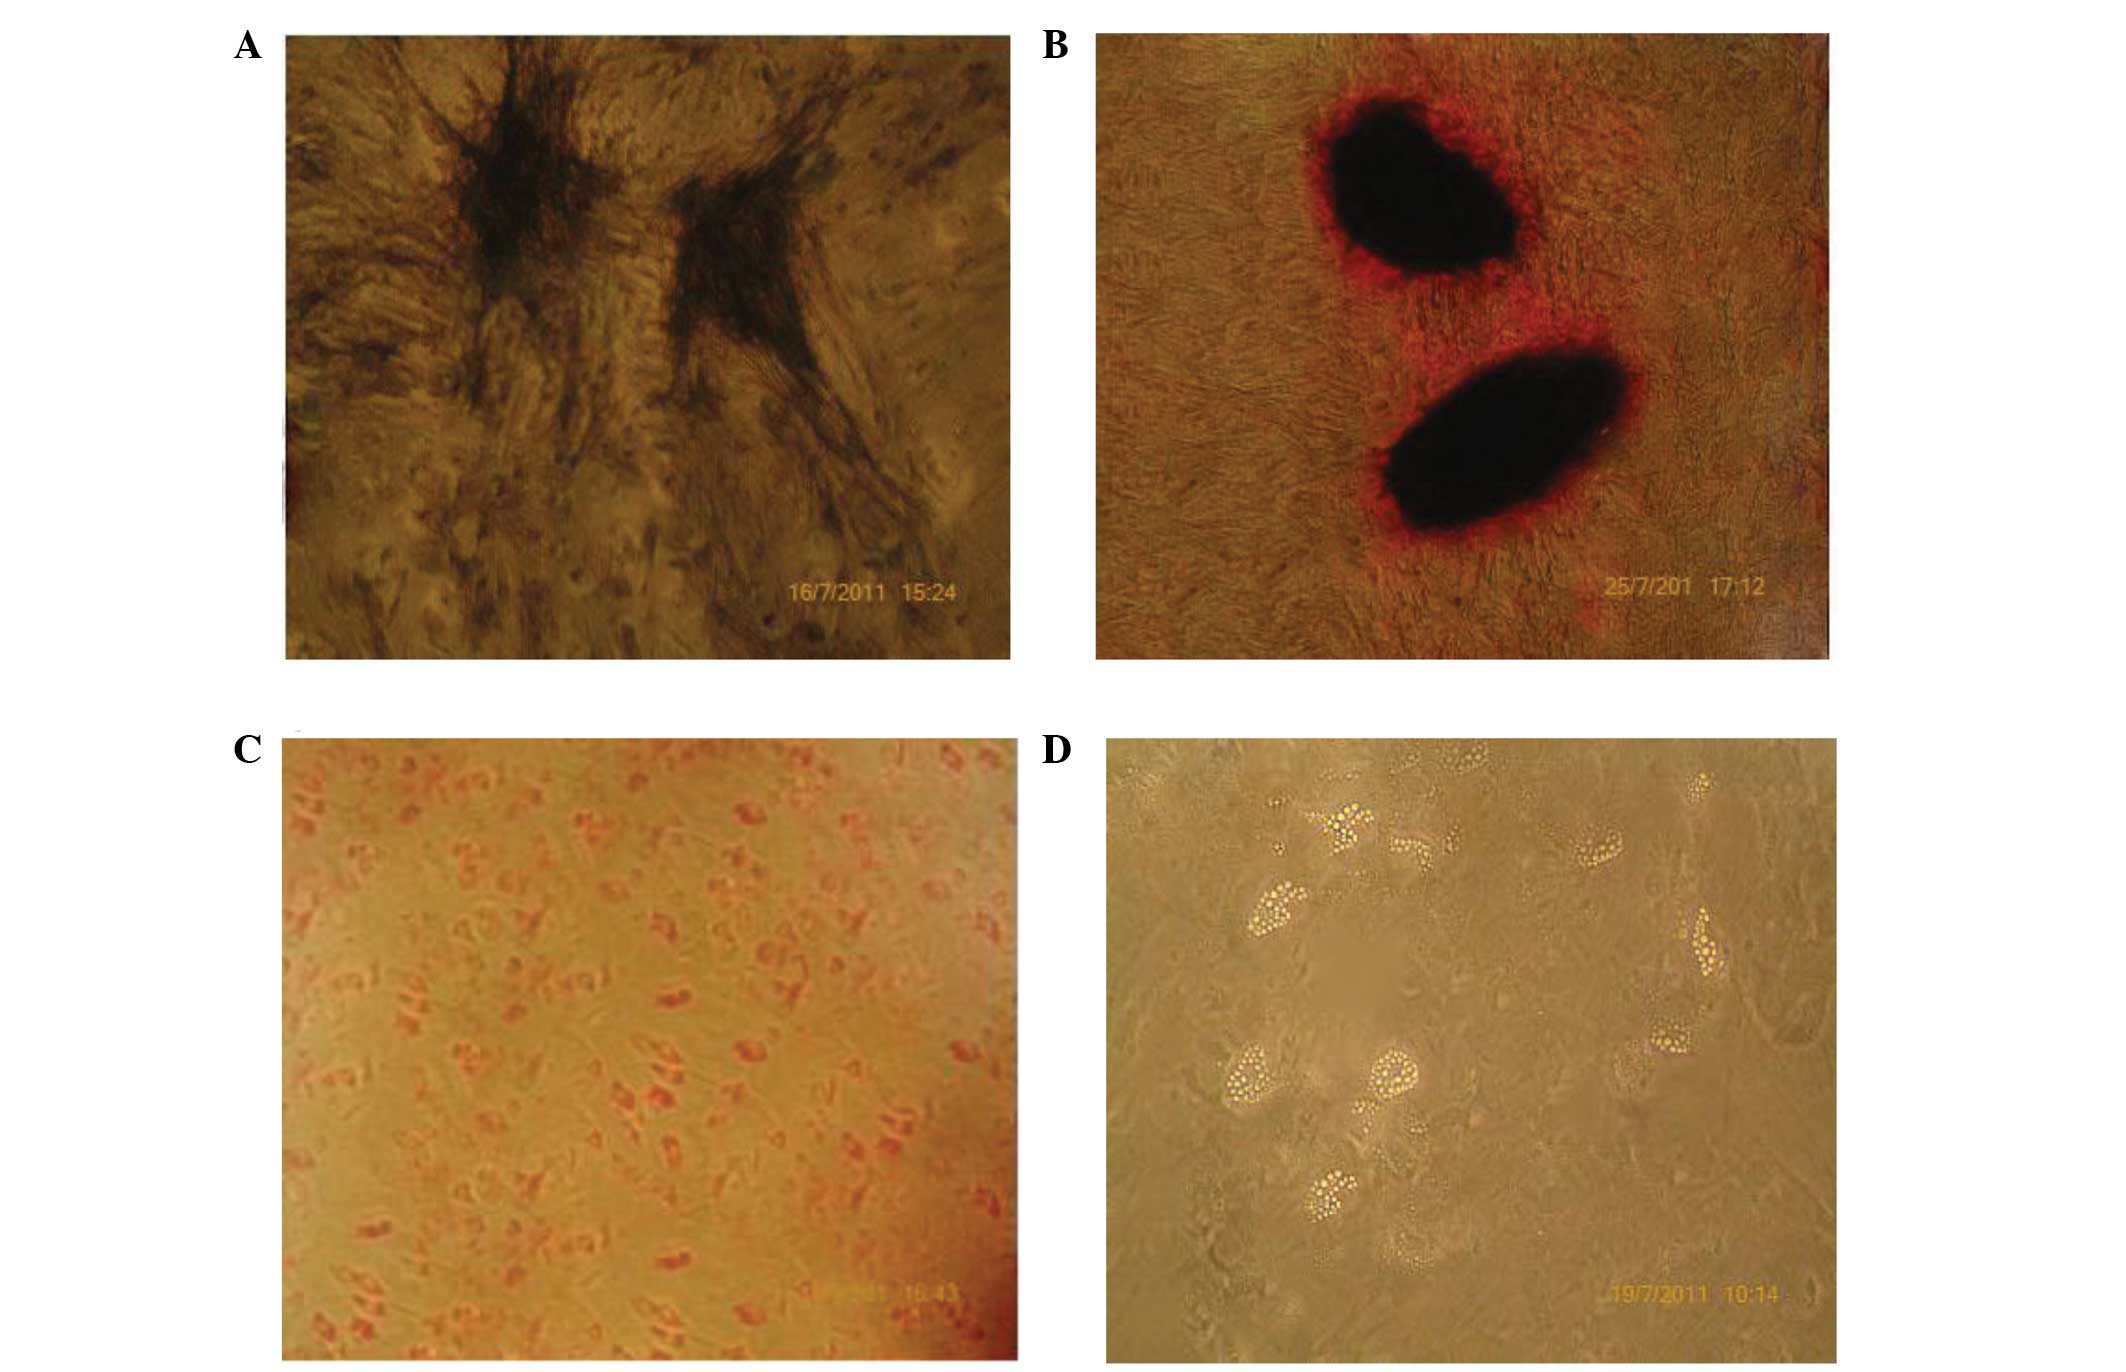
Effects of osteogenic or adipogenic
induction
When the MSCs were cultured in osteogenic medium,
their morphology gradually changed from long fusiform cells to
rectangular or polygonal cells. In addition, the quantity of the
extracellular matrix increased in the clusters of cells. Numerous
black granules were observed in the extracellular and cellular
matrix, whereas the color of the nuclei became lighter. Following
culture for 12 days, the cells stained positively for ALP and a
number of brown or black granular precipitates appeared in the
cytoplasm, as shown in Fig. 2A. The
cells were stained with Alizarin red to detect the mineralization.
On day 21, Alizarin red staining revealed that a number of cells
had gathered into nodules, in which the cells took on a cubic or
cone shape. Furthermore, the cells were aligned in a multilayer
structure and the secretion of a large numbers of granules was
evident. Almost the whole cell layer was heavily covered with a
mineralized matrix, as shown in Fig.
2B. When the MSCs were cultured in adipogenic medium, the
morphology was shown to gradually become round or oval. On day 15,
adipogenic differentiation was confirmed through staining with Oil
Red O, as shown in Fig. 2C. In
addition, the adipocytes were readily identified by their
intracellular accumulation of neutral lipids, as shown in Fig. 2D.
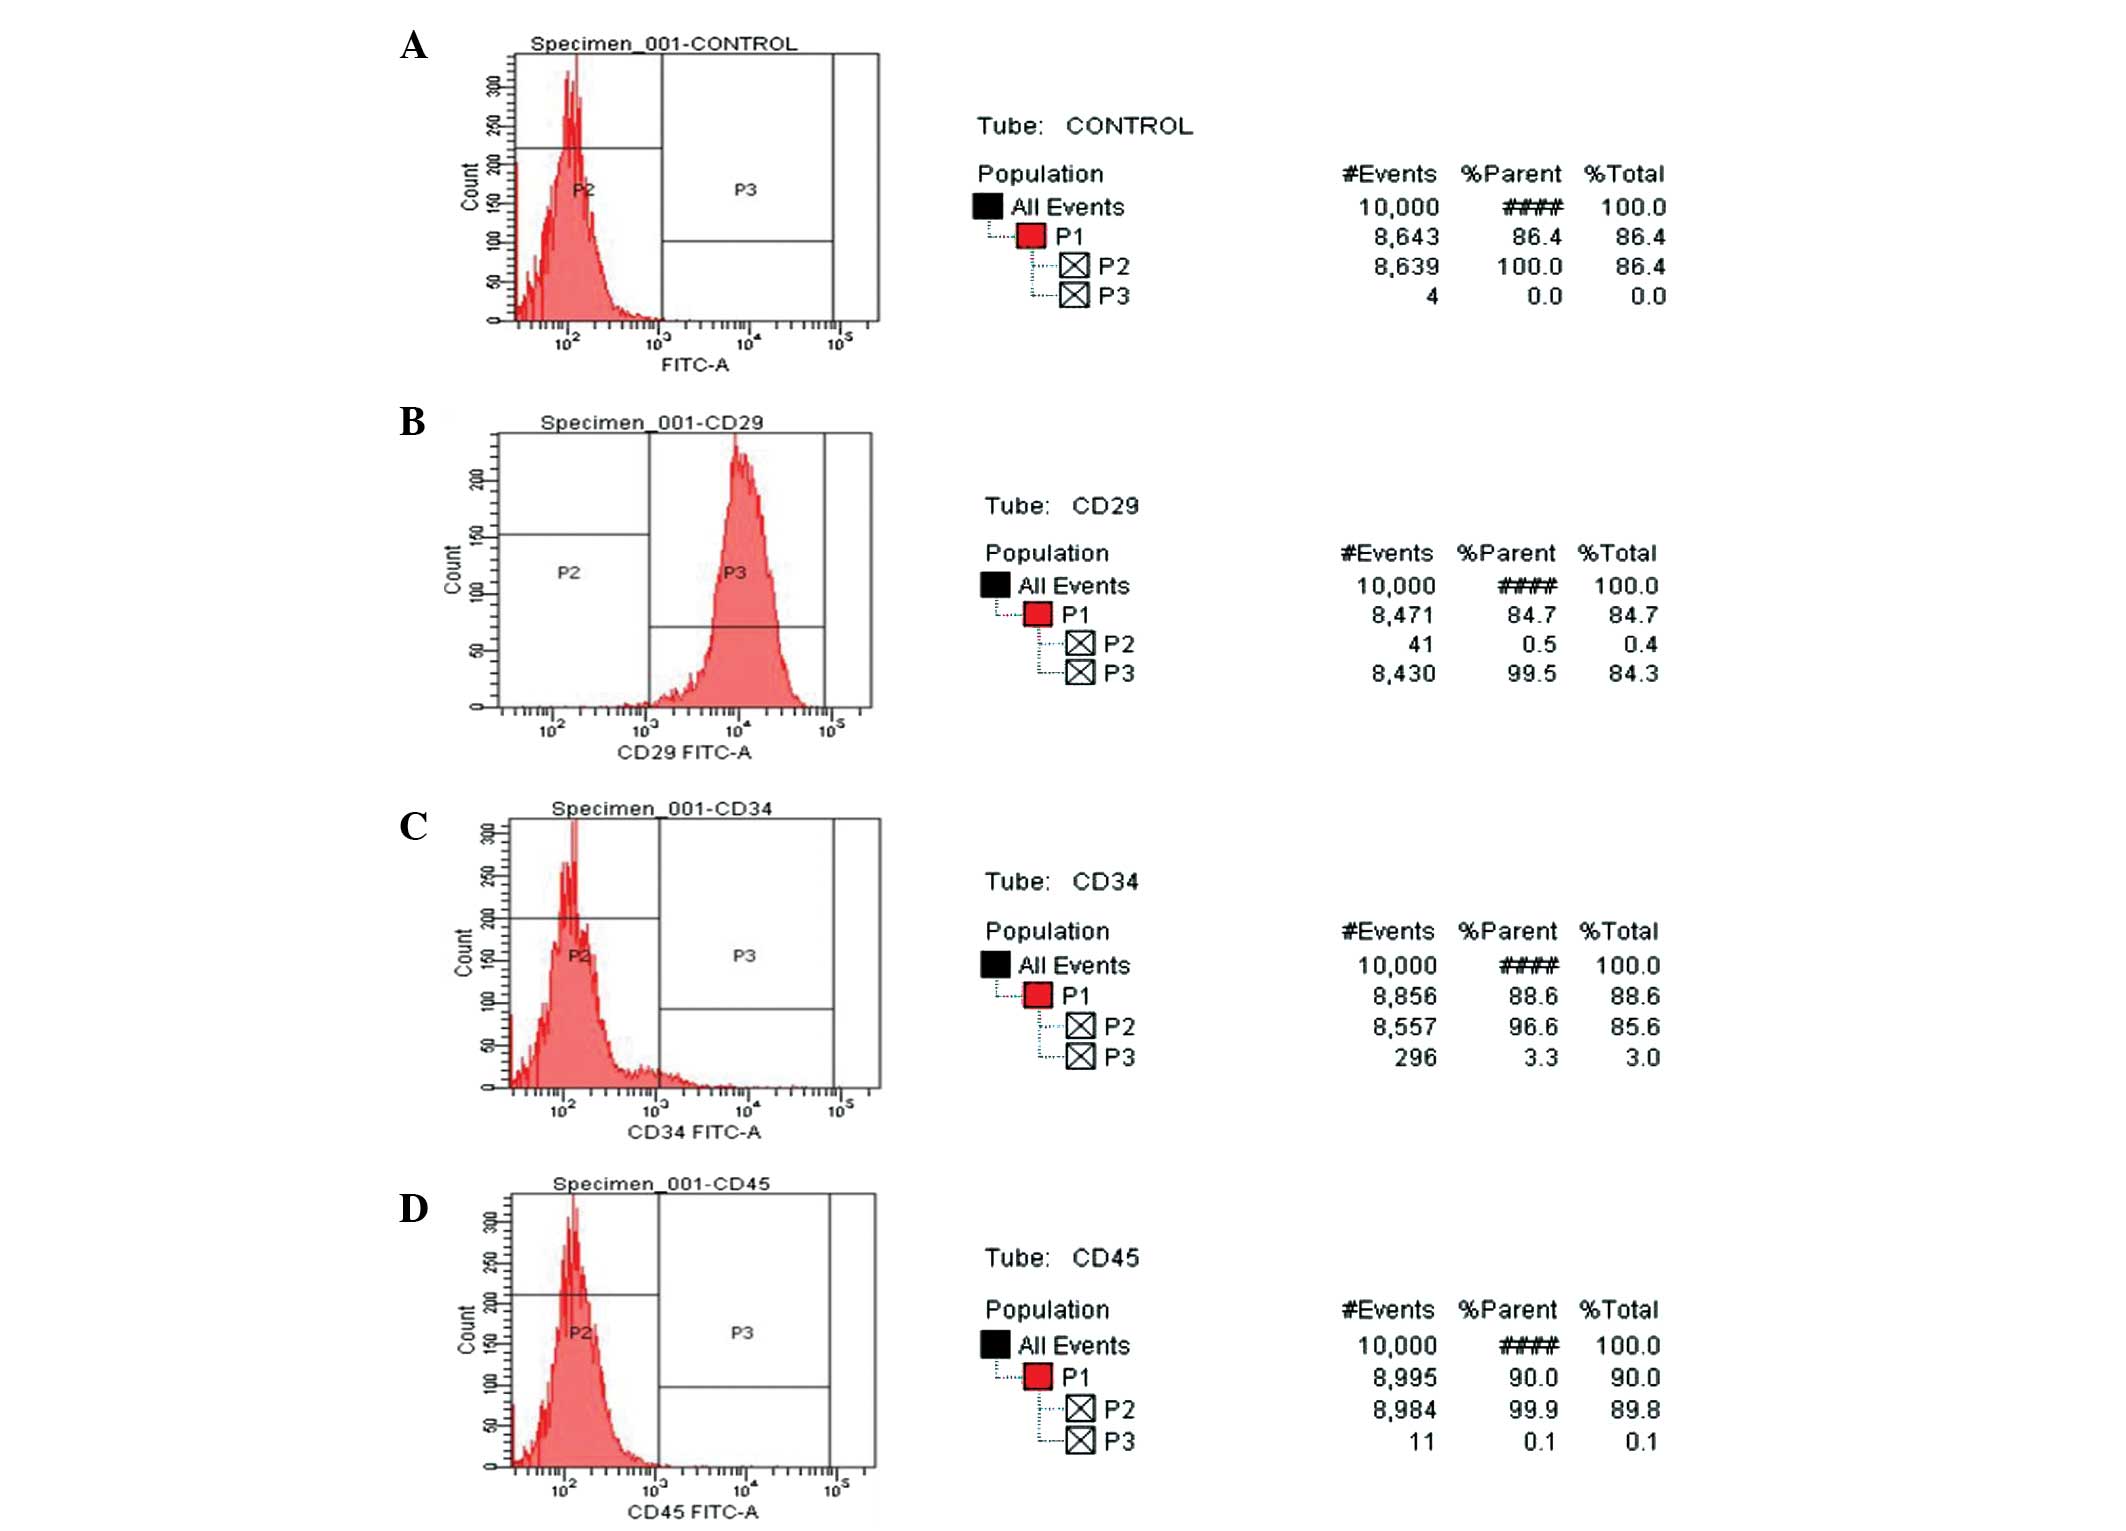
Detection of cell surface markers
Detection of the surface makers, CD29, CD34 and
CD45, in the third-generation MSCs was performed using flow
cytometry (Fig. 3). The majority
(99.5%) of the MSCs expressed the mesenchymal surface marker, CD29,
whereas only 3.3% of the cells expressed the hematopoietic marker,
CD34, and only 0.3% of the MSCs expressed the hematopoietic marker,
CD45.
Effects of different quercetin
concentrations on MSC proliferation and ALP expression
In the MTT assay, the absorbance values of the
groups treated with 0.1, 1 or 10 µmol/l quercetin were
significantly higher compared with those of the control group
(P<0.05); there were no statistically significant differences
between the three groups themselves. The absorbance values of the
groups treated with 0.01 or 100 µmol/l quercetin were not
significantly different compared with the control group
(P>0.05). In addition, the expression of ALP was significantly
higher in the cells treated with 0.1, 1 and 10 µmol/l quercetin, as
compared with the control group (P<0.05). Furthermore, ALP
expression was significantly higher following treatment with 10
µmol/l quercetin when compared with the levels following treatment
with 0.1 or 1 µmol/l quercetin (P<0.05). Therefore, 10 µmol/l
quercetin was the optimal concentration for promoting the
osteogenic differentiation of MSCs, as shown in Table II.
| Table II.Effects of different concentrations of
quercetin on MSC proliferation and ALP expression. |
Table II.
Effects of different concentrations of
quercetin on MSC proliferation and ALP expression.
| Quercetin
(µmol/l) | A-value | ALP (U/g
protein) |
|---|
| 0 |
0.809±0.029 |
13.176±0.449b |
| 0.01 |
0.779±0.064 |
14.285±0.392b |
| 0.1 |
0.946±0.121a |
18.267±0.265a,b |
| 1 |
0.976±0.121a |
20.128±0.131a,b |
| 10 |
0.955±0.046a |
26.204±0.848a |
| 100 |
0.763±0.090 |
12.501±0.250a,b |
ALP activity, COL I content and BGP
content in the different groups
Protein expression levels of ALP, COL I and BGP
increased significantly in the quercetin group when compared with
that in the control group (P<0.05). However, with the
introduction of inhibitors, the expression of ALP, COL I and BGP
decreased in the quercetin + PD, quercetin + SP and quercetin + PD
+ SB + SP groups, as compared with that in the quercetin group
(P<0.05). In the quercetin + SB group, the expression of ALP was
lower than that in the control and quercetin groups (P<0.05);
however, the expression of COL I was higher compared with the
control group (P<0.05), although the value did not differ
significantly from the quercetin group (P>0.05). Furthermore,
the expression of BGP was lower than that in the quercetin group
(P<0.05); however, the difference was not statistically
significant when compared with the control group (P>0.05), as
shown in Table III.
| Table III.ALP activity, COL I content and BGP
content in the different groups. |
Table III.
ALP activity, COL I content and BGP
content in the different groups.
| Group | ALP (U/g
protein) | COL I
(103 U/g protein) | BGP (µg/g
protein) |
|---|
| Control |
20.363±1.182 |
3.007±0.102 |
5.842±0.234 |
| QUE |
35.499±1.208b |
3.756±0.163b |
7.580±0.245a |
| QUE + PD |
23.880±1.035d |
3.160±0.076d |
6.437±0.273c |
| QUE + SB |
10.590±1.033d,b |
3.822±0.031b |
5.600±0.226c |
| QUE + SP |
29.670±1.032d |
3.002±0.020d |
4.143±0.025c |
| QUE + PD + SB +
SP |
19.837±1.001d |
2.790±0.045d |
4.249±0.111c |
Phosphorylation of JNK, ERK1/2 and p38
MAPK in the different groups
As shown in Fig. 4,
the phosphorylation of p38 MAPK (P-p38MAPK), ERK1/2 (P-ERK1/2) and
JNK (P-JNK) increased significantly (P<0.05) in the quercetin
group when compared with the control group. However, the
phosphorylation of p38 MAPK, ERK1/2 and JNK decreased (P<0.05)
in the quercetin + SB, quercetin + PD, quercetin + SP and quercetin
+ PD + SB + SP groups when compared with the quercetin group, as
shown in Fig. 4.
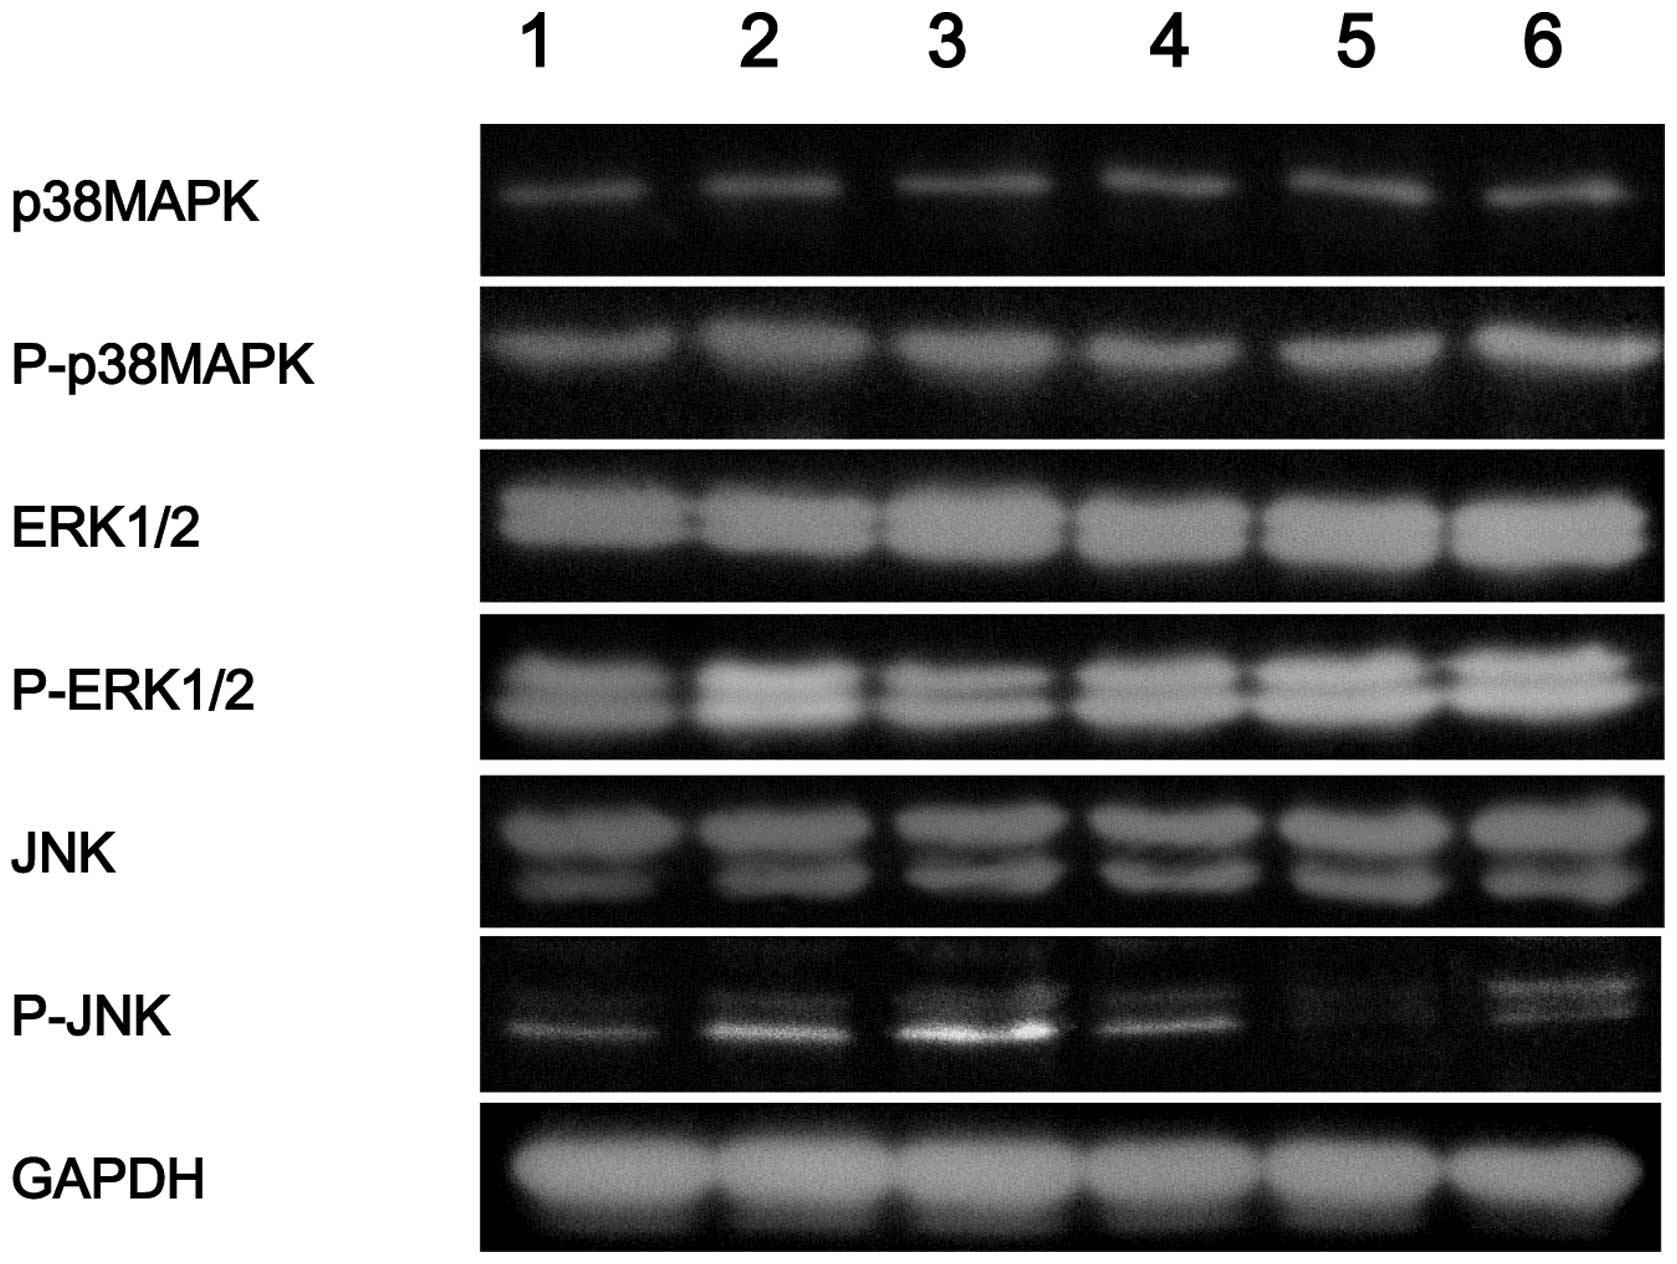 | Figure 4.Western blot analysis showing the
protein expression of P-p38 MAPK, P-ERK1/2 and P-JNK in each group.
Lane 1, control; lane 2, quercetin group; lane 3: quercetin + PD
group; lane 4, quercetin + SB group; lane 5, quercetin + SP group;
lane 6, quercetin + PD + SB + SP group. PD, PD98059; SB, SB203580;
SP, SP600125; MAPK, mitogen-activated protein kinase; ERK,
extracellular signal-regulated kinase; JNK, c-Jun
NH2-terminal kinase; GAPDH, glyceraldehyde phosphate
dehydrogenase; P, phosphorylated. |
mRNA expression levels of TGF-β1,
BMP-2 and CBFα1 in the different groups
The mRNA expression levels of TGF-β1, BMP-2 and
CBFα1 increased in the quercetin group when compared with the
control group (P<0.05). However, the mRNA expression levels of
TGF-β1, BMP-2 and CBFα1 decreased significantly (P<0.05) in the
quercetin + PD and quercetin + SP groups when compared with those
in the quercetin group. In the quercetin + SB group, the expression
of BMP-2 decreased (P<0.05); however, there was no statistically
significant difference in the expression levels of TGF-β1 or CBFα1
(P>0.05) when the compared with the quercetin group.
Furthermore, in the quercetin + PD + SB + SP group, the mRNA
expression level of CBFα1 decreased (P<0.05); however, there
were no statistically significant differences in the expression
levels of TGF-β1 and BMP-2 when compared with the quercetin group,
as shown in Fig. 5.
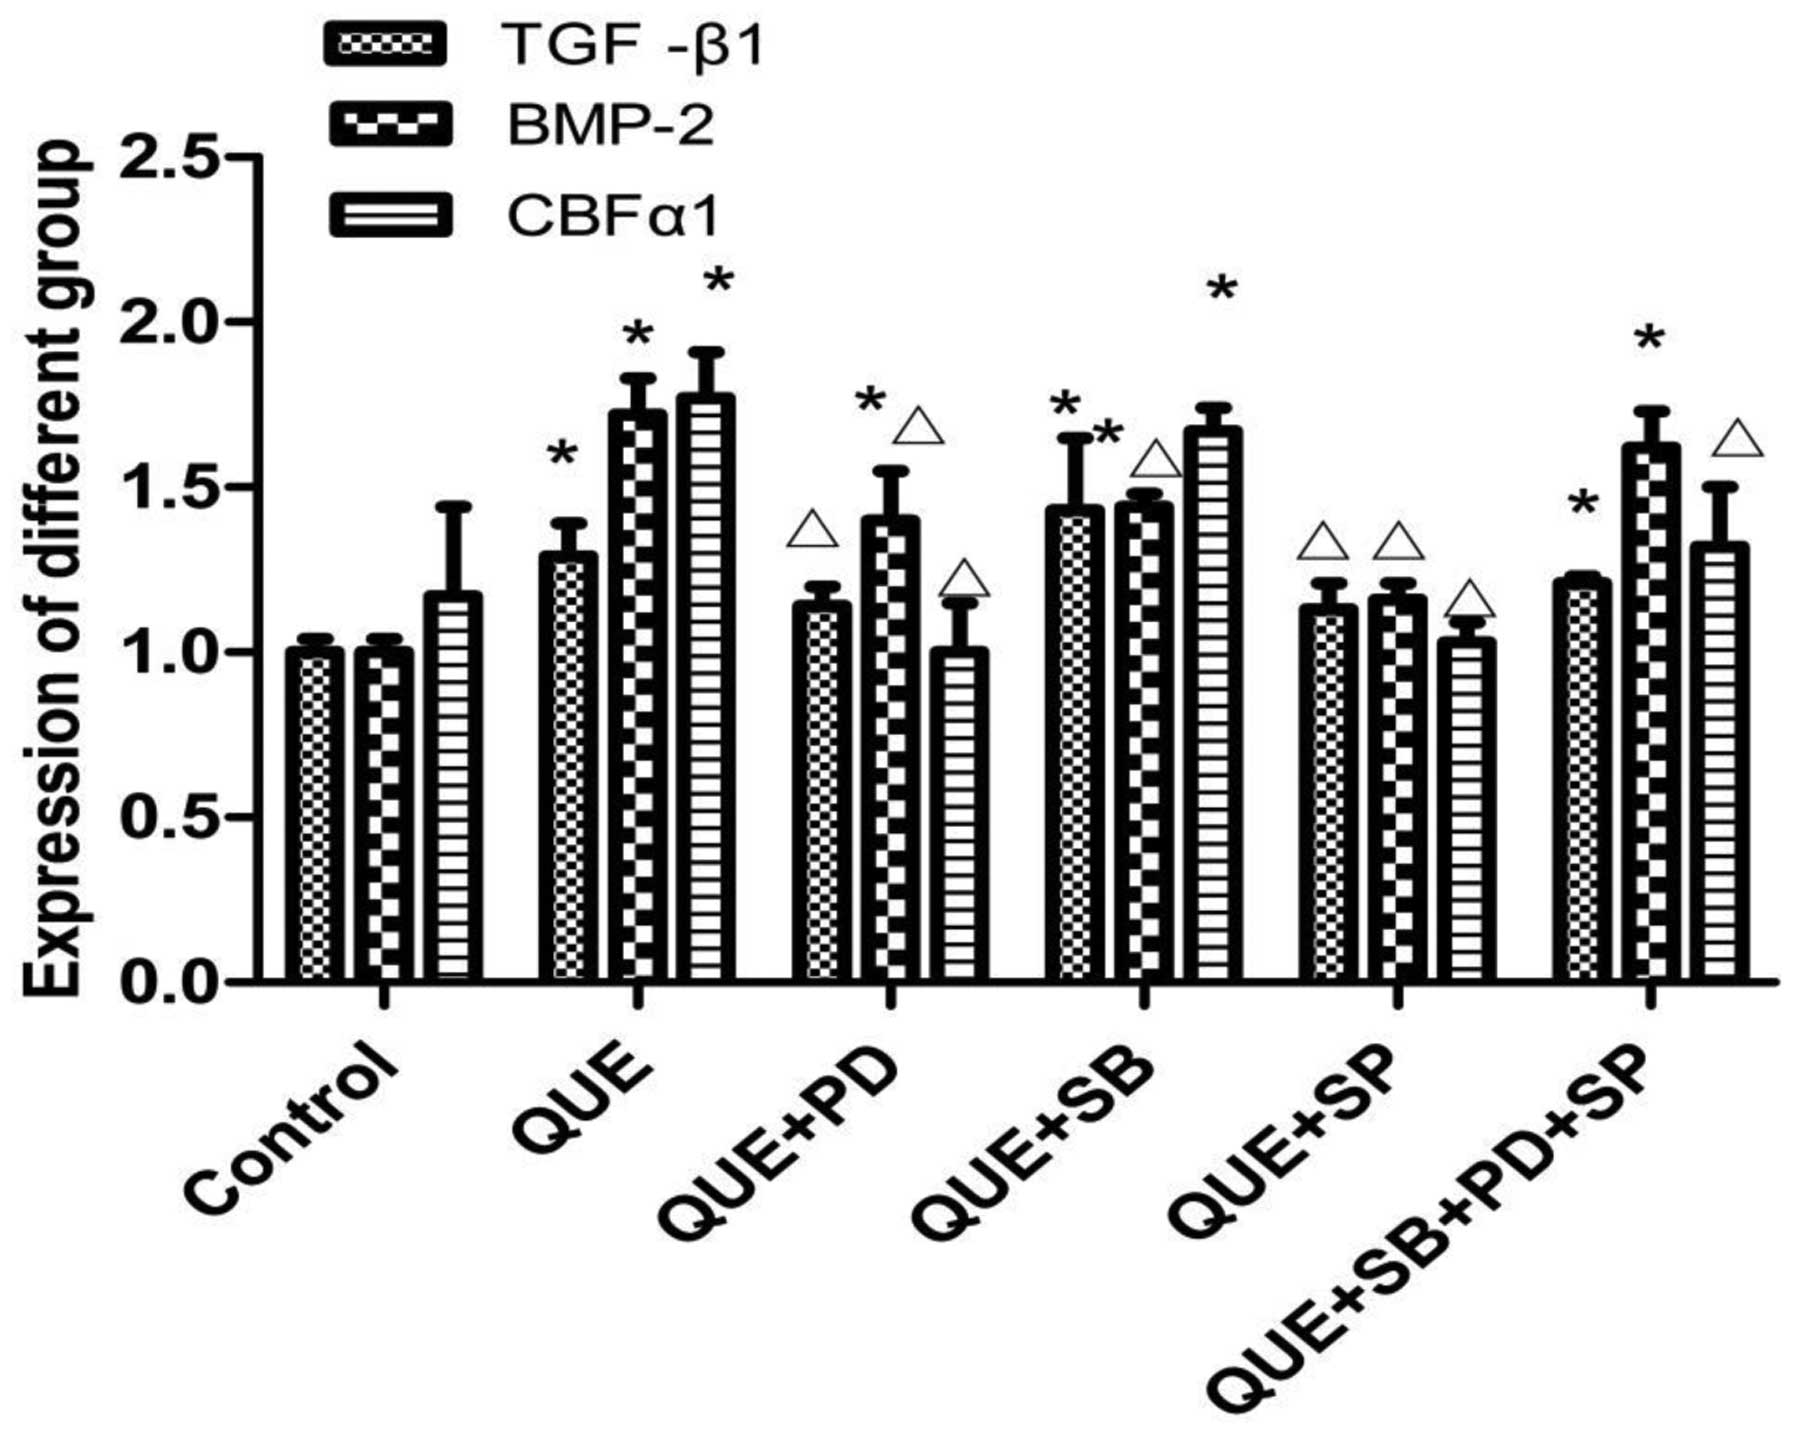 | Figure 5.mRNA expression levels of TGF-β1,
BMP-2 and CBFα1 in each group. Results are expressed as the mean ±
standard deviation (n=3). *P<0.05, vs. control group;
∆P<0.05, vs. QUE group. QUE, quercetin; TGF,
transforming growth factor; BMP, bone morphogenetic protein; CBF,
core binding factor; PD, PD98059; SB, SB203580; SP, SP600125. |
Discussion
Reduced proliferation and osteogenesis of MSCs, and
the increased adipogenesis of MSCs, are known to serve important
roles in the pathogenesis of osteoporosis (12). In the present study, MSCs were shown
to differentiate into OBs and adipocytes in osteogenic and
adipogenic induction medium, respectively. In addition,
third-generation cells expressed the mesenchymal surface marker,
CD29, whereas the cells seldom expressed the hematopoietic markers,
CD34 and CD45. These results indicated that the cells extracted
were MSCs. The osteogenesis of MSCs is affected by several factors,
including hormones and cytokines, and the process is regulated by a
number of signaling pathways. The MAPK signaling pathway is known
to be closely associated with the osteogenesis of MSCs (13,14).
The MAPK signaling pathway is one of the most
important signal transduction systems in vivo. Subgroups of
the MAPK signaling pathway primarily include ERK1/2, JNK, p38 MAPK
and ERK5, which are involved in the regulation of cell growth,
proliferation, differentiation, survival and apoptosis, in response
to a variety of extracellular stimuli (15,16). The
ERK1/2, JNK and p38 MAPK signaling pathways have been previously
reported to be essential for the osteoblastic differentiation of
MSCs (17–19).
MSCs express a variety of bone marker proteins in
different stages of their osteogenic differentiation. In the early
stage, the expression of ALP and COL I is predominant, followed by
the expression of matrix proteins. Thereafter, BGP is expressed and
the extracellular matrix is calcified. The cooperation of the
matrix proteins ensures the maturation of the extracellular matrix
and initiates OB-forming bone tissues (17). A variety of growth factors are
involved in the process of maturation and bone mineralization,
which are very important for proper bone remodeling and repair. Of
these, TGF-β is the most important. Members of the TGF-β family
include the various TGF-β isoforms, activins, BMPs and other
associated factors (18). In
general, TGF-β1 not only enhances preosteoblast proliferation and
extracellular matrix synthesis, but also counters the effect of
BMP-2 on OB differentiation (19).
Furthermore, TGF-β1 and BMP-2 promote the osteoblastic and
chondrogenic differentiation of MSCs and induce ectopic bone
formation. In addition, TGF-β1 has been reported to induce the
expression of specific genes, such as BGP, COL I and ALP (20). Therefore, TGF-β1 and BMP-2 play
important roles in the osteoblastic differentiation of MSCs
(21,22). CBFα1, an important signaling molecule
in the process of bone formation (23), is a specific transcription factor
belonging to the runt-domain gene family (24). The molecule is essential for the
maturation of OBs and the osteogenesis of MSCs. In addition, CBFα1
participates in the regulation of genes and matrix gene expression
in OBs. The major regulatory genes involved in the development of
bone formation include ALP, COL I and BGP (25). Therefore, the present study
investigated the protein expression levels of ALP, COL I and BGP to
analyze osteoblastic differentiation, and the mRNA expression
levels of TGF-β1, BMP-2 and CBFα1 to investigate the mechanism
underlying the effect of quercetin on the proliferation and
differentiation of MSCs.
In the present study, the results demonstrated that
the activity of ALP and the protein levels of BGP and the
structural protein, COL I, were significantly increased by
quercetin. The optimal concentration of quercetin for promoting the
osteogenic differentiation of rat MSCs was determined to be 10
µmol/l. Quercetin was also demonstrated to stimulate the p38 MAPK,
ERK1/2 and JNK signaling pathways. Conversely, the expression
levels of ALP, COL I and BGP were reduced following inhibition of
the JNK, ERK1/2 or all three signaling pathways. However, when an
inhibitor of the p38 MAPK signaling pathway was introduced, the
expression levels of ALP and BGP decreased, while the expression of
COL I was not affected. Therefore, quercetin promotes the
expression of ALP, COL I and BGP, and the ERK1/2, p38 MAPK and JNK
signaling pathways are essential for the quercetin-induced
osteoblastic differentiation of MSCs.
In the present study, quercetin was shown to promote
the expression of TGF-β1, BMP-2 and CBFα1. The expression of BMP-2
was reduced when the p38 MAPK signaling pathway was inhibited,
whereas there was no statistically significant difference in the
expression of TGF-β1 or CBFα1. These results demonstrate that p38
MAPK regulates the expression of BMP-2; however, this signaling
pathway has no significant effect on the expression of TGF-β1 or
CBFα1. Thus, quercetin stimulates the osteogenic differentiation of
MSCs, which is mediated by the activation of the p38 MAPK signaling
pathway. The mRNA expression levels of TGF-β1, BMP-2 and CBFα1 were
reduced following the addition of an inhibitor of the JNK or ERK1/2
signaling pathway. However, when inhibitors of the JNK, ERK1/2 and
p38 MAPK signaling pathways were introduced, the expression of
CBFα1 decreased, while the expression levels of TGF-β1 and BMP-2
were unaffected. Therefore, quercetin increases the expression of
TGF-β1, BMP-2 and CBFα1, and subsequently promotes osteoblastic
differentiation, which is primarily mediated by the ERK1/2 and JNK
signaling pathways.
In conclusion, the ability of quercetin to induce
the osteogenic differentiation of MSCs can be weakened by blocking
the p38 MAPK, ERK1/2 or JNK signaling pathway. Therefore, the
ERK1/2 and JNK signaling pathways may play leading roles in the
regulation of quercetin-induced osteogenic differentiation of rat
MSCs.
Acknowledgements
This study was supported by grants from the National
Natural Science Foundation of China (nos. 81173619 and 81473509),
the Cultivation and Innovation Fund for Scientific Research of
Jinan University Youth Fund Project (no. 21612341), Guangdong
Provincial Natural Science Foundation (no. S2012040007531) and the
Fundamental Research Funds for the Central Universities (no.
21614309).
References
|
1
|
Hadjidakis DJ and Androulakis II: Bone
remodeling. Ann NY Acad Sci. 1092:385–396. 2006. View Article : Google Scholar : PubMed/NCBI
|
|
2
|
Fu L, Tang T, Miao Y, Zhang S, Qu Z and
Dai K: Stimulation of osteogenic differentiation and inhibition of
adipogenic differentiation in bone marrow stromal cells by
alendronate via ERK and JNK activation. Bone. 43:40–47. 2008.
View Article : Google Scholar : PubMed/NCBI
|
|
3
|
Luo Y, Liu Y and Zhang KQ: The effect of
MAPK signal pathway in the process of osteogenic differentiation in
mesenchymal stem cells. Jilin Yi Xue. 29:443–445. 2008.[(In
Chinese)].
|
|
4
|
Wang Y, Li J, Wang Y, Lei L, Jiang C, An
S, Zhan Y, Cheng Q, Zhao Z, Wang J and Jiang L: Effects of hypoxia
on osteogenic differentiation of rat bone marrow mesenchymal stem
cells. Mol Cell Biochem. 362:25–33. 2012. View Article : Google Scholar : PubMed/NCBI
|
|
5
|
Jung CH, Cho I, Ahn J, Jeon TI and Ha TY:
Quercetin reduces high-fat diet-induced fat accumulation in the
liver by regulating lipid metabolism genes. Phytother Res.
27:139–143. 2013. View
Article : Google Scholar : PubMed/NCBI
|
|
6
|
Zhang H, Zhang M, Yu L, Zhao Y, He N and
Yang X: Antitumor activities of quercetin and
quercetin-5′,8-disulfonate in human colon and breast cancer cell
lines. Food Chem Toxicol. 50:1589–1599. 2012. View Article : Google Scholar : PubMed/NCBI
|
|
7
|
Wong MY and Chiu GN: Liposome formulation
of co-encapsulated vincristine and quercetin enhanced antitumor
activity in a trastuzumab-insensitive breast tumor xenograft model.
Nanomedicine. 7:834–840. 2011. View Article : Google Scholar : PubMed/NCBI
|
|
8
|
Niklas J, Nonnenmacher Y, Rose T, Sandig V
and Heinzle E: Quercetin treatment changes fluxes in the primary
metabolism and increases culture longevity and recombinant
α1-antitrypsin production in human AGE1.HN cells. Appl Microbiol
Biotechnol. 94:57–67. 2012. View Article : Google Scholar : PubMed/NCBI
|
|
9
|
Liang W and Luo Z, Ge S, Li M, Du J, Yang
M, Yan M, Ye Z and Luo Z: Oral administration of quercetin inhibits
bone loss in rat model of diabetic osteopenia. Eur J Pharmacol.
670:317–324. 2011. View Article : Google Scholar : PubMed/NCBI
|
|
10
|
Yamaguchi M and Weitzmann MN: Quercetin, a
potent suppressor of NF-κB and Smad activation in osteoblasts. Int
J Mol Med. 28:521–525. 2011.PubMed/NCBI
|
|
11
|
Sharan K, Mishra JS, Swarnkar G, Siddiqui
JA, Khan K, Kumari R, Rawat P, Maurya R, Sanyal S and Chattopadhyay
N: A novel quercetin analogue from a medicinal plant promotes peak
bone mass achievement and bone healing after injury and exerts an
anabolic effect on osteoporotic bone: the role of aryl hydrocarbon
receptor as a mediator of osteogenic action. J Bone Miner Res.
26:2096–2111. 2011. View
Article : Google Scholar : PubMed/NCBI
|
|
12
|
Liang SZ, Wang GX, Fan LK, Wu GY, Jin Y
and Zhu GX: Proliferation and differentiation of bone marrow
mesenchymal stem cells in process of bone loss in ovariectomized
rats. Zhongguo Bing Li Sheng Li Za Zhi. 28:398–403. 2012.[(In
Chinese)].
|
|
13
|
Yamaguchi A, Komori T and Suda T:
Regulation of osteoblast differentiation mediated by bone
morphogenetic peoteins, hedgehogs, and Cbfa1. Endocr Rev.
21:393–411. 2000. View Article : Google Scholar : PubMed/NCBI
|
|
14
|
Palcy S and Goltzman D: Protein kinase
signalling pathways involved in the up- regulation of the rat α1(I)
collagen gene by transforming growth factor β1 and bone
morphogenetic protein 2 in osteoblastic cells. Biochem J.
343:21–27. 1999. View Article : Google Scholar : PubMed/NCBI
|
|
15
|
Park YJ, Lee JM, Shin SY and Kim YH:
Constitutively active Ras negatively regulates Erk MAP kinase
through induction of MAP kinase phosphatase 3 (MKP3) in NIH3T3
cells. BMB Rep. 47:685–690. 2014. View Article : Google Scholar : PubMed/NCBI
|
|
16
|
Sheng XY: Research progress of ERK5
signaling pathway in the MAPK family. Yi Xue Zongshu. 18:3145–3147.
2012.[(In Chinese)].
|
|
17
|
Zhou H, Yang X, Wang N, Zhang Y and Cai G:
Tigogenin inhibits adipocytic differentiation and induces
osteoblastic differentiation in mouse bone marrow stromal cells.
Mol Cell Endocrinol. 270:17–22. 2007. View Article : Google Scholar : PubMed/NCBI
|
|
18
|
Canalis E: Osteogenic growth factorsPrimer
on the Metabolic Bone Diseases and Disorders of Mineral Metabolism.
Favus MJ: 5th. American Society for Bone and Mineral Research;
Washington DC: pp. 28–31. 2003
|
|
19
|
Tian H, Bi X, Li CS, Zhao KW, Brochmann
EJ, Montgomery SR, Aghdasi B, Chen D, Daubs MD, Wang JC and Murray
SS: Secreted phosphoprotein 24 kD (Spp24) and Spp14 affect TGF-β
induced bone formation differently. PLoS One. 8:e726452013.
View Article : Google Scholar : PubMed/NCBI
|
|
20
|
Palcy S, Bolivar I and Goltzman D: Role of
activator protein 1 transcriptional activity in the regulation of
gene expression by transforming growth factor beta1 and bone
morphogenetic protein 2 in ROS 17/2.8 osteoblast-like cells. J Bone
Miner Res. 15:2352–2361. 2000. View Article : Google Scholar : PubMed/NCBI
|
|
21
|
Guicheux J, Lemonnier J, Ghayor C, Suzuki
A, Palmer G and Caverzasio J: Activation of p38 mitogen-activated
protein kinase and c-Jun-NH2-terminal kinase by BMP-2 and their
implication in the stimulation of osteoblastic cell
differentiation. J Bone Miner Res. 18:2060–2068. 2003. View Article : Google Scholar : PubMed/NCBI
|
|
22
|
Lee J, Roh KB, Kim SC, Lee J and Park D:
Soy peptide-induced stem cell proliferation: involvement of ERK and
TGF-β1. J Nutr Biochem. 23:1341–1351. 2012. View Article : Google Scholar : PubMed/NCBI
|
|
23
|
Peng S, Zhou G, Luk KD, Cheung KM, Li Z,
Lam WM, Zhou Z and Lu WW: Strontium promotes osteogenic
differentiation of mesenchymal stem cells through the Ras/MAPK
signaling pathway. Cell Physiol Biochem. 23:165–174. 2009.
View Article : Google Scholar : PubMed/NCBI
|
|
24
|
Takeda S, Bonnamy JP, Owen MJ, Ducy P and
Karsenty G: Continuous expression of Cbfa1 in nonhypertrophic
chondrocytes uncovers its ability to induce hypertrophic
chondrocyte differentiation and partially rescues Cbfa1-deficient
mice. Genes Dev. 15:467–481. 2001. View Article : Google Scholar : PubMed/NCBI
|
|
25
|
Wang XY, Wang YH, Zhang DG, Li JJ, Cui L,
Shi B, Liu WG and Wang XZ: Study on the regulation of Cbfα1 to
definitive differentiation of bone marrow mesenchymal stem cells.
Zhongguo Linchuang Kangfu. 7:3164–3165. 2003.
|