Introduction
The trefoil (TFF) factor family comprises three
members, i.e., TFF1, TFF2 and TFF3. They are synthesized and
secreted by epithelial mucosa (1–3).
TFFs are involved in mechanisms of defense and repair by
interacting with mucins, cytoprotection, and anti-inflammatory
effect in the gastrointestinal tract by stimulating cell migration
and inhibiting apoptosis (4–11).
Their expression is rapidly and coordinately up-regulated in a wide
variety of mucosal injury (5) and
ulcerative conditions of the gastrointestinal tract including
Barrett's esophagus (12),
gastric and duodenal ulcers (13,14), pancreatic cancer (15,16) as well as in the small and large
intestine in Crohn's disease (17). This overexpression of TFFs
emphasizes that they are important peptides involved in the
maintenance of the gastrointestinal mucosa. TFF2 is found more
abundantly during repair in areas of proliferation, while
Tff2-deficient mice exhibit immune deficiency (18), increased acid secretion and
increased susceptibility to NSAID injury (5).
microRNAs are a family of small (17–24 nucleotides)
noncoding RNAs that are involved in post-transcriptional gene
regulation through binding to the 3′-untranslated region of their
target mRNAs (19). An important
feature of miRNA is to regulate multiple targets simultaneously
making miRNA a crucial regulator in many physiological conditions.
We recently showed that a group of deregulated miRNAs in
Tff3 knock-out mouse model might be involved in regulation
of an interesting metabolic pathway (20). To further investigate the role of
altered miRNA signature in the Tff2 knock-out (KO) mouse
model and the systemic effect of Tff2 deregulation, we
analyzed the expression of known mouse miRNAs (miRBase Version 14,
URL: http://www.mirbase.org/) using a whole
miRNome microarray analysis. We used blood cells as a starting
material because blood-derived miRNA profiling is a well
established system in human (21,22) as well as in mouse models due to
remarkable stability of these short nucleotides (20). We hypothesized that deregulated
miRNAs in Tff2-KO mice might be involved in important
biological pathways and since the epithelia of the digestive tract
also contribute to immunoresponse blood cells (among them T- and
B-cells) (23) will likely carry
such important molecular information. Despite latest progress in
whole miRNome microarray analysis in various systems, no previous
study related to the differential expression of miRNAs in
Tff2-KO mouse model, has been reported so far.
Materials and methods
Animals
Tff2 deficient mice (129/SV) were generated
previously (18) and as a control
wild-type (WT) (129/SV) mice were bought from Charles River. All
animals (n=6 for each genotype) were kept in a specific
pathogen-free facility of the University Clinic of Tuebingen in 12
h dark/light cycles and 22˚C. Food and water were accessible ad
libitum. All efforts were made to minimize the number of
animals used to avoid unnecessary suffering. Care and use of the
animals and the experimental protocol were reviewed and approved by
the regional board for scientific animal experiments in
Tuebingen.
miRNA extraction
Blood from Tff2-KO as well as WT mice was
collected in RNAprotect® Animal Blood Tubes (Qiagen
GmbH, Hilden). About 400–500 μl of peripheral blood were collected
from each animal. After centrifugation of the blood samples at
5,000 × g for 10 min at room temperature (RT), the supernatant was
discarded while the pellet was resuspended in 5 ml RNasefree water.
Following second centrifugation step at 5,000 × g for 10 min and
RT, isolation of total-RNA including miRNA was performed using the
miRNeasy kit (Qiagen GmbH). Therefore the blood cell pellet was
resuspended in 700 μl QIAzol lysis reagent and incubated for 5 min
at RT. A total of 140 μl chloroform was added, vortexed for 15 sec,
and incubated for 2–3 min at RT. All samples were centrifuged at
14,000 rpm and 4˚C for 15 min. The RNA in the upper, watery phase
was precipitated with 1.5 volume of 100% ethanol. Aliquots of 700
μl of this mixture were placed on a column and centrifuged at
13,000 rpm at RT for 15 sec. After the mixture had completely
passed the column, 700 μl of buffer RWT was added to each column,
and again centrifuged at 13,000 rpm at RT for 15 sec. Buffer RPE of
500 μl was added to the column and centrifuged at 13,000 rpm at RT
for 15 sec. After this step, further 500 μl of buffer RPE was added
to the column and centrifuged at 13,000 rpm at RT or 2 min. To dry
the column it was centrifuged at 13,000 rpm and RT for 1 min. The
RNA was eluted twice with 20 μl RNasefree water by centrifuging at
13,000 rpm at RT for 1 min. The eluted RNA was stored at −70˚C.
miRNA microarray screening
We analyzed all RNA samples using the Geniom
Realtime Analyzer (GRTA, Febit Biomed GmbH, Heidelberg, Germany)
and the Geniom Biochip miRNA Mus musculus. Each array
contains 7 replicates of 710 miRNAs and miRNA star sequences as
annotated in the Sanger miRBase version 14.0 (http://microrna.sanger.ac.uk/sequences/)
(24). After microarray
hybridization for 16 h at 42˚C sample labeling was carried out with
biotin using micro-fluidic-based enzymatic on-chip labeling of
miRNAs (MPEA) (25). Washing and
signal enhancement was processed automatically in the GRTA.
Expression data and bioinformatics
analyses
Geniom Wizard Software was used for microarray
evaluation. After that the median signal intensity was extracted
for each miRNA and each array from the raw data file such that for
each miRNA, seven intensity values have been calculated
corresponding to each replicate copy on the array. Next to the
background correction, the seven replicate intensity values of each
miRNA were summarized by their median value. Quantile normalization
was applied to normalize the data across different arrays (26), and all further analyses were
carried out using the normalized and background subtracted
intensity values. The microarray data were deposited in the
publically available database Gene Expression Omnibus
(GSE25815).
GeneTrail is a web-based application used for
statistical evaluation of high-throughput genomic or proteomic data
sets with respect to a reference set. GeneTrail's statistics module
includes a novel dynamic-programming algorithm that improves the
P-value computation of GSEA (Gene Set Enrichment Analysis) methods
considerably. GeneTrail supports many biological categories (KEGG,
TRANSPATH, TRANSFAC and GO) (27–29).
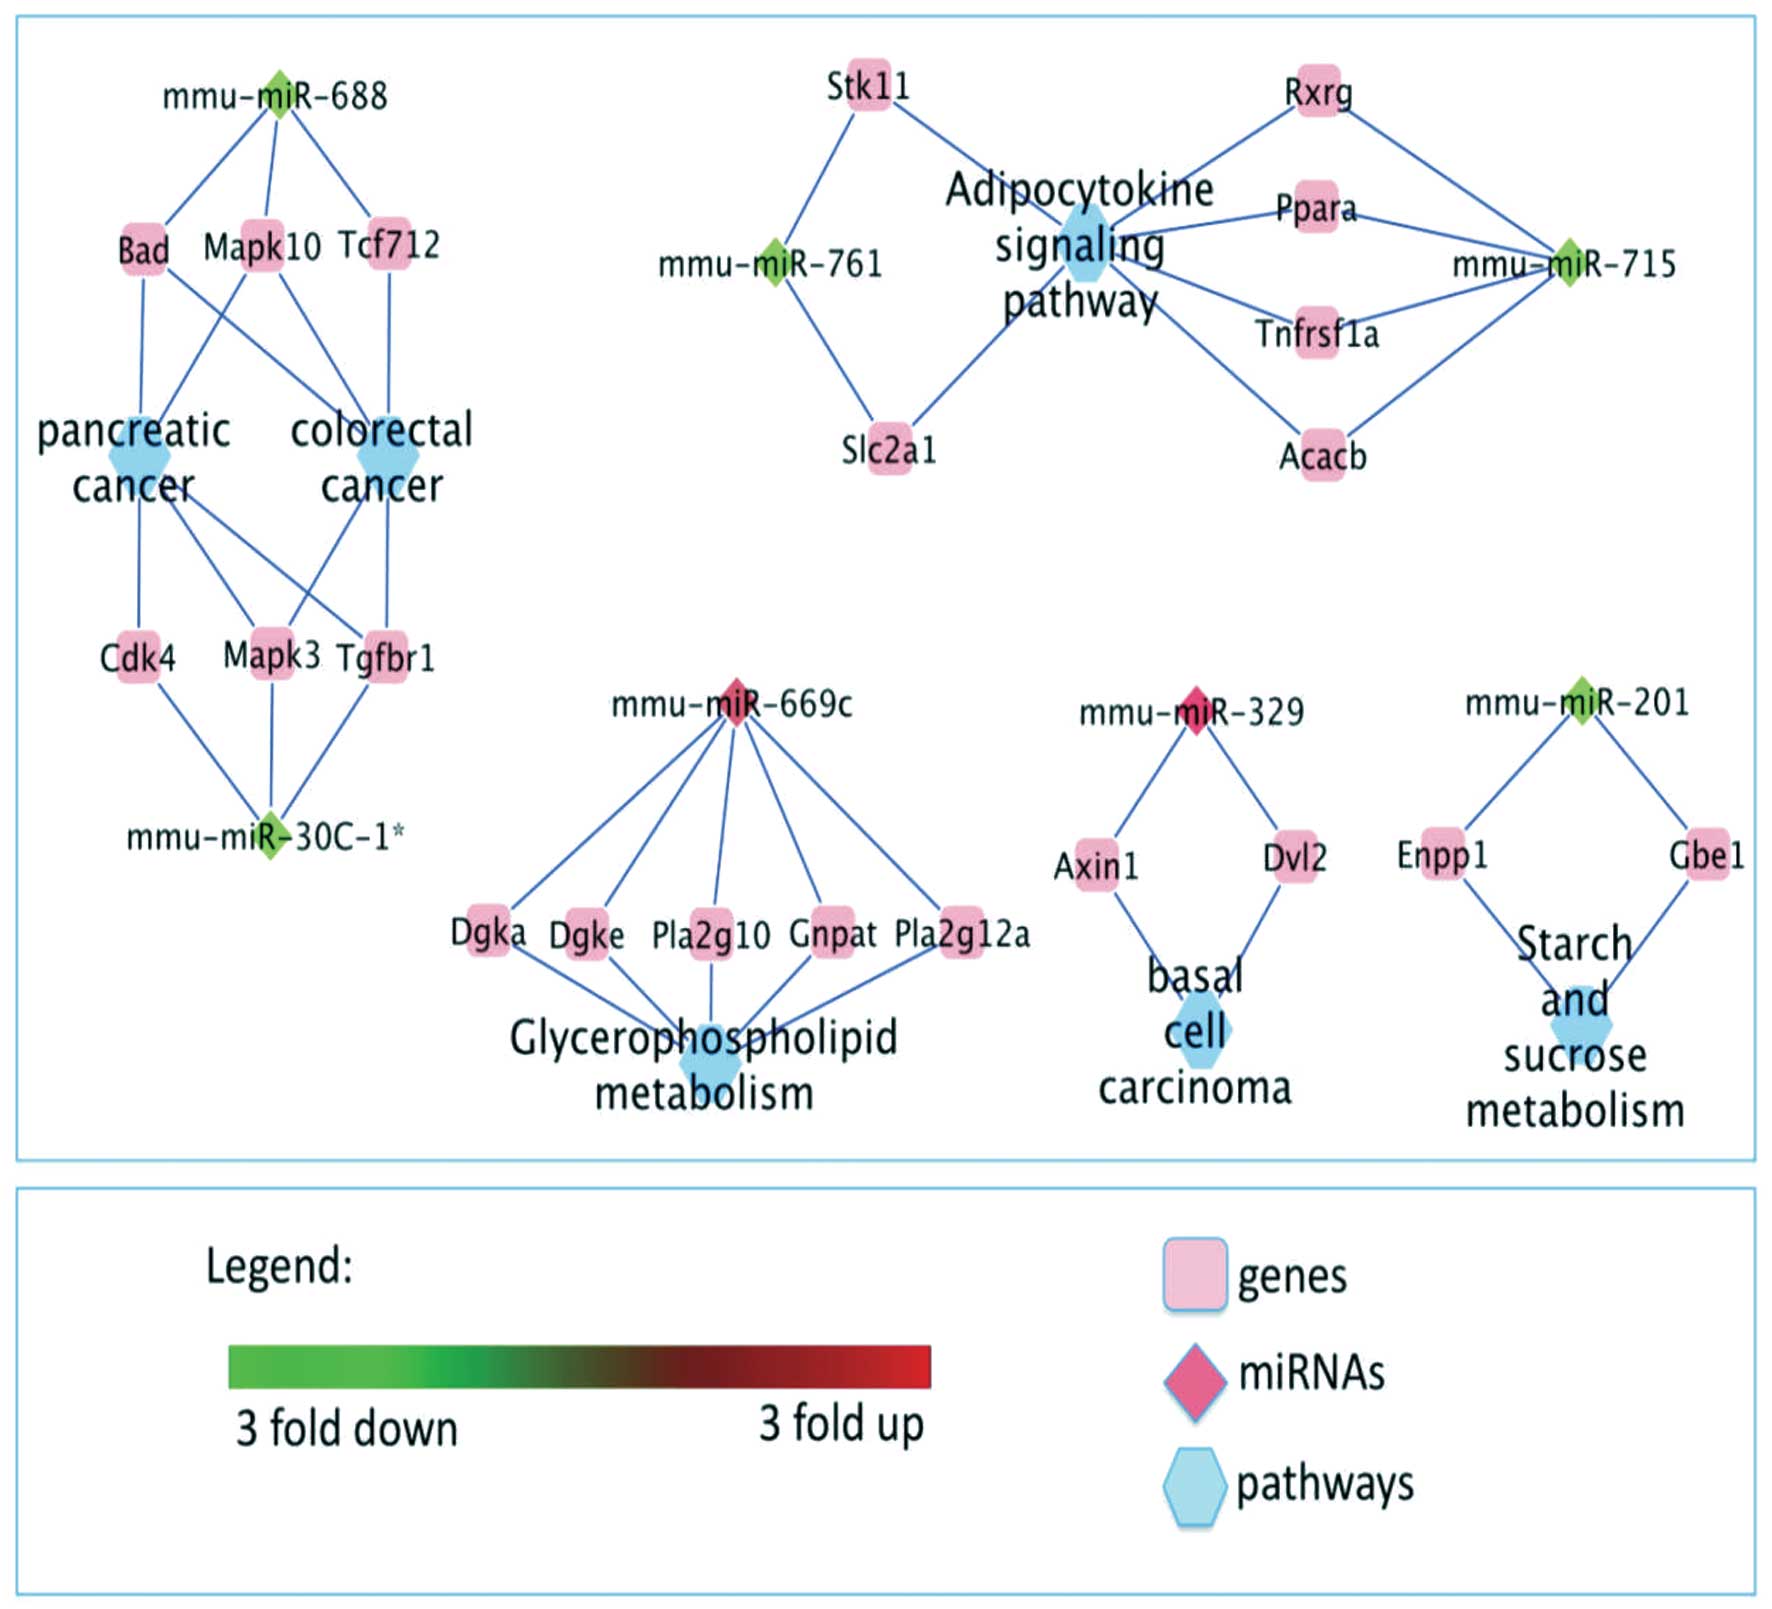
Cytoscape program (http://cytoscapeweb.cytoscape.org) was used to
visualize the correlations of graphically depicting the regulation
of the mRNA targets of the most interesting up-regulated
mmu-miR-669c, mmu-miR-329, and down-regulated mmu-miR-688,
mmu-miR-30c-1*, mmu-miR-201, mmu-miR-761, mmu-miR-715
microRNAs in Tff2-KO mice in a convenient way. Nodes
represent the pathways, genes and miRNAs while edges show the
respective connections (Fig.
3).
Quantitative real-time PCR
In order to validate microarray results of
deregulated miRNAs, we analyzed by qRT-PCR, the expression of some
mature miRNAs in total-RNA extracted from all Tff2-KO and WT
mice. RNA of 10 ng was converted into cDNA using miRNA RT specific
primers and TaqMan® microRNA Reverse Transcription kit
(Applied Biosystems). The qRT-PCR reactions were performed on
Applied Biosystems 7300 Real-Time PCR system using miRNA-specific
TaqMan® microRNA Assays (Applied Biosystems). The master
mix TaqMan® Universal PCR Master Mix, No
AmpErase® UNG (Applied Biosystems) was used for all
qRT-PCR reactions according to manufacturer's instructions. A cDNA
pool of 6 WT mice was used as a calibrator in the present study. As
an endogenous control RNA we used snoRNA202 (small nucleolar RNA,
Applied Biosystems), which is commonly used as a control RNA for
miRNA studies. miRNA fold changes between the groups were
calculated by the delta Ct method.
Results
Altered miRNA expression in Tff2
knock-out mice
Among the three mammalian Tffs, Tff2
deserves special attention because of its multiple roles in crucial
physiological processes. We aimed at determining whether
transcriptional profiles of miRNA are involved in regulating
Tff2 gene activity. Thus, genetically impaired Tff2
mice were compared with their WT counterparts by microarray
screening of miRNAs. In our Tff2-KO mouse model a total of
48 miRNAs were detected as differentially expressed. Among those 26
(54%) were down-regulated while 22 (46%) were up-regulated
(Table I).
 | Table ILogarithm of fold quotients, raw
t-test P-values and AUC value of each of all 48 significantly
deregulated miRNA tested in (n=6) animals of WT and KO group (7
replicates of each miRNA). |
Table I
Logarithm of fold quotients, raw
t-test P-values and AUC value of each of all 48 significantly
deregulated miRNA tested in (n=6) animals of WT and KO group (7
replicates of each miRNA).
| miRNA | Median
Tff2−/− | Median
Tff2+/+ | q-median | Log q-median | t-test rawp | AUC |
|---|
| mmu-miR-688 | 5.62 | 7.03 | 0.24 | −1.40 | 0.07 | 0.83 |
| mmu-miR-1895 | 10.80 | 12.12 | 0.26 | −1.32 | 0.02 | 0.88 |
| mmu-miR-590-5p | 5.78 | 6.93 | 0.31 | −1.15 | 0.01 | 0.91 |
|
mmu-miR-488* | 4.78 | 5.87 | 0.33 | −1.09 | 0.01 | 0.94 |
|
mmu-miR-883a-5p | 6.04 | 7.06 | 0.35 | −1.02 | 0.00 | 0.91 |
|
mmu-miR-712* | 7.53 | 8.53 | 0.36 | −1.00 | 0.00 | 0.97 |
| mmu-miR-715 | 8.47 | 9.47 | 0.36 | −0.99 | 0.00 | 0.91 |
| mmu-miR-1954 | 6.96 | 7.93 | 0.37 | −0.97 | 0.00 | 1 |
| mmu-miR-1907 | 7.05 | 8.01 | 0.38 | −0.96 | 0.02 | 0.94 |
| mmu-miR-490 | 5.403 | 6.34 | 0.39 | −0.93 | 0.03 | 0.91 |
| mmu-miR-1946b | 7.45 | 8.38 | 0.39 | −0.92 | 0.00 | 0.91 |
| mmu-miR-1899 | 5.69 | 6.61 | 0.39 | −0.92 | 0.00 | 1 |
| mmu-miR-337-5p | 5.95 | 6.87 | 0.39 | −0.92 | 0.02 | 0.86 |
| mmu-miR-761 | 7.45 | 8.36 | 0.40 | −0.90 | 0.00 | 0.94 |
| mmu-miR-201 | 6.00 | 6.84 | 0.43 | −0.84 | 0.01 | 1 |
| mmu-miR-669j | 7.55 | 8.36 | 0.44 | −0.80 | 0.02 | 0.94 |
|
mmu-miR-30c-1* | 5.16 | 5.96 | 0.44 | −0.80 | 0.01 | 0.94 |
| mmu-miR-1906 | 8.19 | 8.99 | 0.44 | −0.79 | 0.03 | 0.86 |
| mmu-miR-33 | 5.45 | 6.21 | 0.46 | −0.76 | 0.04 | 0.86 |
|
mmu-miR-297b-3p | 5.93 | 6.67 | 0.47 | −0.74 | 0.03 | 0.91 |
| mmu-miR-689 | 7.07 | 7.82 | 0.47 | −0.47 | 0.06 | 0.83 |
| mmu-miR-719 | 7.05 | 7.78 | 0.48 | −0.73 | 0.02 | 0.97 |
| mmu-miR-200a | 6.07 | 6.79 | 0.48 | −0.72 | 0.00 | 0.94 |
| mmu-miR-298 | 6.13 | 6.85 | 0.48 | −0.71 | 0.11 | 0.86 |
| mmu-miR-879 | 6.00 | 6.71 | 0.49 | −0.70 | 0.10 | 0.83 |
| mmu-miR-1928 | 5.95 | 6.65 | 0.49 | −0.69 | 0.07 | 0.83 |
| mmu-miR-207 | 5.54 | 4.84 | 2.01 | 0.70 | 0.24 | 0.22 |
| mmu-miR-1-2-as | 4.56 | 3.84 | 2.04 | 0.71 | 0.08 | 0.19 |
|
mmu-miR-1982* | 6.15 | 5.42 | 2.07 | 0.72 | 0.03 | 0.11 |
| mmu-miR-744 | 11.58 | 10.84 | 2.08 | 0.73 | 0.01 | 0.05 |
|
mmu-miR-1839-5p | 7.21 | 6.45 | 2.14 | 0.76 | 0.03 | 0.13 |
| mmu-miR-194 | 11.81 | 11.01 | 2.23 | 0.80 | 0.15 | 0.16 |
| mmu-miR-20b | 10.20 | 9.39 | 2.24 | 0.80 | 0.08 | 0.19 |
|
mmu-miR-465b-5p | 5.69 | 4.86 | 2.28 | 0.82 | 0.12 | 0.16 |
| mmu-miR-151-5p | 10.69 | 9.84 | 2.34 | 0.85 | 0.02 | 0.11 |
| mmu-miR-1892 | 7.93 | 7.07 | 2.36 | 0.86 | 0.03 | 0.13 |
| mmu-miR-185 | 11.68 | 10.81 | 2.38 | 0.86 | 0.06 | 0.13 |
|
mmu-miR-674* | 8.85 | 7.97 | 2.43 | 0.88 | 0.00 | 0.02 |
| mmu-miR-142-3p | 5.17 | 4.25 | 2.50 | 0.91 | 0.00 | 0.02 |
|
mmu-miR-1894-3p | 8.31 | 7.39 | 2.52 | 0.92 | 0.04 | 0.19 |
| mmu-miR-669c | 9.22 | 8.29 | 2.53 | 0.92 | 0.02 | 0.05 |
| mmu-miR-99b | 8.56 | 7.63 | 2.53 | 0.93 | 0.02 | 0.08 |
|
mmu-miR-7a* | 9.01 | 8.07 | 2.57 | 0.94 | 0.03 | 0.13 |
| mmu-let-7g | 9.40 | 8.41 | 2.69 | 0.99 | 0.15 | 0.22 |
| mmu-miR-329 | 6.58 | 5.48 | 3.00 | 1.09 | 0.09 | 0.16 |
| mmu-mmu-let-7e | 7.97 | 6.82 | 3.16 | 1.15 | 0.12 | 0.19 |
| mmu-miR-195 | 11.55 | 10.39 | 3.21 | 1.16 | 0.00 | 0.05 |
|
mmu-miR-125a-5p | 8.97 | 7.72 | 3.50 | 1.25 | 0.00 | 0.08 |
To confirm that the expression of deregulated miRNAs
occurred uniformly in all studied animal samples we additionally
computed the receiver-operator characteristics curves (ROC) for
each of the miRNAs together with the area under the
receiver-operator characteristics curve (AUC). ROC shows the
sensitivity as function of one minus the specificity. AUC values
can range from 0 to 1. An AUC of 0.5 for a miRNA means that the
distribution of intensity values generated by RNA from blood of
Tff2-KO and WT mice cannot be distinguished. The more the
AUC differs from 0.5 approaching the values of 0 or 1 the better
the miRNA is suited to differentiate between KO and WT. The most
extreme values of the AUC are 0 and 1 and correspond to a perfect
separation. Out of the 48 significantly deregulated miRNAs, 26
miRNAs had an AUC value above 0.5 (higher median expression in WT
than in KO mice) and 22 miRNAs had an AUC value <0.5 (lower
median expression in WT than in KO mice).
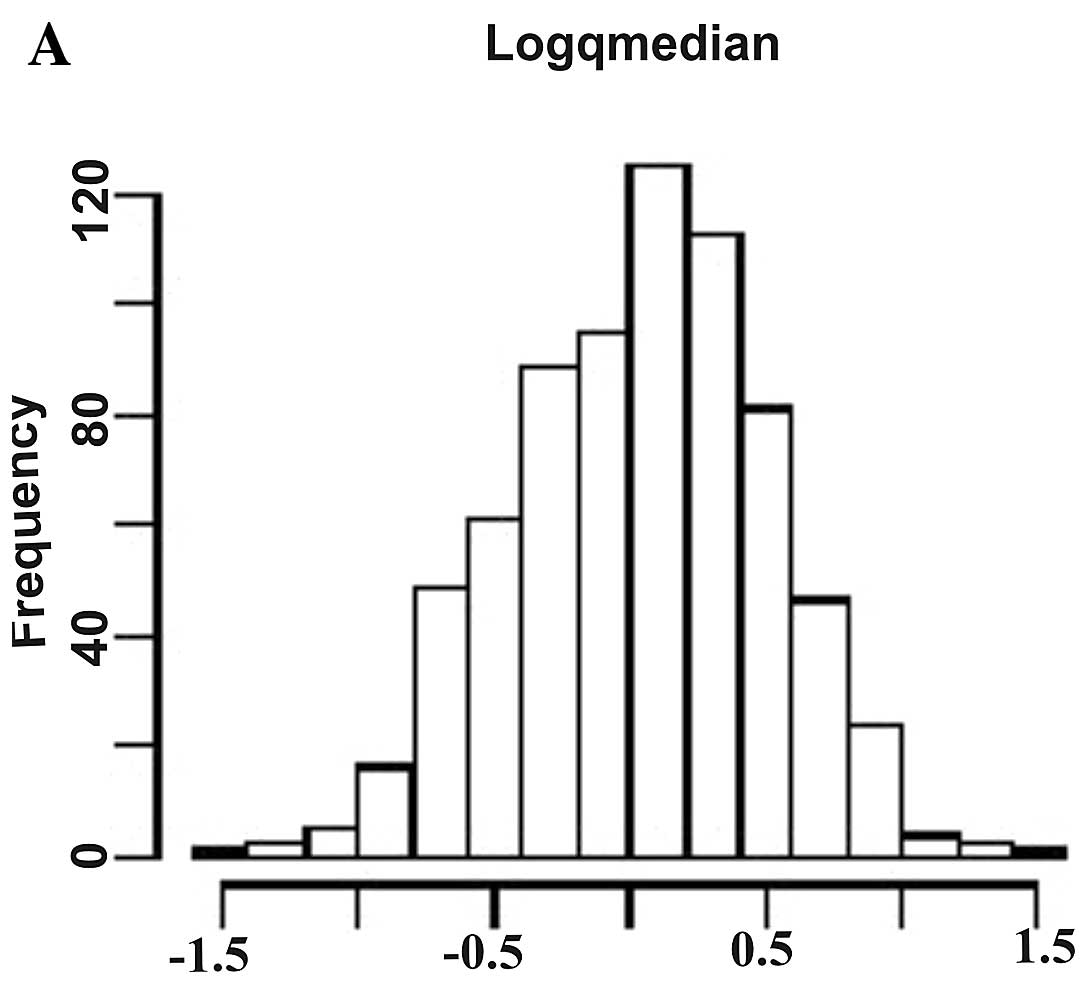
The histogram plots in Fig. 1 show the distribution of logarithm
of fold changes (Fig. 1A), AUC
values (Fig. 1B), and raw t-test
P-values (Fig. 1C) demonstrating
a significant differential expression of the deregulated
miRNAs.
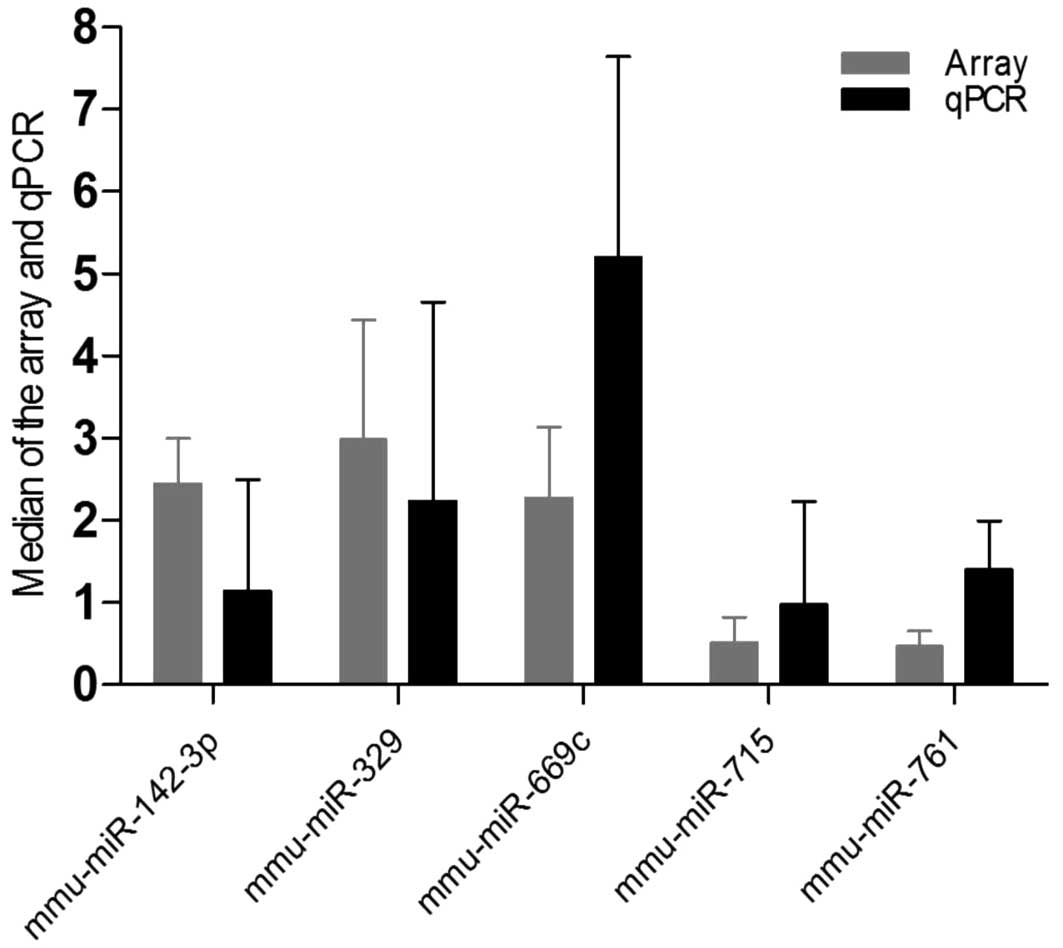
Validation of miRNA expression profile by
quantitative PCR
Our microarray screen identified 48 differentially
expressed miRNAs in Tff2-KO vs. WT mice. To validate these
data we analyzed the expression of two down- and three up-regulated
miRNAs as a model representation of the whole set (Table I) by qRT-PCR in all Tff2-KO
and WT samples (Fig. 2). The
qRT-PCR results and the array data displayed comparable values thus
supporting the original observation.
In silico analysis of miRNA and their
putative target pathways
The above mentioned results prompted us to test
whether the collection of deregulated miRNAs is connected to any
pathological conditions. We applied a bioinformatic resource for
miRNAs target genes to identify possible mRNA interaction networks
that are responsible for various cellular processes. This approach
using GeneTrail (see Materials and methods for details) provides
useful information on the function of microRNA in physiological and
pathological conditions.
We focused our analysis on KEGG (Kyoto Encyclopedia
of Genes and Genomes) pathways. We compared the set of the noted
up- and down-regulated miRNAs between Tff2-KO compared to WT
mice to the set of all mouse genes using GeneTrail's standard
parameters for the prediction of signaling pathways possibly
regulated by these miRNAs. We identified interesting statistically
significant signaling pathways (Table II) regulated by selected
deregulated miRNAs (Fig. 3).
Briefly, we found that mmu-miR-688 and mmu-miR-30c-1*
targeting Tcf712 and Cdk4 are involved in colorectal
and pancreatic cancer, respectively, while the same miRNAs
targeting Bad, Mapk10, Mapk3 and Tgfbr1 are involved
both in pancreatic as well as colorectal cancer. Similarly,
mmu-miR-329 (targeting Axin1 and Dvl2) is
participating in basal cell carcinoma. Further miRNAs with
differential expression pattern are connected with energy
metabolism. Here, mmu-miR-669c, targeting Dgka Dgke Pla2g10,
Gnpat and pla2g12a, is involved in glycerophospholid and
mmu-miR-201 (targeting Enpp1 and Gbe1) is involved in
starch and sucrose metabolism. Additionally, both mmu-miR-761 and
mmu-miR-715 (targeting Stk11, Slc2a1 and Rxrg,
Ppara, Tnfrsf1a and Acacb) are involved in adipocytokine
signaling pathway.
| Table IIThe 7 deregulated miRNAs with
statistically significant (P<0.05) target genes and their
pathways. The listed miRNAs target genes of a particular pathway
(multiplicity), the gene names are shown on the right. |
Table II
The 7 deregulated miRNAs with
statistically significant (P<0.05) target genes and their
pathways. The listed miRNAs target genes of a particular pathway
(multiplicity), the gene names are shown on the right.
| miRNAs | Subcategory
name | P-value | Observed number of
genes | GeneIDs of test set
in subcategory |
|---|
| mmu-miR-688 | Colorectal
cancer | 0.016 | 3 | Bad, Mapk10,
Tcf712 |
| Pancreatic
cancer | 0.047 | 2 | Bad, Mapk10 |
|
mmu-miR-30c-1* | Colorectal
cancer | 0.042 | 2 | Tgfbr1, Mapk3 |
| Pancreatic
cancer | 0.012 | 3 | Tgfbr1, Mapk3,
Cdk4 |
| mmu-miR-329 | Basal cell
carcinoma | 0.024 | 2 | Axin1, Dvl2 |
| mmu-miR-669c | Glycerophospholipid
metabolism | 0.016 | 5 | Dgka, Dgke,
Pla2g10, Gnpat, Pla2g12a |
| mmu-miR-201 | Starch and sucrose
metabolism | 0.020 | 2 | Enpp1, Gbe1 |
| mmu-miR-715 | Adipocytokine
signaling pathway | 0.011 | 4 | Acacb, Ppara, Rxrg,
Tnfrsf1a |
| mmu-miR-761 | Adipocytokine
signaling pathway | 0.028 | 2 | Slc2a1, Stk11 |
Discussion
The three trefoil factor peptides (TFF1-3) are
involved in maintenance of epithelial function, thus not
surprisingly, in mouse models carrying genetic deletions for
Tff1, Tff2 or Tff3 the animals developed
various kinds of gastrointestinal impairment (5,30,31). Previously, tumor specific
expression patterns of all trefoil peptides were observed in human
patients and the TFFs were noted to be over-expressed in
inflammatory and ulcerative lesions (3). By in situ hybridization Tff
transcription was demonstrated in damaged areas of the digestive
tract in rodents. Studies of experimental ulcers in rat stomach
(32) disclosed that rat
Tff2 is expressed immediately after injury (0.5–2 h),
Tff3 after 48 h and the growth factors EGF and TGF-α even
later, stressing the association of TFFs with the start of the
restitution and repair processes. This observation also implies a
set program of differential Tff gene activation. While all Tff
genes are localized tightly to each other, all three display
individual promoters with specific transcriptional signals allowing
such differential regulation (33,34). Moreover, search for quantitative
trait loci in mouse models indicated a trefoil peptide contribution
to diabesity (35) or to
macronutrient (carbohydrate/fat) intake (36). The latter study demonstrated a
10-fold up-regulation of Tff3 in congenic B6.CAST17 mice
independent of high-fat vs. high carbohydrate diet. Our recent
study demonstrated that genetic impairment of Tff3 has an
influence on the expression pattern of regulatory miRNAs, several
of them targeting genes in caloric metabolism. Again, not
surprisingly, Tff3−/− mice show slower build-up
of body mass than their WT counterparts (20). Our preliminary data also connect
genetic Tff2 inactivation with impaired fat metabolism.
Moreover, a link of Tff's to the immune system through nutritional
pathways and enteric microflora was published (37) and in weaning piglets a probiotic
trial indicated an increased Tff2 and Tff3 expression
(38). In the porcine digestive
tract, various segments (from duodenum to distal colon) were
reported to express varying patterns of miRNAs pointing to the
regulatory impact of these small nucleic acids on specific cellular
signaling pathways (39).
These data prompted us to search modified patterns
of miRNA expression levels and their target genes in
Tff2−/− mice. Using miRNA microarrays and
cellular fractions from whole blood (20) 22 of miRNAs were found to be
up-regulated and 26 to be down-regulated thus exceeding the number
of 21 deregulated miRNAs in the Tff3−/− model. A
screen using a bioinformatics tool (GeneTrail) to link
Tff2−/− specific miRNAs with their target genes
disclosed 7 highly significant regulatory miRNAs (P<0.047)
connected with either neoplastic development or carbohydrate
metabolism. In the former, colorectal, pancreatic and basal cell
cancer are prominent, the latter is represented by sugar and starch
metabolism and an adipocytokine pathway. It has been demonstrated
in completely independent experiments that mmu-miR-715 as well as
mmu-miR30C-1* are involved in specific cellular pathways
essentially confirming our observation (40,41). These important regulators display
the effect of multiplicity, i.e., one miRNA molecule is targeting
different genes that can be functional in one common pathway or
even involved in different functional networks. Out of those 7
significant miRNAs only miR-715 has its coding sequence localized
in the vicinity of the Tff gene cluster (mouse chromosome
17). It is linked to the adipocytokine pathway by targeting one TNF
family member. In 2010, Panguluri et al (40) demonstrated TNF-like weak inducer
of apoptosis (TWEAK) to be a member of the TNF superfamily and by
in vitro, in vivo and in silico experiments
TWEAK to up-regulate miR-715 about 20-fold which in turn is
involved in regulating distinct cellular responses. Since TNFα has
been implicated as a link between obesity and insulin resistance
this circular loop [(TWEAK)-(miR-715)-(TNFrsf1a)] provides some
experimental evidence for this particular miRNA's connection with
caloric pathway. Even here the position does not constitute a close
neighborhood: the distance is about 8.5 Mb. However, no present
model requires genetic vicinity for functional coordination and in
the Tff3−/− situation the coding sequences of
regulatory miRNAs also show no particularly close special
linkage.
To substantiate whether the selected miRNAs of our
model are in fact deregulated by Tff2 impairment and share
these common target genes for the neoplastic and dietary pathways
noted in our study, additional experiments are planned. At first,
specific miRNA action in cellular models will be monitored and
expression pattern of the target genes will be analyzed by qRT-PCR.
Finally, adequate transgenic mice will be put to use. These future
experiments should further contribute to our understanding of the
variable functional aspects of the trefoil peptide family.
Our proof-of-concept study shows that small
non-coding RNA molecules (miRNAs) may play an important role in the
regulatory processes of the trefoil peptide family. Despite recent
progress in miRNome microarray profiling, no previous study has
been conducted so far related to the differential expression of
miRNAs in the Tff2-KO mouse model.
Acknowledgements
This project was supported by a governmental
fellowship (Higher Education Commission of Pakistan) (A.A.S.), by a
FNP Humboldt Honorary Fellowship (N.B.), by the Hedwig-Stalter
foundation (P.L.), and HOMFOR 2010 (P.L. and E.M.). A.K. and A.W.
are employees of febit biomed GmbH, Heidelberg, Germany.
References
|
1
|
W HoffmannW JaglaA WiedeMolecular medicine
of TFF-peptides: from gut to brainHistol
Histopathol16319334200111193208
|
|
2
|
J MadsenO NielsenI TornoeL ThimU
HolmskovTissue localization of human trefoil factors 1, 2, and 3J
Histochem Cytochem55505513200710.1369/jhc.6A7100.200717242463
|
|
3
|
S KjellevThe trefoil factor family - small
peptides with multiple functionalitiesCell Mol Life
Sci6613501369200910.1007/s00018-008-8646-519099184
|
|
4
|
GA CookM FamilariL ThimAS GiraudThe
trefoil peptides TFF2 and TFF3 are expressed in rat lymphoid
tissues and participate in the immune responseFEBS
Lett456155159199910.1016/S0014-5793(99)00940-010452549
|
|
5
|
JJ FarrellD TaupinTJ KohTFF2/SP-deficient
mice show decreased gastric proliferation, increased acid
secretion, and increased susceptibility to NSAID injuryJ Clin
Invest109193204200210.1172/JCI021252911805131
|
|
6
|
JG FoxAB RogersMT WharyAccelerated
progression of gastritis to dysplasia in the pyloric antrum of
TFF2−/− C57BL6 x Sv129 Helicobacter pylori-infected
miceAm J
Pathol17115201528200710.2353/ajpath.2007.07024917982128
|
|
7
|
AM HanbyR PoulsomS SinghG EliaRE JefferyNA
WrightSpasmolytic polypeptide is a major antral peptide:
distribution of the trefoil peptides human spasmolytic polypeptide
and pS2 in the stomachGastroenterology1051110111619938405856
|
|
8
|
A DignassK Lynch-DevaneyH KindonL ThimDK
PodolskyTrefoil peptides promote epithelial migration through a
transforming growth factor beta-independent pathwayJ Clin
Invest94376383199410.1172/JCI1173328040278
|
|
9
|
K KatoMC ChenM NguyenFS LehmannDK
PodolskyAH SollEffects of growth factors and trefoil peptides on
migration and replication in primary oxyntic culturesAm J
Physiol276G1105G1116199910330000
|
|
10
|
RJ PlayfordT MarchbankR ChineryHuman
spasmolytic polypeptide is a cytoprotective agent that stimulates
cell
migrationGastroenterology108108116199510.1016/0016-5085(95)90014-47806031
|
|
11
|
C MathelinC TomasettoMC RioTrefoil factor
1 (pS2/TFF1), a peptide with numerous functionsBull
Cancer927737812005(In French)
|
|
12
|
AM HanbyJA JankowskiG EliaR PoulsomNA
WrightExpression of the trefoil peptides pS2 and human spasmolytic
polypeptide (hSP) in Barrett's metaplasia and the native
oesophageal epithelium: delineation of epithelial phenotypeJ
Pathol173213219199410.1002/path.17117303037931841
|
|
13
|
T SaitohT MochizukiT SudaElevation of TFF1
gene expression during healing of gastric ulcer at non-ulcerated
sites in the stomach: semiquantification using the single tube
method of polymerase chain reactionJ Gastroenterol
Hepatol15604609200010.1046/j.1440-1746.2000.02209.x
|
|
14
|
AM HanbyR PoulsomG EliaS SinghJM
LongcroftNA WrightThe expression of the trefoil peptides pS2 and
human spasmolytic polypeptide (hSP) in ‘gastric metaplasia’ of the
proximal duodenum: implications for the nature of ‘gastric
metaplasia’J Pathol1693553601993
|
|
15
|
G OhshioH SuwaY KawaguchiDifferential
expression of human spasmolytic polypeptide (trefoil factor
family-2) in pancreatic carcinomas, ampullary carcinomas, and
mucin-producing tumors of the pancreasDig Dis
Scie45659664200010.1023/A:1005471005289
|
|
16
|
B TerrisE BlaveriT
Crnogorac-JurcevicCharacterization of gene expression profiles in
intraductal papillary-mucinous tumors of the pancreasAm J
Pathol16017451754200210.1016/S0002-9440(10)61121-212000726
|
|
17
|
NA WrightR PoulsomGW StampEpidermal growth
factor (EGF/URO) induces expression of regulatory peptides in
damaged human gastrointestinal tissuesJ
Pathol162279284199010.1002/path.17116204022290113
|
|
18
|
M Baus-LoncarJ Schmidel-N LalaniTrefoil
factor 2 (TFF2) deficiency in murine digestive tract influences the
immune systemCell Physiol
Biochem163142200510.1159/00008772916121031
|
|
19
|
DP BartelMicroRNAs: genomics, biogenesis,
mechanism, and
functionCell116281297200410.1016/S0092-8674(04)00045-514744438
|
|
20
|
AA ShahP LeidingerA KellerThe intestinal
factor Tff3 and a miRNA network regulate murine caloric
metabolismRNA Biol87781201110.4161/rna.8.1.1368721289491
|
|
21
|
SF HauslerA KellerPA ChandranWhole
blood-derived miRNA profiles as potential new tools for ovarian
cancer screeningBr J
Cancer103693700201010.1038/sj.bjc.660583320683447
|
|
22
|
P RothJ WischhusenC HappoldA specific
miRNA signature in the peripheral blood of glioblastoma patientsJ
Neurochem118449457201110.1111/j.1471-4159.2011.07307.x21561454
|
|
23
|
S UematsuK FujimotoThe innate immune
system in the intestineMicrobiol
Immunol54645657201010.1111/j.1348-0421.2010.00267.x21044138
|
|
24
|
S Griffiths-JonesmiRBase: the microRNA
sequence databaseMethods Mol Biol342129138200616957372
|
|
25
|
S VorwerkK GanterY ChengJ HoheiselPF
StahlerM BeierMicrofluidic-based enzymatic on-chip labeling of
miRNAsN Biotechnol25142149200810.1016/j.nbt.2008.08.00518786664
|
|
26
|
BM BolstadRA IrizarryM AstrandTP SpeedA
comparison of normalization methods for high density
oligonucleotide array data based on variance and
biasBioinformatics19185193200310.1093/bioinformatics/19.2.18512538238
|
|
27
|
M KanehisaS GotoKEGG: kyoto encyclopedia
of genes and genomesNucleic Acids
Res282730200010.1093/nar/28.1.2710592173
|
|
28
|
M KanehisaS GotoM HattoriFrom genomics to
chemical genomics: new developments in KEGGNucleic Acids
Res34D354D357200610.1093/nar/gkj10216381885
|
|
29
|
M KanehisaS GotoM FurumichiM TanabeM
HirakawaKEGG for representation and analysis of molecular networks
involving diseases and drugsNucleic Acids
Res38D355D360201010.1093/nar/gkp89619880382
|
|
30
|
H MashimoDC WuDK PodolskyMC
FishmanImpaired defense of intestinal mucosa in mice lacking
intestinal trefoil
factorScience274262265199610.1126/science.274.5285.2628824194
|
|
31
|
O LefebvreMP ChenardR MassonGastric mucosa
abnormalities and tumorigenesis in mice lacking the pS2 trefoil
proteinScience274259262199610.1126/science.274.5285.2598824193
|
|
32
|
MR AlisonR ChineryR PoulsomP AshwoodJM
LongcroftNA WrightExperimental ulceration leads to sequential
expression of spasmolytic polypeptide, intestinal trefoil factor,
epidermal growth factor and transforming growth factor alpha mRNAs
in rat stomachJ Pathol175405414199510.1002/path.1711750408
|
|
33
|
P GottS BeckJC MachadoF CarneiroH SchmittN
BlinHuman trefoil peptides: genomic structure in 21q22.3 and
coordinated expressionEur J HuM Genet430831519969043862
|
|
34
|
S BeckP SommerN BlinP Gott5′-flanking
motifs control cell-specific expression of trefoil factor genes
(TFF)Int J Mol Med23533611998
|
|
35
|
AC BrownWI OlverCJ DonnellySearching QTL
by gene expression: analysis of diabesityBMC
Genet612200510.1186/1471-2156-6-1215760467
|
|
36
|
KG KumarBK Smith RichardsTranscriptional
profiling of chromosome 17 quantitative trait Loci for carbohydrate
and total calorie intake in a mouse congenic strain reveals
candidate genes and pathwaysJ Nutrigenet
Nutrigenomics1155171200810.1159/000113657
|
|
37
|
A DaddaouaE Martinez-PlataR
Lopez-PosadasActive hexose correlated compound acts as a prebiotic
and is antiinflammatory in rats with hapten-induced colitisJ
Nutr13712221228200717449585
|
|
38
|
J ScholvenD TarasS SharbatiIntestinal
expression of TFF and related genes during postnatal development in
a piglet probiotic trialCell Physiol
Biochem23143156200910.1159/00020410319255509
|
|
39
|
S SharbatiMR FriedlanderJ
SharbatiDeciphering the porcine intestinal microRNA
transcriptomeBMC
Genomics11275201010.1186/1471-2164-11-27520433717
|
|
40
|
SK PanguluriS BhatnagarA KumarGenomic
profiling of messenger RNAs and microRNAs reveals potential
mechanisms of TWEAK-induced skeletal muscle wasting in micePloS
One5e8760201010.1371/journal.pone.000876020098732
|
|
41
|
F WuS ZhuY DingWT BeckYY
MoMicroRNA-mediated regulation of Ubc9 expression in cancer
cellsClin Cancer
Res1515501557200910.1158/1078-0432.CCR-08-082019223510
|