Introduction
Over 170 million people worldwide are estimated to
be chronically infected with the hepatitis C virus (HCV). HCV
carriers often develop chronic hepatitis (CH), liver cirrhosis
(LC), and hepatocellular carcinoma (HCC) after incubation periods
of 15, 25 and 30 years on average, respectively (1). HCC is one of the most fatal forms of
cancer and has an increasing incidence in many countries. The HCV
is the most clearly established risk factor for HCC. Despite the
current availability of anti-viral therapies, 25% of individuals
with chronic HCV infection are likely to develop advanced liver
cirrhosis within 20 years (2).
Furthermore, >70% of the cases of HCV-induced LC are destined to
develop HCC (3). Hence, the
current diagnostic strategies for these diseases emphasize
approaches that differentiate LC from CH, i.e., the progression of
fibrosis in the liver, in addition to the early detection of HCC.
Reliable, noninvasive methods for assessing the progression of LC
are not presently available, however. Histological examination of
the liver following a biopsy is the current standard for diagnosing
LC but this is an invasive method and carries the potential risk of
internal bleeding. In addition, as a consequence of a liver biopsy
procedure, 30% of patients feel pain, 0.3% have severe
complications, and 0.03% die (4).
Moreover, as biopsy of the liver can detect only a small part of
the whole organ, it is sometimes difficult to correctly identify
the stage of fibrosis with this method. Furthermore, whereas gross
cirrhosis can be detected by computed tomography scanning, this
cannot be used to detect early cirrhosis. Several biochemical
markers such as hyaluronic acid do have substantial predictive
values for the diagnosis of cirrhosis, but no biomarkers are
available that allow for a completely accurate diagnosis.
In clinical proteomics, two-dimensional
polyacrylamide gel electrophoresis (2D-PAGE)-based proteomic
analysis is a powerful technique for comparing different protein
expression profiles between normal and either diseased or
drug-treated samples. This includes protein expression levels, the
presence of isoforms generated by alternative splicing, cleavage by
proteases, and post-translational modifications. 2D-PAGE also
provides information on potential new biomarkers,
disease-associated targets and pathogenic processes. Moreover,
protein isoform profiles revealed by 2D-PAGE have been reported to
be characteristic of diseases such as cancer (5,6),
neurodegenerative disorders (7,8)
and Creutzfeldt-Jakob disease (9). In particular, some isoforms of serum
proteins have been reported to be potential diagnostic markers of
hepatitis B-associated liver inflammation (10), hepatocellular carcinoma (11) and coronary heart disease (12). However, although proteomics has
been extensively employed to investigate disease-specific proteins,
there are currently few studies of HCV-infected hepatitis and
cirrhosis cases that seek to establish non-invasive diagnoses for
these patients.
In our current study, we attempted to isolate novel
specific biomarker proteins for HCV-induced liver diseases in the
sera of patients with CH, LC and HCC using 2D-PAGE. We analyzed any
differentially expressed proteins in these experiments by peptide
mass fingerprinting (PMF) and MS/MS analysis and we report the
identification of a number of serum proteins and their isoforms
that show significantly different expression profiles in the
specific disease states under study.
Materials and methods
Serum samples
We analyzed serum samples obtained from 24
HCV-induced CH, 17 LC, and 19 HCC patients. As a control group we
further assessed 19 normal healthy individuals. Patients who were
positive for both antibodies to HCV by third-generation
enzyme-linked immunosorbent assay (Lumipulse II, Ortho HCV; Ortho
Clinical Diagnostics), and who also had detectable HCV-RNA in their
sera by RT-PCR (Amplicor HCV Amplification kit; Roche), were
diagnosed as having HCV-related liver disease. The serum samples
used in this study were all negative for HBV infection. CH and LC
were diagnosed by histological examination of biopsied samples.
Some cases were diagnosed as LC based on clinical findings without
liver biopsy, such as hepatic failure, ascites or an esophageal
varix. A diagnosis of HCC was mainly established by radiological
findings and elevated values for tumor markers. A biopsy was not
performed if a finding that was indicative of HCC was obtained by
ultrasonography, computed tomography, or a CT during hepatic
arteriography and arterial portography. Normal healthy sera were
collected from liver transplantation donors who showed no evidence
of disease.
All serum samples were collected and processed in
the same manner with the informed consent of each patient, and were
subsequently used in accordance with procedures approved by the
Ethics Committee of Mie University, University of Tsukuba, and the
National Institute of Advanced Industrial Science and Technology
(AIST). The protein content of each serum sample was determined by
a Bradford assay (Bio-Rad).
2D-PAGE of serum proteins
Serum proteins (100 μg aliquots) were applied to
immobiline dry strips (pH 4–7, 12 cm; Amersham) in a total volume
of 125 μl containing 8 M urea, 2% CHAPS, 0.5% immobilized pH
gradient buffer (Amersham) and 2.8 mg/ml dithiothreitol. Following
isoelectric focusing, the strips were equilibrated twice in 50 mM
Tris containing 6 M urea, 30% glycerol and 2% SDS for 10 min.
Dithiothreitol was then added, followed by iodoacetamide. The
second dimension for resolution was 12.5% non gradient SDS-PAGE
(16×12 cm) in two steps: 600 V, 20 mA for 30 min and 600 V, 50 mA
for 70 min. The resolved protein spots were then fixed for silver
staining by Dodeca™ Silver Stain kit (Bio-Rad) according to the
manufacturer’s instructions.
Image acquisition and analysis
Silver stained gels were scanned and intensity
calibrations were carried out using an intensity stepwedge prior to
gel image capture. Image analysis was subsequently carried out
using ImageMaster 2D Elite software 4.01 (Amersham). Protein spots
were initially detected, matched and then manually edited. Protein
spots showing significant differences in intensity (>1.5-fold
increase or decrease) between the different diseases were selected
for analysis by mass spectrometry.
In-gel digestion
Selected protein spots including isoforms were
excised and transferred into siliconized 1.5 ml microtubes. The
silver dye was removed by incubation with 15 mM potassium
hexacyanoferrate (III) (potassium ferricyanide) containing 100 mM
sodium thiosulfate for 30 min, and rinsing five times in ultra-pure
water for 5 min each. The gel piece was then dehydrated in 100%
acetonitrile, and dried using a vacuum desiccator. A 3 μl aliquot
of sequencing-grade trypsin (30 μg/ml; Promega) in 50 mM ammonium
bicarbonate containing 0.1% n-octyl glucoside was then
added, and the gel piece was reswollen by incubating on ice for 10
min. After this swelling, 27 μl of 50 mM ammonium bicarbonate was
added slowly. In-gel digestion was then performed overnight at
36°C. The peptides were adsorbed using a PerfectPure C-18 tip
(Eppendorf), desalted, and then extracted with 2 μl matrix solution
(5 mg/ml a-cyano-4-hydroxycinnamic acid in 50% acetonitrile and
0.1% trifluoroacetic acid), and mixed with 100 fmol/μl bradykinin
fragment 1–7 (Wako) and 100 fmol/μl ACTH fragment 18–39 (Sigma) on
a matrix-assisted laser desorption/ionization (MALDI) target
plate.
Mass spectrometry and PMF
Matrix-assisted laser desorption/ionization-time of
flight mass spectrometry (MALDI-TOF MS) for PMF was performed using
an AXIMA-CFR plus mass spectrometer (Shimadzu) in reflectron mode.
MS/MS analysis was performed using an AXIMA-QIT device (Shimadzu).
The results of the peptide identification by PMF and MS/MS were
scored by the Mascot database search engine (Matrix Science), and
the top-scoring gene products with a Mascot value of >30 (and/or
judged by Mascot to be more than ‘significant’), were designated as
the corresponding proteins.
Results
Comparison between the serum protein
profiles from HCV-induced disease patients and healthy
controls
Sera from healthy controls and three groups of
HCV-induced disease patients were applied to 2D-PAGE and the
resolved proteins were visualized by silver staining. 2D-PAGE was
performed either twice or three times for each sample and the
intensity of the spots was then calculated to minimize gel-to-gel
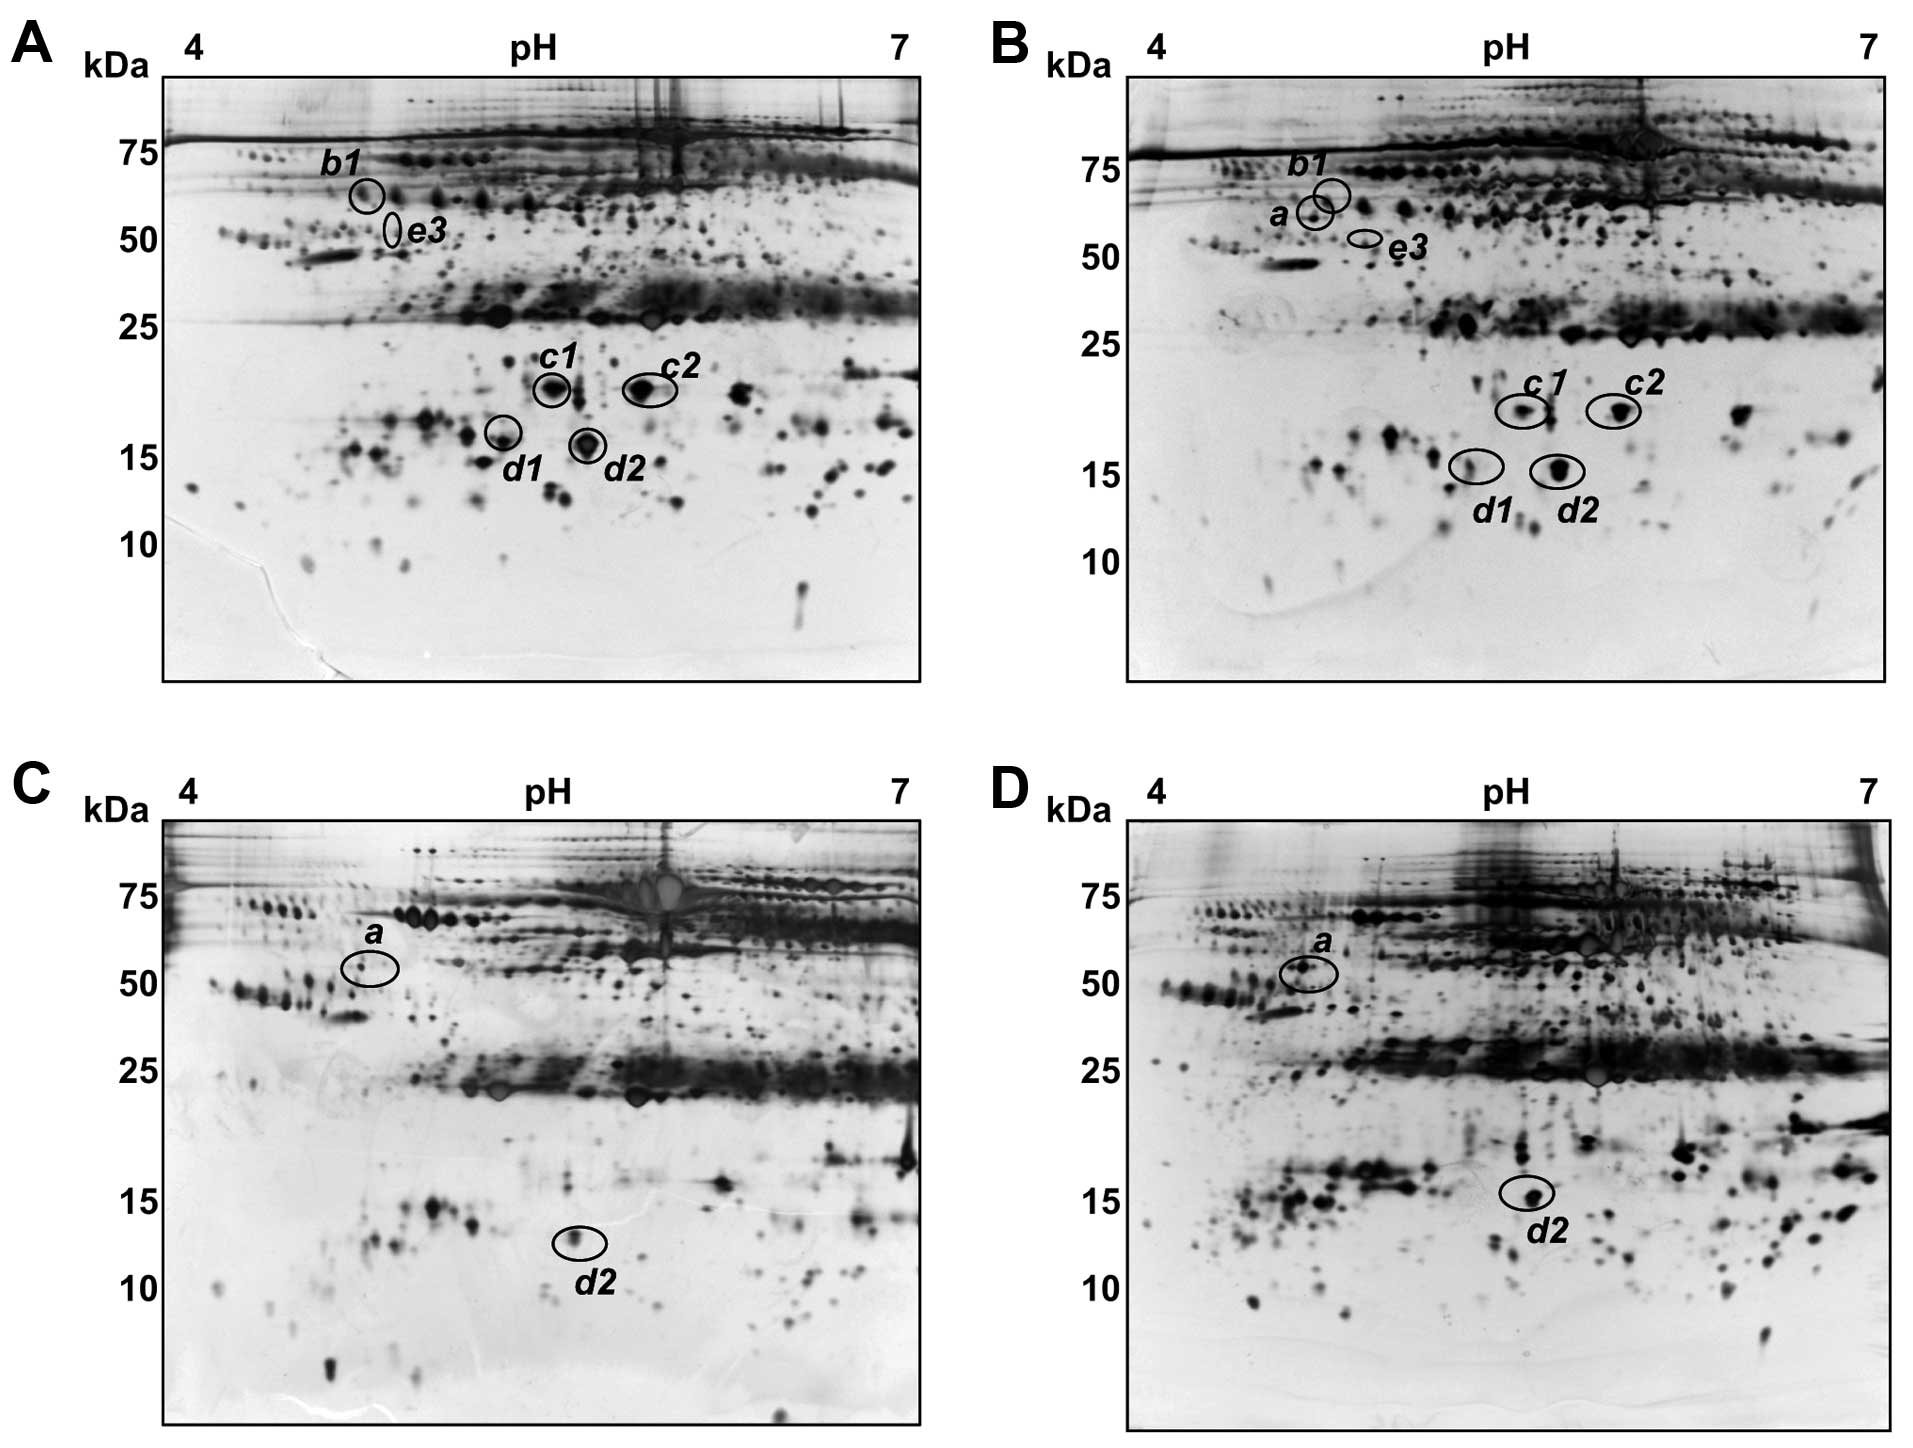
variation. Fig. 1 shows
representative gel images for normal healthy, and from CH, LC and
HCC patients. Overall, the serum patterns for normal healthy and CH
patients were found to be very similar to the plasma map of the
SWISS 2D database (http://www.expasy.ch/ch2d/), except for the lack of
fibrinogen due to the use of serum instead of blood plasma. More
than 800 spots were detected in these analyses, ranging from 10–150
kDa in size with pIs of between 4 and 7. Several trains of
spots represented proteins whose primary structures harbored
different degrees of glycosylation and/or phosphorylation,
resulting in a progressive change in both the pI and
molecular weight (Mr). Spot intensity comparisons were made
between the four groups of samples using Image Master software and
significant differences were found for at least seven spots among
eleven protein spots, which we designated as a, b1, b2, b3, c1, c2,
d1, d2, e1, e2 and e3 (Fig.
1).
Protein identification
The eleven spots including differentially expressed
protein spots shown in Fig. 1
were excised and subjected to tryptic digestion, MALDI-TOF MS and
database searching using Mascot software. The protein identities
were then confirmed by comparison with the SWISS database plasma
map (Table I). Some spots were
confirmed by MS/MS analyses using AXIMA-QIT.
 | Table IIdentification of the protein spots
observed to be differentially expressed in HCV-associated liver
diseases. |
Table I
Identification of the protein spots
observed to be differentially expressed in HCV-associated liver
diseases.
| Spot | Protein | Peptides matched | Sequence coverage
(%) | Confirmation
method |
|---|
| a | Complement C3 | 14–19 | 11–13 | PMF, MS/MS, plasma
mapa |
| b1-3 | Haptoglobin | 5–8 | 14–42 | PMF, plasma
map |
| c1, 2 | Haptoglobin
α2-chain | 3–7 | 10–23 | PSDb, PMF, plasma map |
| d1, 2 | Transthyretin | 8–10 | 62–85 | PMF, plasma
map |
| e1-3 | Apolipoprotein
A-IV | 10–13 | 30–38 | PMF, plasma
map |
The C-terminal fragment of C3 is
detectable in HCV-infected patient sera
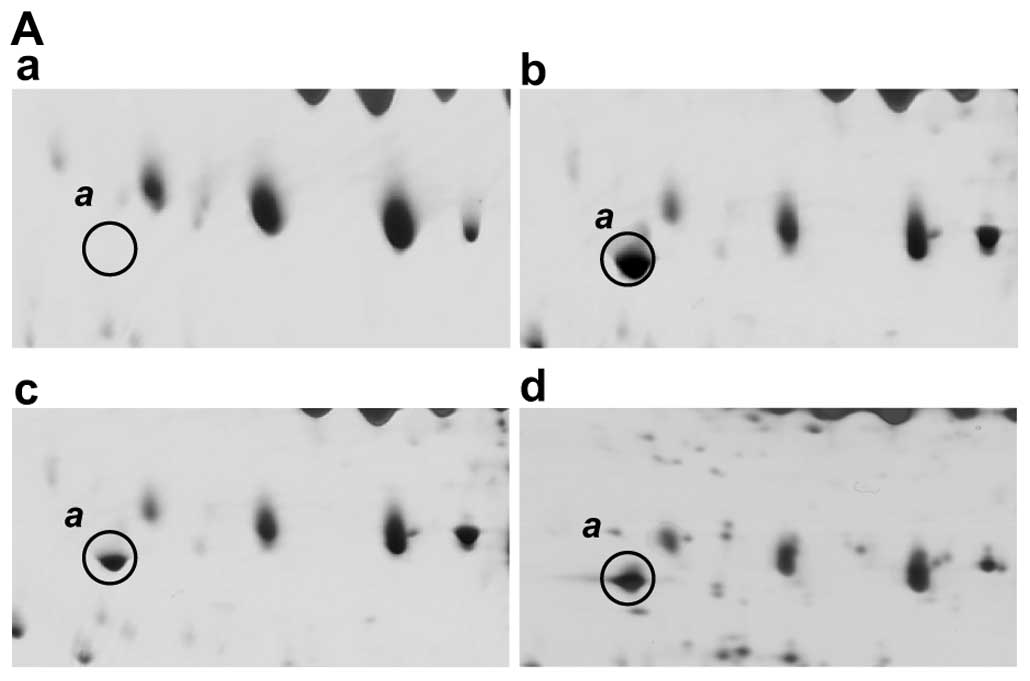
Fig. 2A shows the
2D-PAGE results for spot a which is present in each of the
HCV-infected patients but is absent from normal healthy sera. This
protein has an Mr of between 40–45 kDa, and a pI
ranging from 4.5 to 5.0, and both PMF and MS/MS analyses identified
it as a fragment of complement C3 (Fig. 2B). This C3 fragment was identified
from among the 14 peptides that match the C-terminal fragment of
the complement C3 precursor (Table
I). The matched peptides are found only in the C-terminal
region of the C3 protein from residue position 1321 (Fig. 2B). A MEROPS database search
(http://merops.sanger.ac.uk/) also
indicates that a potential protease, complement factor I, cleaves
the sites at 1303, located in the C3 α-chain, during the
inactivation of C3b and in the presence of cofactors. This cleavage
activity produces a fragment with a theoretical mass of 41,492 Da
and a pI of 4.96, which is consistent with the migratory
properties of spot a in our 2D-PAGE gels (Fig. 1). The sequence coverage of the
matched peptides from position 1304 to the C-terminus of C3 is
42%.
An isoform of transthyretin shows
decreased expression in the sera of CH patients
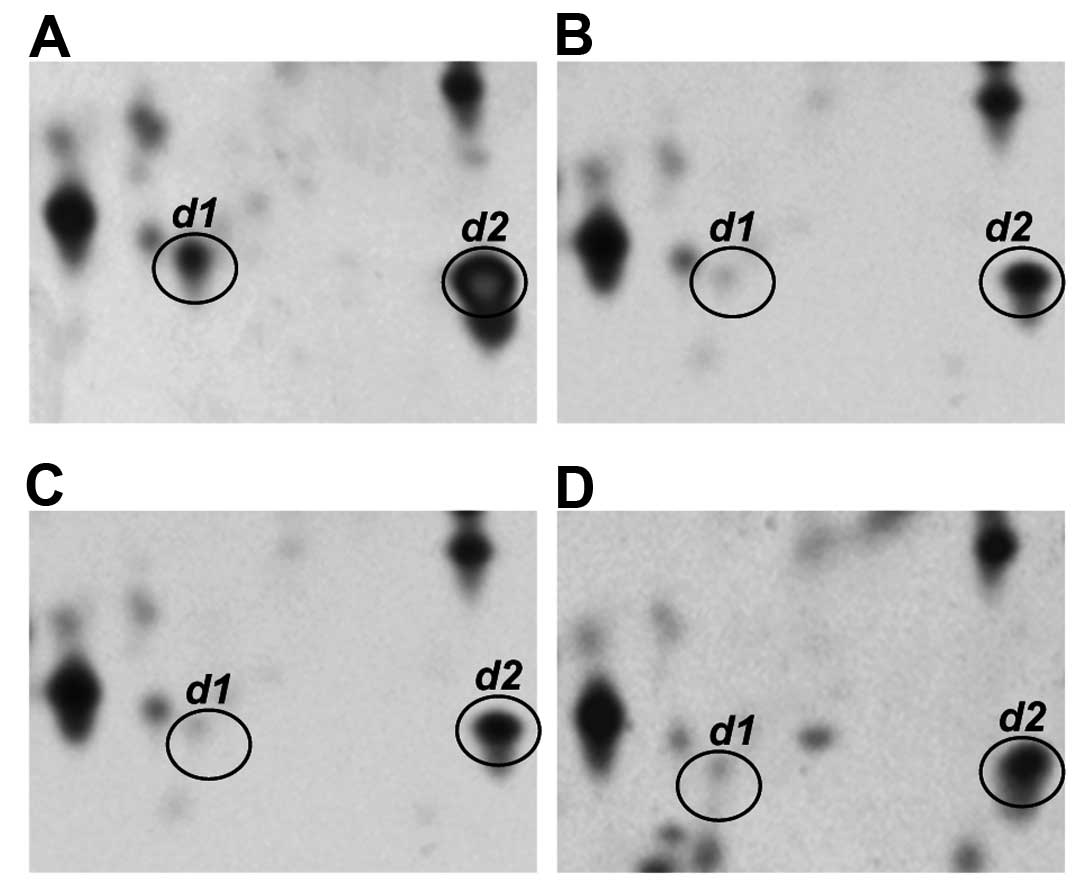
Fig. 3 shows
representative profiles of the transthyretin monomer (spot d1 and
d2) in the sera of normal individuals and of patients with CH, LC
and HCC. Two isoforms of this protein, designated as spots d1 and
d2, with different pI values (4.8 vs. 6.0, respectively)
were observed in the normal control. However, spot d1, which is the
more acidic transthyretin isoform, was clearly present at decreased
serum levels in the CH, LC and HCC patients.
Isoforms of haptoglobin, haptoglobin
α2-chain and apolipoprotein A-IV (apo A-IV) show decreased
expression in the sera of LC and HCC patients
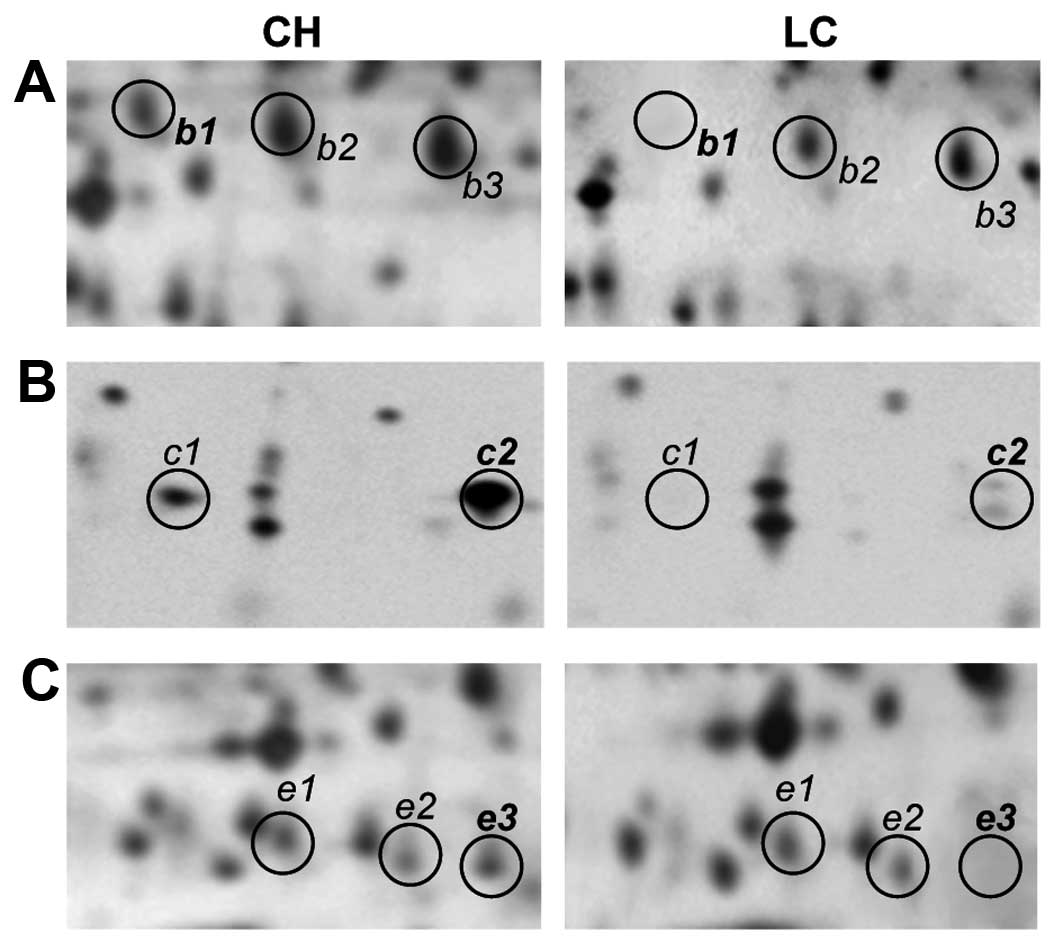
Fig. 4 displays
representative patterns of expression for isoforms of haptoglobin
(b1, b2 and b3), haptoglobin α2-chain (c1 and c2) and apo A-IV (e1,
e2 and e3) in the sera of both CH and LC patients. Haptoglobin,
haptoglobin α2-chain and apo A-IV exhibit characteristic train
patterns in 2D gels, featuring three, two and three detectable
isoforms, respectively. No change was found in the expression
pattern of these isoforms in either normal or CH sera, whereas a
significant reduction in the expression levels of these proteins
could be observed in the sera of LC and HCC patients. In
particular, spots b1, c1, c2 and e3 were at greatly reduced levels
in the LC patients, compared with the CH patients.
Comparative quantification of the
differentially expressed protein isoforms in sera from HCV-infected
patients
To normalize and compare the expression levels of
the protein spots b1, c1, c2, d1, d2 and e3 among the different
liver diseases, we selected an additional seven spots which
demonstrated almost constant levels of expression, regardless of
the origin of the serum sample. These seven proteins were expressed
with almost equal intensity in four groups of samples (Fig. 5). In addition, the standard
deviation (SD) from the mean expression levels of these factors in
each group was <10%, indicating that they could serve as
suitable standards. By contrast, the expression of the spots b1,
c1, c2, d1 and e3 changed significantly, and these changes
paralleled the differences in the stage of the liver disease
(Fig. 5; see figure legend for
the calculation of arbitrary units of intensity).
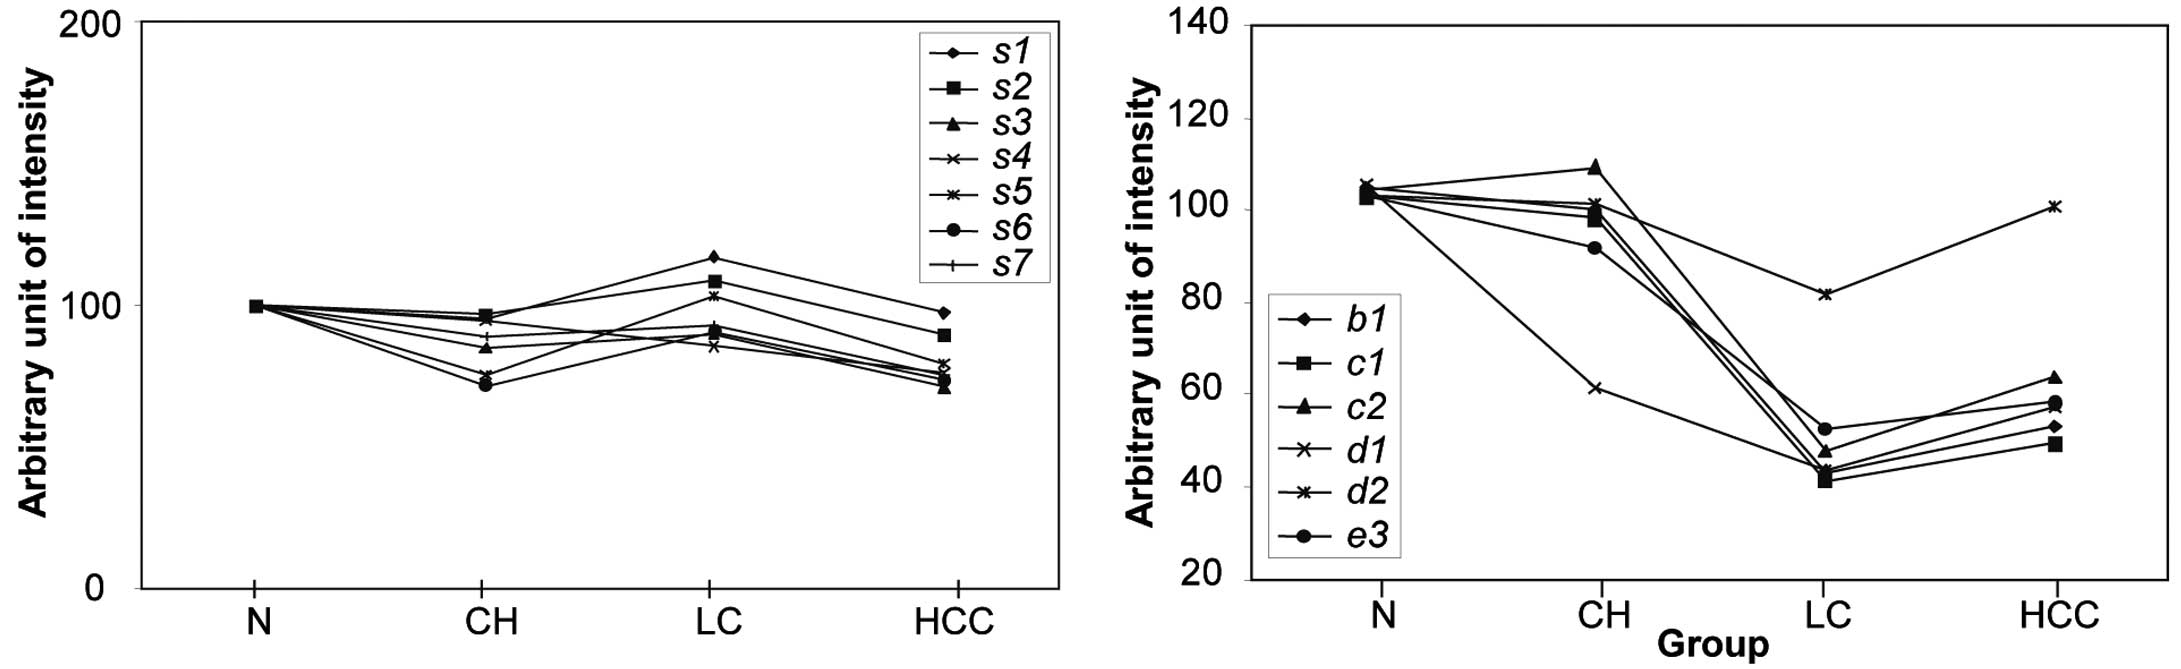 | Figure 5Expression levels of seven standard
proteins selected from the 2D-PAGE analysis and the normalized
relative intensity of the disease-affected spots. Normalized
intensity of the differentially expressed spots b1, c1, c2, d1, d2
and e3 in normal healthy, CH, LC and HCC samples are indicated in
the right panel. In the left panel, the average intensity of each
of the standard proteins from 19 normal controls was assigned a
value of 100, and the average relative intensities of each spot in
24 CH patients, 17 LC patients and 19 HCC patients were plotted. In
order to quantify the relative intensity of the disease-affected
protein spots, the intensity of the spot in a gel from a particular
patient was divided by the average intensity of the seven standard
spots in the same gel and was multiplied by 100. |
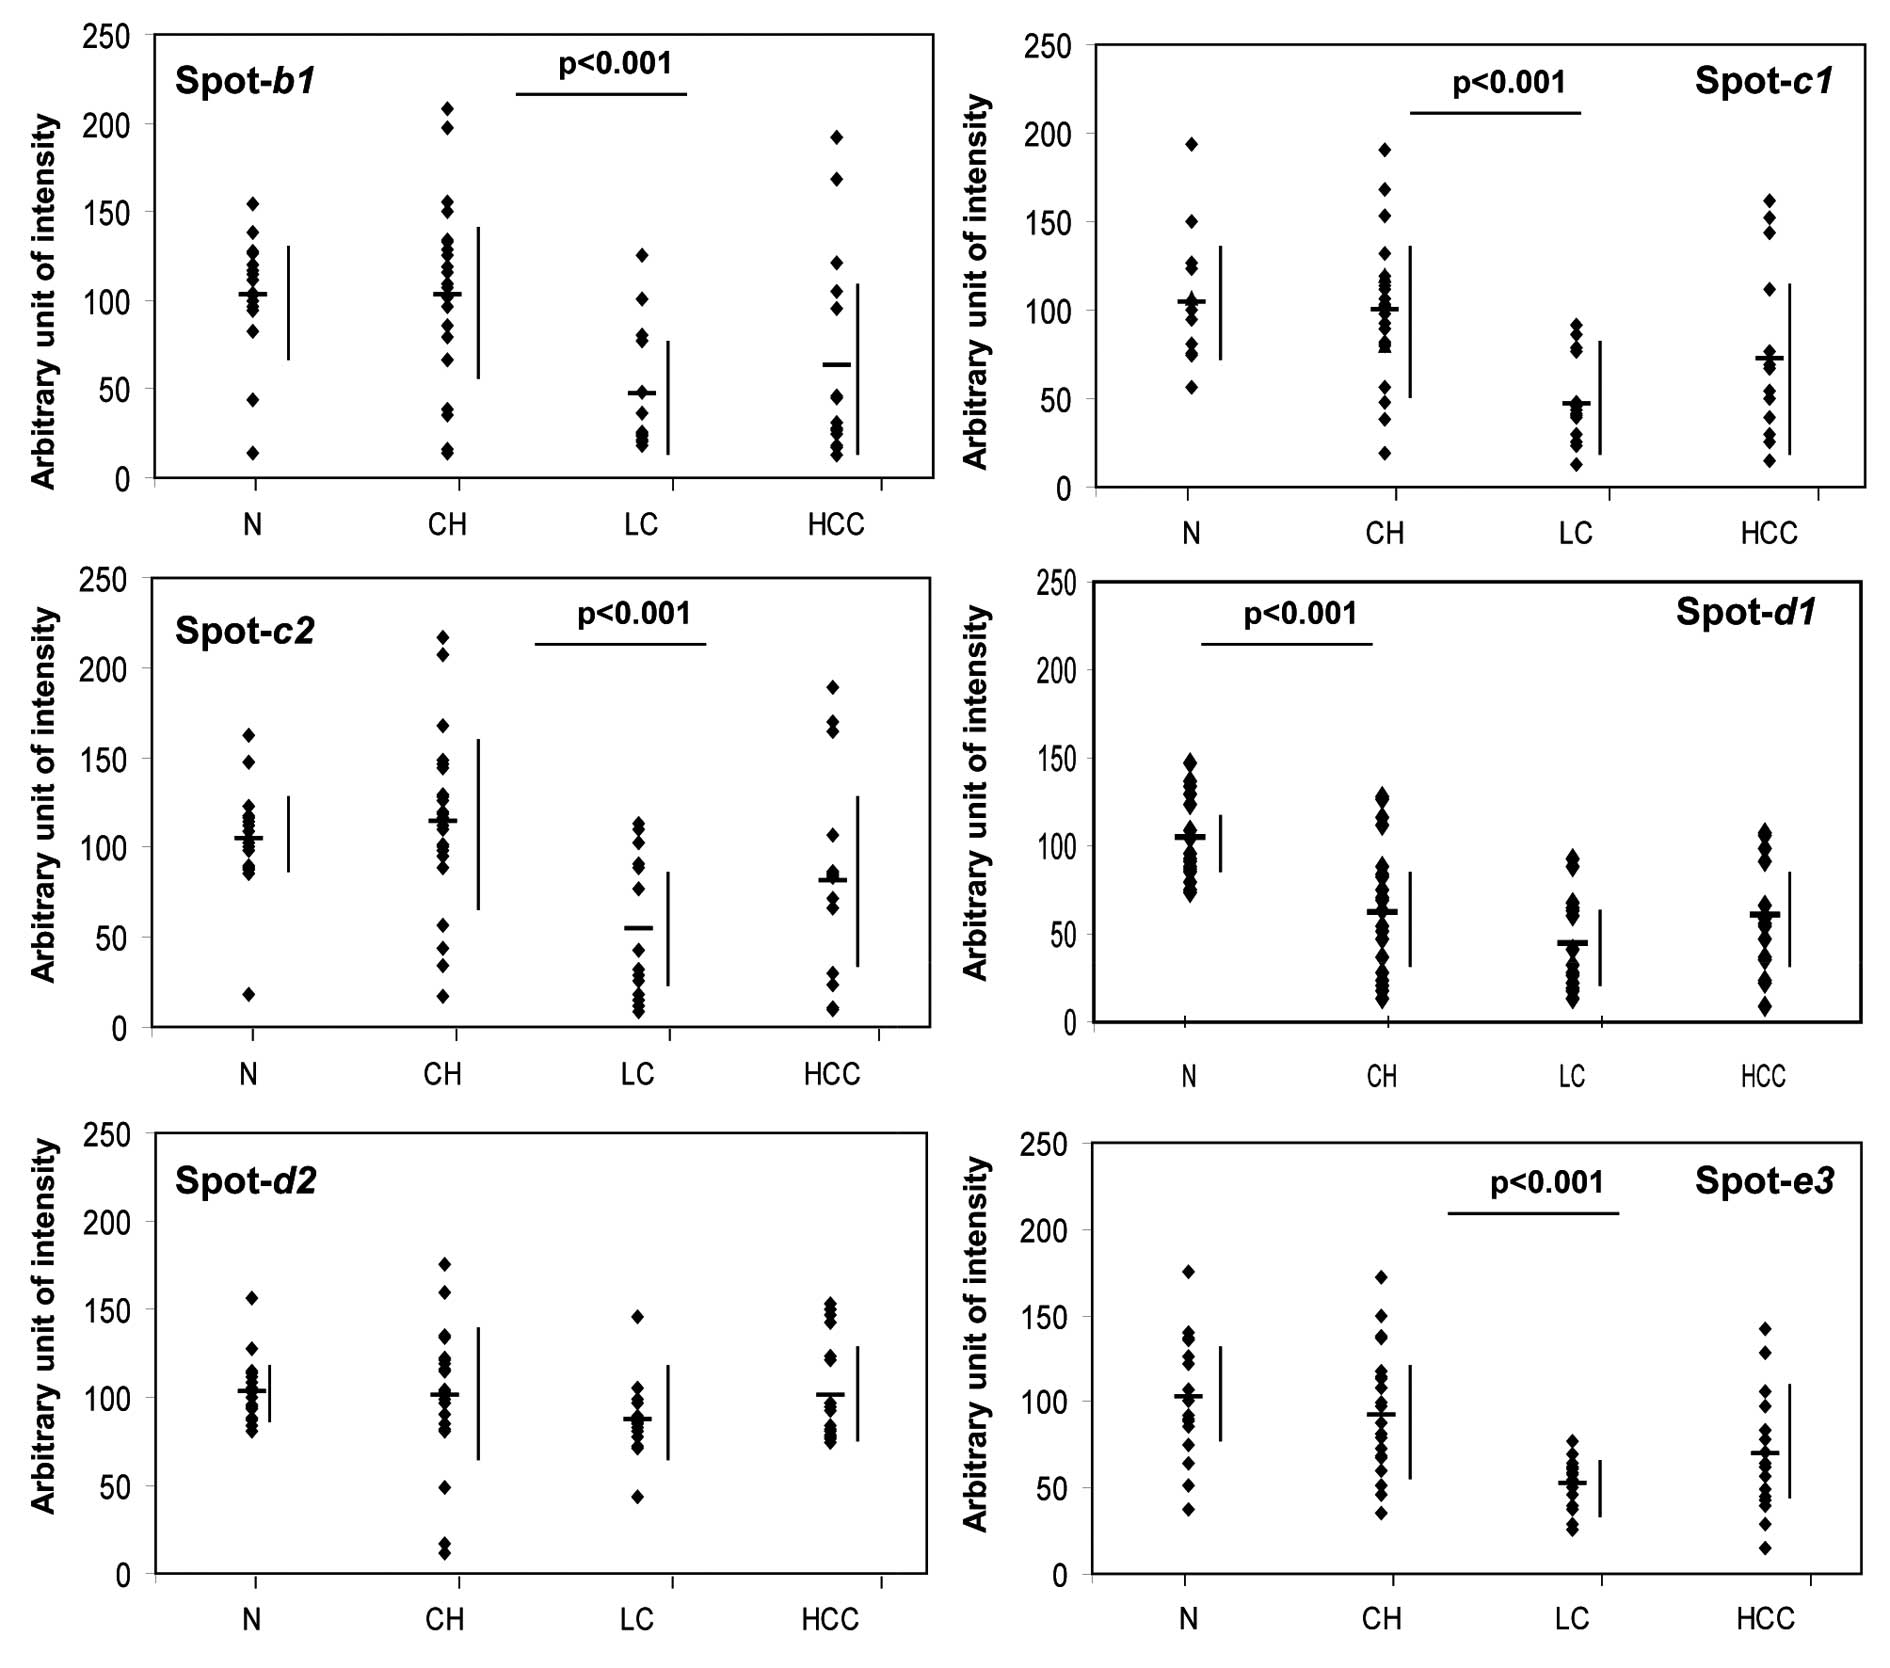
We next generated scatter diagrams for each of the
disease-related protein and isoform expression patterns (Fig. 6) and again confirmed that the
expression changes of b1, c1, c2, d1 and e3 seem to mirror the
progress of the associated liver disease stage. Whereas d1 was
found to be at low levels in all of the liver diseases tested, the
intensity of each of the other spots was significantly decreased
(p<0.001) with the progression from CH to LC. Moreover, the
expression of the d1 isoform of transthyretin also changed
significantly (p<0.001) and showed an appreciable reduction as
early as the CH stage of liver disease, whereas the d2 isoform did
not show this pattern (Figs. 5
and 6).
Identification of potential diagnostic
markers for CH and LC
Our present data suggest that the profiling of our
2D-PAGE protein isoforms a, b1, c1, c2, d1 and e3 could be
effectively utilized in the diagnosis of CH and LC. Table II shows the diagnostic values
(AUC) for these proteins and indicates that both complement C3
fragment (a) and transthyretin (d1) exhibit a high value (AUC=0.95
and 0.83, respectively) and may be utilized to distinguish CH from
a healthy liver. To distinguish LC from CH, the haptoglobin isoform
b1, the haptoglobin α2-chain isoforms c1 and c2, and the apo A-IV
isoform e3 also show high diagnostic values (0.91, 0.80, 0.85 and
0.89, respectively). Based on the assumption that a spot showing an
intensity of <66.7 units (i.e., an intensity lower than the mean
minus 1 SD) is significant, the sensitivity and the specificity of
the b1, c2 and e3 spots as disease biomarkers that can segregate LC
from CH cases are 60 and 96%, 60 and 83%, and 75 and 96%,
respectively. In addition, if the b1 and e3 markers are used in
combination, cases of LC could be more accurately diagnosed from CH
with an 85% sensitivity and 96% specificity (data not shown).
| Table IIAssessment of the identified
differentially expressed proteins as potential diagnostic
biomarkers for HCV-induced liver diseases. |
Table II
Assessment of the identified
differentially expressed proteins as potential diagnostic
biomarkers for HCV-induced liver diseases.
| | Normal vs. CH | CH vs. LC |
|---|
| |
|
|
|---|
| Spot | Protein | p-value | AUC | p-value | AUC |
|---|
| a | Complement C3
fragment | <0.001 | 0.95 | 0.086 | 0.65 |
| b1 | Haptoglobin | 0.684 | 0.51 | <0.001 | 0.91 |
| c1 | Haptoglobin
α2-chain | 0.731 | 0.53 | <0.001 | 0.80 |
| c2 | Haptoglobin
α2-chain | 0.713 | 0.62 | <0.001 | 0.85 |
| d1 | Transthyretin | <0.001 | 0.83 | 0.076 | 0.76 |
| d2 | Transthyretin | 0.856 | 0.58 | 0.075 | 0.76 |
| e3 | Apolipoprotein
A-IV | 0.331 | 0.60 | <0.001 | 0.89 |
Discussion
In our current study, we found that isoforms of
transthyretin, haptoglobin and apo A-IV are at reduced levels in
sera from HCV disease patients. The former two of these proteins
are among the most abundant serum glycoproteins known to be
secreted by the liver (13). It
is therefore plausible to predict that liver damage would result
from alterations in the expression profiles of these factors, or
from protein modifications. Such changes, therefore, have the
potential to be used as biomarkers for monitoring liver diseases.
The combined use of these novel diagnostic markers and conventional
serum markers could improve the diagnosis of HCV disease and reduce
the number of liver biopsies performed in patients with chronic HCV
infection. Our present study examined the alterations in global
serum protein levels of HCV patients who had developed various
liver complications by 2D-PAGE proteomics, a sensitive technique
which can reveal subtle changes in isoform expression. Protein
isoforms are produced by modifications such as partial cleavage,
glycosylation, and phosphorylation, and such alterations generate
trains of spots on the gel due to changes in both the isoelectric
point and molecular weight of the proteins. Hence, 2D-PAGE is an
appropriate method for detecting modified proteins (14). A previous study by Gravel et
al (15) investigated the
serum protein profiles of alcoholic patients by 2D-PAGE, including
liver cirrhosis cases, and detected glycosylation of both
haptoglobin and α1-antitrypsin. Transthyretin, haptoglobin and apo
A-IV have now all been shown to be glycosylated (16–18) and to generate spot trains on
2D-PAGE gels (5). Our current
findings that alterations in the modifications of these particular
proteins during HCV infection can be detected by 2D-PAGE indicate
that this technique is both sensitive and can be used in the
assessment of the pathogenesis of HCV.
The C-terminal fragment of complement C3 was
detectable in the serum samples of each of our patient subjects
suffering from liver disease associated with hepatitis C. This C3
fragment is produced during degenerative inactivation of C3b, and
its metabolism is both complex and regulated at many levels
(19). The C3 fragment detected
in our current study is similar in size and pI to the
fragment generated upon degradation by complement factor I at amino
acid position 1303. This process may occur during the course of
HCV-induced inflammation. Lee et al (20) also reported by surface-enhanced
laser desorption/ionization time-of-flight mass spectrometry
(SELDI-TOF MS) analysis that complement C3a is increased in sera
from HCV patients but not from HBV-infected individuals.
Furthermore, Gangadharan et al (21) revealed using 2D-PAGE that serum C3
was decreased in HCV-infected LC patients. These findings as well
as our observation that degradation of C3 is increased in serum of
HCV-infected patients may suggest pathogenesis of progression of
HCV-related liver disease. Thus, the C-terminal C3 fragment may be
a useful and effective marker for HCV-induced hepatitis.
Transthyretin is a short half-life protein produced
in the liver and a reduction in its serum levels is associated with
malnutrition in patients (7). In
addition, transthyretin has been found to be at significantly
reduced levels in various acute liver diseases (22). In our present study, a more acidic
variant of the two transthyretin isoforms was found to be at
significantly decreased levels (p<0.001) in the sera of CH
patients, and was also found to be a valid biomarker (AUC=0.833)
for discriminating CH patients from healthy individuals. Among the
six proteins that showed altered levels in our HCV-patient group,
transthyretin is the only protein that had decreased expression at
the pathogenic stage prior to the onset of liver cirrhosis.
Moreover, in combination with the C3 C-terminal fragment also
identified in our present experiments, the transthyretin isoform
may prove to be very useful in the diagnosis of HCV-induced chronic
hepatitis.
Haptoglobin has long been used as a serum marker of
various liver diseases including HBV infection. However,
contradictory results have been reported when analyzing this
protein. Haptoglobin has been used as one of five biochemical
markers to assess liver fibrosis in hepatitis C patients (23). However, the validity of these five
markers remains controversial (24,25). These conflicting results may be
due to the different measurements used, the varying sample sources
or the differences in the stages of the diseases under study. A
previous study reported that both the α2- and β-chains of
haptoglobin are at significantly decreased levels in HBV-infected
chronic hepatitis patients with a high necro-inflammatory score
(5). The authors suggest that an
advanced stage of inflammation causes severe liver function
impairment, resulting in a substantial decrease in the secretion of
these proteins in the injured liver. Our present data concerning
HCV-infected LC patients appear to support this idea and emphasize
the decrease in haptoglobin is a potential new indicator of liver
disease progression. However, it should be noted that our findings
demonstrate that changes in expression occur only for one specific
isoform of haptoglobin in addition to the haptoglobin α-chain, and
these factors are perhaps not detectable by conventional
biochemical assays or enzyme-linked immunosorbent assay.
Apo A-IV is a glycoprotein synthesized in the human
intestine; it has protective roles against lesions and
atherosclerosis and plays a physiological role in modulating
gastric function (26).
Suppressed levels of apo A-IV have been found in cases of
inflammation (27), acute
hepatitis (28) and cirrhosis
(29). Our present findings show
reduced levels of an apo A-IV isoform in the sera of HCV-infected
patients and indicate that this factor may be useful as a biomarker
of cirrhosis induced by HCV-infection.
In conclusion, our present study demonstrates that
protein isoform analysis by 2D-PAGE can generate a comprehensive
serological profile, in which novel biomarkers for HCV-induced
diseases change both quantitatively and qualitatively. In
particular, we observed reduced expression for isoforms of four
different serum proteins which are particularly informative and
useful in the assessment of HCV disease stage. Our current study
also revealed that two of these serum proteins can be used to
discriminate CH patients from normal healthy individuals, and that
a further three isoforms can serve as indicators of the progression
of CH to LC in HCV-infected patients. Combining these novel
biomarkers with conventional serum biomarkers could, therefore,
improve the accuracy of diagnosis of HCV-induced disease.
Acknowledgements
This study was supported in part by Grants-in-Aid
for Scientific Research from the Japan Society for the Promotion of
Science (JSPS) and for the New Energy and Industrial Technology
Development Organization (NEDO), Ministry of International Trade
and Industry. The authors thank Dr Takashi Ishii and Mr Eiji
Yamaguchi for their helpful comments and discussion. The authors
also thank Dr Rempei Nagashima for the critical reading of the
manuscript. A part of this study was performed at the Clinical
Informatics Research Facility in the National Institute of Advanced
Industrial Science and Technology (AIST), Japan.
Abbreviations:
|
2D-PAGE
|
two-dimensional polyacrylamide gel
electrophoresis
|
|
apo A-IV
|
apolipoprotein A-IV
|
|
AUC
|
area under ROC curve
|
|
CH
|
chronic hepatitis
|
|
HBV
|
hepatitis B virus
|
|
HCV
|
hepatitis C virus
|
|
HCC
|
hepatocellular carcinoma
|
|
LC
|
liver cirrhosis
|
|
MALDI-TOF MS
|
matrix-assisted laser
desorption/ionization-time of flight mass spectrometry
|
|
Mr
|
molecular weight
|
|
PMF
|
peptide mass fingerprinting
|
|
ROC
|
receiver operating characteristics
|
References
|
1
|
Niederau C, Lange S, Heintges T, Erhardt
A, Buschkamp M, Hurter D, Nawrocki M, Kruska L, Hensel F, Petry W
and Häussinger D: Prognosis of chronic hepatitis C: results of a
large, prospective cohort study. Hepatology. 28:1687–1695. 1998.
View Article : Google Scholar : PubMed/NCBI
|
|
2
|
Friedman SL: Liver fibrosis - from bench
to bedside. J Hepatol. 38(Suppl 1): S38–S53. 2003. View Article : Google Scholar
|
|
3
|
Cadranel JF, Rufat P and Degos F:
Practices of liver biopsy in France: results of a prospective
nationwide survey. For the Group of Epidemiology of the French
Association for the Study of the Liver (AFEF). Hepatology.
32:477–481. 2000. View Article : Google Scholar : PubMed/NCBI
|
|
4
|
Poynard T, Ratziu V and Bedossa P:
Appropriateness of liver biopsy. Can J Gastroenterol. 14:543–548.
2000.PubMed/NCBI
|
|
5
|
He QY, Cheung YH, Leung SY, Yuen ST, Chu
KM and Chiu JF: Diverse proteomic alterations in gastric
adenocarcinoma. Proteomics. 4:3276–3287. 2004. View Article : Google Scholar : PubMed/NCBI
|
|
6
|
Qi Y, Chiu JF, Wang L, Kwong DL and He QY:
Comparative proteomic analysis of esophageal squamous cell
carcinoma. Proteomics. 5:2960–2971. 2005. View Article : Google Scholar : PubMed/NCBI
|
|
7
|
Finehout EJ, Franck Z and Lee KH:
Complement protein isoforms in CSF as possible biomarkers for
neurodegenerative disease. Dis Markers. 21:93–101. 2005. View Article : Google Scholar : PubMed/NCBI
|
|
8
|
Kanninen K, Goldsteins G, Auriola S,
Alafuzoff I and Koistinaho J: Glycosylation changes in Alzheimer’s
disease as revealed by a proteomic approach. Neurosci Lett.
367:235–240. 2004.
|
|
9
|
Zanusso G, Righetti PG, Ferrari S, Terrin
L, Farinazzo A, Cardone F, Pocchiari M, Rizzuto N and Monaco S:
Two-dimensional mapping of three phenotype-associated isoforms of
the prion protein in sporadic Creutzfeldt-Jakob disease.
Electrophoresis. 23:347–355. 2002. View Article : Google Scholar : PubMed/NCBI
|
|
10
|
He QY, Lau GK, Zhou Y, Yuen ST, Lin MC,
Kung HF and Chiu JF: Serum biomarkers of hepatitis B virus infected
liver inflammation: a proteomic study. Proteomics. 3:666–674. 2003.
View Article : Google Scholar : PubMed/NCBI
|
|
11
|
Steel LF, Shumpert D, Trotter M, Seeholzer
SH, Evans AA, London WT, Dwek R and Block TM: A strategy for the
comparative analysis of serum proteomes for the discovery of
biomarkers for hepatocellular carcinoma. Proteomics. 3:601–609.
2003. View Article : Google Scholar : PubMed/NCBI
|
|
12
|
Burgess-Cassler A, Johansen JJ and
Kendrick NC: Two-dimensional gel analysis of serum apolipoprotein
A-I isoforms: preliminary analysis suggests altered ratios in
individuals with heart disease. Appl Theor Electrophor. 3:41–45.
1992.
|
|
13
|
Fuhrman MP, Charney P and Mueller CM:
Hepatic proteins and nutrition assessment. J Am Diet Assoc.
104:1258–1264. 2004. View Article : Google Scholar : PubMed/NCBI
|
|
14
|
Tong L, Baskaran G, Jones MB, Rhee JK and
Yarema KJ: Glycosylation changes as markers for the diagnosis and
treatment of human disease. Biotechnol Genet Eng Rev. 20:199–244.
2003. View Article : Google Scholar : PubMed/NCBI
|
|
15
|
Gravel P, Walzer C, Aubry C, Balant LP,
Yersin B, Hochstrasser DF and Guimon J: New alterations of serum
glycoproteins in alcoholic and cirrhotic patients revealed by high
resolution two-dimensional gel electrophoresis. Biochem Biophys Res
Commun. 220:78–85. 1996. View Article : Google Scholar : PubMed/NCBI
|
|
16
|
Garner B, Merry AH, Royle L, Harvey DJ,
Rudd PM and Thillet J: Structural elucidation of the N- and
O-glycans of human apolipoprotein(a): role of o-glycans in
conferring protease resistance. J Biol Chem. 276:22200–22208. 2001.
View Article : Google Scholar : PubMed/NCBI
|
|
17
|
He Z, Aristoteli LP, Kritharides L and
Garner B: HPLC analysis of discrete haptoglobin isoform N-linked
oligosaccharides following 2D-PAGE isolation. Biochem Biophys Res
Commun. 343:496–503. 2006. View Article : Google Scholar : PubMed/NCBI
|
|
18
|
Nelsestuen GL, Zhang Y, Martinez MB, Key
NS, Jilma B, Verneris M, Sinaiko A and Kasthuri RS: Plasma protein
profiling: unique and stable features of individuals. Proteomics.
5:4012–4024. 2005. View Article : Google Scholar : PubMed/NCBI
|
|
19
|
Sahu A and Lambris JD: Structure and
biology of complement protein C3, a connecting link between innate
and acquired immunity. Immunol Rev. 180:35–48. 2001. View Article : Google Scholar : PubMed/NCBI
|
|
20
|
Lee IN, Chen CH, Sheu JC, Lee HS, Huang
GT, Chen DS, Yu CY, Wen CL, Lu FJ and Chow LP: Identification of
complement C3a as a candidate biomarker in human chronic hepatitis
C and HCV-related hepatocellular carcinoma using a proteomics
approach. Proteomics. 6:2865–2873. 2006. View Article : Google Scholar : PubMed/NCBI
|
|
21
|
Gangadharan B, Antrobus R, Dwek RA and
Zitzmann N: Novel serum biomarker candidates for liver fibrosis in
hepatitis C patients. Clin Chem. 53:1792–1799. 2007. View Article : Google Scholar : PubMed/NCBI
|
|
22
|
Citarella F, Felici A, Brouwer M, Wagstaff
J, Fantoni A and Hack CE: Interleukin-6 downregulates factor XII
production by human hepatoma cell line (HepG2). Blood.
90:1501–1507. 1997.PubMed/NCBI
|
|
23
|
Imbert-Bismut F, Ratziu V, Pieroni L,
Charlotte F, Benhamou Y and Poynard T: Biochemical markers of liver
fibrosis in patients with hepatitis C virus infection: a
prospective study. Lancet. 357:1069–1075. 2001. View Article : Google Scholar : PubMed/NCBI
|
|
24
|
Myers RP, De Torres M, Imbert-Bismut F,
Ratziu V, Charlotte F and Poynard T: Biochemical markers of
fibrosis in patients with chronic hepatitis C: a comparison with
prothrombin time, platelet count, and age-platelet index. Dig Dis
Sci. 48:146–153. 2003. View Article : Google Scholar : PubMed/NCBI
|
|
25
|
Rossi E, Adams L, Prins A, Bulsara M, de
Boer B, Garas G, MacQuillan G, Seers D and Jeffrey G: Validation of
the FibroTest biochemical markers score in assessing liver fibrosis
in hepatitis C patients. Clin Chem. 49:450–454. 2003. View Article : Google Scholar : PubMed/NCBI
|
|
26
|
Vergnes L, Baroukh N, Lehy T, Moizo L,
Bado A, Baralle M, Baralle FE, Zakin MM and Ochoa A: Human
apolipoprotein A-IV reduces gastric acid secretion and diminishes
ulcer formation in transgenic mice. FEBS Lett. 460:178–181. 1999.
View Article : Google Scholar : PubMed/NCBI
|
|
27
|
Quilliot D, Walters E, Guerci B, Fruchart
JC, Duriez P, Drouin P and Ziegler O: Effect of the inflammation,
chronic hyperglycemia, or malabsorption on the apolipoprotein A-IV
concentration in type 1 diabetes mellitus and in diabetes secondary
to chronic pancreatitis. Metabolism. 50:1019–1024. 2001. View Article : Google Scholar : PubMed/NCBI
|
|
28
|
Miyata Y, Koga S and Ibayashi H:
Alterations in plasma levels of apolipoprotein A-IV in various
clinical entities. Gastroenterol Jpn. 21:479–485. 1986.PubMed/NCBI
|
|
29
|
Seishima M, Usui T, Naganawa S, Nishimura
M, Moriwaki H, Muto Y and Noma A: Reduction of intestinal apo A-IV
mRNA levels in the cirrhotic rat. J Gastroenterol Hepatol.
11:746–751. 1996. View Article : Google Scholar : PubMed/NCBI
|