Introduction
An aortic aneurysm (AA) is an enlargement which
occurs in the aorta, leading to progressive dilatation and ultimate
rupture. According to their anatomical locations, AAs are generally
classified as abdominal AAs (AAAs) and thoracic AAs (TAAs), which
appear to have distinct pathologies and mechanisms (1). AAAs are much more common (an
incidence of at least 3-fold higher) than TAAs (2). The differences in the physical
structure and mechanical stress of abdominal and thoracic aortas
may also contribute to the disparities in the pathogenesis of AAAs
and TAAs (3). Atheroscrelosis is
well known to be associated with AAAs, whereas it rarely occurs in
patients with TAAs. The increased expression of growth factors,
inflammatory cytokines and matrix metalloproteinses (MMPs) induces
the migration of macrophages and T cells and the formation of
atherosclerotic plaques. MMPs contribute to progressive structural
remodeling, particularly elastin and collagen turnover in AAAs. The
apoptosis of vascular smooth muscle cells (VSMCs) has also been
demonstrated in the media layer of AAA walls (4). These changes are associated with the
progressive weakening of the aortic walls in AAAs. Furthermore,
several studies have suggested that Th2-type immune responses play
a major role in the formation of AAAs (1). The levels of Th-2 cytokines, such as
interleukin (IL)-4, IL-5 and IL-10 are also significantly increased
in AAAs.
On the other hand, genetic contribution to TAAs
(approximately 20% of TAAs) is greater than that to AAAs.
Connective tissue disorders, such as Marfan syndrome, Loeys-Dietz
syndrome and Ehlers-Danlos syndrome type IV, influence the
pathogenesis of TAAs. Medial degeneration associated with the loss
of VSMCs and the destruction of medial elastic fibers is observed
much more frequently in patients with TAAs than in patients with
AAAs. As regards inflammation and cellular immune responses in
TAAs, Th1-type immune responses generally predominate in TAAs
(5). The increased expression of
the Th1 cytokine, interferon-γ, in TAAs has also been
demonstrated.
A number of studies have revealed the proteomic or
transcriptional profile associated with the pathological remodeling
process in AAAs or TAAs (6,7).
However, to the best of our knowledge, a comparison of the proteome
spectrum occurring in AAAs and that occurring in TAAs has not been
carried out to date.
In a recent study of ours (8), we successfully applied quantitative
proteomic analyses using tandem mass spectrometry (MS) with an
isobaric tag for relative and absolute quantitation (iTRAQ)
labeling strategy to reveal differentially expressed proteins in
diseased tissues and adjacent normal tissues. The proteomic
analyses revealed differentially expressed proteins in calcified
AAAs (CAAs) and calcified TAAs (CTAs) in contrast to adjacent
normal tissues (8). Consequently,
the proteins involved in aneurysm formation and vascular
calcification were identified (e.g., type I and type III collagen,
matrix Gla protein and α-2-HS-glycoprotein in CAAs; fibrinogen
chains and α-2-HS-glycoprotein in CTAs with an increased
expression; mimecan in CAAs; and fibulin-5 in CTAs with a decreased
expression compared with adjacent normal tissues). Furthermore,
proteomic analysis of differentially expressed proteins in calcific
aortic valves (CAVs) compared with those in adjacent normal
valvular tissues revealed that α-2-HS-glycoprotein had the greatest
increase in expression and that tenascin-X had the greatest
decrease in expression in the CAVs (9).
In this study, in order to elucidate the distinct
spectrum of molecular alteration leading to the differences in the
pathology between AAAs and TAAs, we attempted to reveal
differentially expressed proteins in AAAs and TAAs compared with
adjacent normal aorta (NA) tissues using the iTRAQ technology
(10), followed by nano-liquid
chromatography (nano-LC)-matrix-assisted laser desorption
ionization (MALDI)/time-of-flight (TOF/TOF)-tandem MS/MS (8,11).
We then compared the differentially expressed proteins in AAAs with
those in TAAs.
Patients and methods
Patients and samples
Aortic aneurysm tissues were collected after
obtaining approval from the Ethics Committee of Shimane University
School of Medicine, Izumo, Japan. All study participants provided
informed consent. Aortic aneurysm tissues for quantitative
differential expression analysis were obtained at surgery from 7
patients with AAAs [5 males and 2 females; age, 60–87 years;
average age (means ± SD), 76.6±10.5 years; size of aneurysms, 45–60
(52.9±5.9) mm] and from 7 patients with TAAs [4 males and 3
females; age, 63–87 years; average age, 78.6±8.3 years; size of
aneurysms, 53–72 (61.3±6.3) mm] who underwent aortic aneurysm
resection in Shimane University Hospital. Control samples were
obtained from relatively NA tissues adjacent to the AAA or TAA
tissues. In addition, another 10 AAA and 10 TAA and corresponding
adjacent NA tissues for confirmation by western blot analysis were
obtained from 10 patients with AAAs [8 males and 2 females; age,
62–89 years; average age, 78.5±7.4 years; size of aneurysms, 40–74
(55.2±10.1) mm] and 10 patients with TAAs [6 males and 4 females;
age, 55–80 years; average age, 70.6±7.9 years; size of aneurysms,
45–70 (55.9±7.6) mm]. The sample number, gender, age and size of
aneurysms are shown in Table I.
Tissue samples were snap-frozen in liquid nitrogen and stored at
−80°C until protein extraction.
 | Table ISamples used for MS analysis and
western blot analysis. |
Table I
Samples used for MS analysis and
western blot analysis.
| Gender | Age | Size of aneurysm
(mm) |
|---|
| Samples used for
iTRAQ labeling followed by MS analysis |
| AAA patient no. |
| AAA1 | M | 60 | 50 |
| AAA2 | F | 80 | 58 |
| AAA3 | M | 87 | 46 |
| AAA4 | M | 81 | 60 |
| AAA5 | M | 64 | 45 |
| AAA6 | M | 78 | 55 |
| AAA7 | F | 86 | 56 |
| TAA patient
no. |
| TAA1 | M | 78 | 62 |
| TAA2 | M | 87 | 72 |
| TAA3 | F | 78 | 60 |
| TAA4 | F | 75 | 63 |
| TAA5 | M | 63 | 53 |
| TAA6 | F | 87 | 55 |
| TAA7 | M | 82 | 64 |
| Samples from other
patients used for the determination of TNC expression by western
blot analysis |
| AAA patient
no. |
| AAA8 | M | 77 | 58 |
| AAA9 | M | 62 | 63 |
| AAA10 | M | 77 | 62 |
| AAA11 | M | 81 | 47 |
| AAA12 | M | 81 | 40 |
| AAA13 | M | 83 | 51 |
| AAA14 | F | 79 | 57 |
| AAA15 | F | 84 | 74 |
| AAA16 | M | 89 | 56 |
| AAA17 | M | 72 | 44 |
| TAA patient
no. |
| TAA8 | F | 80 | 62 |
| TAA9 | M | 78 | 70 |
| TAA10 | M | 78 | 58 |
| TAA11 | M | 75 | 54 |
| TAA12 | F | 66 | 54 |
| TAA13 | F | 64 | 47 |
| TAA14 | M | 65 | 52 |
| TAA15 | M | 74 | 54 |
| TAA16 | F | 71 | 45 |
| TAA17 | M | 55 | 63 |
Sample preparation
Sample preparation was carried out according to the
manual supplied by AB Sciex (Foster City, CA, USA) and according to
our previous studies (8,9). Briefly, ~30 mg of each of the AAA or
TAA tissues and their adjacent NA tissues as controls were
subjected to protein extraction. Following the addition of urea
lysis buffer containing 7 M urea, 0.1% Nonidet P-40 (NP-40) and 500
mM triethylammonium bicarbonate (TEAB) (Sigma, Tokyo, Japan), the
sample was sonicated, incubated at 4°C for 1 h, and centrifuged,
and then the supernatant was collected. The supernatant was
desalted and its buffer was exchanged with 50 mM TEAB using spin
concentrators (Corning, Tokyo, Japan). The protein concentration
was determined using a bicinchoninic acid (BCA) assay kit (Thermo
Fisher Scientific, Waltham, MA, USA).
iTRAQ labeling
Labeling with iTRAQ was carried out using iTRAQ™
Reagent from AB Sciex as described in the manual supplied. First,
125 μg of proteins in each of the lysates from the AAA or TAA
samples and adjacent NA samples were denatured by sodium dodecyl
sulfate (SDS) and reduced by [tris-(2-carboxyethyl)phosphine
(TCEP)]. Cysteine alkylation was then carried out by methyl
methanethiosulfonate (MMTS). Each sample from the AAA or TAA and
adjacent NA tissues was digested by trypsin. Each digest was
labeled with a different iTRAQ tag using an iTRAQ Reagent Multiplex
kit (AB Sciex). The labeled AAA or TAA and control samples were
then combined. The combined samples were fractionated into 6
fractions with a strong cation exchange (SCX) chromatograph (AB
Sciex) according to the manufacturer’s instructions. Each of the
fractions was then desalted by a Sep-Pac C18 cartridge
(Waters Corp., Milford, MA, USA).
Nano-LC
Fractionation with the DiNa nano-LC system was
performed according to the instructions provided by the
manufacturer (KYA Technologies, Tokyo, Japan) and our previous
study (11). A total of 171 spots
that were mixed directly with a matrix [4 mg/ml
α-cyano-4-hydroxycinnamic acid (CHCA); Wako, Osaka, Japan] were
placed on an Opti-TOF LC/MALDI 384 target plate (AB Sciex) using a
Dina MaP fraction collector (KYA Technologies) per fraction of SCX
chromatography.
MS, MS/MS and iTRAQ ratio analysis
MS data were obtained using a Mass Spectrometer 5800
MALDI-TOF/TOF Analyzer (AB Sciex) according to the instructions
provided by the manufacturer (AB Sciex) and our previous study
(11). A monoisotopic precursor
for MS/MS was selected by automatic precursor selection with an
interpretation method using the DynamicExit Algorithm (AB Sciex).
The MS/MS data were analyzed by ProteinPilot™ 3.0 software using
the Paragon protein database search algorithm (AB Sciex), as
previously described (12). Each
MS/MS spectrum was searched against the database (version 20081216,
20,489 entries) constructed by AB Sciex. The statistical method of
iTRAQ analysis was according to ProteinPilot software.
Bioinformatic analysis
The PANTHER system (http://www.pantherdb.org/) was used for classification
and pathway analyses of proteins (13). Pathway classification analysis was
carried out using a statistical overrepresentation test on PANTHER
with Bonferroni correction for multiple testing. The UniProt
database (http://www.uniprot.org/) was used for
annotations of identified proteins. Clustering analysis of
differentially expressed proteins was performed using Genesis
software provided by the Genesis team at the Institute for Genomics
and Bioinformatics, Graz University of Technology (Graz, Austria)
(http://genome.tugraz.at/) (14).
Western blot analysis
Cell lysates were extracted with urea lysis buffer
as described above. Western blot analysis was performed as
described in our previous study (8). A total of 20 μg of proteins in these
lysates was electrophoresed through sodium dodecyl sulfate
(SDS)-polyacrylamide gel electrophoresis (PAGE), and then the
proteins were transferred onto Hybond ECL nitrocellulose membranes
(GE Healthcare Japan, Hino, Japan). The membranes were reacted with
rabbit polyclonal anti-α-2-HS-glycoprotein antibody (Calbiochem,
Darmstadt, Germany), rabbit polyclonal anti-ceruloplasmin antibody
(Epitomics, Burlingame, CA, USA) or mouse monoclonal
anti-tenascin-C (TNC) antibody [Immuno Biological Laboratories
(IBL) Takasaki, Japan]. The proteins on the membranes were then
reacted with anti-rabbit IRDye 680-conjugated immunoglobulin (Ig)G
or anti-mouse IRDye 800-conjugated IgG, followed by visualization
using the infrared imaging system, Odyssey (all from LI-COR
Biosciences, Lincoln, NE, USA). For densitometric analyses of each
protein level, the intensity of each band that reacted with the
corresponding antibody was measured. Data from triplicate
experiments were analyzed for statistical significance by the
paired t-test, with p<0.05 considered to indicate a
statistically significant difference. Results are expressed as the
means ± standard error (SE).
Results
Proteomic analyses of differentially
expressed proteins in AAAs or TAAs compared with those in adjacent
NA tissues
A total of 7 AAAs and 7 TAAs, as well as adjacent NA
tissues were collected from 7 AAA and 7 TAA patients. The
identification and quantification of differentially expressed
proteins in AAAs or TAAs compared with those in adjacent NA tissues
were carried out with iTRAQ labeling coupled with
nano-LC-MALDI-TOF/TOF-MS/MS followed by ProteinPilot analysis.
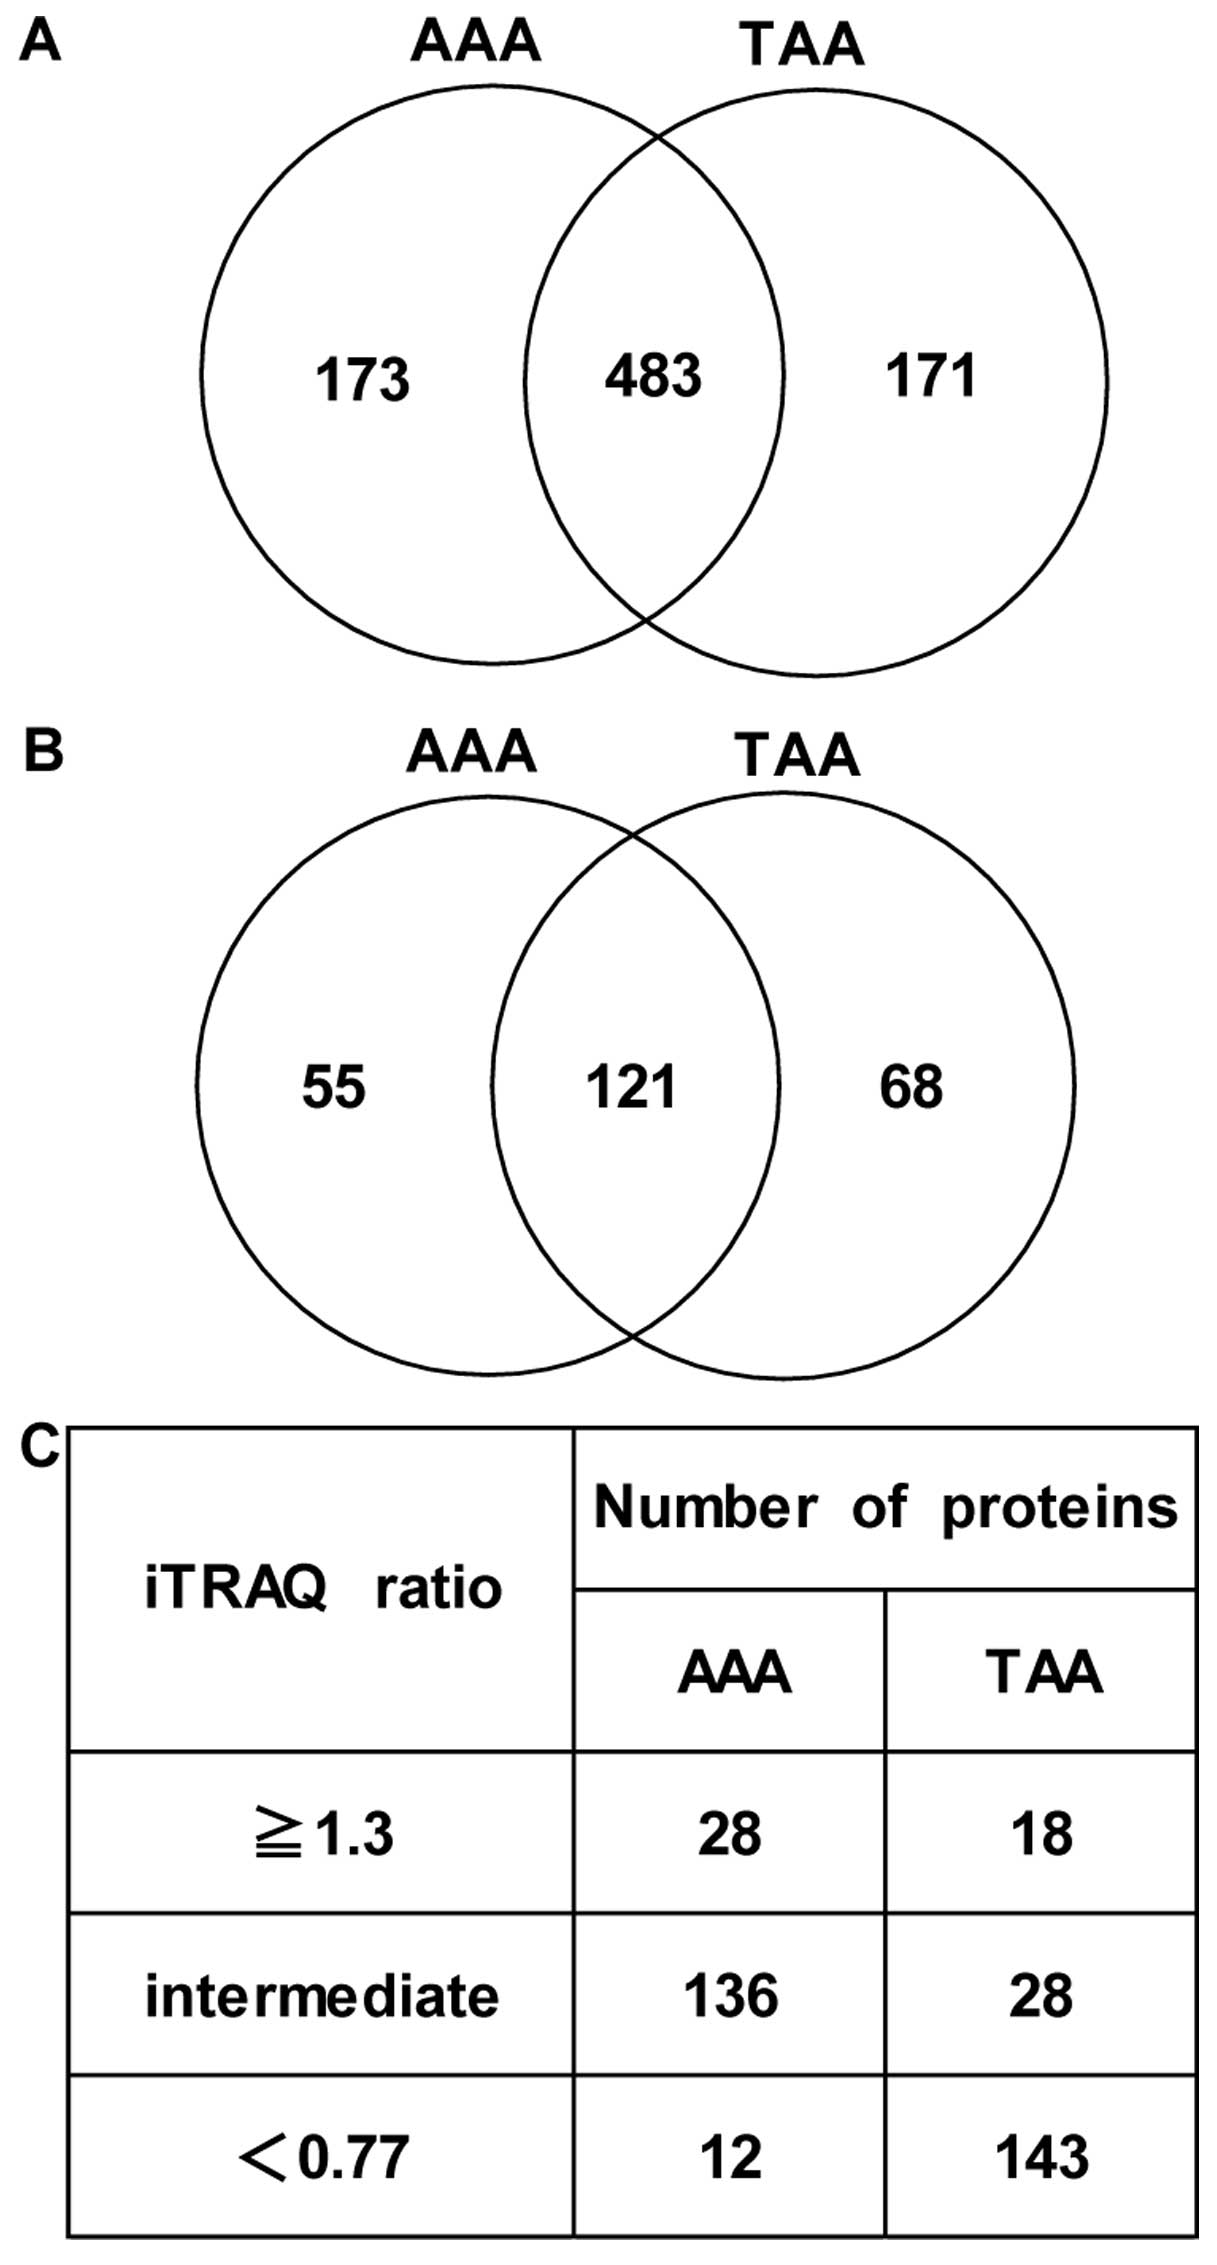
Apart from albumin and Ig family members, a total of 656
differentially expressed proteins (AAAs vs. NA tissues) in at least
1 sample within 7 AAAs and 654 differentially expressed proteins
(TAAs vs. NA tissues) in at least 1 sample within 7 TAAs were
identified. Among these, 483 proteins were detected in both
aneurysmal tissues (Fig. 1A). A
total of 176 differentially expressed proteins (AAAs vs. NA
tissues) which were common in at least 5 samples within 7 AAAs and
189 differentially expressed proteins (TAAs vs. NA tissues) which
were common in at least 5 samples within 7 TAAs were identified
with an unused ProtScore of ≥2 (99% confidence) based on
ProteinPilot statistical analysis. Among these, 121 proteins were
detected which were common in both aneurysmal tissues (Fig. 1B). Of note, after having
classified the patients based on the diameter of the aneurysms
(small group, ≤55 mm; large group, >55 mm) (small diameter
group, #AAA1, #AAA3, #AAA5 and #AAA6; large diameter group, #AAA2,
#AAA4 and #AAA7 in the case of AAA; small diameter group, #TAA5 and
#TAA6; large diameter group, #TAA1, #TAA2, #TAA3, #TAA4 and #TAA7
in the case of TAA), we examined which proteins in the 176 AAA and
189 TAA proteins showed distinct expression patterns in the large
diameter group and small diameter group with one-way ANOVA using
Genesis software. Consequently, with p<0.01 (small diameter
group vs. large diameter group), histone H4 and nucleophosmin were
identified in the AAA proteins, whereas α-actinin-4, α-1-acid
glycoprotein 1, basement membrane-specific heparan sulfate
proteoglycan core protein, caldesmon, calreticulin, filamin-A,
lamin-A/C, lipoma-preferred partner, NADH-cytochrome b5 reductase
3, membrane primary amine oxidase, myosin-9, myosin-10, myosin-11,
myosin light polypeptide 6, polymerase I and transcript release
factor, transgelin, tropomyosin β chain, versican core protein and
vimentin were identified in the TAA proteins.
Furthermore, since most biochemical methods tend to
have technical variation, we considered an additional cut-off value
(1.3-fold change in expression; upregulated proteins, ≥1.3-fold
change in expression; downregulated proteins, <0.77-fold change
in expression, AA tissues vs. NA tissues) for iTRAQ ratios for the
selection of proteins with differential expression levels, as
previously described (9,15,16). As a result, 28 and 18 proteins
with a significantly increased expression (≥1.3-fold, AA tissues
vs. NA tissues) and 12 and 143 proteins with a significantly
decreased expression (<0.77-fold, AA tissues vs. NA tissues)
were identified in the AAAs and TAAs, respectively (Fig. 1C). In Tables II-V, proteins with increased (≥1.3-fold, AA
tissues vs. NA tissues) and decreased expression (<0.77-fold, AA
tissues vs. NA tissues) in the AAAs and TTAs compared with the
adjacent NA tissues are listed in order of iTRAQ ratios.
| Table IIProteins with increased expression in
AAA tissues compared with adjacent NA tissues. |
Table II
Proteins with increased expression in
AAA tissues compared with adjacent NA tissues.
| Unused
ProtScorea | % Coverageb | Peptidesc (95%) |
Reproducibilityd | UniProt no. | Gene symbol | Protein name | iTRAQ ratio average
± SE | Molecular
function |
|---|
| 52.1 | 70.0 | 53 | 5 | P17661 | DES | Desmin | 2.80±0.88 | Cytoskeletal
protein |
| 15.0 | 68.4 | 9 | 5 | P21291 | CSRP1 | Cysteine and
glycine-rich protein 1 | 1.97±0.78 | Cytoskeletal
protein |
| 96.3 | 57.3 | 96 | 5 | P02461 | COL3A1 | Collagen α-1(III)
chain | 1.96±0.91 | Extracellular
matrix |
| 47.3 | 70.8 | 35 | 6 | P07951 | TPM2 | Tropomyosin β
chain | 1.87±0.85 | Cytoskeletal
protein |
| 42.4 | 90.1 | 30 | 6 | Q01995 | TAGLN | Transgelin | 1.75±0.71 | Cytoskeletal
protein |
| 122.3 | 73.0 | 109 | 7 | P08123 | COL1A2 | Collagen α-2(I)
chain | 1.72±0.56 | Extracellular
matrix |
| 150.4 | 54.4 | 132 | 5 | P35749 | MYH11 | Myosin-11 | 1.67±0.37 | Cytoskeletal
protein |
| 136.5 | 71.2 | 151 | 7 | P02452 | COL1A1 | Collagen α-1(I)
chain | 1.65±0.55 | Extracellular
matrix |
| 31.6 | 8.1 | 15 | 5 | P13611 | VCAN | Versican core
protein | 1.64±0.67 | Extracellular
matrix |
| 4.0 | 27.8 | 2 | 5 | P60903 | S100A10 | Protein
S100-A10 | 1.62±0.45 | Calcium-binding
protein |
| 18.0 | 68.9 | 9 | 7 | P62805 | HIST1H4A | Histone H4 | 1.60±0.32 | Nucleic acid
binding |
| 31.8 | 41.5 | 17 | 6 | Q05682 | CALD1 | Caldesmon | 1.53±0.39 | Cytoskeletal
protein |
| 15.4 | 50.8 | 8 | 5 | P51911 | CNN1 | Calponin-1 | 1.49±0.47 | Cytoskeletal
protein |
| 73.7 | 75.3 | 60 | 7 | P08670 | VIM | Vimentin | 1.47±0.38 | Cytoskeletal
protein |
| 39.9 | 68.2 | 28 | 7 | P21810 | BGN | Biglycan | 1.45±0.53 | Extracellular
matrix |
| 4.0 | 18.4 | 2 | 5 | P06748 | NPM1 | Nucleophosmin | 1.43±0.26 | Chaperone |
| 22.7 | 26.8 | 12 | 5 | P08107 | HSPA1A | Heat shock 70 kDa
protein 1 | 1.43±0.42 | Chaperone |
| 18.0 | 26.8 | 9 | 5 | Q5VTE0 | EEF1AL3 | Putative elongation
factor 1-α-like 3 | 1.43±0.24 | Putative protein
biosynthesis |
| 13.0 | 61.8 | 7 | 6 | P62937 | PPIA | Peptidyl-prolyl
cis-trans isomerase A | 1.43±0.40 | Isomerase |
| 4.1 | 14.6 | 2 | 5 | O14791 | APOL1 | Apolipoprotein
L1 | 1.40±0.61 | Transporter |
| 7.7 | 23.4 | 4 | 5 | Q14847 | LASP1 | LIM and SH3 domain
protein 1 | 1.40±0.49 | Cytoskeletal
protein |
| 8.4 | 88.6 | 4 | 6 | P62328 | TMSB4X | Thymosin β-4 | 1.37±0.36 | Cytoskeletal
protein |
| 10.1 | 34.6 | 5 | 5 | P00387 | CYB5R3 | NADH-cytochrome b5
reductase 3 | 1.36±0.44 | Oxidoreductase |
| 23.7 | 29.1 | 21 | 5 | P08572 | COL4A2 | Collagen α-2(IV)
chain | 1.33±0.31 | Extracellular
matrix |
| 14.8 | 40.3 | 8 | 5 | Q07507 | DPT | Dermatopontin | 1.33±0.37 | Extracellular
matrix |
| 20.0 | 21.5 | 14 | 6 | Q16853 | AOC3 | Membrane primary
amine oxidase | 1.33±0.27 | Oxidoreductase |
| 20.4 | 86.8 | 18 | 6 | P60660 | MYL6 | Myosin light
polypeptide 6 | 1.31±0.31 | Cytoskeletal
protein |
| 5.4 | 6.8 | 3 | 5 | P27824 | CANX | Calnexin | 1.31±0.36 | Calcium-binding
protein |
| Table VProteins with decreased expression in
TAA tissues compared with adjacent NA tissues. |
Table V
Proteins with decreased expression in
TAA tissues compared with adjacent NA tissues.
| Unused
ProtScorea | % Coverageb | Peptidesc (95%) |
Reproducibilityd | UniProt no. | Gene symbol | Protein name | iTRAQ ratio average
± SE | Molecular
function |
|---|
| 64.3 | 15.3 | 44 | 7 | P13611 | VCAN | Versican core
protein | 0.29±0.09 | Extracellular
matrix |
| 14.9 | 72.7 | 8 | 6 | P50238 | CRIP1 | Cysteine-rich
protein 1 | 0.30±0.06 | Zinc-binding
protein |
| 7.4 | 52.3 | 4 | 5 | Q16527 | CSRP2 | Cysteine and
glycine-rich protein 2 | 0.32±0.06 | Zinc-binding
protein |
| 3.4 | 13.0 | 2 | 5 | P43121 | MCAM | Cell surface
glycoprotein MUC18 | 0.34±0.05 | Cell adhesion |
| 33.5 | 76.1 | 29 | 7 | P55083 | MFAP4 |
Microfibril-associated glycoprotein 4 | 0.35±0.09 | Extracellular
matrix |
| 34.6 | 63.8 | 17 | 7 | P10915 | HAPLN1 | Hyaluronan and
proteoglycan link protein 1 | 0.37±0.06 | Extracellular
matrix |
| 24.9 | 66.3 | 14 | 6 | P24844 | MYL9 | Myosin regulatory
light polypeptide 9 | 0.37±0.12 | Cytoskeletal
protein |
| 14.9 | 31.0 | 9 | 6 | Q13642 | FHL1 | Four and a half LIM
domains protein 1 | 0.37±0.05 | Transcription
factor |
| 12.3 | 27.7 | 7 | 6 | Q06828 | FMOD | Fibromodulin | 0.38±0.09 | Extracellular
matrix |
| 10.5 | 37.0 | 7 | 5 | P60981 | DSTN | Destrin | 0.38±0.03 | Cytoskeletal
protein |
| 102.5 | 98.6 | 126 | 7 | P68871 | HBB | Hemoglobin subunit
β | 0.39±0.07 | Oxygen
transport |
| 5.4 | 24.4 | 3 | 5 | O14558 | HSPB6 | Heat shock protein
β-6 | 0.39±0.05 | Chaperone |
| 13.8 | 61.7 | 8 | 7 | P21291 | CSRP1 | Cysteine and
glycine-rich protein 1 | 0.40±0.10 | Zinc-binding
protein |
| 9.6 | 18.5 | 5 | 5 | Q8WUP2 | FBLIM1 | Filamin-binding LIM
protein 1 | 0.40±0.08 | Cytoskeletal
protein |
| 16.3 | 60.1 | 8 | 6 | P52943 | CRIP2 | Cysteine-rich
protein 2 | 0.40±0.09 | Zinc-binding
protein |
| 42.7 | 95.0 | 31 | 7 | Q01995 | TAGLN | Transgelin | 0.41±0.12 | Cytoskeletal
protein |
| 6.3 | 45.6 | 3 | 7 | P06703 | S100A6 | Protein
S100-A6 | 0.41±0.07 | Calcium-binding
protein |
| 10.0 | 66.9 | 5 | 5 | P00441 | SOD1 | Superoxide
dismutase [Cu-Zn] | 0.41±0.12 | Oxidoreductase |
| 82.4 | 79.2 | 64 | 7 | P08670 | VIM | Vimentin | 0.42±0.11 | Cytoskeletal
protein |
| 135.4 | 53.8 | 83 | 7 | P35580 | MYH10 | Myosin-10 | 0.42±0.09 | Cytoskeletal
protein |
| 5.4 | 36.4 | 4 | 6 | P61981 | YWHAG | 14-3-3 protein
γ | 0.42±0.08 | Adaptor
protein |
| 11.5 | 33.6 | 5 | 7 | O43294 | TGFB1I1 | Transforming growth
factor β-1-induced transcript 1 protein | 0.43±0.09 | Adaptor
protein |
| 19.6 | 25.8 | 12 | 7 | P39060 | COL18A1 | Collagen α-1(XVIII)
chain | 0.43±0.08 | Extracellular
matrix |
| 24.3 | 11.5 | 13 | 7 | P16112 | ACAN | Aggrecan core
protein | 0.43±0.06 | Extracellular
matrix |
| 27.7 | 31.3 | 15 | 7 | Q16853 | AOC3 | Membrane primary
amine oxidase | 0.44±0.06 | Oxidoreductase |
| 23.5 | 91.4 | 15 | 7 | P60660 | MYL6 | Myosin light
polypeptide 6 | 0.44±0.12 | Cytoskeletal
protein |
| 53.7 | 74.7 | 28 | 7 | P07951 | TPM2 | Tropomyosin β
chain | 0.44±0.14 | Cytoskeletal
protein |
| 55.9 | 78.9 | 95 | 7 | P69905 | HBA1 | Hemoglobin subunit
α | 0.44±0.07 | Oxygen
transport |
| 76.1 | 85.1 | 76 | 5 | P62736 | ACTA2 | Actin, aortic
smooth muscle | 0.45±0.16 | Cytoskeletal
protein |
| 8.5 | 26.4 | 4 | 7 | Q6NZI2 | PTRF | Polymerase I and
transcript release factor | 0.45±0.09 | Transcription
factor |
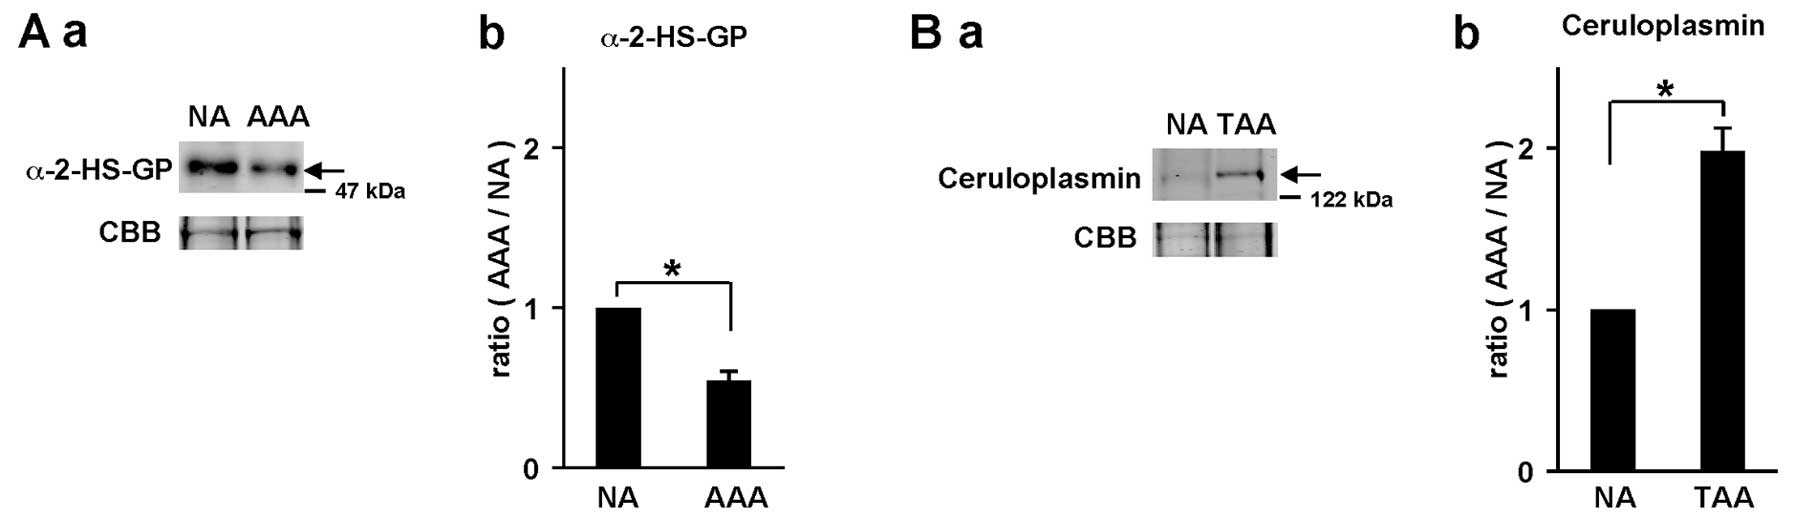
In order to confirm the accuracy of the quantitative
results for the differentially expressed proteins identified, some
proteins with an iTRAQ quantitative ratio were quantified again by
western blot analysis (Fig. 2).
The iTRAQ ratio of α-2-HS-glycoprotein in AAAs compared with that
in adjacent NA tissues in patient #AAA3 was 0.79-fold. On the other
hand, the ratio of α-2-HS-glycoprotein in the AAAs compared with
that in NA tissue (1.0) was determined by band intensity of western
blot analysis and it was 0.55-fold (Fig. 2A). Similarly, the iTRAQ ratio of
ceruloplasmin in TAAs compared with that in adjacent NA tissues in
patient #TAA4 was 2.25-fold, whereas the ratio of ceruloplasmin
based on western blot analysis was 1.98-fold (Fig. 2B). These results indicate that
iTRAQ ratios are almost consistent with the quantitative results by
western blot analysis.
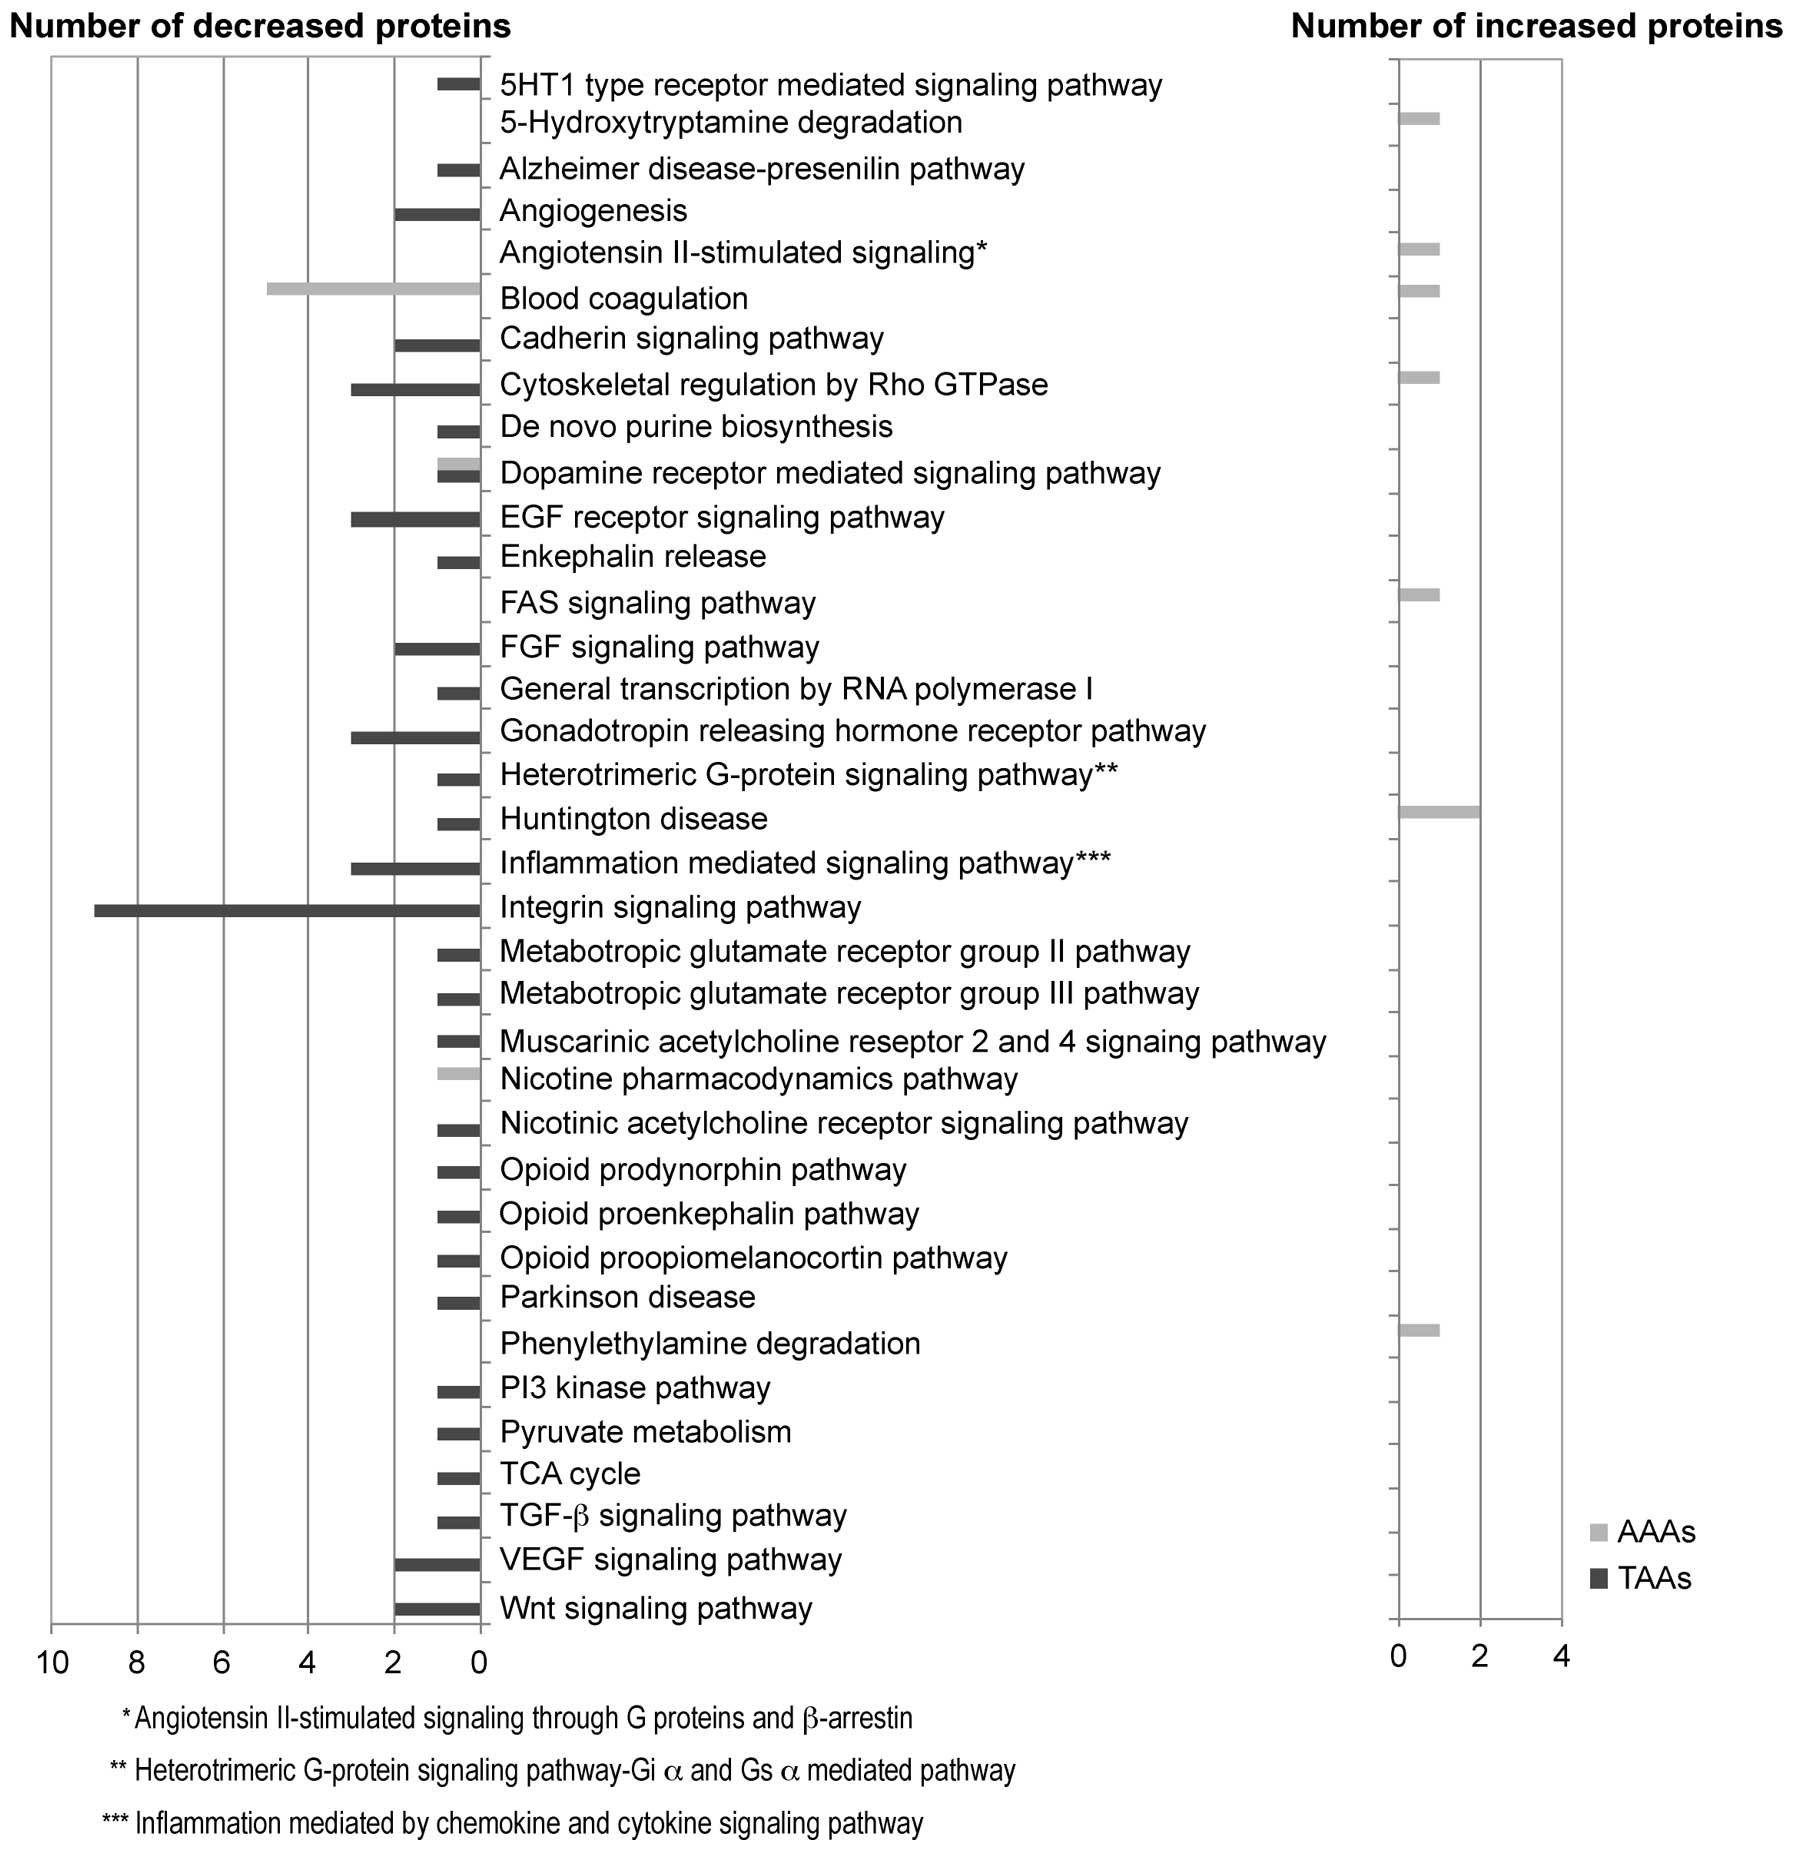
Analysis of proteins unique to AAAs and
TAAs
To disclose distinct molecular alterations that
occurred in AAAs and TAAs, the 55 and 68 proteins unique to AAAs
and TAAs among the 176 AAA proteins and 189 TAA proteins found in
common in at least 5 samples within each of the 7 samples,
respectively, were selected (Fig.
1B). On the other hand, 121 differentially expressed proteins
were identified which were common in the AAA and TAA samples
(Fig. 1B).
We investigated the possible biochemical pathway for
the 55 and 68 proteins unique to AAAs and TAAs by using the PANTHER
pathway system (Fig. 3). As a
result, we found the possible involvement of the blood coagulation
pathway (statistical overrepresentation test in PANTHER,
p=1.53E-06) in AAAs. This pathway included coagulation factor XIII
A chain (iTRAQ ratio, 1.26, AAAs vs. NA tissues), kininogen-1
(0.88), vitamin K-dependent protein S (0.85), antithrombin-III
(0.83), heparin cofactor 2 (0.80) and prothrombin (0.71); the
majority of these proteins were downregulated in the AAA tissues
compared with the adjacent NA tissues. On the other hand, in the
TAAs, we observed the downregulation of the integrin signaling
pathway (statistical overrepresentation test in PANTHER,
p=6.17E-06), including laminin subunit γ-1 (iTRAQ ratio, 0.65, TAAs
vs. NA tissues), integrin-linked protein kinase (ILK) (0.62),
caveolin-1 (0.58), type IV collagen α1 chain (0.56), laminin
subunit β2 (0.56), laminin subunit α5 (0.54), Ras-related protein
R-Ras (0.52), α-actinin-4 (0.51), transforming growth factor
β-1-induced transcript 1 protein (0.43) in the TAA tissues compared
with the adjacent NA tissues. Furthermore, in order to determine
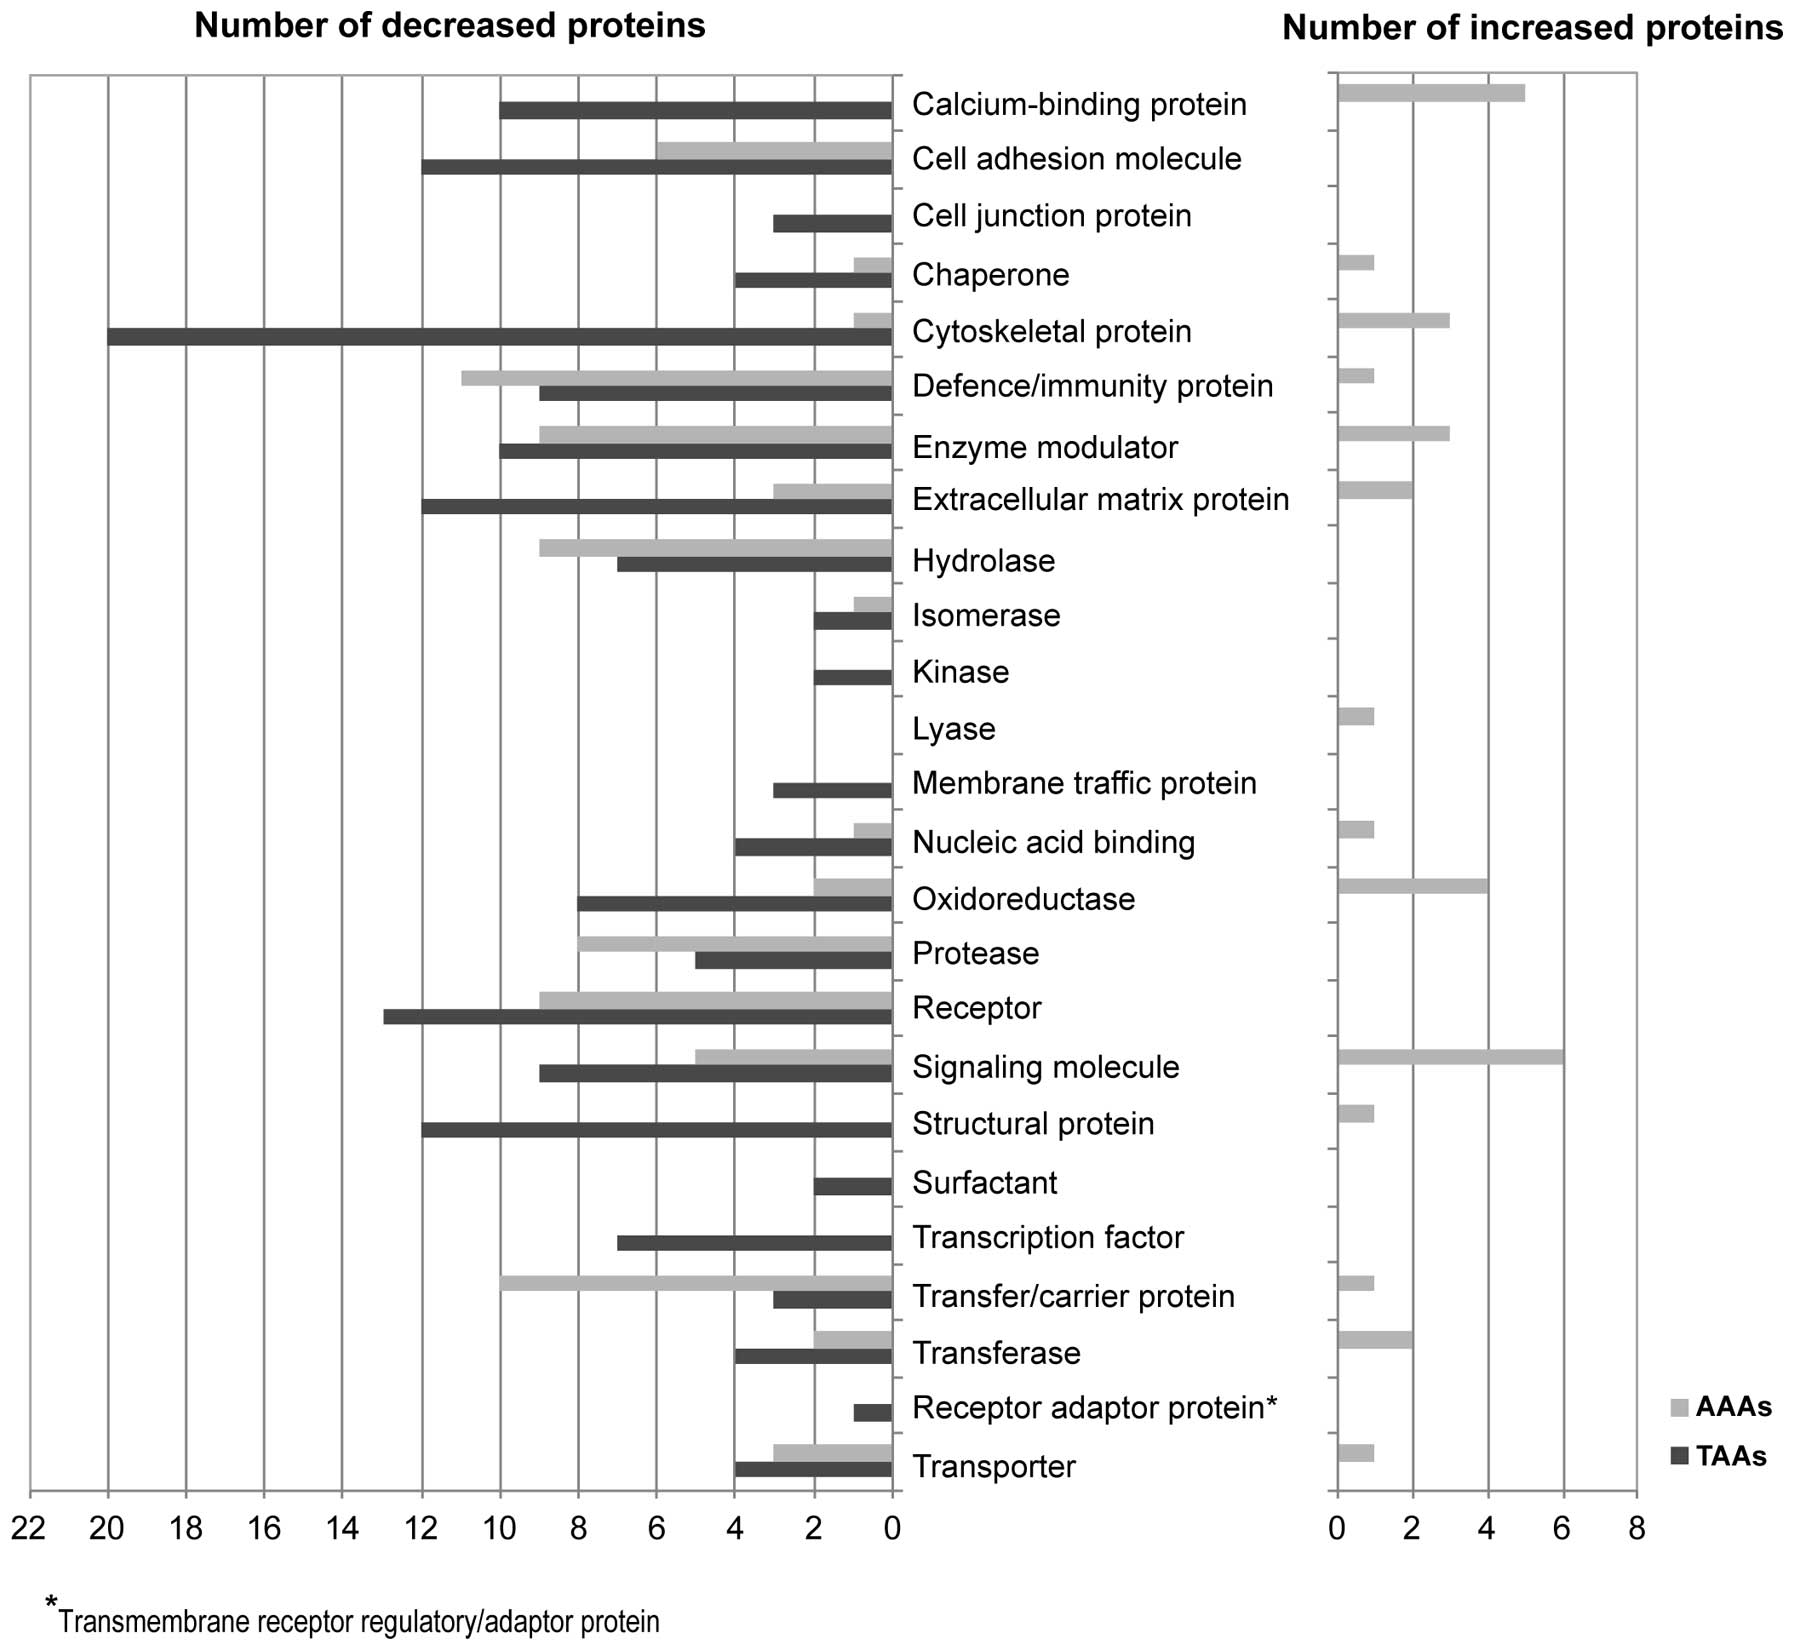
the functional distribution of these unique proteins in the AAAs
and TAAs, we sorted the proteins with the PANTHER protein class
system (Fig. 4). In the AAAs, the
55 unique proteins were significantly classified into
defense/immunity protein (statistical overrepresentation test in
PANTHER, p=5.55E-05), including complement component (p=4.67E-10),
transfer/carrier protein (p=4.83E-06), including apolipoprotein
(p=2.26E-11), enzyme modulator including protease inhibitor
(p=7.56E-07) and serine protease inhibitor (p=6.10E-06) and
protease, including metalloprotease (p=0.0052) and serine protease
(p=0.0053); the majority of these proteins were downregulated in
the AAA tissues compared with the adjacent NA tissues. On the other
hand, in the TAAs, the 68 proteins were significantly classified
into cytoskeletal protein (p=1.21E-08), including actin family
cytoskeletal protein (p=1.29E-14) and non-motor actin binding
protein (p=4.95E-03), cell adhesion molecule (p=6.37E-04),
structural protein (p=1.63E-07), extracellular matrix (ECM) protein
(p=7.56E-05) and calcium-binding protein (p=7.31E-04); the majority
of these proteins were downregulated in the TAAs compared with the
adjacent NA tissues.
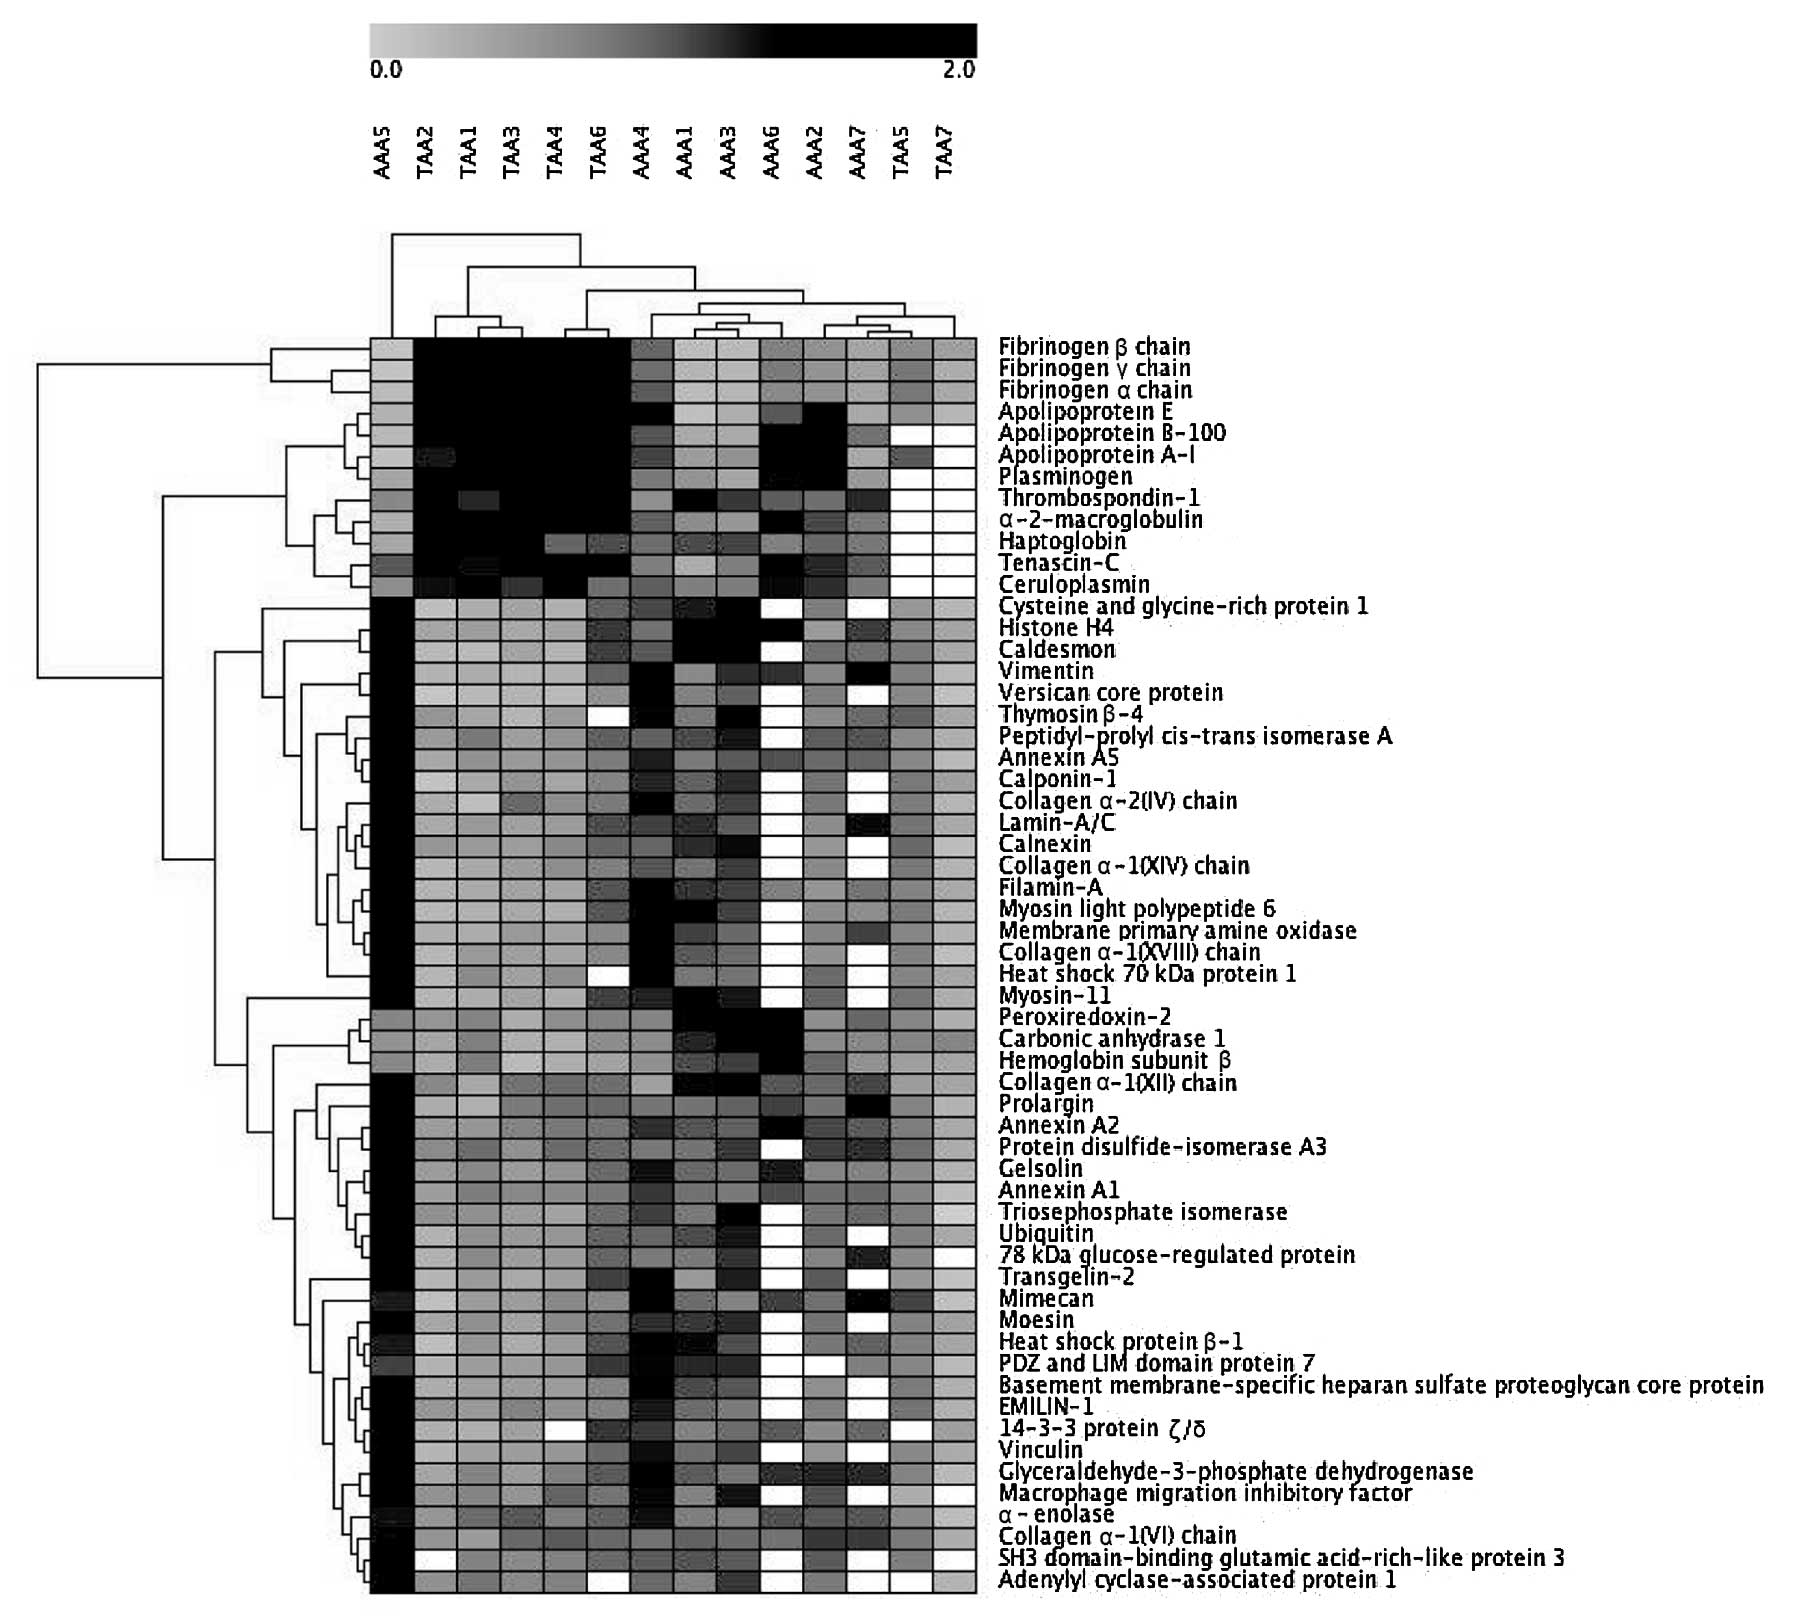
Analysis of 121 differentially expressed
proteins identified which were common in AAAs and TAAs
We performed hierarchical clustering analysis with
Genesis software using the expression patterns of the 121
differentially expressed proteins identified which were common in
at least each of 5 samples within the 7 AAAs and 7 TAAs compared
with the corresponding adjacent NA tissues. Among the 121 proteins,
we examined proteins that showed statistically distinct expression
patterns between the AAAs and TAAs by one-way ANOVA using Genesis
software. Consequently, 58 proteins, including plasminogen (AAAs
vs. TAAs, p=5.21E-04), moesin (p=5.24E-04),
glyceraldehyde-3-phosphate dehydrogenase (p=0.0014),
α-2-macroglobulin (p=0.0029), apolipoprotein B-100 (p=0.0032),
basement membrane-specific heparan sulfate proteoglycan core
protein (p=0.0041) and TNC (p=0.0044) showed significantly distinct
expression patterns between the AAAs and TAAs. Furthermore, the
PANTHER overrepresentation test revealed that some of the 58
proteins were significantly involved in pathways, such as
plasminogen activation cascade [p=4.11E-5; fibrinogen α chain
(iTRAQ ratio, 0.45, AAAs vs. NA tissues; iTRAQ ratio, 3.24, TAAs
vs. NA tissues), fibrinogen β chain (0.43:4.86), fibrinogen γ chain
(0.44:3.89), plasminogen (0.76:2.29)], blood coagulation
[p=1.13E-04; α-2-macroglobulin (0.80:1.64), fibrinogen α chain
(0.45:3.24), fibrinogen β chain (0.43:4.86), fibrinogen γ chain
(0.44:3.89), plasminogen (0.76:2.29)], and integrin signaling
pathway [p=3.80E-04; type XIV collagen α1 chain (1.25:0.48), type
XVIII collagen α1 chain (1.26:0.43), filamin-A (1.19:0.48), type IV
collagen α2 chain (1.33:0.52), type XII collagen α1 chain
(1.15:0.63), vinculin (1.03:0.50), type VI collagen α1 chain
(1.00:0.69)]. In general, protein expression in the blood
coagulation and the plasminogen activation cascade was decreased in
the AAAs, whereas it was increased in the TAAs compared with the
adjacent NA tissues. On the other hand, protein expression in the
integrin signaling pathway was increased in the AAAs, whereas it
was decreased in the TAAs compared with the adjacent NA tissues.
The dendrogam based on the expression patterns of the 58 proteins
demonstrated similar expression patterns of each protein within the
AAA or TAA patient groups, while there were distinct expression
patterns of each protein between the AAA and TAA patient groups
(Fig. 5).
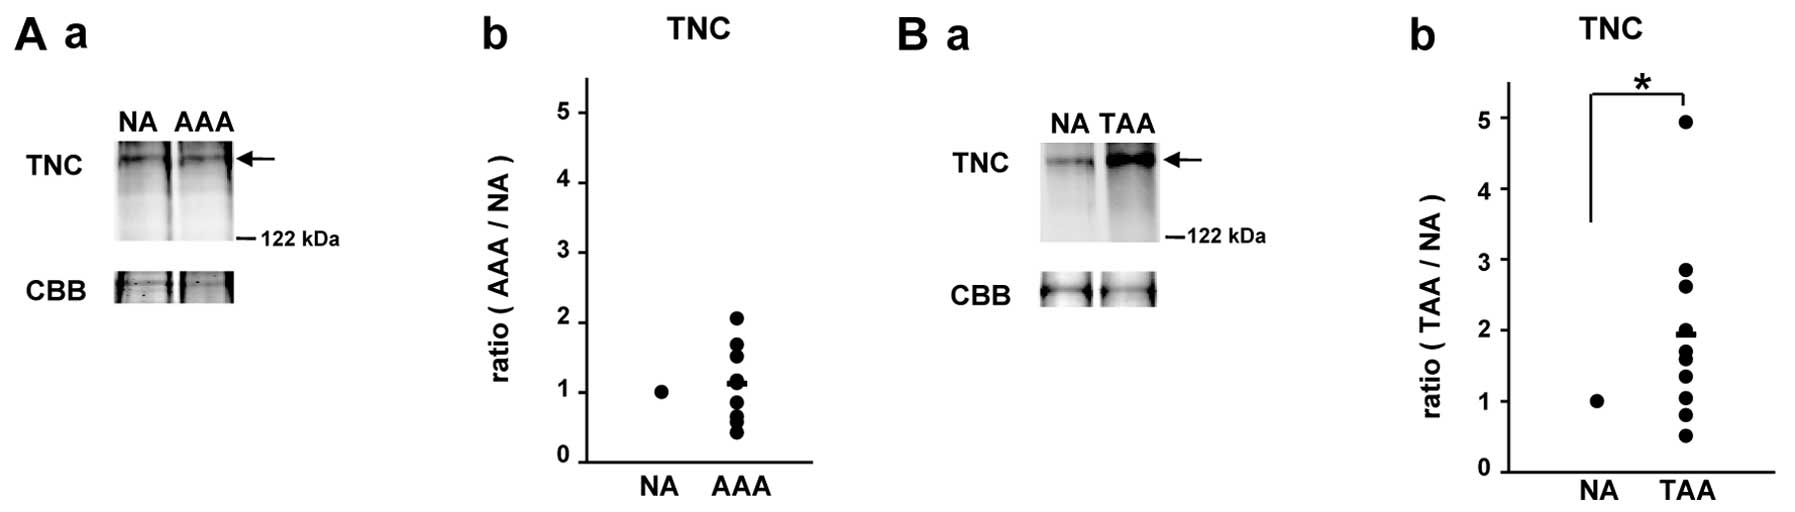
Verification of distinct expression
patterns of TNC between AAAs and TAAs with other aneurysmal samples
by western blot analysis
The matricellular protein, TNC, is upregulated under
pathological conditions, such as myocardial infarction, cardiac
fibrosis, atherosclerosis and aneurysms, often being associated
with tissue injury and inflammation (17). It has been reported that TNC is
upregulated in both AAAs (18,19) and TAAs (20,21). However, in the present study, as
mentioned above, TNC belonged to the 58 proteins which showed
distinct expression patterns in the AAAs and TAAs among the 121
proteins; namely, its iTRAQ ratio was 0.93 in the AAAs (AAAs vs. NA
tissues), whereas the iTRAQ ratio was 1.86 in the TAAs (TAAs vs. NA
tissues). Thus, the expression patterns of TNC in the AAA and TAA
tissues were verified with another 10 AAA and 10 TAA tissues by
western blot analysis compared with those in corresponding adjacent
NA tissues (Fig. 6).
Consequently, we confirmed an increased level of TNC in the TAA
tissues compared with the adjacent NA tissues (Fig. 6B); however, the expression level
of TNC in the AAAs did not differ significantly from that in the
adjacent NA tissues (Fig.
6A).
Discussion
Different features in embryonic origin, vessel
structure and stiffness, immune response, the intercellular
signaling pathway and proteolytic activity between the abdominal
aorta and thoracic aorta contribute to the distinct symptom onsets
and pathological states in AAAs and TAAs (3,22).
The identification of the broad range of proteomic differences
between AAAs and TAAs would be valuable for their diagnosis and
therapy. In this study, using an approach with iTRAQ labeling
followed by nano-LC-MALDI-TOF/TOF-MS/MS analysis, proteins with
differential expression in AAAs and TAAs and their adjacent NA
tissues were examined. Proteomic profiles of AAAs and TAAs were
then compared. Consequently, as distinct pathways activated between
the AAAs and TAAs, we revealed the downregulation of the blood
coagulation and plasminogen activation cascade in the AAAs and
their upregulation in the TAAs, as well as the downregulation of
the integrin signaling pathway in the TAAs and its upregulation in
AAAs.
It is of interest that the proteins with the
greatest decrease and increase in expression in the AAAs (Table III) and TAAs (Table IV), respectively, were fibrinogen
β, γ and α chains. A number of studies have been carried out on the
association of plasma D-dimer (fibrinogen degradation product) with
the presence of AAAs (23–25)
and TAAs (26). However, to the
best of our knowledge, there are only a few studies available on
the finding of increased levels of fibrinogens in aortic aneurymal
tissues (26,27). The increased amounts of
fibrinogens in TAAs are consistent with our previous results for
the expression levels of fibrinogens in CTAs compared with those in
adjacent NA tissues (8). However,
the iTRAQ ratios of fibrinogen β, γ and α chains in CAAs compared
with those in adjacent NA tissues were 1.39, 1.27 and 1.17,
respectively, indicating relatively increased levels of fibrinogens
in CAA tissues (8). The reason
for different levels of fibrinogens in AAA and CAA tissues compared
with the levels in corresponding adjacent NA tissues remains to be
determined. The different levels may be due to the distinct
characteristics of AAAs and CATs. Further analyses are
required.
| Table IIIProteins with decreased expression in
AAA tissues compared with adjacent NA tissues. |
Table III
Proteins with decreased expression in
AAA tissues compared with adjacent NA tissues.
| Unused
ProtScorea | % Coverageb | Peptidesc (95%) |
Reproducibilityd | UniProt no. | Gene symbol | Protein name | iTRAQ ratio average
± SE | Molecular
function |
|---|
| 138.8 | 89.6 | 166 | 7 | P02675 | FGB | Fibrinogen β
chain | 0.43±0.11 | Extracellular
matrix |
| 108.2 | 87.4 | 98 | 7 | P02679 | FGG | Fibrinogen γ
chain | 0.44±0.11 | Extracellular
matrix |
| 136.7 | 61.2 | 106 | 7 | P02671 | FGA | Fibrinogen α
chain | 0.45±0.11 | Extracellular
matrix |
| 8.3 | 13.2 | 3 | 5 | Q86UX7 | FERMT3 | Fermitin family
homolog 3 | 0.63±0.06 | Cell adhesion |
| 4.6 | 11.8 | 2 | 6 | P05155 | SERPING1 | Plasma protease C1
inhibitor | 0.71±0.14 | Serine protease
inhibitor |
| 35.6 | 49.2 | 18 | 7 | P00734 | F2 | Prothrombin | 0.71±0.18 | Serine
protease |
| 6.0 | 6.0 | 3 | 6 | P01031 | C5 | Complement C5 | 0.71±0.22 | Complement
component |
| 8.0 | 23.6 | 4 | 7 | Q96PD5 | PGLYRP2 |
N-acetylmuramoyl-L-alanine amidase | 0.73±0.13 | Hydrolase |
| 9.5 | 9.4 | 5 | 5 | P13671 | C6 | Complement
component C6 | 0.75±0.21 | Complement
component |
| 15.7 | 27.0 | 9 | 7 | P02765 | AHSG |
α-2-HS-glycoprotein | 0.76±0.11 | Extracellular
matrix |
| 35.6 | 42.8 | 19 | 7 | P00747 | PLG | Plasminogen | 0.76±0.17 | Serine
protease |
| 16.0 | 27.2 | 8 | 7 | P04196 | HRG | Histidine-rich
glycoprotein | 0.77±0.12 | Adaptor
protein |
| Table IVProteins with increased expression in
TAA tissues compared with adjacent NA tissues. |
Table IV
Proteins with increased expression in
TAA tissues compared with adjacent NA tissues.
| Unused
ProtScorea | % Coverageb | Peptidesc (95%) |
Reproducibilityd | UniProt no. | Gene symbol | Protein name | iTRAQ ratio average
± SE | Molecular
function |
|---|
| 126.7 | 84.7 | 170 | 7 | P02675 | FGB | Fibrinogen β
chain | 4.86±1.56 | Extracellular
matrix |
| 89.9 | 83.7 | 97 | 7 | P02679 | FGG | Fibrinogen γ
chain | 3.89±1.07 | Extracellular
matrix |
| 111.1 | 67.8 | 100 | 7 | P02671 | FGA | Fibrinogen α
chain | 3.24±0.94 | Extracellular
matrix |
| 255.2 | 40.6 | 130 | 5 | P04114 | APOB | Apolipoprotein
B-100 | 2.44±0.24 | Transporter |
| 45.8 | 48.3 | 23 | 5 | P00747 | PLG | Plasminogen | 2.29±0.27 | Serine
protease |
| 34.7 | 20.2 | 16 | 5 | P24821 | TNC | Tenascin | 1.86±0.21 | Extracellular
matrix |
| 51.8 | 84.9 | 31 | 7 | P02649 | APOE | Apolipoprotein
E | 1.85±0.40 | Transporter |
| 56.9 | 85.4 | 32 | 6 | P02647 | APOA1 | Apolipoprotein
A-I | 1.83±0.27 | Transporter |
| 47.2 | 58.8 | 33 | 7 | P04004 | VTN | Vitronectin | 1.80±0.45 | Extracellular
matrix |
| 58.5 | 33.4 | 29 | 5 | P01023 | A2M |
α-2-macroglobulin | 1.64±0.14 | Signaling
molecule |
| 42.7 | 70.2 | 31 | 5 | P00738 | HP | Haptoglobin | 1.57±0.31 | Hemoglobin
binding |
| 32.5 | 26.3 | 22 | 5 | P07996 | THBS1 |
Thrombospondin-1 | 1.56±0.14 | Extracellular
matrix |
| 56.5 | 43.3 | 30 | 5 | P00450 | CP | Ceruloplasmin | 1.46±0.25 | Transporter |
| 10.0 | 22.3 | 5 | 6 | P07339 | CTSD | Cathepsin D | 1.44±0.22 | Aspartic
protease |
| 16.2 | 30.6 | 7 | 6 | P07585 | DCN | Decorin | 1.42±0.45 | Extracellular
matrix |
| 19.8 | 33.1 | 10 | 7 | P04196 | HRG | Histidine-rich
glycoprotein | 1.38±0.38 | Adaptor
protein |
| 15.8 | 67.4 | 9 | 5 | P02766 | TTR | Transthyretin | 1.35±0.23 | Transporter |
| 35.0 | 57.4 | 21 | 5 | P02749 | APOH | β-2-glycoprotein
1 | 1.34±0.58 | Phospholipid
binding |
In the present study, we observed some proteins in
the integrin signaling pathway with a decreased expression in TAAs,
but with an increased expression in AAAs compared with
corresponding adjacent NA tissues. These results coincide with the
results of our previous study, showing the decreased expression of
the integrin signaling pathway in CTAs and the increased expression
of the pathway in CAAs (8).
Intriguingly, Shen et al (28) demonstrated that mice with targeted
deletion of ILK, one of the crucial molecules in the integrin
signaling pathway, in the VSMCs generate TAAs and the marked
disruption of the structural organization in the arterial tunica
media by aberrant integrin signaling, including abnormal
localizacion of myocardin-related transcription factors (MRTFs), a
reduced amount of F-actin and impaired RhoA activation in
ILK-deficient VSMCs. On the other hand, the increased expression of
integrin αv was actually observed at the site of AAA
rupture (29). Zheng et al
(30) showed that osteopontin
induces autophagy through the activation of the integrin/CD44 and
p38 mitogen-activated protein kinase (MAPK) signaling pathways in
VSMCs, which is associated with the incidence of AAAs.
Didangelos et al (7) reported results of proteomic analysis
of the ECM of human AAAs compared with that of control samples from
patients without connective tissue disorders. They identified 80
ECM proteins with extraction using 0.5 M NaCl extraction buffer and
117 ECM proteins with the extraction using 4 M guanidine buffer,
with the difference in relative protein abundance between AAAs and
controls being determined using spectral counts. Thirty-four
proteins among the 80 proteins and 21 proteins among the 117
proteins were found to be common in the 176 differentially
expressed proteins in AAAs identified in the present study.
Biglycan and type I collagen α1 and α2 chains in AAA tissues were
upregulated by >1.3-fold, whereas versican was downregulated by
<0.77-fold in both their experiments and the present study (AAA
samples vs. control samples).
Recently, we reported that the kallistatin level in
pre-surgical sera of both AAA and TAA patients and the
α-2-macroglobulin level in pre-surgical sera of TAA patients were
increased compared with those in the post-surgical sera of the
corresponding patients (31). In
the present study, kallistatin was not identified as a
differentially expressed protein in both aneurysmal tissues,
whereas α-2-macroglobulin expression was increased in the TAAs
(1.64-fold) compared with that in adjacent normal tissues.
Therefore, these results demonstrated that α-2-macroglobulin was
increased not only in the serum of patients with TAAs but also in
TAA tissues. α-2-macroglobulin plays a role in the inhibition and
clearance of active proteases, including all of the 4 major classes
of endopeptidases in tissue fluids (32). Since MMP activity is high in AAs
and positively correlates with aneurysmal size (33), the upregulation of endogenous MMP
inhibitors, such as α-2-macroglobulin in TAAs may be for the
prevention of further TAA progression.
In the present study, we demonstrate the increased
level of TNC in TAAs, but not in AAAs compared with adjacent normal
tissues. The finding of the increased expression of TNC in TAAs is
consistent with the results of previous studies (20,21). However, our results regarding the
expression of TNC in AAAs are not consistent with those of previous
studies, showing the upregulation of TNC in AAA tissues (18,19,34). The reason for this inconsistency
is not known. However, Kimura et al (19) reported that the expression level
of TNC did not correlate with the AAA diameter in human AAAs. This
suggests that AAA tissues have heterogeneity in pathology.
In conclusion, our data reveal opposite expression
patterns of proteins in the blood coagulation and plasminogen
activation cascade and integrin signaling pathway between AAAs and
TAAs. These distinct alterations of their proteomes may lead to the
difference in the pathology between AAAs and TAAs.
Acknowledgements
We thank Yasuko Sonoyama for sample collections.
This study was supported in part by Grants-in-Aid for Scientific
Research (22590063 to K.M.) from the Ministry of Education,
Culture, Sports, Science and Technology of Japan.
References
|
1
|
Guo DC, Papke CL, He R and Milewicz DM:
Pathogenesis of thoracic and abdominal aortic aneurysms. Ann NY
Acad Sci. 1085:339–352. 2006. View Article : Google Scholar : PubMed/NCBI
|
|
2
|
Kuivaniemi H, Platsoucas CD and Tilson MD
III: Aortic aneurysms: an immune disease with a strong genetic
component. Circulation. 117:242–252. 2008. View Article : Google Scholar : PubMed/NCBI
|
|
3
|
Ruddy JM, Jones JA, Spinale FG and
Ikonomidis JS: Regional heterogeneity within the aorta: relevance
to aneurysm disease. J Thorac Cardiovasc Surg. 136:1123–1130. 2008.
View Article : Google Scholar : PubMed/NCBI
|
|
4
|
Henderson EL, Geng YJ, Sukhova GK,
Whittemore AD, Knox J and Libby P: Death of smooth muscle cells and
expression of mediators of apoptosis by T lymphocytes in human
abdominal aortic aneurysms. Circulation. 99:96–104. 1999.
View Article : Google Scholar : PubMed/NCBI
|
|
5
|
Tang PC, Yakimov AO, Teesdale MA, et al:
Transmural inflammation by interferon-gamma-producing T cells
correlates with outward vascular remodeling and intimal expansion
of ascending thoracic aortic aneurysms. FASEB J. 19:1528–1530.
2005.
|
|
6
|
Absi TS, Sundt TM III, Tung WS, et al:
Altered patterns of gene expression distinguishing ascending aortic
aneurysms from abdominal aortic aneurysms: complementary DNA
expression profiling in the molecular characterization of aortic
disease. J Thorac Cardiovasc Surg. 126:344–357. 2003. View Article : Google Scholar
|
|
7
|
Didangelos A, Yin X, Mandal K, et al:
Extracellular matrix composition and remodeling in human abdominal
aortic aneurysms: a proteomics approach. Mol Cell Proteomics.
10:M111.008128. 2011. View Article : Google Scholar : PubMed/NCBI
|
|
8
|
Matsumoto K, Maniwa T, Tanaka T, Satoh K,
Okunishi H and Oda T: Proteomic analysis of calcified abdominal and
thoracic aortic aneurysms. Int J Mol Med. 30:417–429.
2012.PubMed/NCBI
|
|
9
|
Matsumoto K, Satoh K, Maniwa T, Araki A,
Maruyama R and Oda T: Noticeable decreased expression of tenascin-X
in calcific aortic valves. Connect Tissue Res. 53:460–468. 2012.
View Article : Google Scholar : PubMed/NCBI
|
|
10
|
Ross PL, Huang YN, Marchese JN, et al:
Multiplexed protein quantitation in Saccharomyces cerevisiae
using amine-reactive isobaric tagging reagents. Mol Cell
Proteomics. 3:1154–1169. 2004.
|
|
11
|
Matsumoto K: Phosphorylation of
extracellular matrix tenascin-X detected by differential mass
tagging followed by nanoLC-MALDI-TOF/TOF-MS/MS using ProteinPilot
software. Connect Tissue Res. 53:106–116. 2012. View Article : Google Scholar : PubMed/NCBI
|
|
12
|
Shilov IV, Seymour SL, Patel AA, et al:
The Paragon Algorithm, a next generation search engine that uses
sequence temperature values and feature probabilities to identify
peptides from tandem mass spectra. Mol Cell Proteomics.
6:1638–1655. 2007. View Article : Google Scholar : PubMed/NCBI
|
|
13
|
Mi H, Muruganujan A and Thomas PD: PANTHER
in 2013: modeling the evolution of gene function, and other gene
attributes, in the context of phylogenetic trees. Nucleic Acids
Res. 41:D377–D386. 2013. View Article : Google Scholar : PubMed/NCBI
|
|
14
|
Sturn A, Quackenbush J and Trajanoski Z:
Genesis: cluster analysis of microarray data. Bioinformatics.
18:207–208. 2002. View Article : Google Scholar : PubMed/NCBI
|
|
15
|
Hu HD, Ye F, Zhang DZ, Hu P, Ren H and Li
SL: iTRAQ quantitative analysis of multidrug resistance mechanisms
in human gastric cancer cells. J Biomed Biotechnol.
2010:5713432010.PubMed/NCBI
|
|
16
|
Magharious M, D’Onofrio PM, Hollander A,
Zhu P, Chen J and Koeberle PD: Quantitative iTRAQ analysis of
retinal ganglion cell degeneration after optic nerve crush. J
Proteome Res. 10:3344–3362. 2011. View Article : Google Scholar : PubMed/NCBI
|
|
17
|
Imanaka-Yoshida K: Tenascin-C in
cardiovascular tissue remodeling: from development to inflammation
and repair. Circ J. 76:2513–2520. 2012. View Article : Google Scholar : PubMed/NCBI
|
|
18
|
Satta J, Soini Y, Pöllänen R, Pääkkö P and
Juvonen T: Tenascin expression is associated with a chronic
inflammatory process in abdominal aortic aneurysms. J Vasc Surg.
26:670–675. 1997. View Article : Google Scholar : PubMed/NCBI
|
|
19
|
Kimura T, Yoshimura K, Aoki H, et al:
Tenascin-C is expressed in abdominal aortic aneurysm tissue with an
active degradation process. Pathol Int. 61:559–564. 2011.
View Article : Google Scholar : PubMed/NCBI
|
|
20
|
Majumdar R, Miller DV, Ballman KV, et al:
Elevated expressions of osteopontin and tenascin C in ascending
aortic aneurysms are associated with trileaflet aortic valves as
compared with bicuspid aortic valves. Cardiovasc Pathol.
16:144–150. 2007. View Article : Google Scholar : PubMed/NCBI
|
|
21
|
Trescher K, Thometich B, Demyanets S, et
al: Type A dissection and chronic dilatation: tenascin-C as a key
factor in destabilization of the aortic wall. Interact Cardiovasc
Thorac Surg. 17:365–370. 2013. View Article : Google Scholar : PubMed/NCBI
|
|
22
|
Isselbacher EM: Thoracic and abdominal
aortic aneurysms. Circulation. 111:816–828. 2005. View Article : Google Scholar : PubMed/NCBI
|
|
23
|
Parry DJ, Al-Barjas HS, Chappell L, Rashid
T, Ariëns RA and Scott DJ: Haemostatic and fibrinolytic factors in
men with a small abdominal aortic aneurysm. Br J Surg. 96:870–877.
2009. View
Article : Google Scholar : PubMed/NCBI
|
|
24
|
Takagi H, Manabe H, Kawai N, Goto S and
Umemoto T: Plasma fibrinogen and D-dimer concentrations are
associated with the presence of abdominal aortic aneurysm: a
systematic review and meta-analysis. Eur J Vasc Endovasc Surg.
38:273–277. 2009. View Article : Google Scholar : PubMed/NCBI
|
|
25
|
Golledge J, Muller R, Clancy P, McCann M
and Norman PE: Evaluation of the diagnostic and prognostic value of
plasma D-dimer for abdominal aortic aneurysm. Eur Heart J.
32:354–364. 2011. View Article : Google Scholar : PubMed/NCBI
|
|
26
|
Yuan SM, Shi YH, Wang JJ, Lü FQ and Gao S:
Elevated plasma D-dimer and hypersensitive C-reactive protein
levels may indicate aortic disorders. Rev Bras Cir Cardiovasc.
26:573–581. 2011.PubMed/NCBI
|
|
27
|
Ando T, Nagai K, Chikada M, et al:
Proteomic analyses of aortic wall in patients with abdominal aortic
aneurysm. J Cardiovasc Surg (Torino). 52:545–555. 2011.PubMed/NCBI
|
|
28
|
Shen D, Li J, Lepore JJ, Anderson TJ, et
al: Aortic aneurysm generation in mice with targeted deletion of
integrin-linked kinase in vascular smooth muscle cells. Circ Res.
109:616–628. 2011. View Article : Google Scholar : PubMed/NCBI
|
|
29
|
Choke E, Cockerill GW, Dawson J, et al:
Increased angiogenesis at the site of abdominal aortic aneurysm
rupture. Ann NY Acad Sci. 1085:315–319. 2006. View Article : Google Scholar : PubMed/NCBI
|
|
30
|
Zheng YH, Tian C, Meng Y, et al:
Osteopontin stimulates autophagy via integrin/CD44 and p38 MAPK
signaling pathways in vascular smooth muscle cells. J Cell Physiol.
227:127–135. 2012. View Article : Google Scholar : PubMed/NCBI
|
|
31
|
Satoh K, Maniwa T, Oda T and Matsumoto K:
Proteomic profiling for the identification of serum diagnostic
biomarkers for abdominal and thoracic aortic aneurysms. Proteome
Sci. 11:272013. View Article : Google Scholar : PubMed/NCBI
|
|
32
|
Armstrong PB and Quigley JP:
Alpha2-macroglobulin: an evolutionarily conserved arm of the innate
immune system. Dev Comp Immunol. 23:375–390. 1999. View Article : Google Scholar : PubMed/NCBI
|
|
33
|
Zarins CK, Runyon-Hass A, Zatina MA, Lu CT
and Glagov S: Increased collagenase activity in early aneurysmal
dilatation. J Vasc Surg. 3:238–248. 1986. View Article : Google Scholar : PubMed/NCBI
|
|
34
|
Paik DC, Fu C, Bhattacharya J and Tilson
MD: Ongoing angiogenesis in blood vessels of the abdominal aortic
aneurysm. Exp Mol Med. 36:524–533. 2004. View Article : Google Scholar : PubMed/NCBI
|