Introduction
MicroRNAs (miRNAs or miRs) are small endogenous RNAs
that modulate gene expression by targeting the 3′ untranslated
regions (3′ UTRs) of mRNAs to inhibit translation or promote mRNA
degradation (1,2). In recent years, the miR-29 family
has been implicated in the fibrosis of multiple organs (3). Spontaneously hypertensive rats
(SHRs) are an ideal animal model of hypertension. The kidneys of
adult SHRs express high levels of extracellular matrix (ECM)
proteins, α-smooth muscle actin (α-SMA) and matrix
metalloproteinases (MMPs) than age-matched Wistar-Kyoto (WKY) rats
(4). This indicates that the
kidneys of adult SHRs have already developed fibrosis.
Angiotensin II (Ang II), the main peptide of the
renin-angiotensin-aldosterone system (RAAS), plays an important
role in the occurrence and development of hypertension, as well as
in epithelial-mesenchymal transition (EMT), which is a crucial step
in the development of renal fibrosis. In the kidneys of young SHRs,
the levels of Ang II, as well as those of its receptor are
significantly higher than those in WKY rats (5,6).
Ang II increases the expression and the synthesis of ECM proteins,
including multiple collagens and fibrillins (7). In the present study, we aimed to
determine whether miR-29b is the downstream gene of Ang II and to
elucidate its role in Ang II-induced EMT.
Materials and methods
Rats and measurement of blood
pressure
Male (15 weeks old) SHRs and age-matched WKY rats
were acquired from the Chinese Academy of Sciences, Shanghai,
China. They were housed under standardized conditions with
controlled temperature (20–26°C) and humidity (40–70%) and exposed
to a 12-h light/dark cycle. Systolic blood pressure (SBP) was
measured by the tail-cuff method using a PowerLab data acquisition
and analysis system (ADInstruments Inc., Sydney, Australia) under
slightly restrained and quiet conditions for 5 days prior to the
experiments. The average of 3 pressure readings was recorded. The
animal study was approved by the Animal Welfare Committee of
Wenzhou Medical University following state and institutional
regulations.
RT-qPCR analysis of miR-29b expression in
the renal cortex
Total RNA was extracted from the renal cortex of
SHRs and WKY rats using TRIzol reagent (Invitrogen, Carlsbad, CA,
USA). The purity of the total RNA was determined using a
spectrophotometer (DU800; Beckman Coulter, Miami, FL, USA) and its
quality was determined by formaldehyde denaturation gel
electrophoresis. The miRNAs were isolated and purified using the
miRNA isolation kit (Ambion). The reverse transcription of the
miRNAs was performed using the miScription Reverse Transcription
kit (Qiagen, Valencia, CA, USA) according to the manufacturer’s
recommendations. The miRNA specific real-time quantitative
polymerase chain reaction (RT-qPCR) primers were used in RT-qPCR
together with the miScript Universal Primer which was included in
the kit. The sequence of the rno-miR-29b specific primer was
5′-TAGCACCATTTGAAATCAGTGTT-3′, and that of the U6 primer was
5′-CAAGGATGACACGCAAATTCG-3′. The PCR reaction was performed using
the ABI 7500 Fast Real-Time PCR System (Applied Biosystems,
Bedford, MA, USA). The amplification program was 95°C for 15 min
and then 40 cycles consisting of 95°C for 10 sec and 60°C for 35
sec. The relative amount of miR-29b was normalized to that of the
U6 RNA. The ABI Prism 7900HT Sequence Detection System (Applied
Biosystems, Foster City, CA, USA) was used to analyze the data, and
the ΔΔCT method was used to calculate the relative expression of
the sample gene. The relative quantification (RQ) of gene
expression was analyzed using the 2−ΔΔCT method, as
previously described (8): RQ =
2−ΔΔCT (CT indicates the cycles required by the
fluorescence signal intensity to reach the threshold value in the
PCR amplification process, ΔCTsample =
CTsample - CT U6sample, ΔCTcontrol
= CTcontrol - CT U6control, ΔΔCT =
ΔCTsample - ΔCTcontrol). The experiment was
repeated 3 times.
Cell line
The renal tubular epithelial cells line (NRK-52E)
was obtained from the Cell Bank of the Chinese Academy of Sciences.
The NRK-52E cells were cultured in Dulbecco’s modified Eagle’s
medium (DMEM) (low glucose; Gibco-BRL, Gaithersburg, MD, USA)
containing 5% fetal bovine serum (FBS; Gibco-BRL) and incubated in
a humidified atmosphere of 95% O2, 5% CO2 at
37°C in a CO2 incubator. When the cells grew to 90%
confluency, they were then harvested by a brief exposure to 0.05%
trypsin-EDTA (Gibco-BRL) and passaged every 3 days.
Treatment with Ang II
The NRK-52E cells were cultured into 6-well plates
at the density of 1×10⁵ cells/well. They were then
divided into 2 groups: the Ang II group (treatment with
10−7 M Ang II) and the blank control (BC) group (without
extra treatment). The following experiments were carried out after
the cells were cultured at 37°C in an incubator containing 5%
CO2 for 24 or 48 h.
RT-qPCR analysis of miR-29b expression in
the Ang II and blank control group
Total RNA was extracted using TRIzol reagent
(Invitrogen). The purity and quality of the total RNA were
determined as described above. The microRNA isolation kit (Ambion)
was used to detach small molecular RNA less than 100 nt, and the
miScript Reverse Transcription kit (Qiagen) was used to synthesize
the cDNA through reverse transcription. The PCR conditions and the
method of data analysis were as described above. The experiment was
repeated 3 times.
Synthesis of miR-29b mimics and miR-29b
inhibitor
The positive-sense strand of miR-29b mimics
(Sigma-Aldrich, St. Louis, MO, USA) was as follows:
5′-UAGCACCAUUUGA AAUCAGUGUU-3′ and its antisense strand was
5′-CACUG AUUUCAAAUGGUGCUAUU-3′, having no homology with the rat
genome. The positive-sense strand of the miR-29b inhibitor
(Sigma-Aldrich) was as follows: 5′-AACACUGA UUUCAAAUGGUGCUA-3′ and
its antisense strand was 5′-CAGUACUUUUGUGUAGUACAA-3′, having no
homology with the rat genome.
Flow cytometry for the assessment of the
transfection efficiency
A total of 5 μl FAM-NC miRNA/5 μl Lipofectamine™
2000 (Invitrogen) was transfected into the NRK-52E cells. The
transfection efficiency was assessed using a flow cytometer
(Becton-Dickinson, San Jose, CA, USA) 24 h following
transfection.
Transfection with miR-29b inhibitor and
miR-29b mimics
miR-29b was either downregulated or upregulated in
the NRK-52E cells by transfection with miR-29b inhibitor or miR-29b
mimics, respectively. A single-cell suspension was prepared and the
cells were cultured in 6-well plates at the density of
1×10⁵ cells/well 24 h prior to transfection. The NRK-52E
cells were transfected using Lipofectamine 2000 (Invitrogen)
according to the manufacturer’s instructions. For the
downregulation, the cells were divided into 3 groups:
downregulation (DR) group (transfection with miR-29b inhibitor),
negative control (NC) group (transfection with miRNA synthesized
randomly) and the blank control (BC) group (no transfection). For
the upregulation, the cells were divided into 4 groups: the
upregulation (UR) group (transfection with miR-29b and treatment
with 10−7 M Ang II 24 h following transfection), the
negative control-Ang II (NCAng II) group
(transfection with miRNA synthesized randomly and treatment with
10−7 M Ang II 24 h following transfection), the Ang II
group (treatment with 10−7 M Ang II) and the blank
control (BC) group. The following experiments were carried out
after the cells were cultured at 37°C in an incubator containing 5%
CO2 for 24 or 48 h.
RT-qPCR analysis of miR-29b, transforming
growth factor (TGF)-β, α-SMA and collagen (Col) I expression
following transfection
Total RNA was extracted through the one-step method
with TRIzol reagent (Invitrogen) 24 h after transfection and the
cells were cultured until they reached 70–80% confluence. The
purity and quality of the total RNA were determined as described
above. The methods and steps of reverse transcription, PCR
amplification and data analysis for miR-29b were as described
above. The RevertAid™ First Strand cDNA Synthesis kit (Thermo
Fisher Scientific Inc., Waltham, MA, USA) was adopted to synthesize
cDNA through reverse transcription. The RT-qPCR primers
(synthesized by Invitrogen) are presented in Table I. The PCR reaction was performed
using the ABI 7500 Fast Real-Time PCR System. The relative amount
of each mRNA was normalized to that of β-actin using the
2−ΔCT method. The amplification program was 95°C for 10
min and then 40 cycles consisting of 95°C for 15 sec and 60°C for
60 sec. The relative amount of each mRNA was normalized to that of
β-actin. The ABI Prism 7900HT Sequence Detection System (SDS 2.2.2
software) was used to analyze the data, and ΔΔCT method was used to
calculate the relative expression of the sample gene. The relative
quantification (RQ) of gene expression was analyzed by the
2−ΔΔCT method as follows: RQ = 2−ΔΔCT
(ΔCTsample = CTsample - CTβ-actin
sample, ΔCTcontrol = CTcontrol -
CTβ-actin control, ΔΔCT = ΔCTsample -
ΔCTcontrol). The experiment was repeated 3 times.
 | Table IPrimers used for RT-qPCR. |
Table I
Primers used for RT-qPCR.
| mRNA | Primer
sequences |
|---|
| α-SMA | Forward:
CTTCTATAACGAGCTTCGC
Reverse: TCCAGAGTCCAGCACAAT |
| TGF-β | Forward:
AGGCGGTGCTCGCTTTGT
Reverse: GATTGCGTTGTTGCGGTCC |
| Col I | Forward:
ACTCAGCCCTCTGTGCCT
Reverse: CCTTCGCTTCCATACTCG |
| MMP-2 | Forward:
AGCTCCCGGAAAAGATTGAT
Reverse: TCCAGTTAAAGGCAGCGTCT |
| β-actin | Forward:
GAGGGAAATCGTGCGTGAC
Reverse: AGGAAGGAAGGCTGGAAG |
Western blot analysis of the protein
expression of TGF-β, α-SMA and Col I following transfection
Forty-eight hours after transfection, the cells were
washed twice with ice-cold PBS and then lysed in 200 μl of ice-cold
lysis buffer (RIPA:PMSF, 99:1; Sigma). The cells lysates were lysed
further by ultrasound. The lysates were then centrifuged at 15,000
× g for 15 min at 4°C, and the supernatants were collected and
stored at −80°C. The protein concentration was determined by BCA
protein assay (Beyotime, Jiansu, China). The lysates (30 μg of
protein) were separated on 10% polyacrylamide gels using SDS-PAGE
and transferred onto nitrocellulose (NC) membranes. After
transferring, the membranes were blocked for 2 h at 4°C with 5%
skimmed milk, incubated overnight at 4°C with each primary antibody
(rabbit anti-α-SMA antibody 1:500 dilution; rabbit anti-TGF-β
antibody 1:300 and rabbit anti-Col I antibody 1:500 dilution;
Abcam, Bristol, UK), washed 3 times in TBST buffer, incubated with
secondary antibody [at 1:4,000 dilution, goat anti-rabbit IgG (H+L)
IRDye® 800CW; LI-COR Biosciences, Lincoln, NE, USA] for
2 h at room temperature and washed 3 times in TBST buffer. The
blots were analyzed using the Odyssey Infrared Imaging System
(Li-COR Biosciences). The relative amount of protein on each blot
was normalized to that of β-actin, and the semi-quantitative
analysis of the blots was carried out using the AlphaEaseFC Imaging
System (Alpha Innotch, San Leandro, CA, USA). The experiment was
repeated at least 3 times.
Analysis of SMA and Col I expression by
immunofluorescence staining
The NRK-52E cells were fixed in 4% paraformaldehyde
solution, permeabilized with 0.5% Triton X-100 for 10 min, blocked
for 45 min with 5% serum at room temperature, incubated overnight
at 4°C with primary antibodies (rabbit anti-α-SMA antibody 1:200
dilution; rabbit anti-Col I antibody 1:100 dilution; Abcam), washed
3 times in PBS, incubated with DyLight 549 conjugated donkey
anti-rabbit antibodies (1:500; Jackson ImmunoResearch Laboratories
West Grove, PA, USA) at 37°C for 1 h and washed 4 times in PBS. The
cells were then stained with 4′,6-diamidino-2-phenylindole to
visualize the nuclear content. Fluorescence images were acquired
using a laser scanning confocal microscope (Carl Zeiss, Jena,
Germany).
Statistical analysis
The data were analyzed using SPSS 18.0 software. All
experiments were repeated 3 times and the results are presented as
the means ± SE. Differneces between multiple groups were analyzed
by one-way ANOVA followed by Tukey’s post hoc comparisons.
Differences were considered statistically significant at
P<0.05.
Results
Blood pressure measurement
The average SBP of the SHRs and WKY rats was
191.3±16.6 and 121.8±14.7 mmHg, respectively, and the difference
between them was statistically significant (P<0.05).
Differential expression of miR-29b in the
renal cortex between the SHRs and WKY rats
RT-qPCR revealed that the expression of miR-29b in
the renal cortex of the SHRs (0.76±0.01) was significantly lower
than that of the WKY rats (1.00±0.00) (P<0.05).
Ang II downregulates miR-29b
expression
The expression of miR-29b in the NRK-52E cells was
confirmed by RT-qPCR following treatment with 10−7 M Ang
II. The expression of miR-29b in the Ang II group (0.56±0.06) was
significantly downregulated compared with that of the blank control
(BC) group (1.00±0.00).
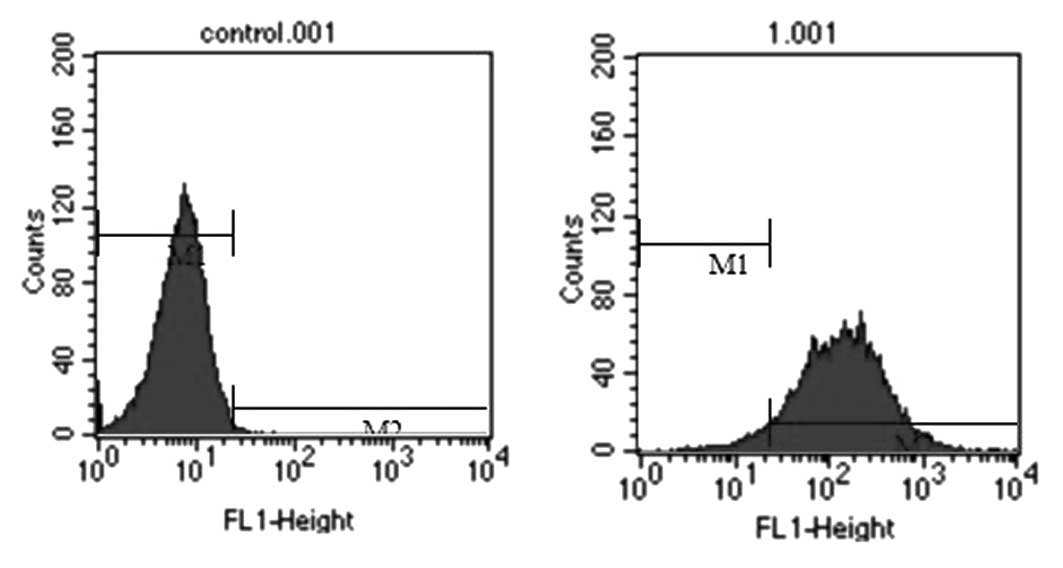
Transfection with miR-29b inhibitor
upregulates the expression levels of TGF-β, α-SMA and Col I
To further examine the function of miR-29b, the
NRK-52E cells were transfected with miR-29b inhibitor. The
transfection efficiency was determined by flow cytometry 24 h after
5 μl FAM-NC miRNA/5 μl Lipofectamine 2000 were transfected into the
NRK-52E cells. The results of flow cytometry revealed that the
transfection efficiency of the NRK-52E cells was 95.14% (Fig. 1).
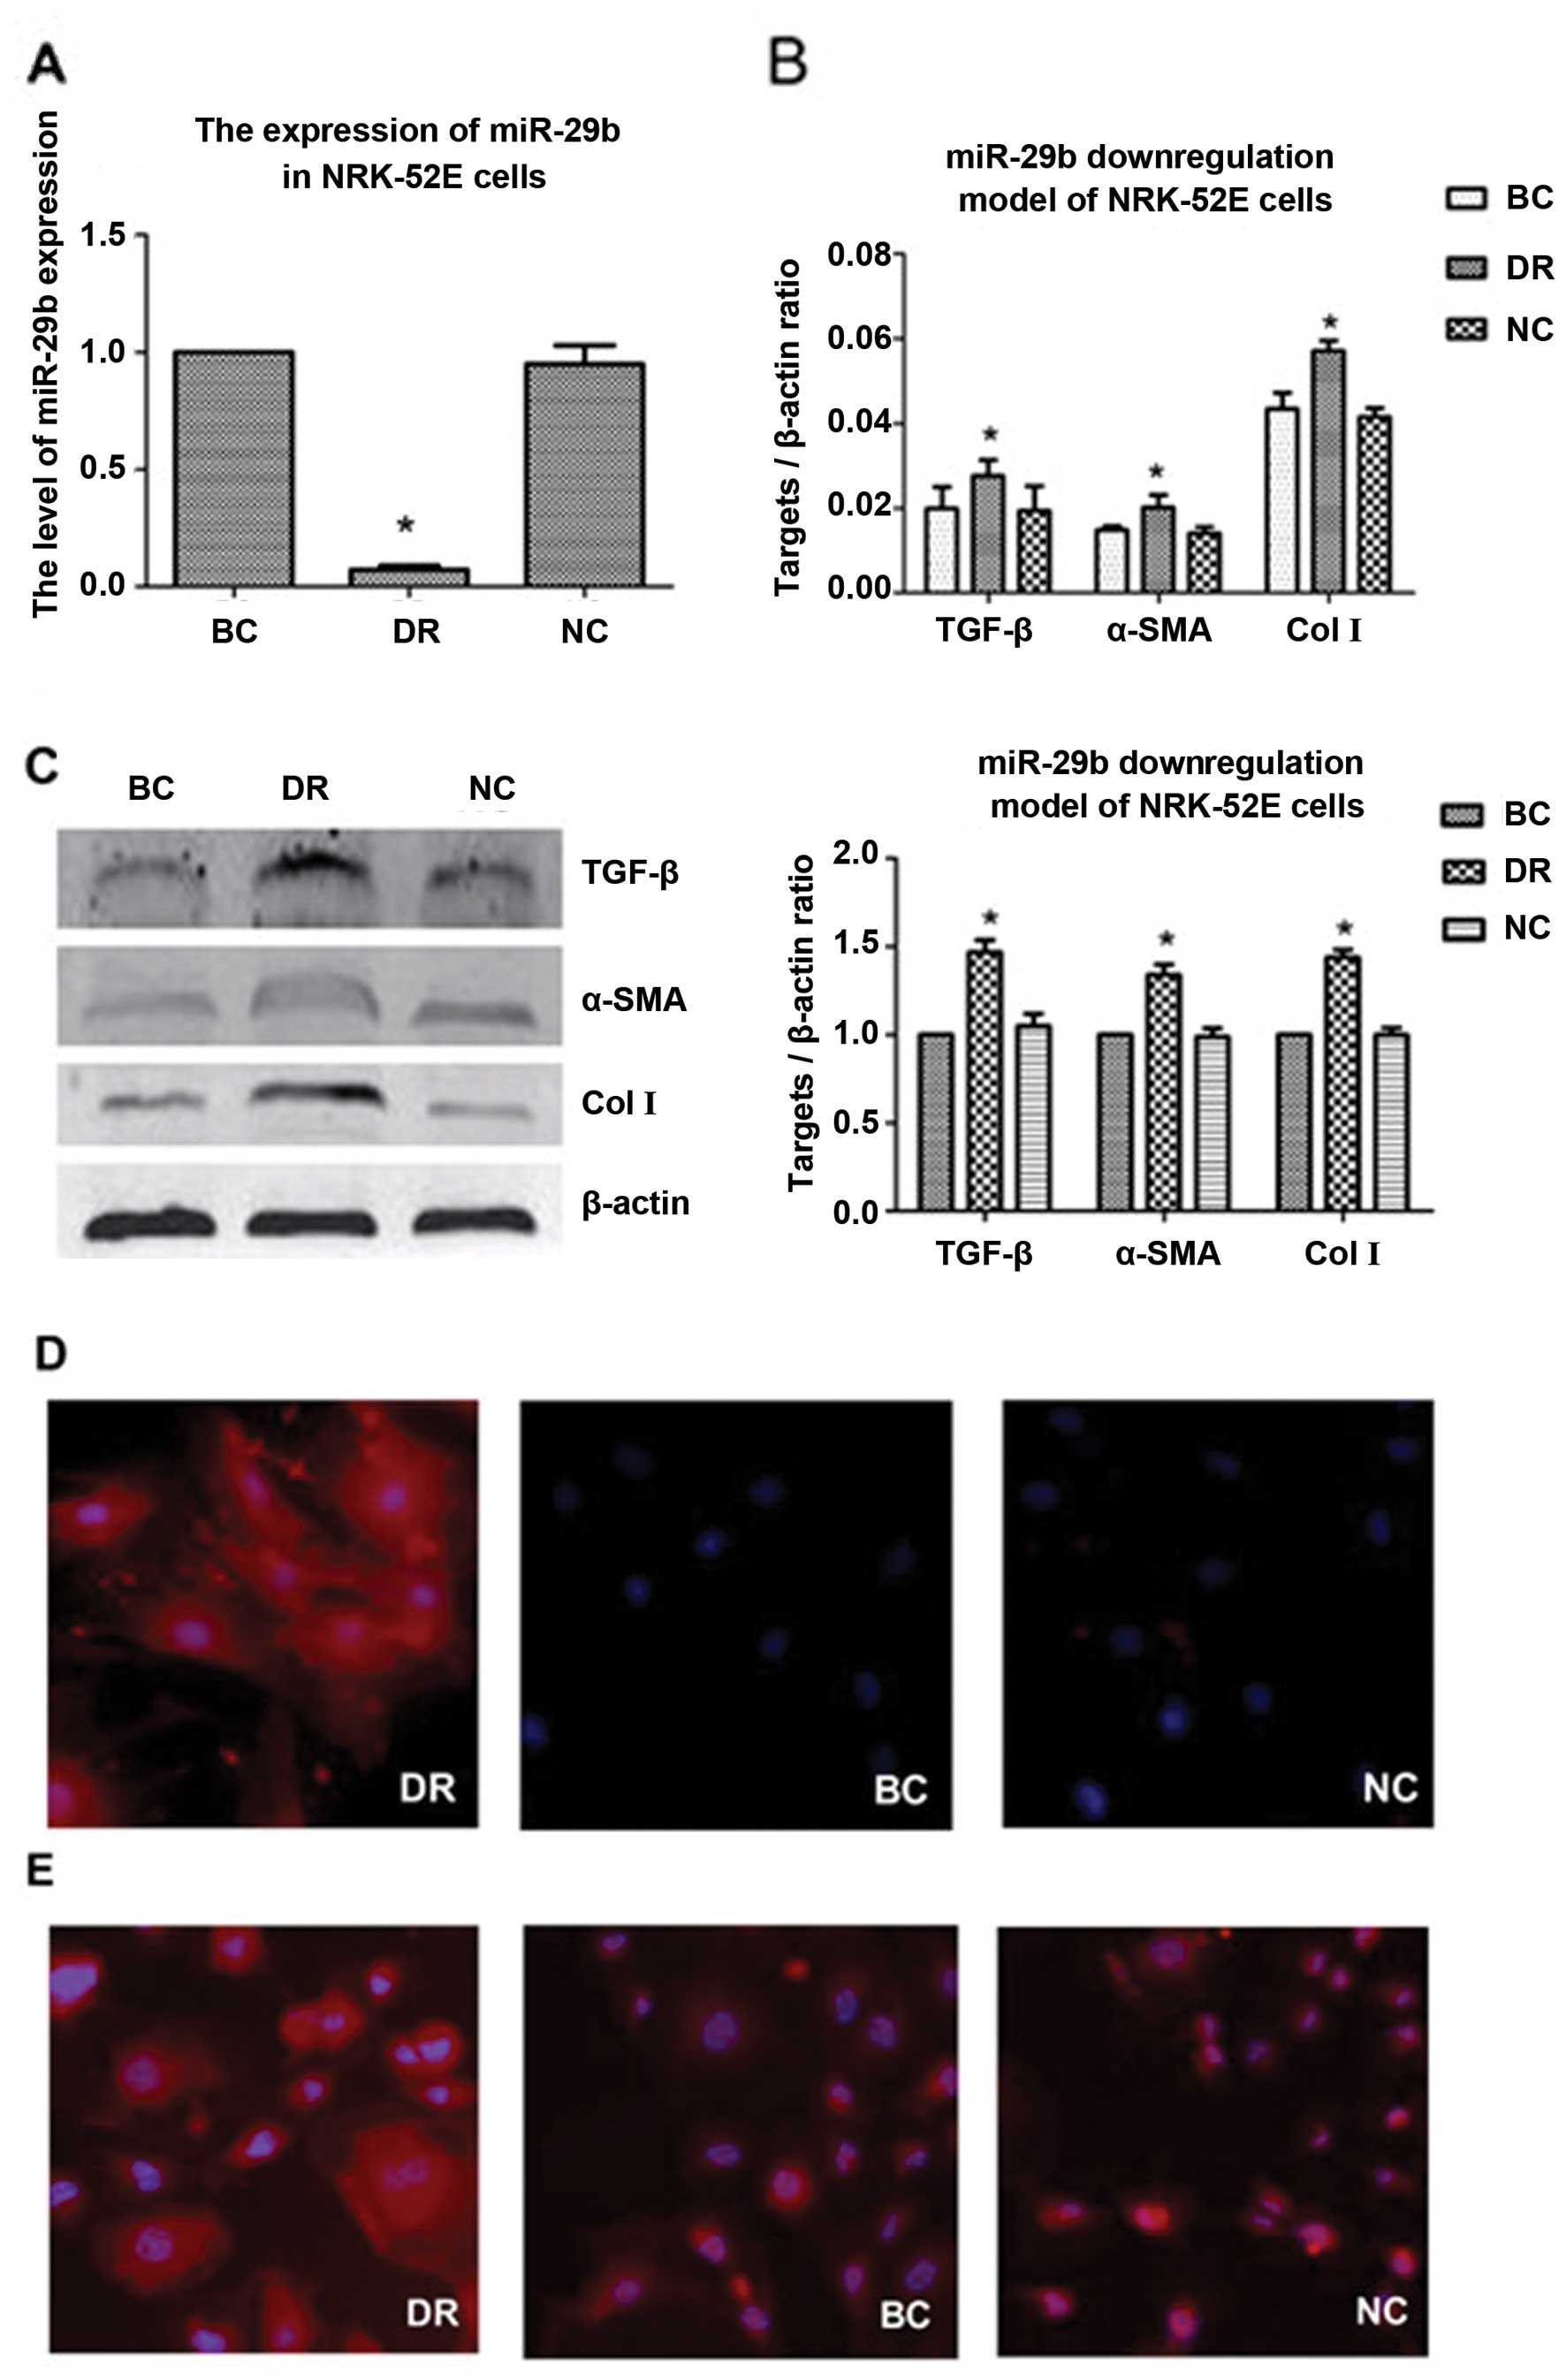
The results of miR-29b RT-qPCR revealed that the
expression level of miR-29b was significantly lower in the
downregulation (DR) group than in the negative control (NC) and
blank control (BC) group (P<0.05), while there was no
statistically significant difference between the latter 2 groups
(P>0.05) (Fig. 2A).
The results of RT-qPCR also revaled that the mRNA
expression levels TGF-β, α-SMA and Col I in the DR group were
significantly higher than those of the BC and NC group (P<0.05),
while there was no statistically significant difference between the
latter 2 groups (P>0.05) (Fig.
2B).
The results of western blot analysis indicated that
the protein expression levels of TGF-β, α-SMA and Col I in the DR
group were significantly higher than those of the BC and NC group
(P<0.05), while there was no statistically significant
difference between the latter 2 groups (P>0.05) (Fig. 2C).
The results of immunofluorescence staining also
revealed that the expression levels of α-SMA and Col I in the DR
group were significantly higher than those of the BC and NC group
(Fig. 2D and E).
Transfection with miR-29b mimics
downregulates the expression levels of TGF-β, α-SMA and Col I
The NRK-52E cells were transfected with miR-29b
mimics, and treated with Ang II (10−7 M) following
transfection. The results of RT-qPCR demonstrated that the
expression level of miR-29b was markedly higher in upregulation
(UR) group than in the NCAng II and Ang II group
(P<0.05), while there was no statistically significant
difference between the latter 2 groups (P>0.05) (Fig. 3A).
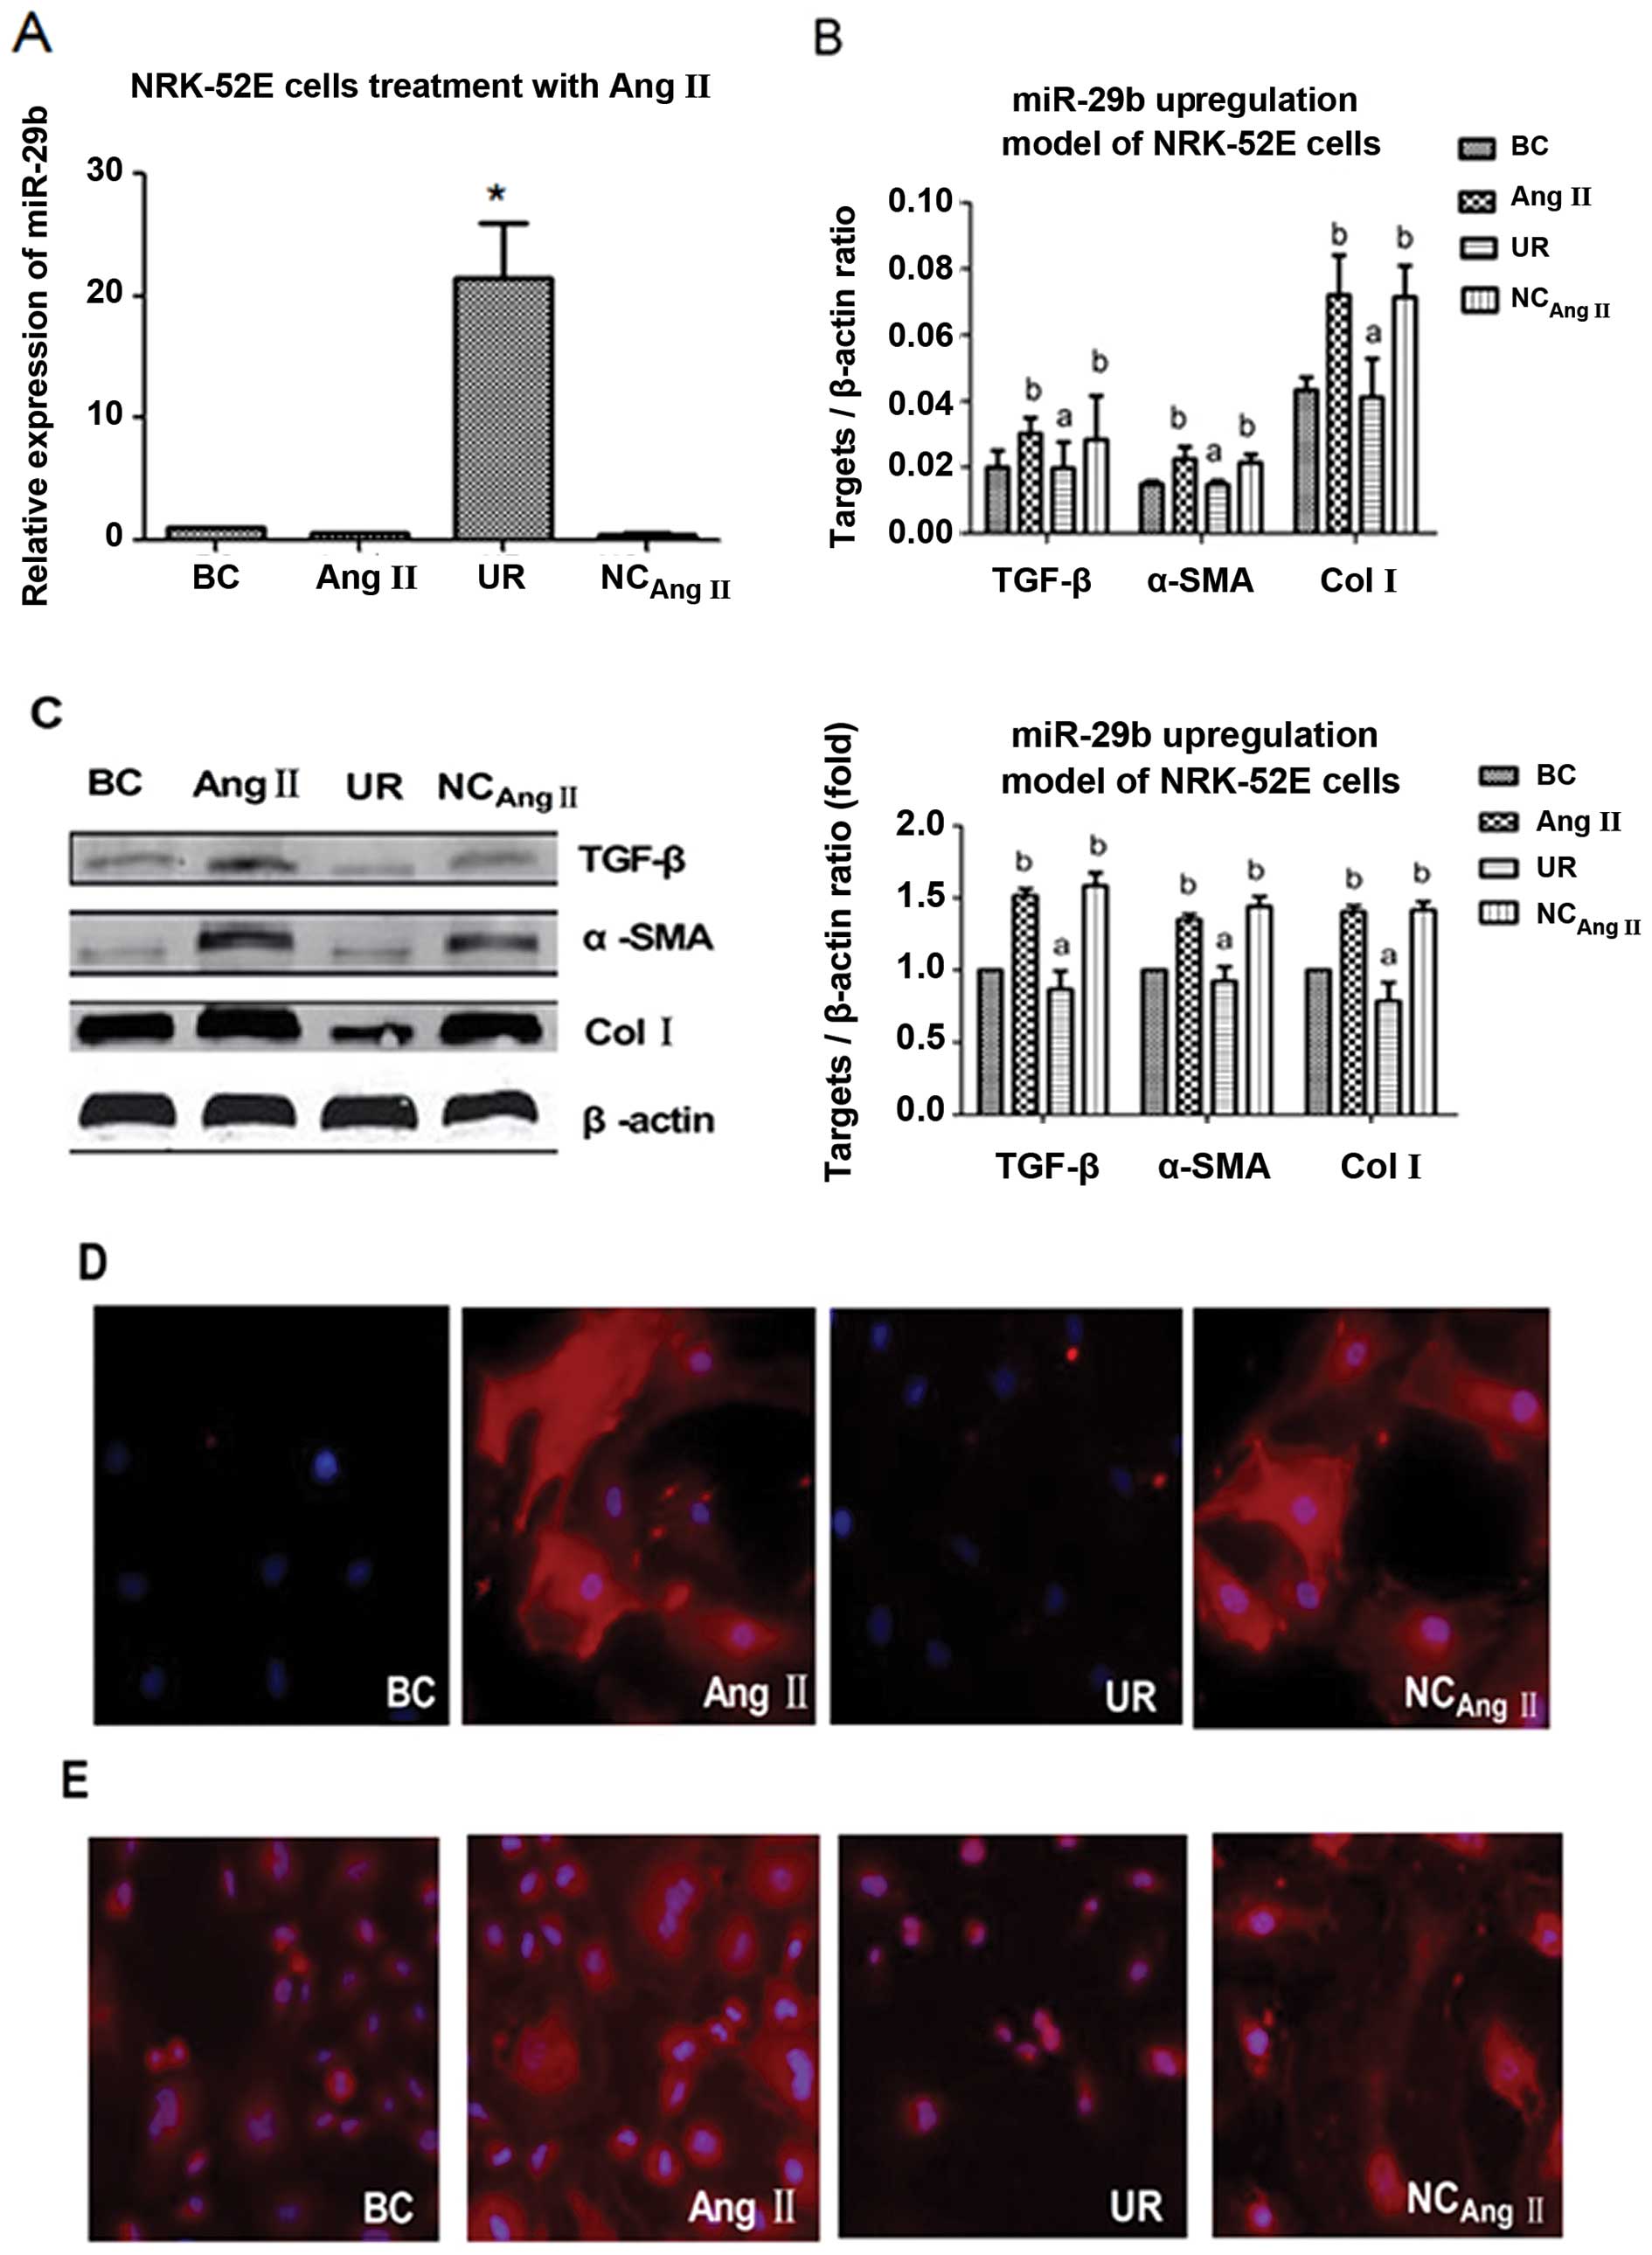 | Figure 3Expression levels of miR-29b,
transforming growth factor (TGF)-β, α-smooth muscle actin (α-SMA)
and collagen I (Col I) analyzed by RT-qPCR, western blot analysis
and immunofluorescence staining following upregulation of miR-29b
24 h before treatment with 10−7 M angiotensin II (Ang
II). (A) RT-qPCR analysis of miR-29b expression;
*P<0.05 compared with the Ang II group and NCAng
II group. (B) RT-qPCR analysis of TGF-β, α-SMA and Col I
expression; aP<0.05 compared with the Ang II group
and NCAng II group; bP<0.05 compared with
the BC group. (C) Western blot analysis of TGF-β, α-SMA and Col I
expression; representative blots show TGF-β, α-SMA and Col I;
aP<0.05 compared with the Ang II group and NCAng
II group; bP<0.05 compared with the BC group.
(D) Immunofluorescence staining of α-SMA; representative images
demonstrating the fluorescence of α-SMA protein (red) and nuclear
(blue) expression in NRK-52E cells in the different groups. (E)
Immunofluorescence staining of Col I; representative images
demonstrating the fluorescence of Col I protein (red) and nucleus
(blue) in NRK-52E cells in different groups. BC, blank control
group; Ang II, Ang II group (treatment with 10−7 M Ang
II); UR, upregulation group (transfection with miR-29b mimics 24 h
before treatment with 10−7 M Ang II ); NCAng
II, negative control-Ang II group (without transfection 24 h
before treatment with 10−7 M Ang II). |
The results of real-time PCR revealed that the mRNA
expression levels of TGF-β, α-SMA and Col I were significantly
lower in the UR group than in the Ang II and NCAng II
group, while there was no statistically significant difference
between the latter 2 groups (P>0.05); the expression levels of
both these latter groups were significantly higher than the levels
of the BC group (Fig. 3B).
The results of western blot analysis indicated that
the protein expression levels of TGF-β, α-SMA and Col I were
significantly lower in the UR group than in the Ang II and
NCAng II group (P<0.05), while there was no
statistically significant difference between the latter 2 groups
(P>0.05); the expression levels of both these latter groups were
significantly higher than the levels of the BC group (P<0.05)
(Fig. 3C).
The results of immunofluorescence staining revealed
that the expression levels of α-SMA and Col I in the UR group were
significantly lower than those of the Ang II and NCAng
II group (Fig. 3D and
E).
Discussion
The present study demonstrated that the expression
level of miR-29b in the renal cortex of SHRs was decreased compared
with age-matched WKY rats. Ang II induced the downregulation of
miR-29b in the NRK-52E cells in vitro, and we hypothesized
that low level of miR-29b expression in the renal cortex of SHRs
may be related to the high level of Ang II. We came to this
hypothesis on the basis of the study of Matsushima et al
(6), who demonstrated that the
levels of Ang II and the density of Ang II receptor in the kidneys
of young SHRs were significantly higher than those of age-matched
WKY rats. We also thus hypothesized that the downregulation of
miR-29b expression may have a similar effect on NRK-52E cells as
that observed following treatment with Ang II, while the
upregulation of miR-29b expression may protect NRK-52E cells from
EMT induced by Ang II.
The expression level of miR-29b in the renal cortex
between adult SHRs and WKY rats was analyzed by RT-qPCR. We found
that the expression level of miR-29b in the SHRs was decreased
compared with that of the WKY rats. The study of Matsushima et
al mentioned above testified high levels of Ang II and its
receptor in the kidneys of SHRs. In our study, we treated NRK-52E
cells with Ang II in vitro, and found (by RT-qPCR) that this
induced the downregulation of miR-29b. Ang II promotes renal
fibrosis by increasing the expression of fibrosis-associated genes,
such as TGF-β, α-SMA and Col I (9–12).
In recent years, a number of studies have demonstratd the effects
of miR-29b on fibrosis (13–15). However, to the best of our
knowledge, it has rarely been reported that Ang II regulates
miR-29b expression. Liu et al (16) reported that Ang II induced renal
functional injury and fibrosis through the upregulation of SP1 and
the downregulation of miR-29b expression, while Smad7 may play a
protective role in Ang II-induced hypertensive kidney injury. These
data and the data presented in our study suggest that Ang II
decreases the expression level of miR-29b. Possibly, the low levels
of miR-29b expression in the renal cortex of SHRs may be related to
the high levels of Ang II. However, the specific mechanisms
involved remain unclear. We hypothesized that at least two distinct
intracellular signaling pathways are involved. One pathway involves
nuclear factor-κB (NF-κB) activated by Ang II by binding to type I
angiotensin II receptor (AT1R) (17,18). NF-κB activates another
transcription factor, YY1, which directly combines with the
promoter of miR-29b2/c to suppress its expression (19). Another pathway involves
mitogen-activated protein kinase (MAPK) activated by the Ang
II-phospholipase C (PLC)-protein kinase C (PKC) signaling pathway;
MAPK activates proto-oncogene c-myc, which directly binds to the
promoter of miR-29b2/c to suppress its expression (20–22).
EMT is an important step in the process of renal
fibrosis. TGF-β has been acknowledged to play an important role in
EMT by inducing the expression of α-SMA, which is an important
marker of EMT and stimulates the production of ECM, including Col I
and Col III (15,23,24). To further examine the function of
miR-29b, NRK-52E cells were transfected with miR-29b inhibitor. The
results of RT-qPCR, western blot analysis and immunofluorescence
staining revealed that miR-29b inhibitor induced a marked
upregulation in the expression of TGF-β, α-SMA and Col I in the
NRK-52E cells. Our data suggest that the downregulation of miR-29b
expression promotes EMT. Members of the miR-29 family are
negatively regulated by TGF-β/Smad3 and play a protective role in
renal fibrosis by inhibiting the deposition of ECM and preventing
EMT (25,26). At present, only approximately 40
target genes of 7,000 candidates which were predicted by miRNA
target prediction software (PicTar, TargetScan and miRBase) have
been confirmed, chief among these were ECM genes, such as various
collagens, fibrillin, elastin and protocadherin (12,15,19,24,27,28).
Furthermore, in our study, NRK-52E cells were
transfected with miR-29b mimics and treated with Ang II 24 h
following transfection. The results of RT-qPCR, western blot
analysis and immunofluorescence staining demonstrated that the
overexpression of miR-29b markedly suppressed the Ang II-induced
upregulation of TGF-β, α-SMA and Col I. These results suggest that
the overexpression of miR-29b negatively modulates EMT. miR-29
regulates multiple signal pathways, such as the TGF-β/Smad
(15), NF-κB (19,22), Wnt/β-catenin (29) and MAPK (30) pathways, by suppresing the
expression of target genes. The TGF-β/Smad pathway is considered
the most important. Luna et al (31) found that the overexpression of
miR-29b inhibited fibrosis by suppressing TGF-β1 expression at the
mRNA and protein level. miR-29b directly suppresses the expression
of ECM proteins, such as various collagens, fibrillin, elastin and
protocadherin (27,28). These data, as well as the data
presented in our study illustrate that miR-29b negatively modulates
EMT. Moreover, Ang II induces the downregulation of miR-29b
expression and promotes NRK-52E cells to undergo EMT. The
downregulation of miR-29b has a similar effect on NRK-52E cells as
that observed following treatment with Ang II, while the
upregulation of miR-29b protects NRK-52E cells from Ang II-induced
EMT.
Acknowledgements
The present study was supported by a grant from the
Ministry of Health of the People’s Republic of China Science
Foundation (wkj2008-2-031).
References
|
1
|
Cesana M, Cacchiarelli D, Legnini I,
Santini T, Sthandier O, Chinappi M, Tramontano A and Bozzoni I: A
long noncoding RNA controls muscle differentiation by functioning
as a competing endogenous RNA. Cell. 147:358–369. 2011. View Article : Google Scholar : PubMed/NCBI
|
|
2
|
Choi YJ, Lin CP, Ho JJ, He X, Okada N, Bu
P, Zhong Y, Kim SY, Bennett MJ, Chen C, Ozturk A, Hicks GG, Hannon
GJ and He L: miR-34 miRNAs provide a barrier for somatic cell
reprogramming. Nat Cell Biol. 13:1353–1360. 2011. View Article : Google Scholar : PubMed/NCBI
|
|
3
|
Wang G, Kwan BC, Lai FM, Chow KM, Li PK
and Szeto CC: Urinary miR-21, miR-29, and miR-93: novel biomarkers
of fibrosis. Am J Nephrol. 36:412–418. 2012. View Article : Google Scholar : PubMed/NCBI
|
|
4
|
Lekgabe ED, Kiriazis H, Zhao C, Xu Q,
Moore XL, Su Y, Bathgate RA, Du XJ and Samuel CS: Relaxin reverses
cardiac and renal fibrosis in spontaneously hypertensive rats.
Hypertension. 46:412–418. 2005. View Article : Google Scholar : PubMed/NCBI
|
|
5
|
Cheng HF, Wang JL, Vinson GP and Harris
RC: Young SHR express increased type 1 angiotensin II receptors in
renal proximal tubule. Am J Physiol. 274:F10–F17. 1998.PubMed/NCBI
|
|
6
|
Matsushima Y, Kawamura M, Akabane S,
Imanishi M, Kuramochi M, Ito K and Omae T: Increases in renal
angiotensin II content and tubular angiotensin II receptors in
prehypertensive spontaneously hypertensive rats. J Hypertens.
6:791–796. 1988. View Article : Google Scholar : PubMed/NCBI
|
|
7
|
Mezzano SA, Ruiz-Ortega M and Egido J:
Angiotensin II and renal fibrosis. Hypertension. 38:635–638. 2001.
View Article : Google Scholar : PubMed/NCBI
|
|
8
|
Livak KJ and Schmittgen TD: Analysis of
relative gene expression data using real-time quantitative PCR and
the 2−ΔΔCT Method. Methods. 25:402–408. 2001. View Article : Google Scholar : PubMed/NCBI
|
|
9
|
Jimenez E, Perez de la Blanca E, Urso L,
Gonzalez I, Salas J and Montiel M: Angiotensin II induces MMP 2
activity via FAK/JNK pathway in human endothelial cells. Biochem
Biophys Res Commun. 380:769–774. 2009. View Article : Google Scholar : PubMed/NCBI
|
|
10
|
Lavoz C, Rodrigues-Diez R, Benito-Martin
A, Rayego-Mateos S, Rodrigues-Diez RR, Alique M, Ortiz A, Mezzano
S, Egido J and Ruiz-Ortega M: Angiotensin II contributes to renal
fibrosis independently of Notch pathway activation. PLoS One.
7:e404902012. View Article : Google Scholar : PubMed/NCBI
|
|
11
|
Pons M, Cousins SW, Alcazar O, Striker GE
and Marin-Castano ME: Angiotensin II-induced MMP-2 activity and
MMP-14 and basigin protein expression are mediated via the
angiotensin II receptor type 1-mitogen-activated protein kinase 1
pathway in retinal pigment epithelium: implications for age-related
macular degeneration. Am J Pathol. 178:2665–2681. 2011. View Article : Google Scholar
|
|
12
|
Zhong J, Guo D, Chen CB, Wang W, Schuster
M, Loibner H, Penninger JM, Scholey JW, Kassiri Z and Oudit GY:
Prevention of angiotensin II-mediated renal oxidative stress,
inflammation, and fibrosis by angiotensin-converting enzyme 2.
Hypertension. 57:314–322. 2011. View Article : Google Scholar : PubMed/NCBI
|
|
13
|
Cushing L, Kuang PP, Qian J, Shao F, Wu J,
Little F, Thannickal VJ, Cardoso WV and Lu J: miR-29 is a major
regulator of genes associated with pulmonary fibrosis. Am J Respir
Cell Mol Biol. 45:287–294. 2011. View Article : Google Scholar : PubMed/NCBI
|
|
14
|
Qin W, Chung AC, Huang XR, Meng XM, Hui
DS, Yu CM, Sung JJ and Lan HY: TGF-β/Smad3 signaling promotes renal
fibrosis by inhibiting miR-29. J Am Soc Nephrol. 22:1462–1474.
2011.
|
|
15
|
Roderburg C, Urban GW, Bettermann K, Vucur
M, Zimmermann H, Schmidt S, Janssen J, Koppe C, Knolle P, Castoldi
M, Tacke F, Trautwein C and Luedde T: Micro-RNA profiling reveals a
role for miR-29 in human and murine liver fibrosis. Hepatology.
53:209–218. 2011. View Article : Google Scholar : PubMed/NCBI
|
|
16
|
Liu GX, Li YQ, Huang XR, Wei L, Chen HY,
Shi YJ, Heuchel RL and Lan HY: Disruption of Smad7 promotes ANG
II-mediated renal inflammation and fibrosis via Sp1-TGF-β/Smad3-NF.
κB-dependent mechanisms in mice. PLoS One. 8:e535732013.PubMed/NCBI
|
|
17
|
Han Y, Runge MS and Brasier AR:
Angiotensin II induces interleukin-6 transcription in vascular
smooth muscle cells through pleiotropic activation of nuclear
factor-κB transcription factors. Circ Res. 84:695–703.
1999.PubMed/NCBI
|
|
18
|
Kranzhofer R, Schmidt J, Pfeiffer CA, Hagl
S, Libby P and Kubler W: Angiotensin induces inflammatory
activation of human vascular smooth muscle cells. Arterioscler
Thromb Vasc Biol. 19:1623–1629. 1999. View Article : Google Scholar : PubMed/NCBI
|
|
19
|
Wang H, Garzon R, Sun H, Ladner KJ, Singh
R, Dahlman J, Cheng A, Hall BM, Qualman SJ, Chandler DS, Croce CM
and Guttridge DC: NF-κB-YY1-miR-29 regulatory circuitry in skeletal
myogenesis and rhabdomyosarcoma. Cancer Cell. 14:369–381. 2008.
|
|
20
|
Chang TC, Yu D, Lee YS, Wentzel EA, Arking
DE, West KM, Dang CV, Thomas-Tikhonenko A and Mendell JT:
Widespread microRNA repression by Myc contributes to tumorigenesis.
Nat Genet. 40:43–50. 2008. View Article : Google Scholar : PubMed/NCBI
|
|
21
|
Mott JL, Kurita S, Cazanave SC, Bronk SF,
Wemeburg NW and Femandez-Zapico ME: Transcriptional suppression of
mir-29b-1/mir-29a promoter by c-Myc, hedgehog, and NF-kappaB. J
Cell Biochem. 110:1155–1164. 2010. View Article : Google Scholar : PubMed/NCBI
|
|
22
|
Sadoshima J and Izumo S: Signal
transduction pathways of angiotensin II - induced c-fos gene
expression in cardiac myocytes in vitro. Roles of
phospholipid-derived second messengers. Circ Res. 73:424–438. 1993.
View Article : Google Scholar : PubMed/NCBI
|
|
23
|
Kopp JB: TGF-β signaling and the renal
tubular epithelial cell: too much, too little, and just right. J Am
Soc Nephrol. 21:1241–1243. 2010.
|
|
24
|
Meng XM, Huang XR, Chung AC, Qin W, Shao
X, Igarashi P, Ju W, Bottinger EP and Lan HY: Smad2 protects
against TGF-β/Smad3-mediated renal fibrosis. J Am Soc Nephrol.
21:1477–1487. 2010.
|
|
25
|
Chung AC, Yu X and Lan HY: MicroRNA and
nephropathy: emerging concepts. Int J Nephrol Renovasc Dis.
6:169–179. 2013.PubMed/NCBI
|
|
26
|
Patel V and Noureddine L: MicroRNAs and
fibrosis. Curr Opin Nephrol Hypertens. 21:410–416. 2012. View Article : Google Scholar : PubMed/NCBI
|
|
27
|
Fort A, Borel C, Migliavacca E,
Antonarakis SE, Fish RJ and Neerman-Arbez M: Regulation of
fibrinogen production by microRNAs. Blood. 116:2608–2615. 2010.
View Article : Google Scholar : PubMed/NCBI
|
|
28
|
Villarreal G Jr, Oh DJ, Kang MH and Rhee
DJ: Coordinated regulation of extracellular matrix synthesis by the
microRNA-29 family in the trabecular meshwork. Invest Ophthalmol
Vis Sci. 52:3391–3397. 2011. View Article : Google Scholar : PubMed/NCBI
|
|
29
|
Kapinas K, Kessler CB and Delany AM:
miR-29 suppression of osteonectin in osteoblasts: regulation during
differentiation and by canonical Wnt signaling. J Cell Biochem.
108:216–224. 2009. View Article : Google Scholar : PubMed/NCBI
|
|
30
|
Inoki K, Haneda M, Ishida T, Mori H, Maeda
S, Koya D, Sugimoto T and Kikkawa R: Role of mitogen-activated
protein kinases as downstream effectors of transforming growth
factor-beta in mesangial cells. Kidney Int Suppl. 77:S76–S80. 2000.
View Article : Google Scholar : PubMed/NCBI
|
|
31
|
Luna C, Li G, Qiu J, Epstein DL and
Gonzalez P: Cross-talk between miR-29 and transforming growth
factor-betas in trabecular meshwork cells. Invest Ophthalmol Vis
Sci. 52:3567–3572. 2011. View Article : Google Scholar : PubMed/NCBI
|