Introduction
Cellular proliferation, differentiation, senescence
and apoptosis are cell cycle-dependent processes (1). Regulation of the cell cycle is
closely linked to tumor development and progression, as it is
impaired in almost all tumors (2,3).
In addition, numerous proto-oncogenes and tumor suppressor genes
function as major factors or are directly involved in the
regulation of cell cycle (4).
Carcinogenic factors can induce mutation, deletion, translocation
or amplification of these genes, resulting in de-regulation of the
cell cycle, abnormal cell proliferation and tumor development. A
novel strategy for cancer therapy involves regulating cell cycle,
proliferation and apoptosis of tumor cells and select inhibition of
tumor tissue activity (5).
B cell translocation gene 1 (BTG1) is a member of
the TOB/BTG family of proteins known to inhibit cell proliferation
and negatively regulate the cell cycle that was first identified in
B lymphoblastic leukemia (6–9).
The TOB/BTG family members regulate these processes by acting on
cell cycle genes in response to various internal and external
stimuli. For example, high PC3 expression in NIH/3T3 cells arrests
the cell cycle in the G1 phase and inhibits cell growth
(10). Enhanced BTG1 expression,
which peaks in the G0/G1 phase, promotes the
differentiation of neural stem and germ cells and plays an
important role in angiogenesis. BTG1 also facilitates the formation
of the CCR4/NOT transcriptional complex, which regulates the
deadenylation and turnover of cytoplasmic mRNAs. BTG1 is
structurally characterized by the presence of a specific BTG domain
in the N terminus along with a large anti proliferative homologous
region (11). Although BTG1
exhibits certain characteristics of tumor suppressor genes
(12,13), it is not known if BTG1 is a kidney
cancer suppressor gene. Therefore, the present study aimed to
determine what roles BTG1 plays in the growth, proliferation,
invasion, metastasis and apoptosis of kidney cancer cells.
Materials and methods
Reagents
The rabbit anti-human BTG1 monoclonal (14879-1-AP
and 14102-1-AP) antibodies were purchased from Proteintech Group
(Chicago, IL, USA). Rabbit anti-human cyclin D1 polyclonal
(ab7958), mouse anti-human Bcl-2 monoclonal (ab117115), and rabbit
anti-human MMP-9 polyclonal (ab7299) antibodies were purchased from
Abcam (Cambridge, UK). Goat anti-rabbit fluorescent secondary
antibody (IRDye800) was obtained from LI-COR Biosciences, Inc.
(Lincoln, NE, USA). The β-actin primary antibody (A1978),
polyoxymethylene and crystal violet were purchased from Sigma (St.
Louis, MO, USA). The pLenti6/V5-DEST vector, Lentiviral Packaging
Mix, Opti-MEM, Lipofectamine 2000 and TRIzol were obtained from
Invitrogen (Thermo Fisher Scientific, Waltham, MA, USA). An
immunohistochemistry and Annexin V-fluorescein isothiocyanate
(FITC)/propidium iodide (PI) apoptosis detection kit were purchased
from 4A Biotech Co., Ltd. (Beijing, China). Fetal bovine serum
(FBS), cell-culture media and supplementary materials were obtained
from Gibco (Thermo Fisher Scientific). Reverse transcriptase
reagents and SYBR Premix ExTaq (Perfect real-time) were purchased
from Takara (Shiga, Japan). Invasion chambers and Matrigel for
invasion and migration assays were purchased from BD Biosciences
(Franklin Lakes, NJ, USA).
Cell culture and gene transfection
The human kidney cancer cell line ACHN was
maintained in RPMI-1640 medium supplemented with 10% FBS, which was
changed every 2–3 days. Upon reaching confluence, cells were
subcultured with 0.25% trypsin and 1% ethylenediaminetetraacetic
acid. BTG1 cDNA sequences were cloned into the BamHI
and AscI sites of the pLenti6/V5-DEST vector, and cells were
transfected with the pLenti6-BTG1 or pLenti6/V5-DEST vector using
Lipofectamine 2000. Transfected cells were maintained in
blastidicin (5 μg/ml)-containing RPMI-1640 medium for
selection of stable vector-containing sublines.
Immunohistochemistry
Immunohistochemistry was performed as previously
described (14). Briefly,
4-μm sections were prepared from paraffin-embedded biopsy
samples and dehydrated. Sections were incubated in 3% hydrogen
peroxide for 10 min to block endogenous peroxidase, followed by 20
min in 0.05% trypsin. Sections were incubated for 20 min at room
temperature in a blocking solution containing 10% goat serum
followed by the BTG1 antibody (1:100) at 4°C overnight. For a
negative control, the primary antibody was replaced with
phosphate-buffered saline (PBS). Sections were subsequently
incubated for 20 min each in secondary and tertiary antibodies at
room temperature, visualized by 3,3′-diaminobenzidine staining and
countered with a hematoxylin stain. Two pathologists blind to the
patient condition examined and quantified the sections. Five
randomly-selected fields from three slides for each specimen were
examined under a microscope and counted. BTG1 expression was
determined based on the percentage of positive cells (0 points,
≤5%; 1 point, 5–25%; 2 points, 25–50%; and 3 points, >50%
positive cells) and the staining intensity [0 points, no staining;
1 point, weak staining (light yellow); 2 points, moderate staining
(yellowish-brown); and 3 points, strong staining (brown)]. The
final score of BTG1 expression was the product of the BTG1
expression rate (percentage score) and intensity: - for 0 points,
+ for 1–3 points, ++ for 4–6 points and
+++ for 7–9 points.
Reverse transcription-quantitative
polymerase chain reaction (RT-qPCR)
Total RNA was extracted from ACHN cells using the
TRIzol reagent according to the manufacturer's instructions. Total
RNA (500 ng) was reverse transcribed using reverse transcriptase,
and RT-qPCR was performed on an ABI Prism 7300 Real-Time PCR system
(Applied Biosystems Inc., Life Technologies/Thermo Fisher
Scientific) according to the standard manufacturer’s instructions
for SYBR Premix ExTaq. Gene specific primers used include:
BTG1, sense, 5′-GGAATTCATGCATCCCTTCTACACCCGG; and
anti-sense, 5′-CGACGCGTTTAACCTGATACAGTCATCAT; and β-actin
for normalization, sense, 5′-ATCGTCCACCGCAAATGCTTCTA and antisense,
5′-AGCCATGCCAATCTCATCTTGTT. Thermal cycling conditions were 95°C
for 1 min, followed by 40 cycles of 95°C for 15 sec and 60°C for 1
min. The expression level relative to β-actin was calculated
using the 2−ΔΔCt method in SDS 1.3 software (Applied
Biosystems, Inc.).
Western blotting
Western blotting was performed as previously
described (15). Briefly, 50
μg of protein [determined using a bicinchoninic acid Protein
Assay kit (Tiangen Biotech Co., Ltd., Beijing, China)] per samples
were subjected to sodium dodecyl sulfate-polyacrylamide gel
electrophoresis and transferred to a nitrocellulose membrane.
Membranes were incubated for 2 h in 5% skimmed dry milk followed by
an overnight incubation at 4°C in primary antibody (BTG1, 1:1,000;
β-actin, 1:5,000). Subsequent to washing, the membranes were
incubated with goat anti-rabbit fluorescent secondary antibody
(IRDye800, 1:20,000 dilution) in the dark for 1 h at room
temperature. The blots were scanned and analyzed using the Odyssey
Infrared Imaging System (LI-COR Biosciences, Inc.). Western blot
data were quantified by normalizing the BTG1 signal intensity of
each sample to that of β-actin.
MTT assay
Cell viability was determined using the tetrazolium
salt MTT (3-(4,5-dimethylthiazol-2-yl)-2,5-diphenyltetrazolium
bromide) assay, as previously described (16). Briefly, ACHN cells were plated
into 96-well culture plates at an optimal density of
5×10³ cells/ml with 200 μl/well. After 24–96 h,
20 μl of 5 mg/ml MTT was added to each well and incubated at
37°C for 4 h. Subsequently, the medium was gently aspirated and 150
μl of dimethyl sulfoxide was added to each well to
solubilize the formazan crystals. The optical density of each
sample was immediately measured at 570 nm using a microplate reader
(Bio-Rad Laboratories, Hercules, CA, USA).
Flow cytometry
An Annexin V-FITC-flow cytometry assay was used as
previously described (17) to
detect the apoptosis rate. Cells were plated into 60-mm dishes for
48 h and grown to 70–75% confluency Cells were subsequently
collected, washed with ice-cold PBS and resuspended at a density of
1×10⁶ cells/ml in a binding buffer and incubated for 15
min in the dark at 25°C with 5 μl Annexin V-FITC and 10
μl PI (20 μg/ml). A total of 10,000 cells were
analyzed with a FACScan flow cytometer with CellQuest software (BD
Biosciences) for the apoptosis rate determination. For cell cycle
distribution, 1×10⁶ cells were fixed in 70% ethanol and
resuspended in 1 ml of a solution containing 3.8 mM sodium citrate,
50 μg/ml PI, and 0.5 μg RNase A, and analyzed with
the flow cytometer using the ModFit software program (Verity
Software House, Topsham, ME, USA).
Invasion and migration assays
Invasion and migration assays were performed as
previously described (18).
Briefly, 8×10⁵ cells were plated into Invasion Chambers
with Costar Transwell 8-μm inserts coated with 50 μg
reduced serum Matrigel according to the manufacturer's
instructions. Medium supplemented with 10% FBS was used in the
lower chamber. Migration assays were performed in the same manner
excluding the Matrigel. After 12 h, non-invading cells and media
were removed with a cotton swab. Cells on the lower surface of the
membrane were fixed with polyoxymethylene and stained with 0.1%
crystal violet for 30 min. Stained cells were counted under a
microscope in four randomly-selected fields and the average was
used to indicate cell migration and invasion.
Statistical analyses
All the statistical analyses were performed using
the SPSS 16.0 software (IBM, Armonk, NY, USA), according to
published guidelines (19).
Survival distributions were estimated with the Kaplan-Meier method
and compared with the log-rank test. Student’s t-test,
χ2 and Fisher’s exact tests were used to analyze the
differences between groups. Data are presented as the mean ±
standard error, and P<0.05 was considered to indicate a
statistically significant difference.
Results
BTG1 protein expression in normal tissue
and kidney cancer
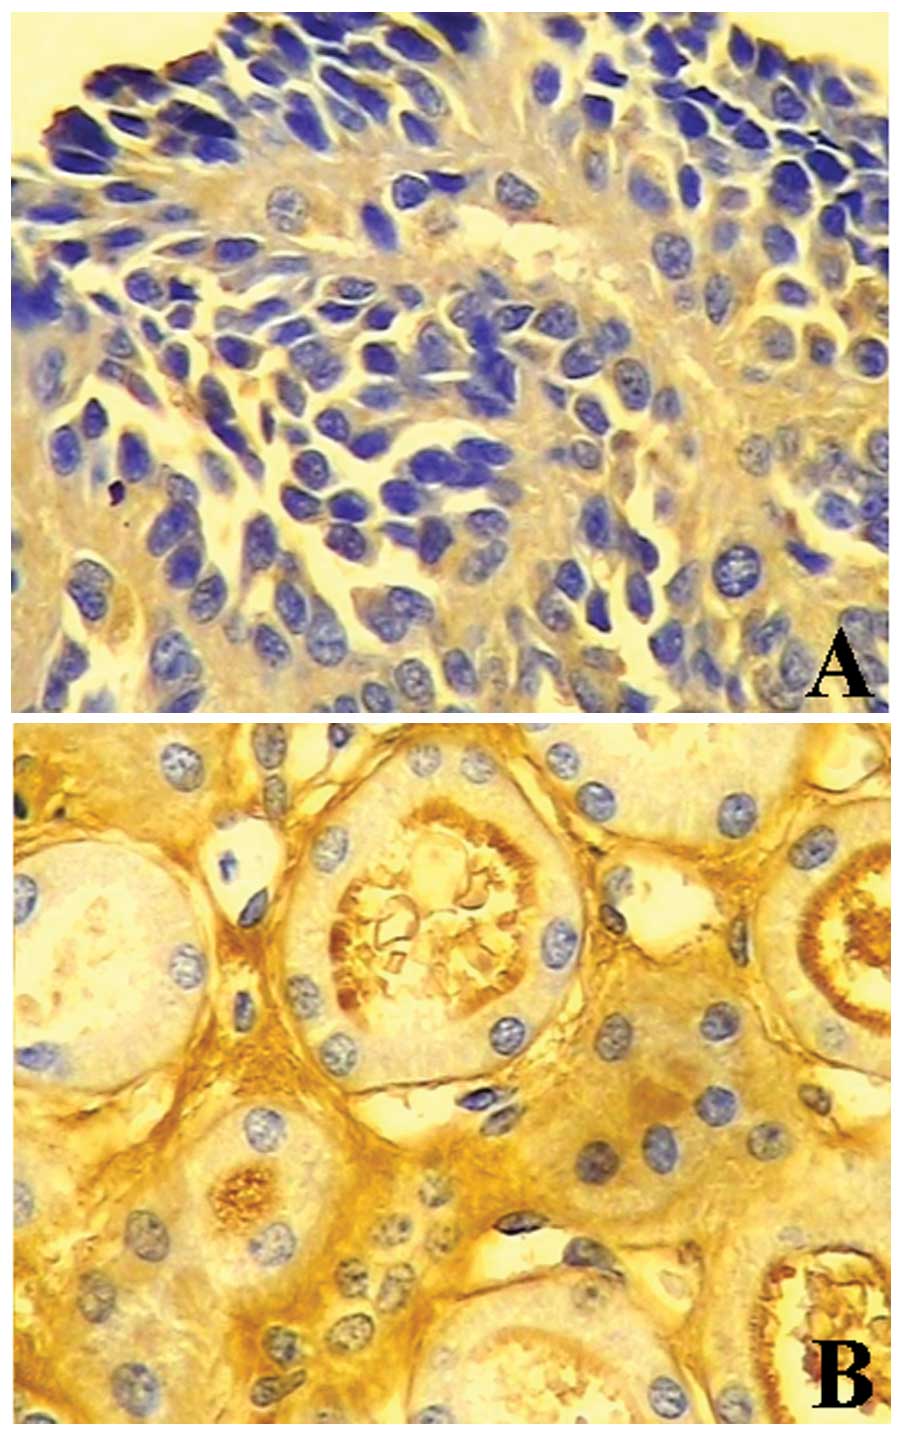
Immunohistochemistry for BTG1 revealed light yellow
to brown staining in 77.5% (31/40) of normal kidney tissues, and
negative or weak staining in 34.1% (29/85) kidney cancer tissues (P
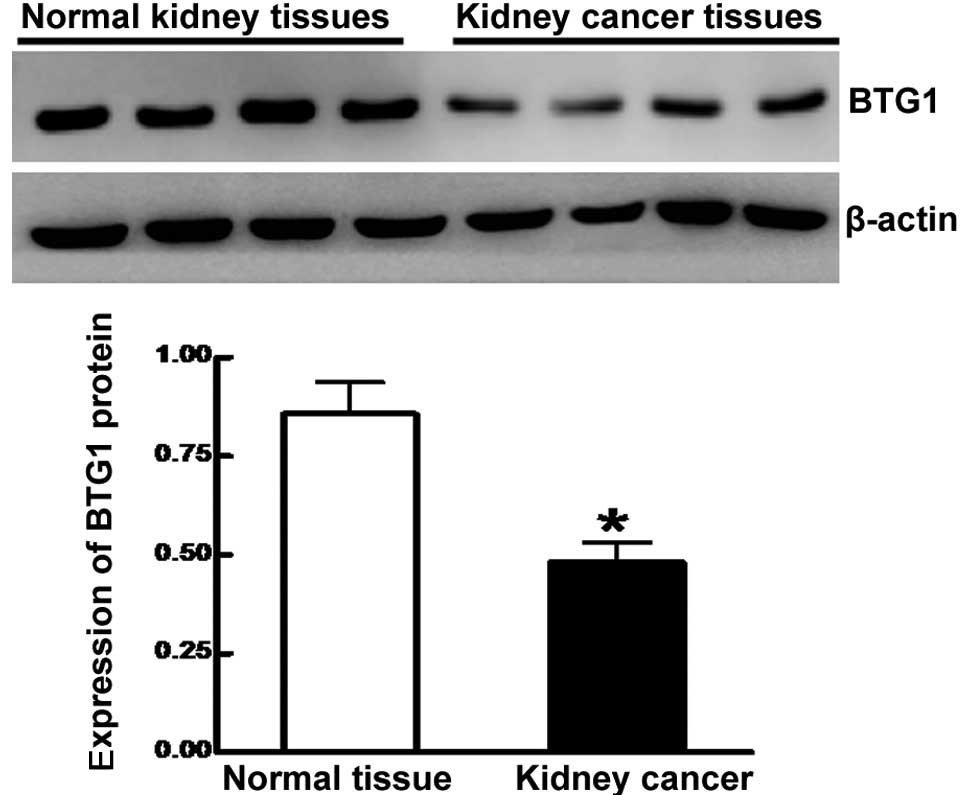
<0.05) (Table I, Fig. 1). Furthermore, BTG1 protein
expression was significantly lower in cancer lesion samples
compared to adjacent normal tissue, as determined by western blot
analysis (0.481±0.051 vs. 0.857±0.081; P<0.05) (Fig. 2). BTG1 expression levels
correlated with T stage, lymph node metastasis, clinical stage and
pathological differentiation (P<0.05), regardless of age,
gender, tumor size and pathological types (P>0.05) (Table II).
 | Table IBTG1 expression in normal and
cancerous kidney tissue. |
Table I
BTG1 expression in normal and
cancerous kidney tissue.
| Groups | Case | Expression of BTG1
protein
|
|---|
| − | + | ++ | +++ | χ2 | P value |
|---|
| Normal tissue | 40 | 9 | 9 | 12 | 10 | 21.905 | <0.0001 |
| Cancer tissue | 85 | 56 | 12 | 8 | 9 | | |
| Table IIAssociation between BTG1 expression
and kidney cancer characteristics. |
Table II
Association between BTG1 expression
and kidney cancer characteristics.
| Groups | Case | Expression of BTG1
protein
|
|---|
| − | + to
+++ | χ2 | P value |
|---|
| Gender |
| Male | 57 | 37 | 20 | 0.072 | 0.788 |
| Female | 28 | 19 | 9 | | |
| Age, years |
| ≤50 | 34 | 24 | 10 | 0.558 | 0.455 |
| >50 | 51 | 32 | 19 | | |
| Tumor length,
cm |
| ≤7 | 30 | 19 | 11 | 0.134 | 0.714 |
| >7 | 55 | 37 | 18 | | |
| Pathological
types |
| Clear cell
type | 51 | 31 | 20 | 1.971 | 0.373 |
| Granule cell
type | 23 | 16 | 7 | | |
| Papillary cell
type | 11 | 9 | 2 | | |
| Lymph node
metastasis |
| N0 | 31 | 15 | 16 | 6.645 | 0.010 |
| N+ | 54 | 41 | 13 | | |
| Clinical
stages |
| I–II | 27 | 12 | 15 | 8.090 | 0.004 |
| III–IV | 58 | 44 | 14 | | |
| Histological
grade |
| I | 33 | 17 | 16 | 4.954 | 0.026 |
| I–III | 52 | 39 | 13 | | |
BTG1 expression and prognosis
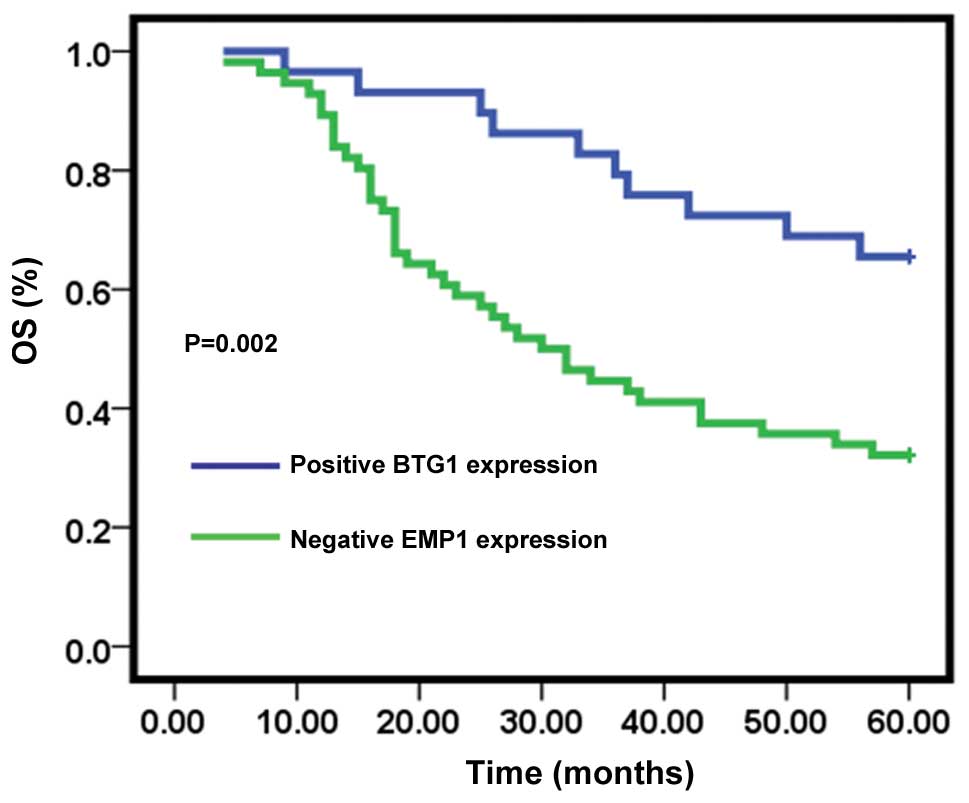
Follow-up examinations were performed on cancer
patients for up to 60 months, with 37 patients remaining at the
conclusion of the study. Overall survival (OS) rates were
determined between patients positive for BTG1 expression and those
negative for expression. Thirteen of the 56 individuals showing no
BTG1 expression remained at the conclusion of the study, with an OS
rate of 32.1%. Patients positive for BTG1 expression had a
significantly higher OS rate of 65.5% (19/29) (P<0.05) (Fig. 3).
Stable transfection of BTG1 in kidney
cancer cells
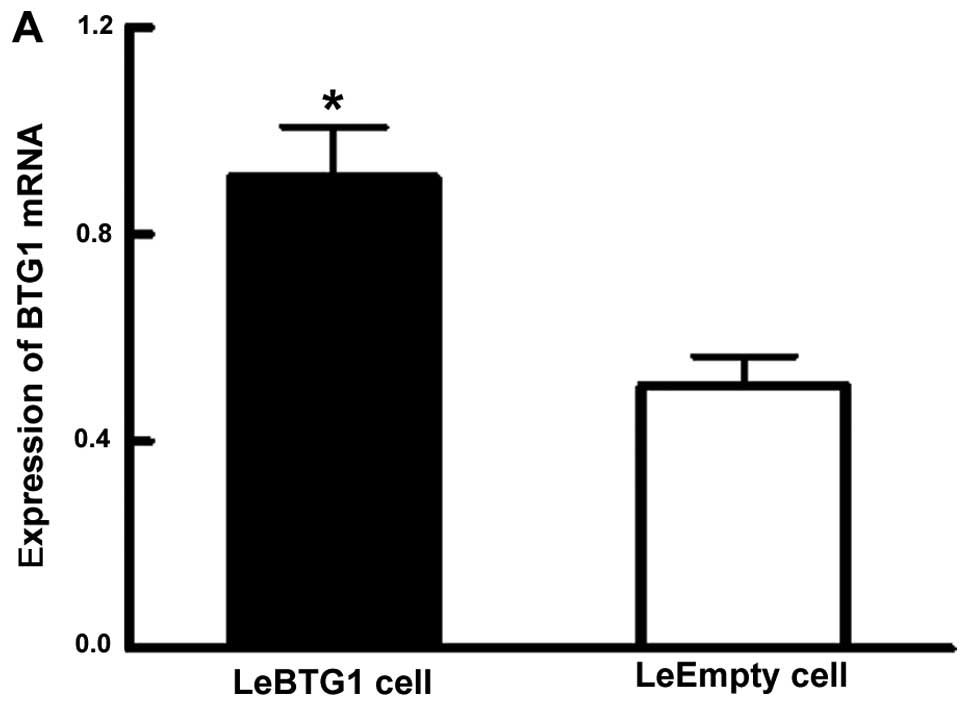
BTG1 overexpressing ACHN cells (known as LeBTG1)
were obtained by a stable transfection of BTG1 cDNA, and
compared to ACHN cells overexpressing an empty vector (named
LeEmpty) as a control. Analysis of RT-qPCR data showed that LeBTG1
cells had a significantly higher expression of BTG1 mRNA
compared to LeEmpty cells (0.911±0.095 vs. 0.508±0.055; P<0.05)
(Fig. 4A). Furthermore, western
blot analysis showed that LeBTG1 cells had a significantly higher
expression of BTG1 protein compared to LeEmpty cells (0.871±0.089
vs. 0.429±0.045; P<0.05) (Fig.
4B).
Cellular effects of BTG1
overexpression
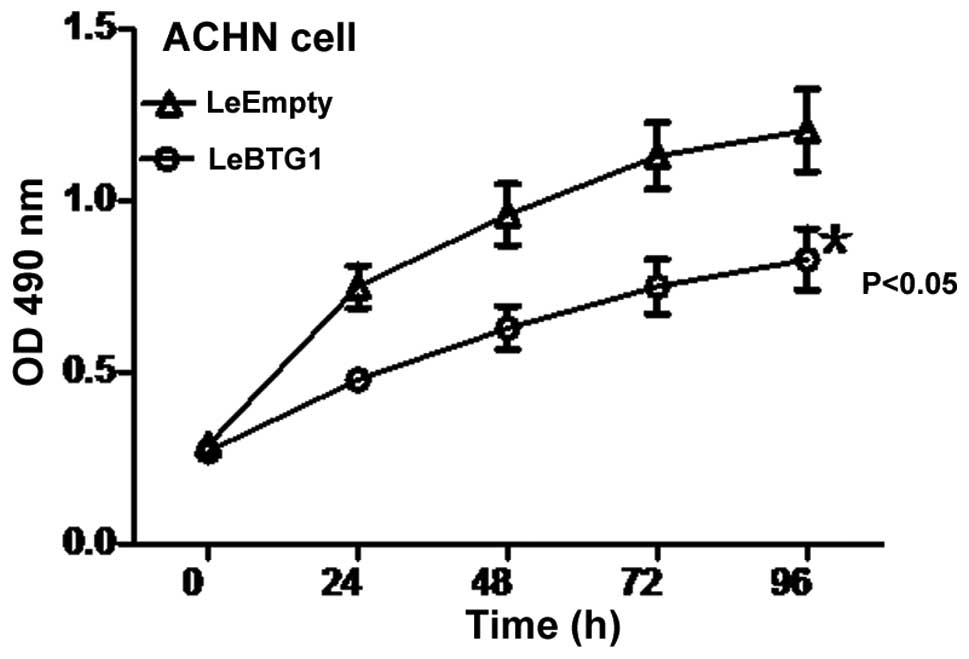
LeBTG1 cells had a significantly lower viability at
24, 48, 72 and 96 h compared to LeEmpty cells as assessed by an MTT
assay (P<0.05) (Fig. 5). Cell
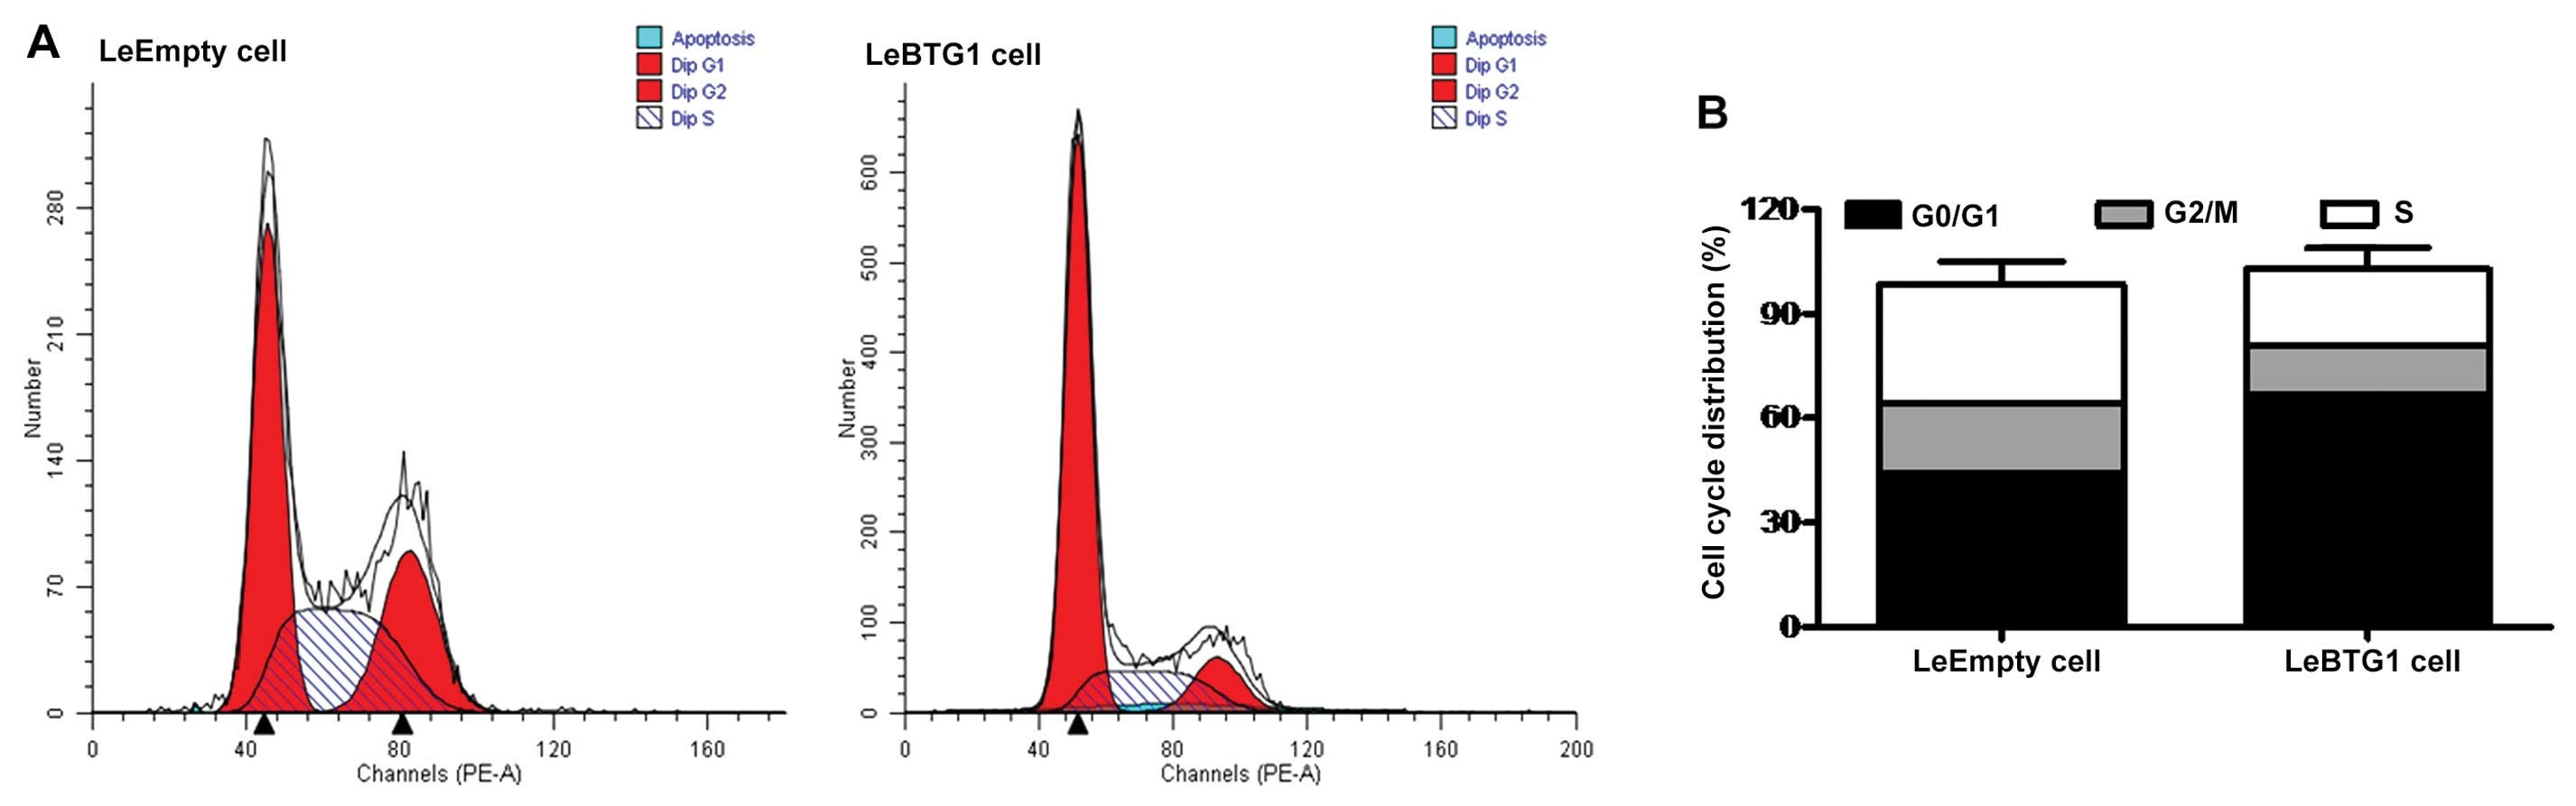
cycle analysis using flow cytometry showed that the proportion of
LeBTG1 cells in the G0/G1 and S phases of the
cell cycle were significantly different compared to the control
LeEmpty cells (66.8±5.3 and 22.2±1.5 vs. 44.4±3.1 and 34.5±2.3%,
respectively; P<0.05) (Fig.
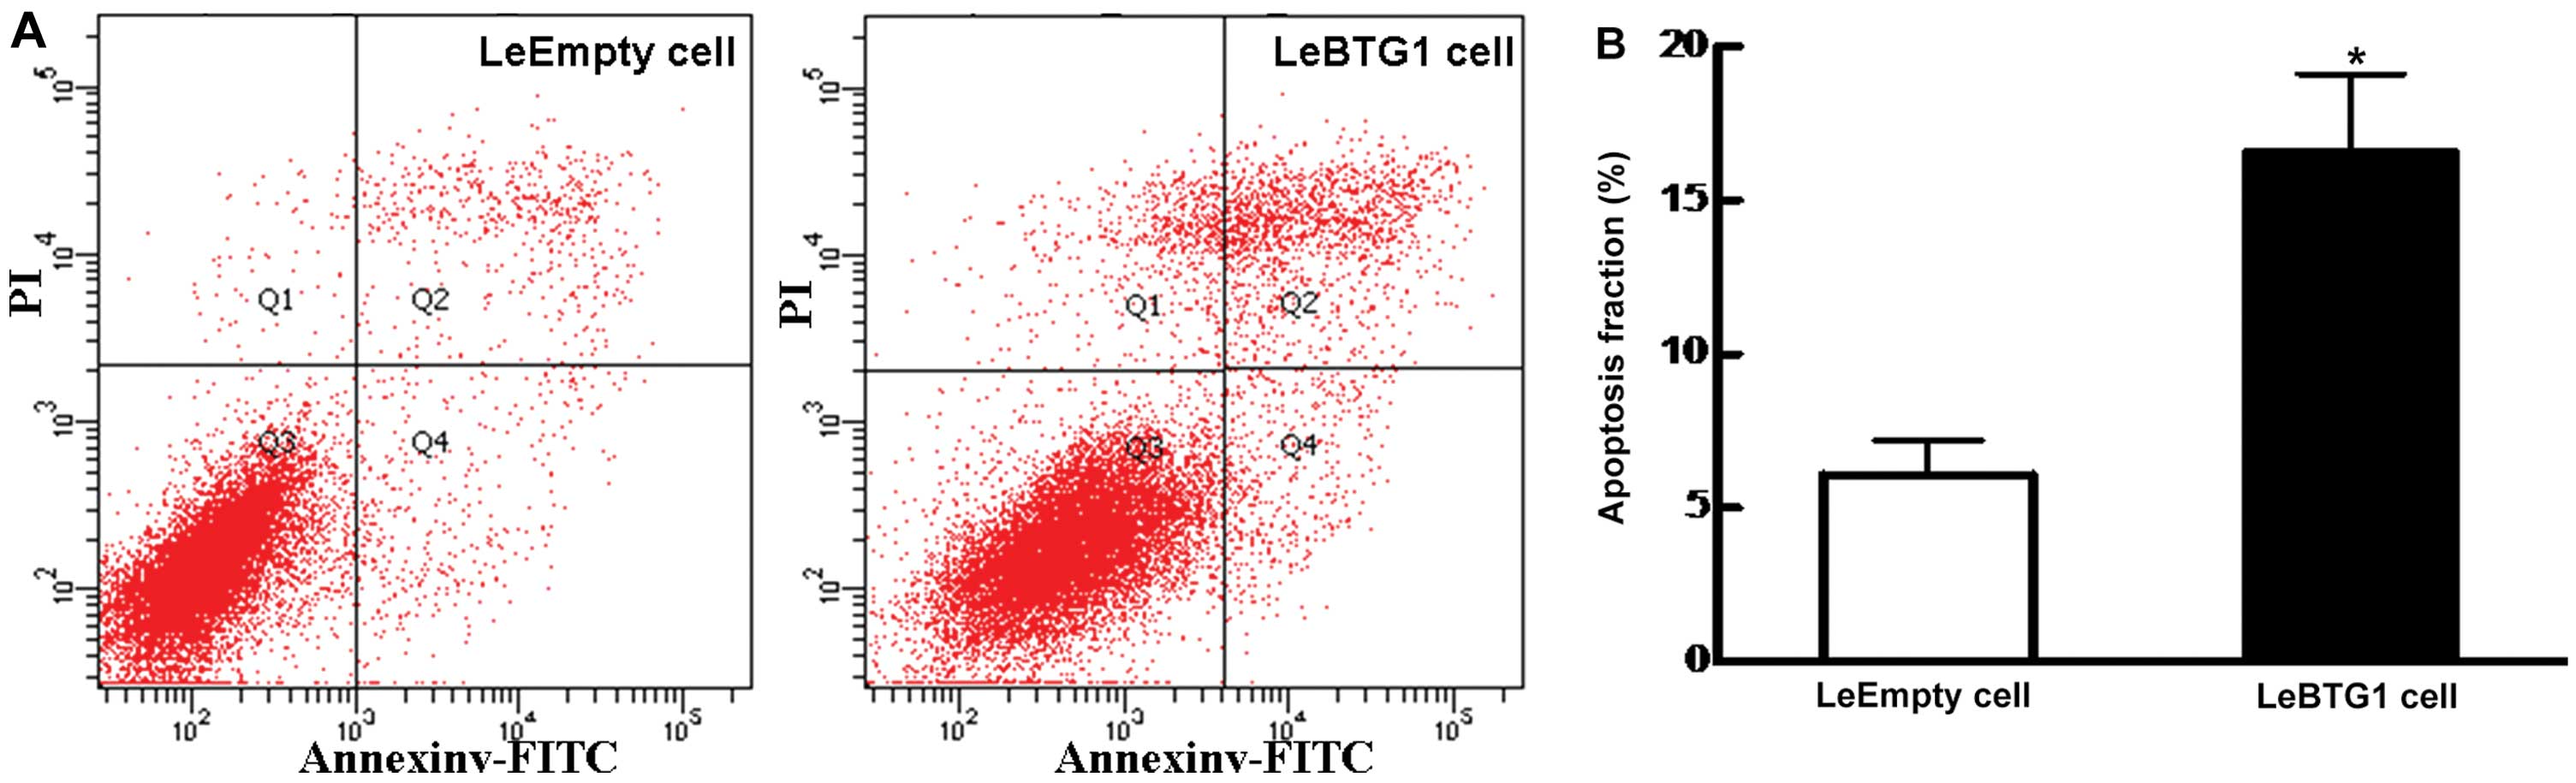
6). In addition, there was a large increase in the early
apoptosis rate in LeBTG1 cells compared to control LeEmpty cells
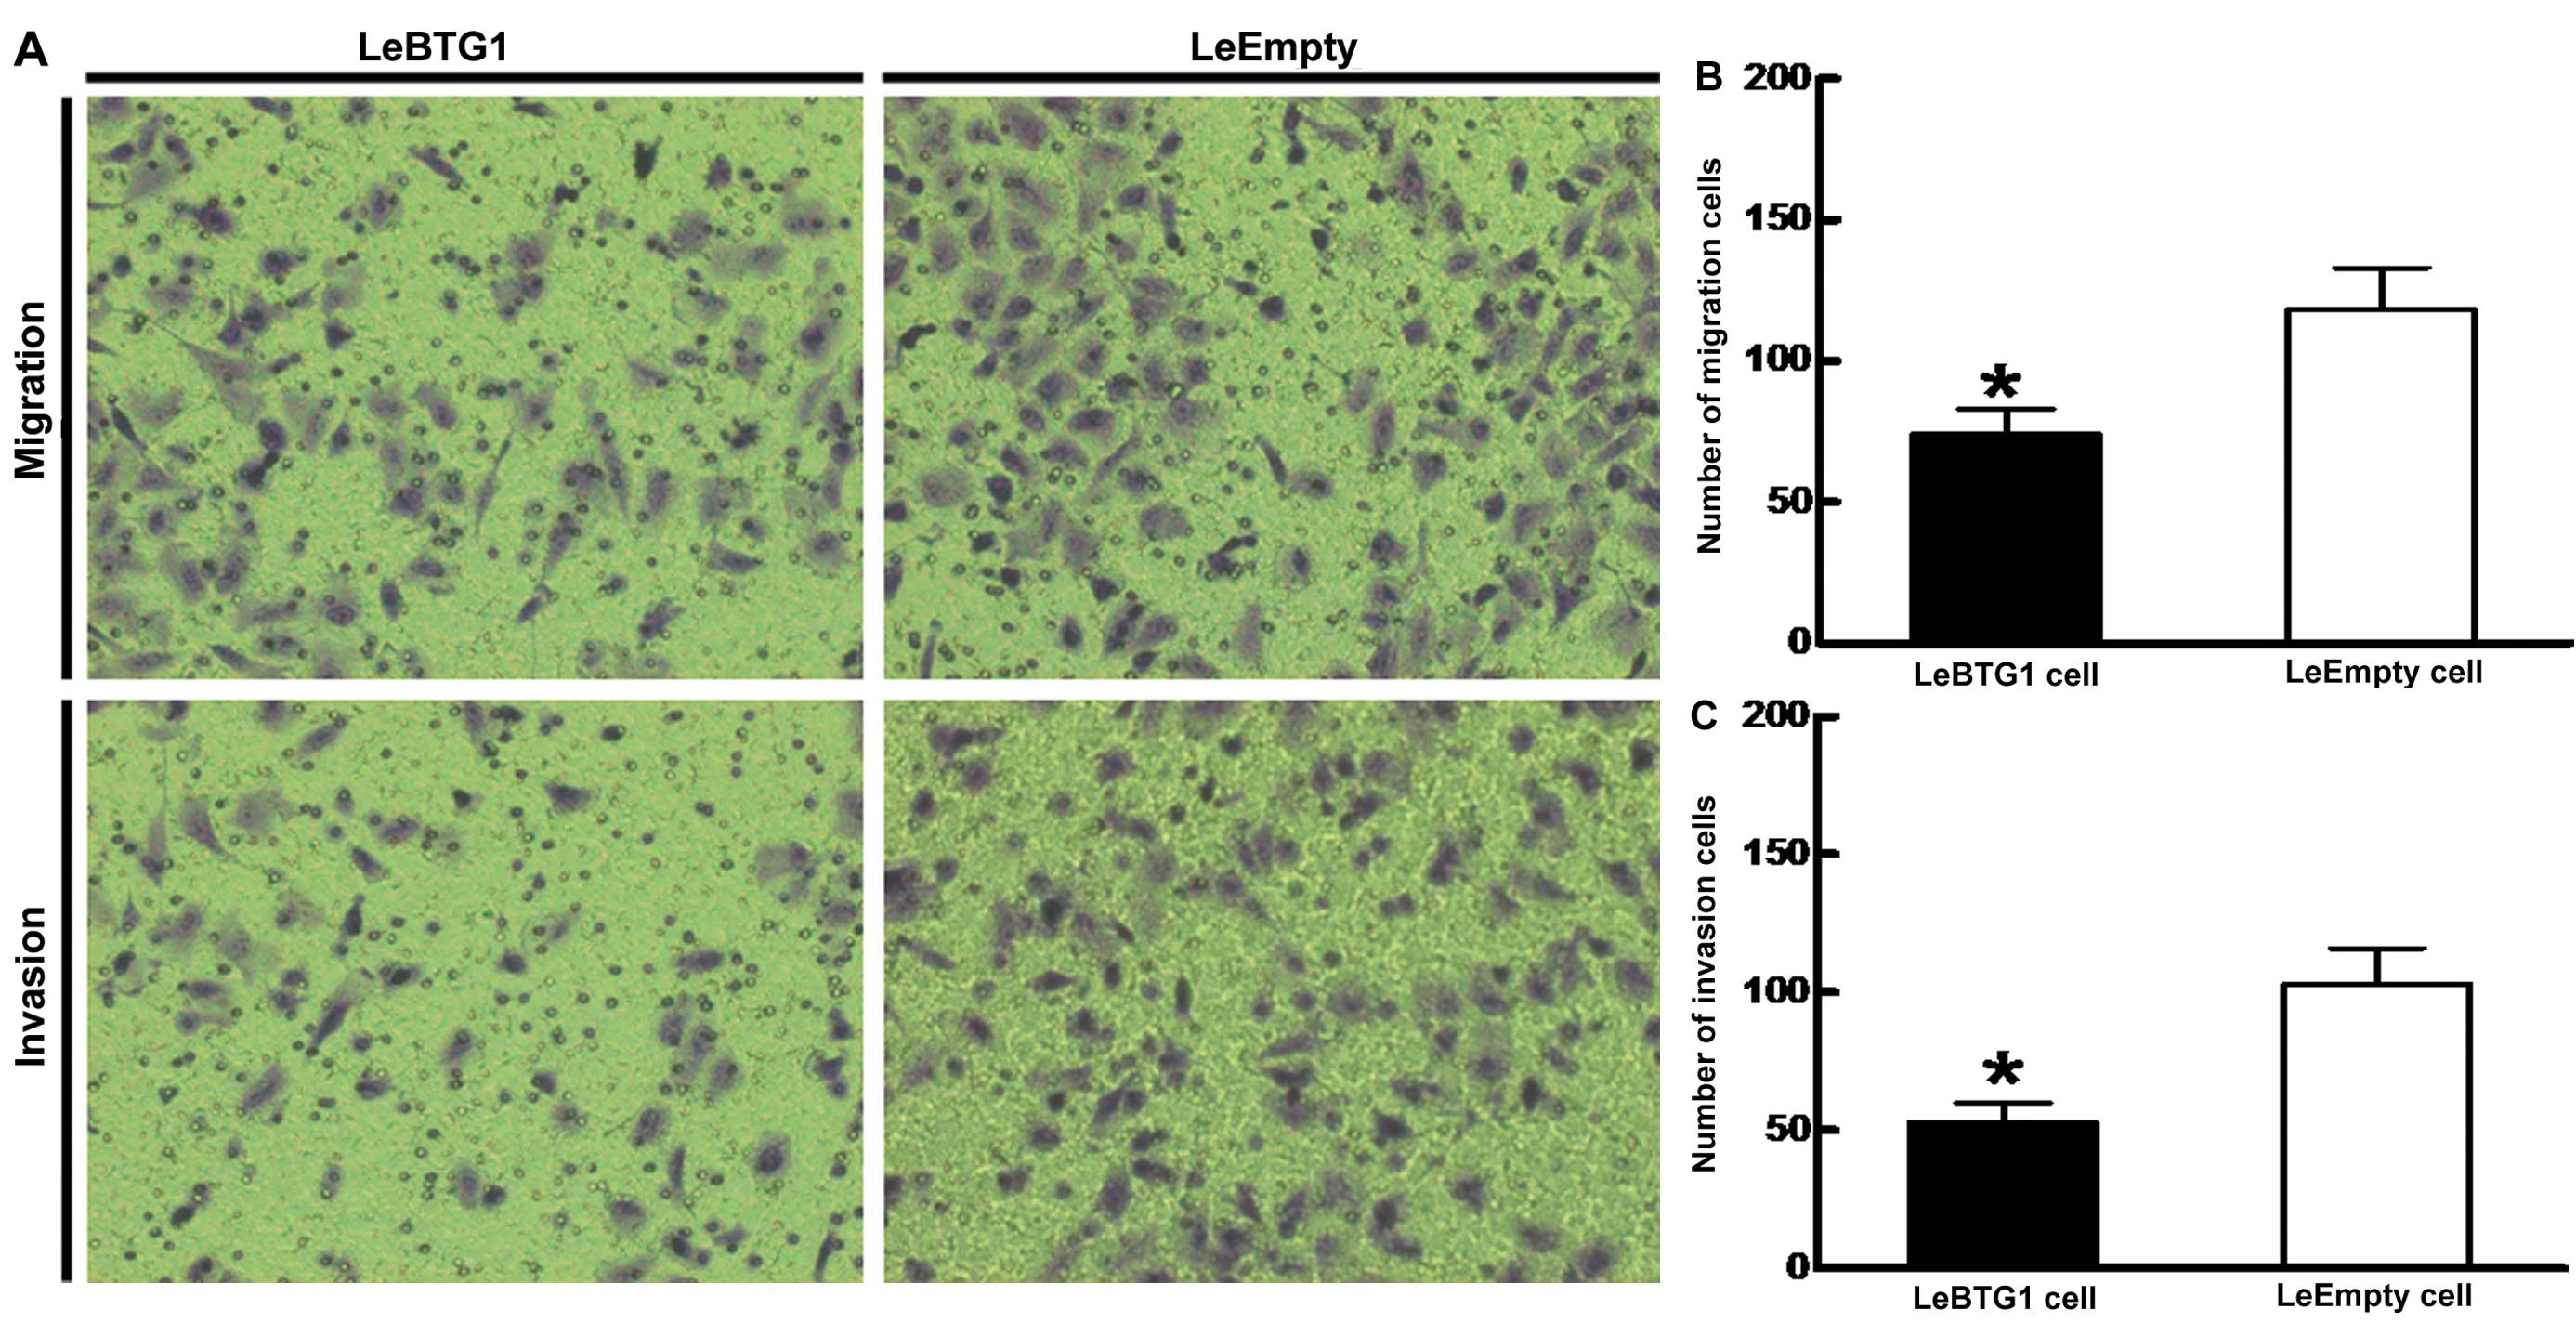
(16.6±2.5 vs. 6.1±0.7%; P<0.05) (Fig. 7). Furthermore, LeBTG1 cells had a
reduced capability for invasion and migration through Transwell
inserts (74.0±9.0 and 53.0±7.0, respectively) compared to control
LeEmpty cells (118.0±15.0 and 103.0±13.0, respectively; P<0.05)
(Fig. 8).
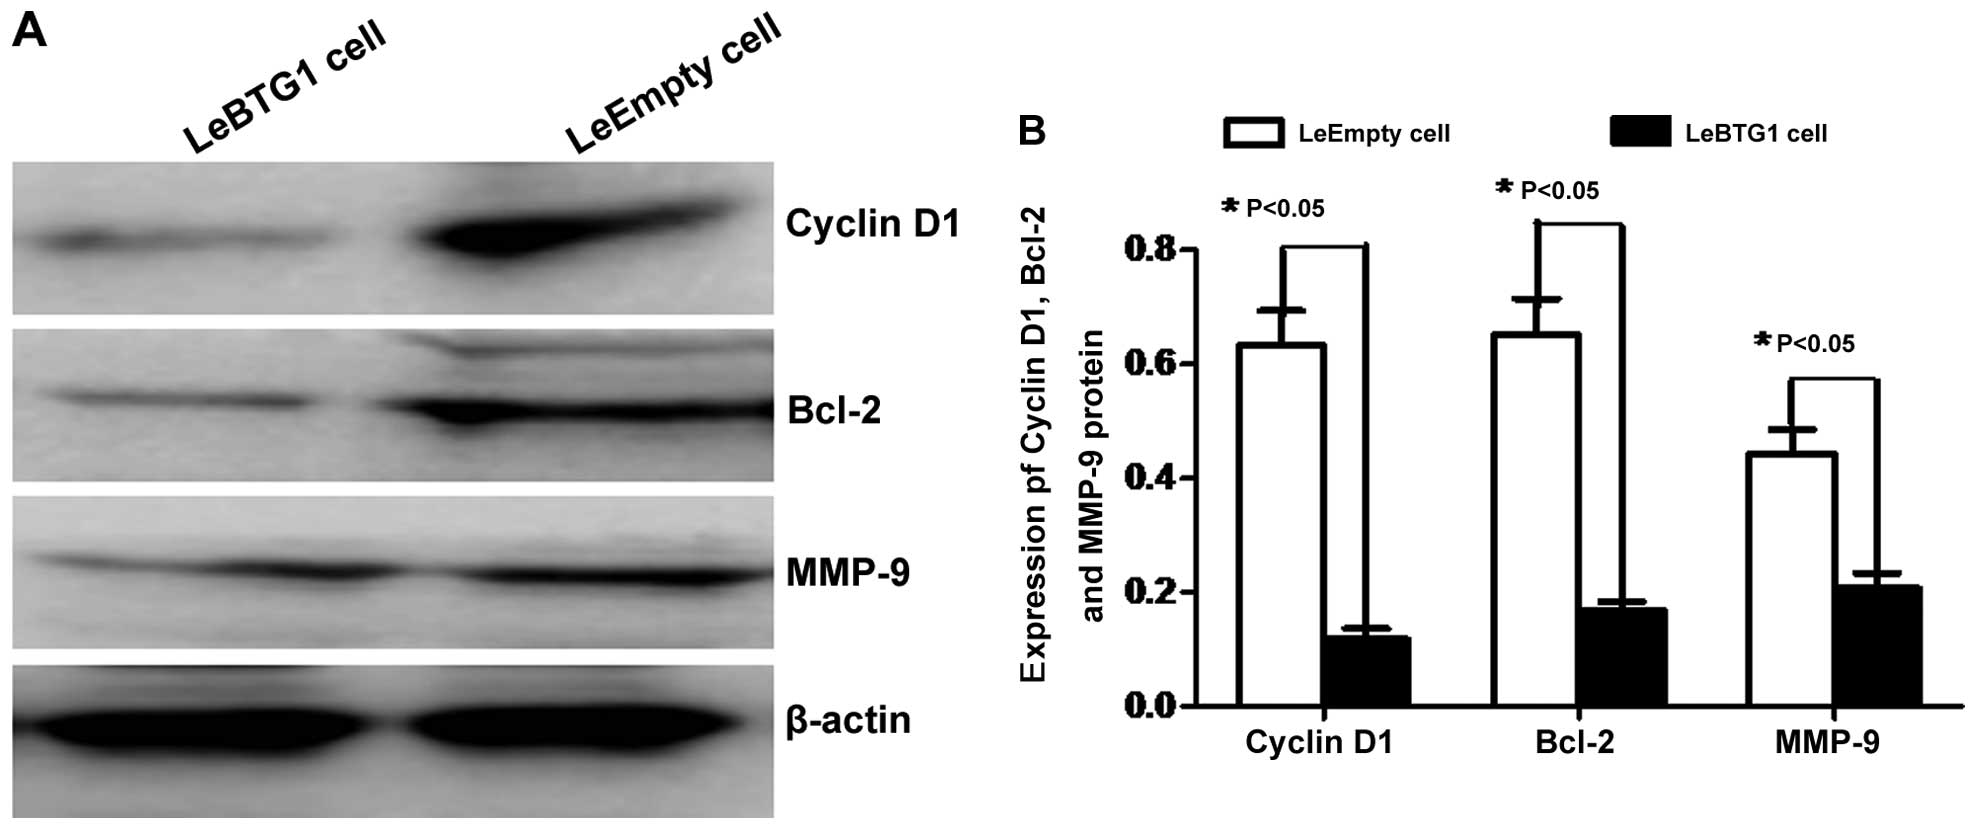
To further identify the mechanisms by which
BTG1 overexpression regulated these cellular changes in
cancer cells, expression levels of proteins critical for the
regulation of cell cycle, apoptosis and migration were examined.
Western blot analysis revealed that LeBTG1 cells had significantly
reduced levels of cyclin D1, Bcl-2 and MMP-9 (0.118±0.018,
0.169±0.015 and 0.207±0.027, respectively) compared to control
LeEmpty cells (0.632±0.061, 0.651±0.063 and 0.443±0.042,
respectively; P<0.05) (Fig.
9).
Discussion
Tumor development and progression are associated
with uncontrolled proliferation and reduced apoptosis of tumor
cells. BTG1 has been show to act as a tumor suppressor gene in
breast cancer, by inhibiting proliferation, regulating cell cycle
and inducing apoptosis (20). The
present study examined BTG1 protein expression in kidney cancer
tissue and showed that levels were significantly lower and
correlated with tumor invasion, lymph node metastasis, clinical
stage and cancer differentiation. A recent study suggests that
tumor stage is the preferred prognostic indicator (21), although prognoses can vary
considerably among patients in the same stage. Therefore, it is of
particular importance to identify reliable molecular markers for
use in clinical practice. The results of the present study indicate
that BTG1 deletion is a major contributor to the development and
progression of kidney cancer. As expression-positive patients had a
significantly higher 5-year overall survival rate, BTG1 may be a
useful prognostic indicator for patients with kidney cancer. The
combination of the tumor-node-metastasis classification system and
BTG1 expression scores may provide certain valuable information for
clinicians in choosing treatment options, and for predicting
disease severity and prognosis.
The development of kidney cancer is driven by the
abnormal proliferation of cells that normally undergo apoptosis
(22). A recent study has
indicated that overexpression of BTG1 can affect the cell cycle and
suppress tumor growth (20). The
present study utilized in vitro tests to confirm that kidney
cancer cells with a high BTG1 expression had significantly
weakened viability and proliferation potential. In addition,
BTG1 overexpression resulted in decreased protein levels of
cyclin D1, which is considered to be a proto-oncogene product that
is highly expressed or mutated in a variety of human tumors
(23). The increased BTG1
expression in kidney cancer ACHN cells resulted in a higher
proportion of cells in the G0/G1 phase,
indicating the occurrence of G0/G1
arrest and inhibition of growth. Taken together, the data implicate
BTG1 in cell cycle regulation and cyclin D1 expression.
In the present study, increased BTG1
expression in kidney cancer cells reduced the amount of the
anti-apoptotic protein Bcl-2 and induced apoptosis. Apoptosis is a
programmed death process that involves a series of changes in
relevant genes, including Bcl-2 and caspase family genes, oncogenes
such as C-myc, and the tumor suppressor gene p53 (24), and is regulated by numerous
internal and external factors (25). These results are in agreement with
previous works linking BTG1 expression with apoptosis.
Corjay et al (26)
demonstrated a high level of BTG1 expression in apoptotic
cells within macrophage-rich tissues in patients with hereditary
hyperlipidemia, and Lee et al (27) showed that BTG1 could induce
apoptosis in glioma cells. Additionally, a study by Nahta et
al (28) found that apoptosis
in kidney cancer MCF7 cells induced by Bcl-2 knockdown was
regulated by BTG1 expression. Therefore, the evidence
indicates that BTG1 can inhibit the growth of kidney cancer
cells by reducing Bcl-2 expression.
Tumor invasion and metastasis are major causes for
treatment failures, thus, the main research aims are to identify
the molecular mechanisms underlying metastasis and target key
pathways that inhibit this process. Tumor invasion and metastasis
share common molecular mechanisms and involve a number of changes
in tumor cells and the microenvironment, including altered tumor
cell adhesion properties, enhanced proliferation, survival,
chemotaxis and migration of tumor cells, lymphangiogenesis, evasion
of immune attack and hydrolysis of surrounding matrix proteins
(29). A key step in tumor
invasion and clonal growth is the remodeling of the extracellular
matrix and basement membranes through proteolytic degradation by
MMPs, which are highly expressed by tumor cells with malignant,
invasive and metastatic phenotypes. Additionally, the degree of
malignancy and patient prognosis are associated with excessive
expression of MMP-2 and MMP-9 (30,31). Tumor cells can also regulate the
expression of MMPs produced by stromal cells by secreting
chemokines, cytokines and extracellular MMP inducer, a cell surface
glycoprotein. The present study showed that
BTG1-overexpressing kidney cancer cells had decreased MMP-9
protein levels and reduced invasion and migration in vitro,
indicating that BTG1 modulated tumor cell metastasis by
downregulating MMP-9 expression.
In conclusion, the present study provides clinical
and in vitro evidence implicating BTG1 in the development
and progression of kidney cancer. The results of this study show
that BTG1 protein levels were significantly reduced in kidney
cancer biopsy specimens and were associated with disease
progression and prognosis. Furthermore, the effects on the
regulation of cancer cell proliferation, apoptosis, invasion and
metastasis indicate that BTG1 expression may serve as a prognostic
marker for kidney cancer patients.
References
|
1
|
Agathocleous M and Harris WA: Metabolism
in physiological cell proliferation and differentiation. Trends
Cell Biol. 23:484–492. 2013. View Article : Google Scholar : PubMed/NCBI
|
|
2
|
Hofmockel G: Molecular genetic principles
of tumor development and progression. Urologe A. 39:212–213.
2000.(In German). PubMed/NCBI
|
|
3
|
Shibata D and Aaltonen LA: Genetic
predisposition and somatic diversification in tumor development and
progression. Adv Cancer Res. 80:83–114. 2001. View Article : Google Scholar
|
|
4
|
Lee EY and Muller WJ: Oncogenes and tumor
suppressor genes. Cold Spring Harb Perspect Biol. 2:a0032362010.
View Article : Google Scholar : PubMed/NCBI
|
|
5
|
Okuyama T, Maehara Y, Kabashima A,
Takahashi I, Kakeji Y and Sugimachi K: Combined evaluation of
expressions of p53 and p21 proteins as prognostic factors for
patients with gastric carcinoma. Oncology. 63:353–361. 2002.
View Article : Google Scholar : PubMed/NCBI
|
|
6
|
Vadgama JV, Scuric Z, Chakrabarti R, Marzo
E, Shen D and Wu Y: Insulin-like growth factor I differentially
regulates the expression of HIRF1/hCAF1 and BTG1 genes in human
MCF-7 breast cancer cells. Int J Mol Med. 18:129–139.
2006.PubMed/NCBI
|
|
7
|
Cortes U, Moyret-Lalle C, Falette N,
Duriez C, Ghissassi FE, Barnas C, Morel AP, Hainaut P, Magaud JP
and Puisieux A: BTG gene expression in the p53-dependent and
-independent cellular response to DNA damage. Mol Carcinog.
27:57–64. 2000. View Article : Google Scholar : PubMed/NCBI
|
|
8
|
Winkler GS: The mammalian
anti-proliferative BTG/Tob protein family. J Cell Physiol.
222:66–72. 2010. View Article : Google Scholar
|
|
9
|
Rouault JP, Rimokh R, Tessa C, Paranhos G,
Ffrench M, Duret L, Garoccio M, Germain D, Samarut J and Magaud JP:
BTG1, a member of a new family of antiproliferative genes. EMBO J.
11:1663–1670. 1992.PubMed/NCBI
|
|
10
|
Rouault JP, Falette N, Guéhenneux F,
Guillot C, Rimokh R, Wang Q, Berthet C, Moyret-Lalle C, Savatier P,
Pain B, Shaw P, Berger R, Samarut J, Magaud JP, Ozturk M, Samarut C
and Puisieux A: Identification of BTG2, an antiproliferative
p53-dependent component of the DNA damage cellular response
pathway. Nat Genet. 14:482–486. 1996. View Article : Google Scholar : PubMed/NCBI
|
|
11
|
Matsuda S, Rouault J, Magaud J and Berthet
C: In search of a function for the TIS21/PC3/BTG1/TOB family. FEBS
Lett. 497:67–72. 2001. View Article : Google Scholar : PubMed/NCBI
|
|
12
|
Bozec A, Peyrade F and Milano G: Molecular
targeted therapies in the management of head and neck squamous cell
carcinoma: recent developments and perspectives. Anticancer Agents
Med Chem. 13:389–402. 2013.
|
|
13
|
Suzuki K, Nakamura K, Kato K, Hamada H and
Tsukamoto T: Exploration of target molecules for prostate cancer
gene therapy. Prostate. 67:1163–1173. 2007. View Article : Google Scholar : PubMed/NCBI
|
|
14
|
Turashvili G, Bouchal J, Ehrmann J,
Fridman E, Skarda J and Kolar Z: Novel immunohistochemical markers
for the differentiation of lobular and ductal invasive breast
carcinomas. Biomed Pap Med Fac Univ Palacky Olomouc Czech Repub.
151:59–64. 2007. View Article : Google Scholar : PubMed/NCBI
|
|
15
|
Ranganathan V and De PK: Western blot of
proteins from Coomassie-stained poly-acrylamide gels. Anal Biochem.
234:102–104. 1996. View Article : Google Scholar : PubMed/NCBI
|
|
16
|
van Meerloo J, Kaspers GJ and Cloos J:
Cell sensitivity assays: the MTT assay. Methods Mol Biol.
731:237–245. 2011. View Article : Google Scholar : PubMed/NCBI
|
|
17
|
Rasola A and Geuna M: A flow cytometry
assay simultaneously detects independent apoptotic parameters.
Cytometry. 45:151–157. 2001. View Article : Google Scholar : PubMed/NCBI
|
|
18
|
Kramer N, Walzl A, Unger C, Rosner M,
Krupitza G, Hengstschläger M and Dolznig H: In vitro cell migration
and invasion assays. Mutat Res. 752:10–24. 2013. View Article : Google Scholar
|
|
19
|
Richards RJ: Responsibility for
statistical analyses. Endocr Pract. 9:3292003.PubMed/NCBI
|
|
20
|
Zhu R, Zou ST, Wan JM, Li W, Li XL and Zhu
W: BTG1 inhibits breast cancer cell growth through induction of
cell cycle arrest and apoptosis. Oncol Rep. 30:2137–2144.
2013.PubMed/NCBI
|
|
21
|
Manjili MH, Najarian K and Wang XY:
Signatures of tumor-immune interactions as biomarkers for breast
cancer prognosis. Future Oncol. 8:703–711. 2012. View Article : Google Scholar : PubMed/NCBI
|
|
22
|
Martinez-Outschoorn UE, Pavlides S, Sotgia
F and Lisanti MP: Mitochondrial biogenesis drives tumor cell
proliferation. Am J Pathol. 178:1949–1952. 2011. View Article : Google Scholar : PubMed/NCBI
|
|
23
|
Koff A, Cross F, Fisher A, Schumacher J,
Leguellec K, Philippe M and Roberts JM: Human cyclin E, a new
cyclin that interacts with two members of the CDC2 gene family.
Cell. 66:1217–1228. 1991. View Article : Google Scholar : PubMed/NCBI
|
|
24
|
Tirone F: The gene PC3(TIS21/BTG2),
prototype member of the PC3/BTG/TOB family: regulator in control of
cell growth, differentiation, and DNA repair? J Cell Physiol.
187:155–165. 2001. View
Article : Google Scholar : PubMed/NCBI
|
|
25
|
Nicholson DW and Thornberry NA: Apoptosis.
Life and death decisions. Science. 299:214–215. 2003. View Article : Google Scholar : PubMed/NCBI
|
|
26
|
Corjay MH, Kearney MA, Munzer DA, Diamond
SM and Stoltenborg JK: Antiproliferative gene BTG1 is highly
expressed in apoptotic cells in macrophage-rich areas of advanced
lesions in Watanabe heritable hyperlipidemic rabbit and human. Lab
Invest. 78:847–858. 1998.PubMed/NCBI
|
|
27
|
Lee H, Cha S, Lee MS, Cho GJ, Choi WS and
Suk K: Role of antiproliferative B cell translocation gene-1 as an
apoptotic sensitizer in activation-induced cell death of brain
microglia. J Immunol. 171:5802–5811. 2003. View Article : Google Scholar : PubMed/NCBI
|
|
28
|
Nahta R, Yuan LX, Fiterman DJ, Zhang L,
Symmans WF, Ueno NT and Esteva FJ: B cell translocation gene 1
contributes to antisense Bcl-2-mediated apoptosis in breast cancer
cells. Mol Cancer Ther. 5:1593–1601. 2006. View Article : Google Scholar : PubMed/NCBI
|
|
29
|
Wiseman BS and Werb Z: Stromal effects on
mammary gland development and breast cancer. Science.
296:1046–1049. 2002. View Article : Google Scholar : PubMed/NCBI
|
|
30
|
Alok C and Bharat B: Nuclear factor-kappa
Band cancer: its role in prevention and therapy. Biochem Phamacol.
64:883–888. 2002. View Article : Google Scholar
|
|
31
|
Virós D, Camacho M, Zarraonandia I, García
J, Quer M, Vila L and León X: Prognostic role of MMP-9 expression
in head and neck carcinoma patients treated with radiotherapy or
chemoradiotherapy. Oral Oncol. 49:322–325. 2013. View Article : Google Scholar
|