Introduction
MicroRNAs (miRNAs or miRs) are small,
single-stranded RNA that are 18–25 nucleotides in length. They
regulate gene expression post-transcriptionally, by inhibiting
translation or degrading mRNA, based on the complementarity
base-pairing between the miRNA and the target mRNA. miRNAs
contribute to a variety of biological processes, including
proliferation, development, differentiation, apoptosis, metabolism
and cancer development (1–4).
The tissue specificity and temporal expression of miRNAs provide a
basis for them as diagnostic and prognostic markers of disease,
which has been confirmed in cancer research (5–7).
Previous studies have indicated that miRNAs have an
important regulatory role during the osteogenic differentiation of
mesenchymal stem cells (MSCs). Gao et al (8) analyzed the miRNA expression profile
during the differentiation of human MSCs and identified that 4
miRNAs were downregulated and 3 were upregulated. Using a
bioinformatics analysis, the investigators found that the
corresponding target genes of the miRNAs downregulated during
osteogenic differentiation, i.e., miRNA-31,
miRNA-106a and miRNA-148a, were RUNX2,
CBFB and BMP. Additionally, Zeng et al
(9) identified that
miRNA-100 affected the differentiation of stem cells towards
osteogenesis by regulating its target gene, BMPR2. Eskildsen
et al (10) reported that
miRNA-138 prevented the osteogenic differentiation of
MSCs.
During steroid-induced femoral head necrosis, the
proliferative capacity (11) and
osteogenic differentiation capacity of the MSCs of the femoral head
are reduced (12). As observed in
in vivo experiments, while low doses of glucocorticoids are
required to induce the osteogenic differentiation of stem cells,
high-doses of glucocorticoids prevented proliferation and
osteogenic differentiation (13,14) through glucocorticoid receptor (GR)
and AP-1; the ectopic expression of RUNX2 could partially
reverse these effects (15).
While the effects of glucocorticoids and miRNAs on
MSCs have already been reported, to the best of our knowledge,
there have been no definite reports on whether glucocorticoids can
alter the expression of miRNAs during the differentiation of MSCs,
thus regulating osteogenic differentiation at the
post-transcriptional level.
Materials and methods
Ethics statement
All the procedures followed were in accordance with
the ethical standards of the responsible committee on human
experimentation (Peking Union Medical College Hospital Ethics
Committee, Beijing, China) and with the Helsinki Declaration of
1975, as revised in 2000. Informed consent was obtained from all
the patients included in the study.
Separation and culture of human MSCs
The marrow samples in the study were obtained from
the 3 patients who underwent surgery for total hip arthroplasty due
to hip osteoarthritis.
The separation of MSCs in the myeloid tissue was
performed as described by Pittenger et al (16). A sterile marrow puncture needle
and a 10-ml syringe were used to extract myeloid tissue from the
side of the femur. The sample was transferred into a test tube with
culture medium and heparin (4,000 U/ml) for anticoagulation,
diluted with an equal volume of phosphate-buffered saline (PBS) and
mixed. The mixture was allowed to stand for 30 sec, after which the
sediment was discarded and an equal quantity of 1.077 g/ml
lymphocyte-separating medium (Mediatech, Herndon, VA, USA) was
added. The samples were centrifuged at 778 × g for 20 min, and the
monocytes that were present at the white middle layer were
carefully collected. The monocytes were washed with 10 ml D-Hank's
solution and collected following centrifugation at 280 × g for 6
min. The cells were resuspended at a density of 2×10⁶
cells/ml in nutrient solution containing 58% Dulbecco's modified
Eagle's medium (DMEM)/F12, 40% MCDB-201, 2% fetal calf serum, 10
ng/ml EGF, 10 ng/ml PDGF, 1X insulin-transferrin-selenium, 1X
linoleic acid-bovine serum albumin (BSA), 50 µM
β-mercaptoethanol, 2 mM L-glutamine, 100 µg/ml penicillin
and 100 U/ml streptomycin sulfate. After 2 days, the cells that
were not attached were discarded and half the growth media was
replaced every 3 days. When the cells reached 70–80% confluence,
they were detached using 0.25% trypsin and 0.01% EDTA, and were
reseeded at a ratio of 1:3.
Immunophenotyping of cells
Following the digestion of the MSCs with pancreatin,
the cells were resuspended in PBS with 0.5% BSA. Primary antibodies
were added and the samples were incubated at 4°C for 30 min. The
following primary monoclonal mouse anti-human antibodies were used:
Cluster of differentiation 29 (CD29, mouse, Cat. no. 555442; BD
Biosciences), CD34 (mouse, Cat. no. 550760, BD Biosciences), CD44
(mouse, Cat. no. 550988; BD Biosciences), CD105 (mouse, Cat. no.
M3527; DAKO), HLA-DR (mouse, Cat. no. 555810; BD Biosciences) and
Flk-1 (mouse, Cat. no. sc-6251; Santa Cruz Biotechnologies). To
detect the intracellular antigen Flk-1, the cells were fixed in 1%
paraformaldehyde at 4°C for 15 min prior to incubation with the
primary antibody and were dried with 0.1% escin at room
temperature. An immunoglobulin G antibody of a similar isotype was
used as the negative control. Subsequent to washing the cells with
PBS, the secondary antibody conjugated with fluorescein
isothiocyanate was added, and the samples were incubated at 4°C for
30 min. Finally, the cells were washed twice, resuspended in 500
µl PBS and analyzed by flow cytometry (FCM).
Induction of differentiation
Third-generation MSCs were seeded at a cellular
density of 2×10⁴ cells/cm2 in
25-cm2 (T25) culture flasks for RNA extraction or in
24-well plates for staining. The cells were allowed to adhere
overnight. When they reached 70 or 80% confluence, the osteogenic
induction culture solution (10% FBS, 10 nM dexamethasone, 0.2 mM
ascorbic acid and 10 mM sodium β-glycerophosphate in H-DMEM culture
medium) was replaced with 10−7 or 10−9 mol/l
of dexamethasone, respectively. Half the solution was replaced
every 2 days. The cells grown in the T25 culture flasks were
collected 0, 6 and 12 days after the induction of differentiation.
RNA was extracted from the cells, and the expression of osteogenic
phenotype marker genes were measured by quantitative polymerase
chain reaction (PCR). On days 6 and 12, the calcification and
mineralization matrix of the differentiated cells in the 24-well
plates were assessed by alkaline phosphatase and alizarin red.
Additionally, third-generation MSCs were seeded at a
cellular density of 2×10⁴ cells/cm2 in a T25
culture flask, allowed to adhere overnight and grown to 70 or 80%
confluence. After 48 h of stimulation with 10−7 and
10−9 mol/l dexamethasone, respectively, the cells were
lysed in TRIzol for RNA extraction. The extracted RNA was
sequenced.
Cellular staining
For alkaline phosphatase staining (adopt kit;
Tianjin Blood Research Institute, Chinese Academy of Medical
Sciences), a droplet of no. 1 liquid was added to each sample in a
24-well plate and the samples were incubated at room temperature
for 1 min. The samples were subsequently rinsed with running water
for 2 min and dried. Action liquid was added, and the samples were
incubated at 37°C for 2 h, following which they were washed under
running water for 2 min. No. 5 liquid was added and the samples
were incubated for 5 min, following which they were washed under
running water for 2 min and dried. For alizarin red staining, the
24-well plates were washed twice in PBS, fixed with 95% ethanol,
washed with double-distilled water three times, and subsequently,
0.1% alizarin red-Tris-HCl (pH 8.3) was added. The samples were
incubated at 37°C for 30 min, following which they were washed with
distilled water, dried and sealed.
RNA extraction
RNA was extracted from the cells according to the
manufacturer's instructions for extracting total RNA using the
TRIzol™ reagent nucleic acid separation kit (Gibco/BRL, Grand
Island, NY, USA). The optical density values of the RNA sample were
measured at 260 and 280 nm using a NanoDrop biological
spectrophotometer to determine the concentration of the DNA sample
and to assess the quality of the sample. The
A260/A280 value of the purified RNA sample
should be 1.8–2.0. A value >2.0 indicates that the RNA is
contaminated; a value <1.8 indicates that the phenol or proteins
were not completely eliminated from the sample.
Extraction of small RNA and construction
of the cDNA library
Following mixing, 2 µl SRA Ladder and 2
µl SRA Gel Loading dye (Illumina, Inc., San Diego, CA, USA)
were placed in a 200-µl centrifuge tube, heated for 65°C for
5 min, and centrifuged at 18,000 × g at room temperature for 10 sec
after cooling on ice. The SRA ladder and the sample RNA were loaded
onto the same gel and electrophoresed for 1 h at 200 V, following
which the gel was placed into a sterile chamber and stained with
TBE/ethidium bromide for 2 min. The gel was visualized using a UV
transilluminator. According to the ladder markings, the portion of
the gel corresponding to RNA with a length of 18–30 nucleotides was
excised and placed into a microcentrifuge tube. The sample was
centrifuged at 20,000 × g at roomtemperature for 2 min, mixed with
300 µl 0.3 mol/l sodium chloride solution and incubated at
room temperature for 4 h to elute the RNA. The sample was
subsequently transferred to a Spin X cellulose acetate filtration
column and was centrifuged at 20,000 × g at room temperature for 2
min. Following this, l µl glycogen and 750 µl
absolute ethyl alcohol at room temperature were added to the Spin X
filtrate, and the RNA was allowed to precipitate at −80°C for 30
min. The sample was centrifuged at 20,000 × g at 4°C for 25 min,
following which the supernatant was removed and the RNA pellet was
washed with 750 µl 75% ethanol at room temperature. The RNA
pellet was dried and resuspended in 5.7 µl RNase-free
water.
The small RNA that was isolated was ligated at the
5′ and 3′ terminals and mixed with 0.5 µl SRA for reverse
transcription. The sample was heated at 65°C for 10 min and cooled,
and 2 µl 5X first-strand buffer solution, 0.5 µl 12.5
mM dNTP mix, 1 µl 100 mM dithiothreitol and 0.5 µl
RNA enzyme inhibitor were added. The sample was heated at 48°C for
3 min in a thermal cycler, and 1 µl SuperScript II reverse
transcriptase was added. The sample was incubated at 44°C for 1 h
in a thermal cycler. Finally, 40 µl PCR Master mix was added
to 10 µl single-stranded reverse transcription cDNA.
miRNA high-throughput sequencing
The standard procedures for the Illumina HiSeq 2000
sequencing platform were performed.
Bioinformatics analysis
The data from 6 samples were obtained through
high-throughput sequencing and were subjected to further analysis.
The Burros-Wheeler Aligner software was used to exclude rRNA, tRNA
and other non-coding RNAs, and the remaining sequences were
cross-referenced to the Blast database to identify known miRNA
genes. The miRBase 18.0 database and PatScan were used to compare
the data and generate statistics for the trusted platform module
(TPM) values of the mature miRNAs. These data represent the
relative expression of the miRNAs and are obtained by dividing the
total sequencing number by an absolute expression quantity by
100,000 times.
The 6 samples were divided into 3 groups,
representing the control MSCs and the cells treated with
10−7 and 10−9 mol/l dexamethasone. The TPM
values of the 3 conditions were compared. P-values were calculated
using the χ2 method, and P-values <0.05 were
considered to indicate a statistically significant difference. As
such, miRNA expression differences resulting from a high
concentration of dexamethasone (10−7 mol/l) and a
physiological concentration of dexamethasone (10−9
mol/l) were obtained. The miRNA expression pattern differed among
the 3 groups, and candidate miRNAs that were differentially
regulated among individuals were also excluded.
Differentially expressed candidate miRNA were
screened using online software databases, miRBase, miRDB,
TargetScan and PicTar, to analyze the possible target sites of the
miRNAs and their possible regulatory effects.
Results
Characteristics and phenotype of
MSCs
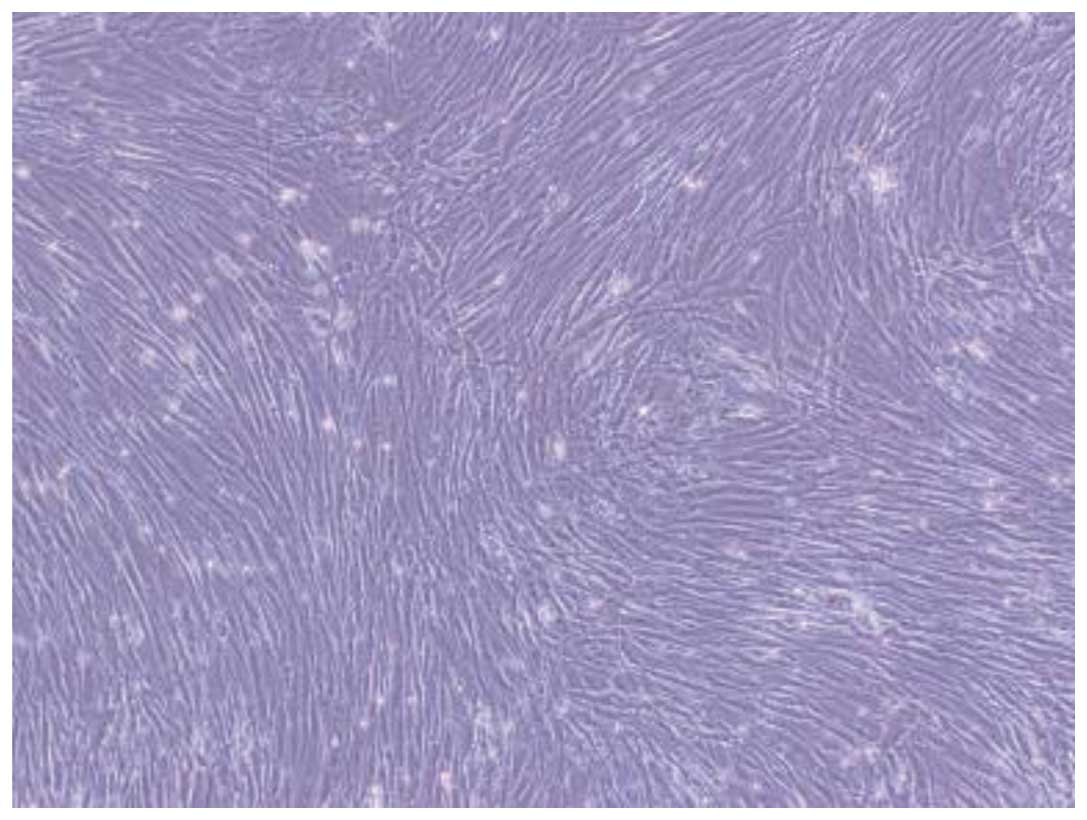
The cells obtained from lymphocyte separation medium
were round. Half of the growth media was replaced every 72 h.
Single fusiform adherent cells and a few red cells were observed.
With increased duration of culture, the number of adherent cells
with long, fusiform cellular morphology increased rapidly. A few
colonies of cells showed typical fibroblast morphology. The cells
grew rapidly, reaching 70–80% confluence after 8–12 days. To expand
the cultures, the monolayers were digested by trypsin and reseeded.
These cells grew well and preserved the primary morphology of the
parent cells (Fig. 1).
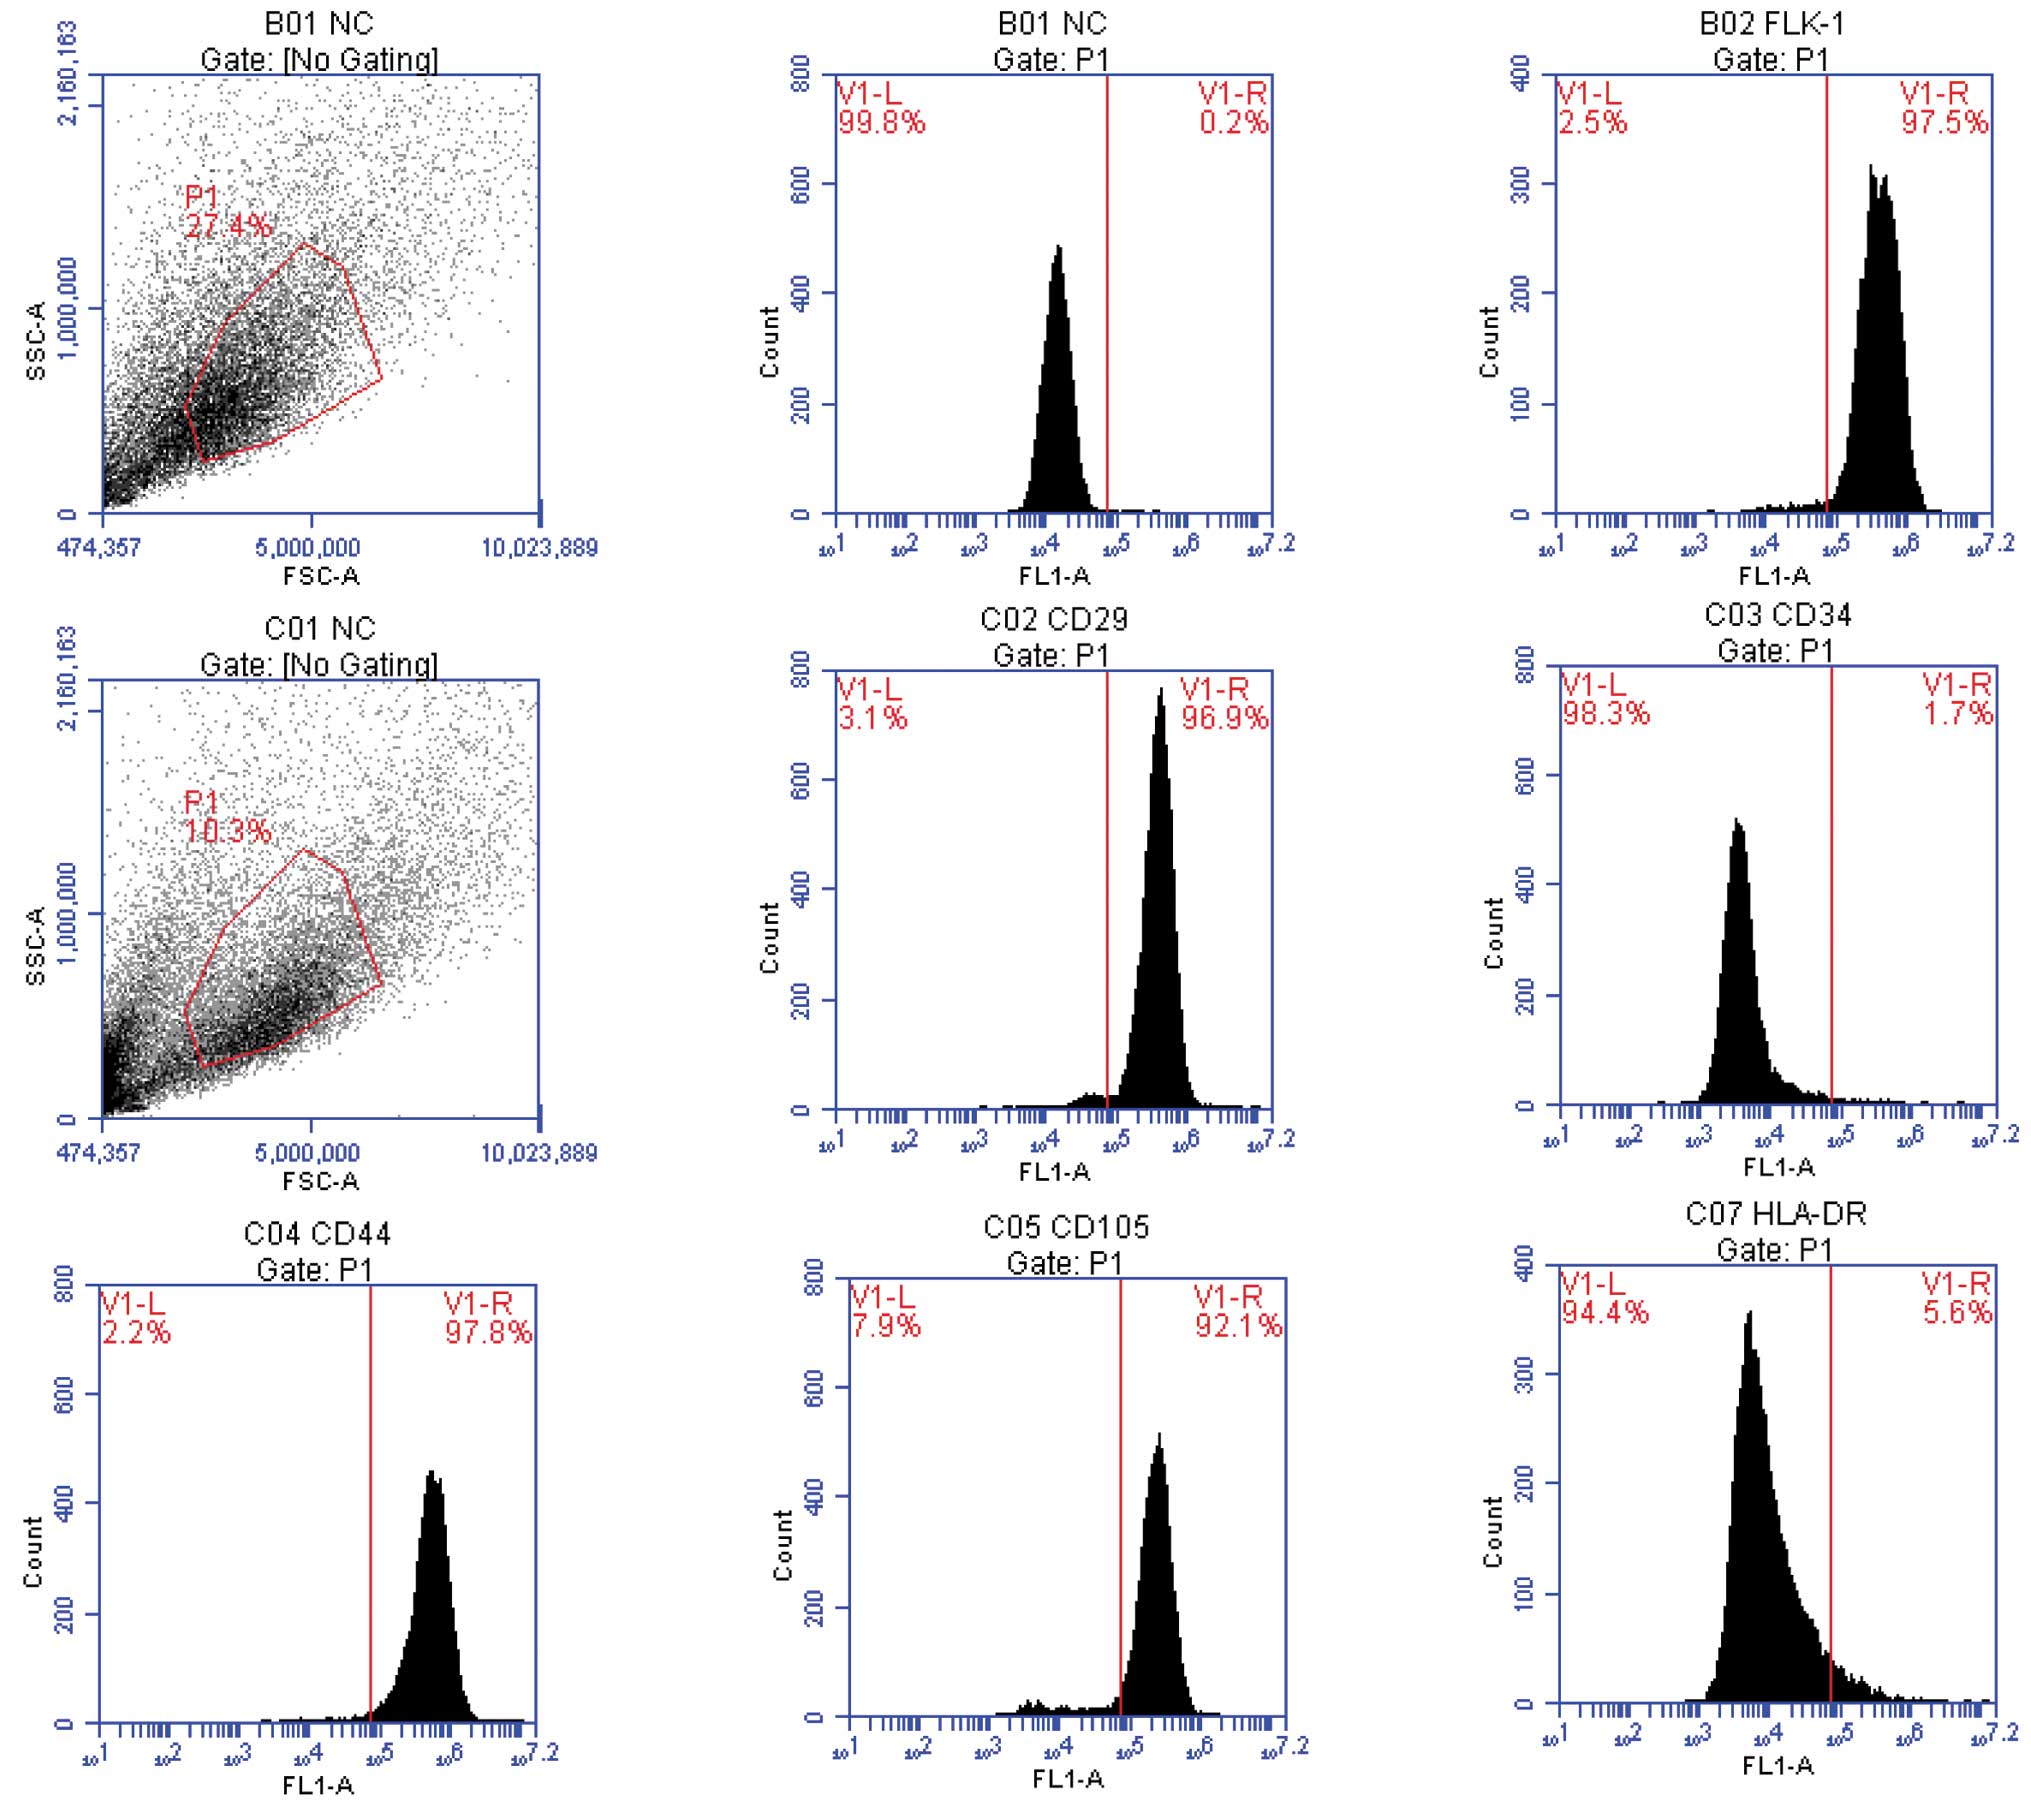
As it is difficult to identify the MSCs using a
simple cellular marker, the obtained cells were assessed by FCM
(Fig. 2). The BMSCs uniformly
expressed CD29, CD44 and Flk-1 and were negative for CD34 and
HLA-DR.
Effects of different dexamethasone
concentrations on osteogenic capacity
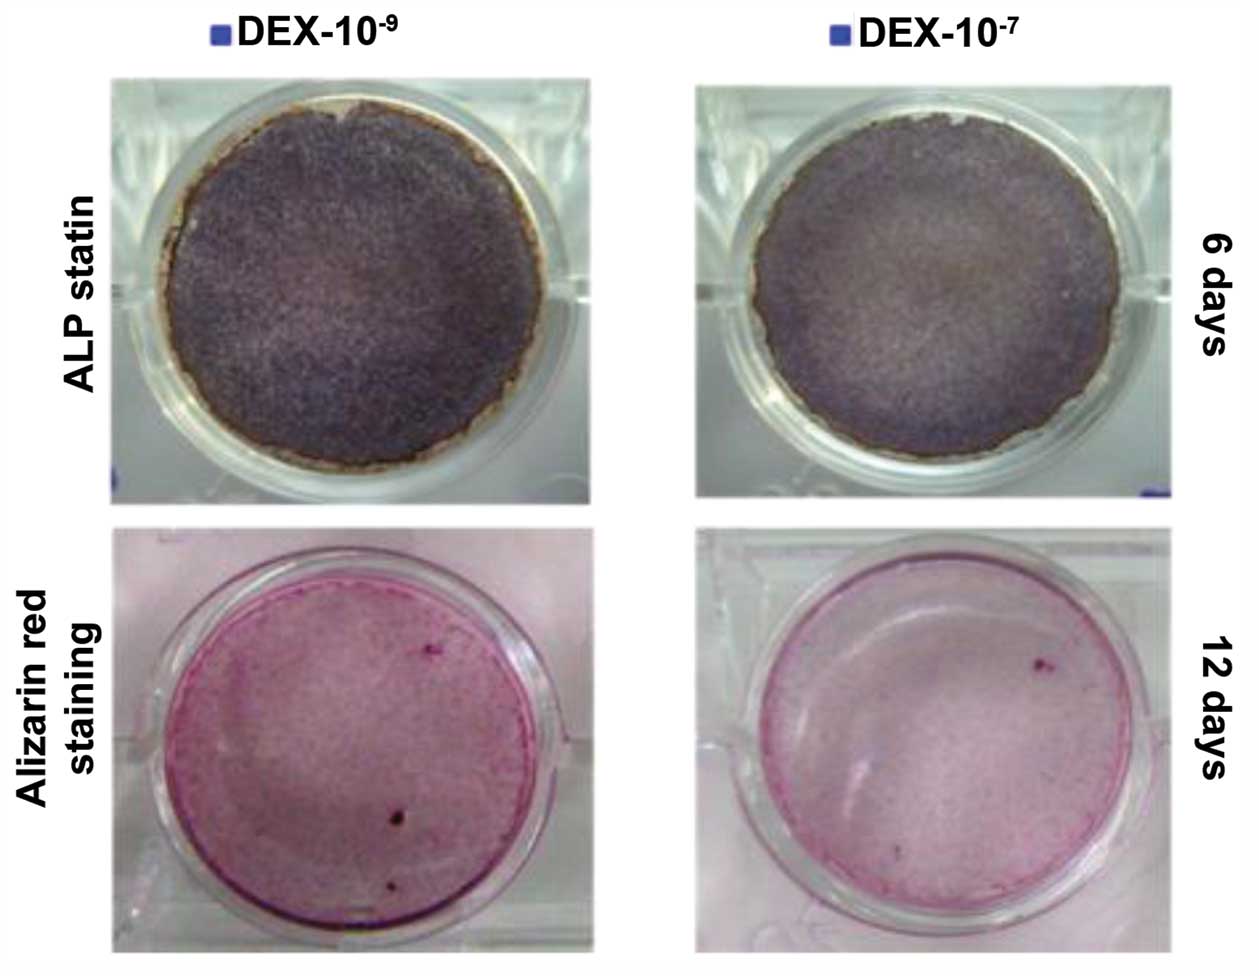
The staining for alkaline phosphatase and alizarin
red showed positive results. In particular, for the alkaline
phosphatase staining, blue sediments were observed in the cells;
for the alizarin red staining, mineralized nodules in the
extracellular matrix were stained orange. The osteogenic capacity
of 10−9 mol/l dexamethasone was stronger compared to
that of 10−7 mol/l dexamethasone, as indicated by a
significant increase in intracellular and extracellular mineralized
nodules and more intense staining. The intensity of the staining
increased with treatment time (Fig.
3).
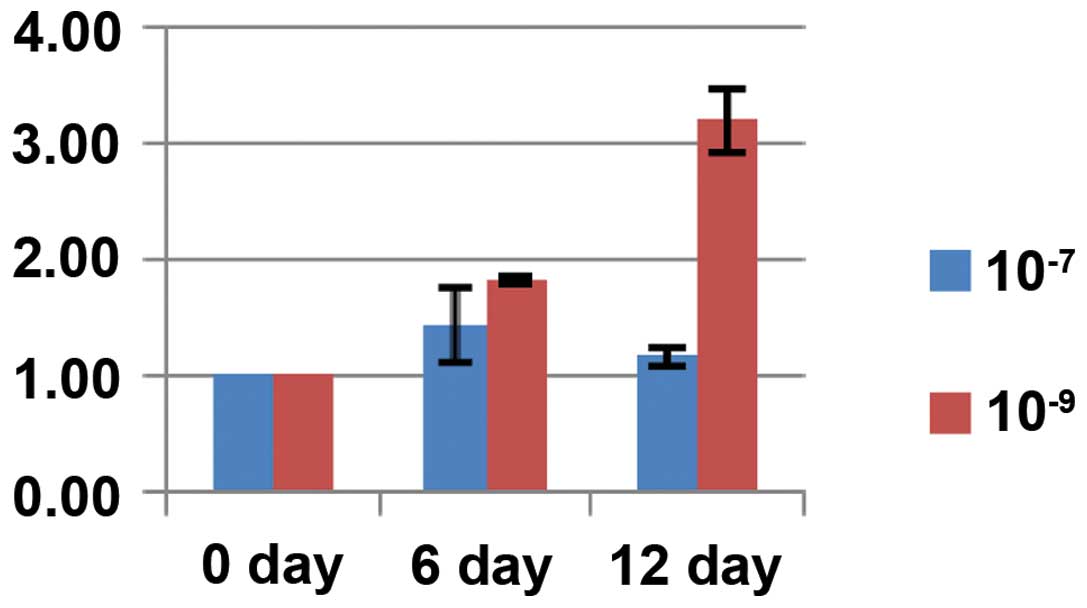
Differences in the expression of relevant
osteogenesis genes
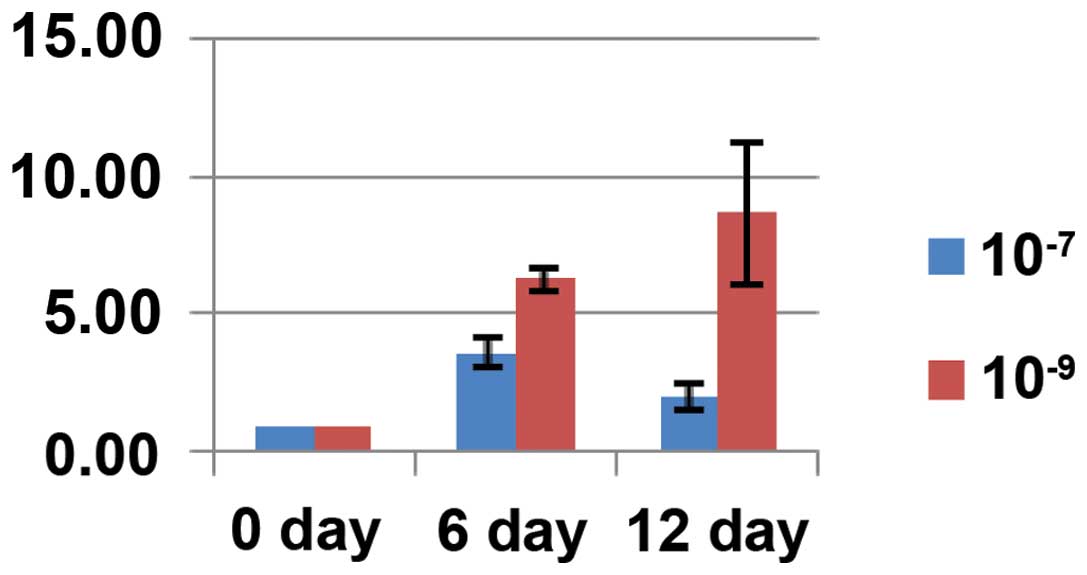
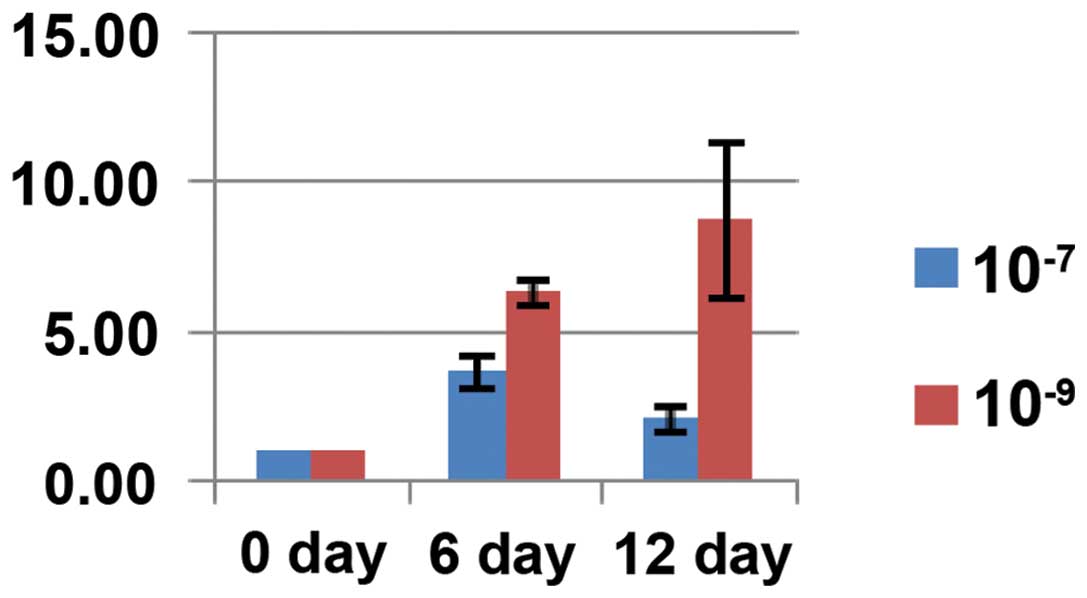
The expression of the genes associated with
osteogenesis, such as OC, OPN and Runx2,
increased with time following dexamethasone induction. The
expression of these genes was higher in the cells treated with
10−9 mol/l dexamethasone compared with the cells treated
with 10−7 mol/l dexamethasone, reaching 2.73-, 4.34- and
2.36-fold higher expression, respectively. These results were
statistically significant (P<0.05) (Figs. 4Figure 5–6).
High-throughput sequencing result and
analysis
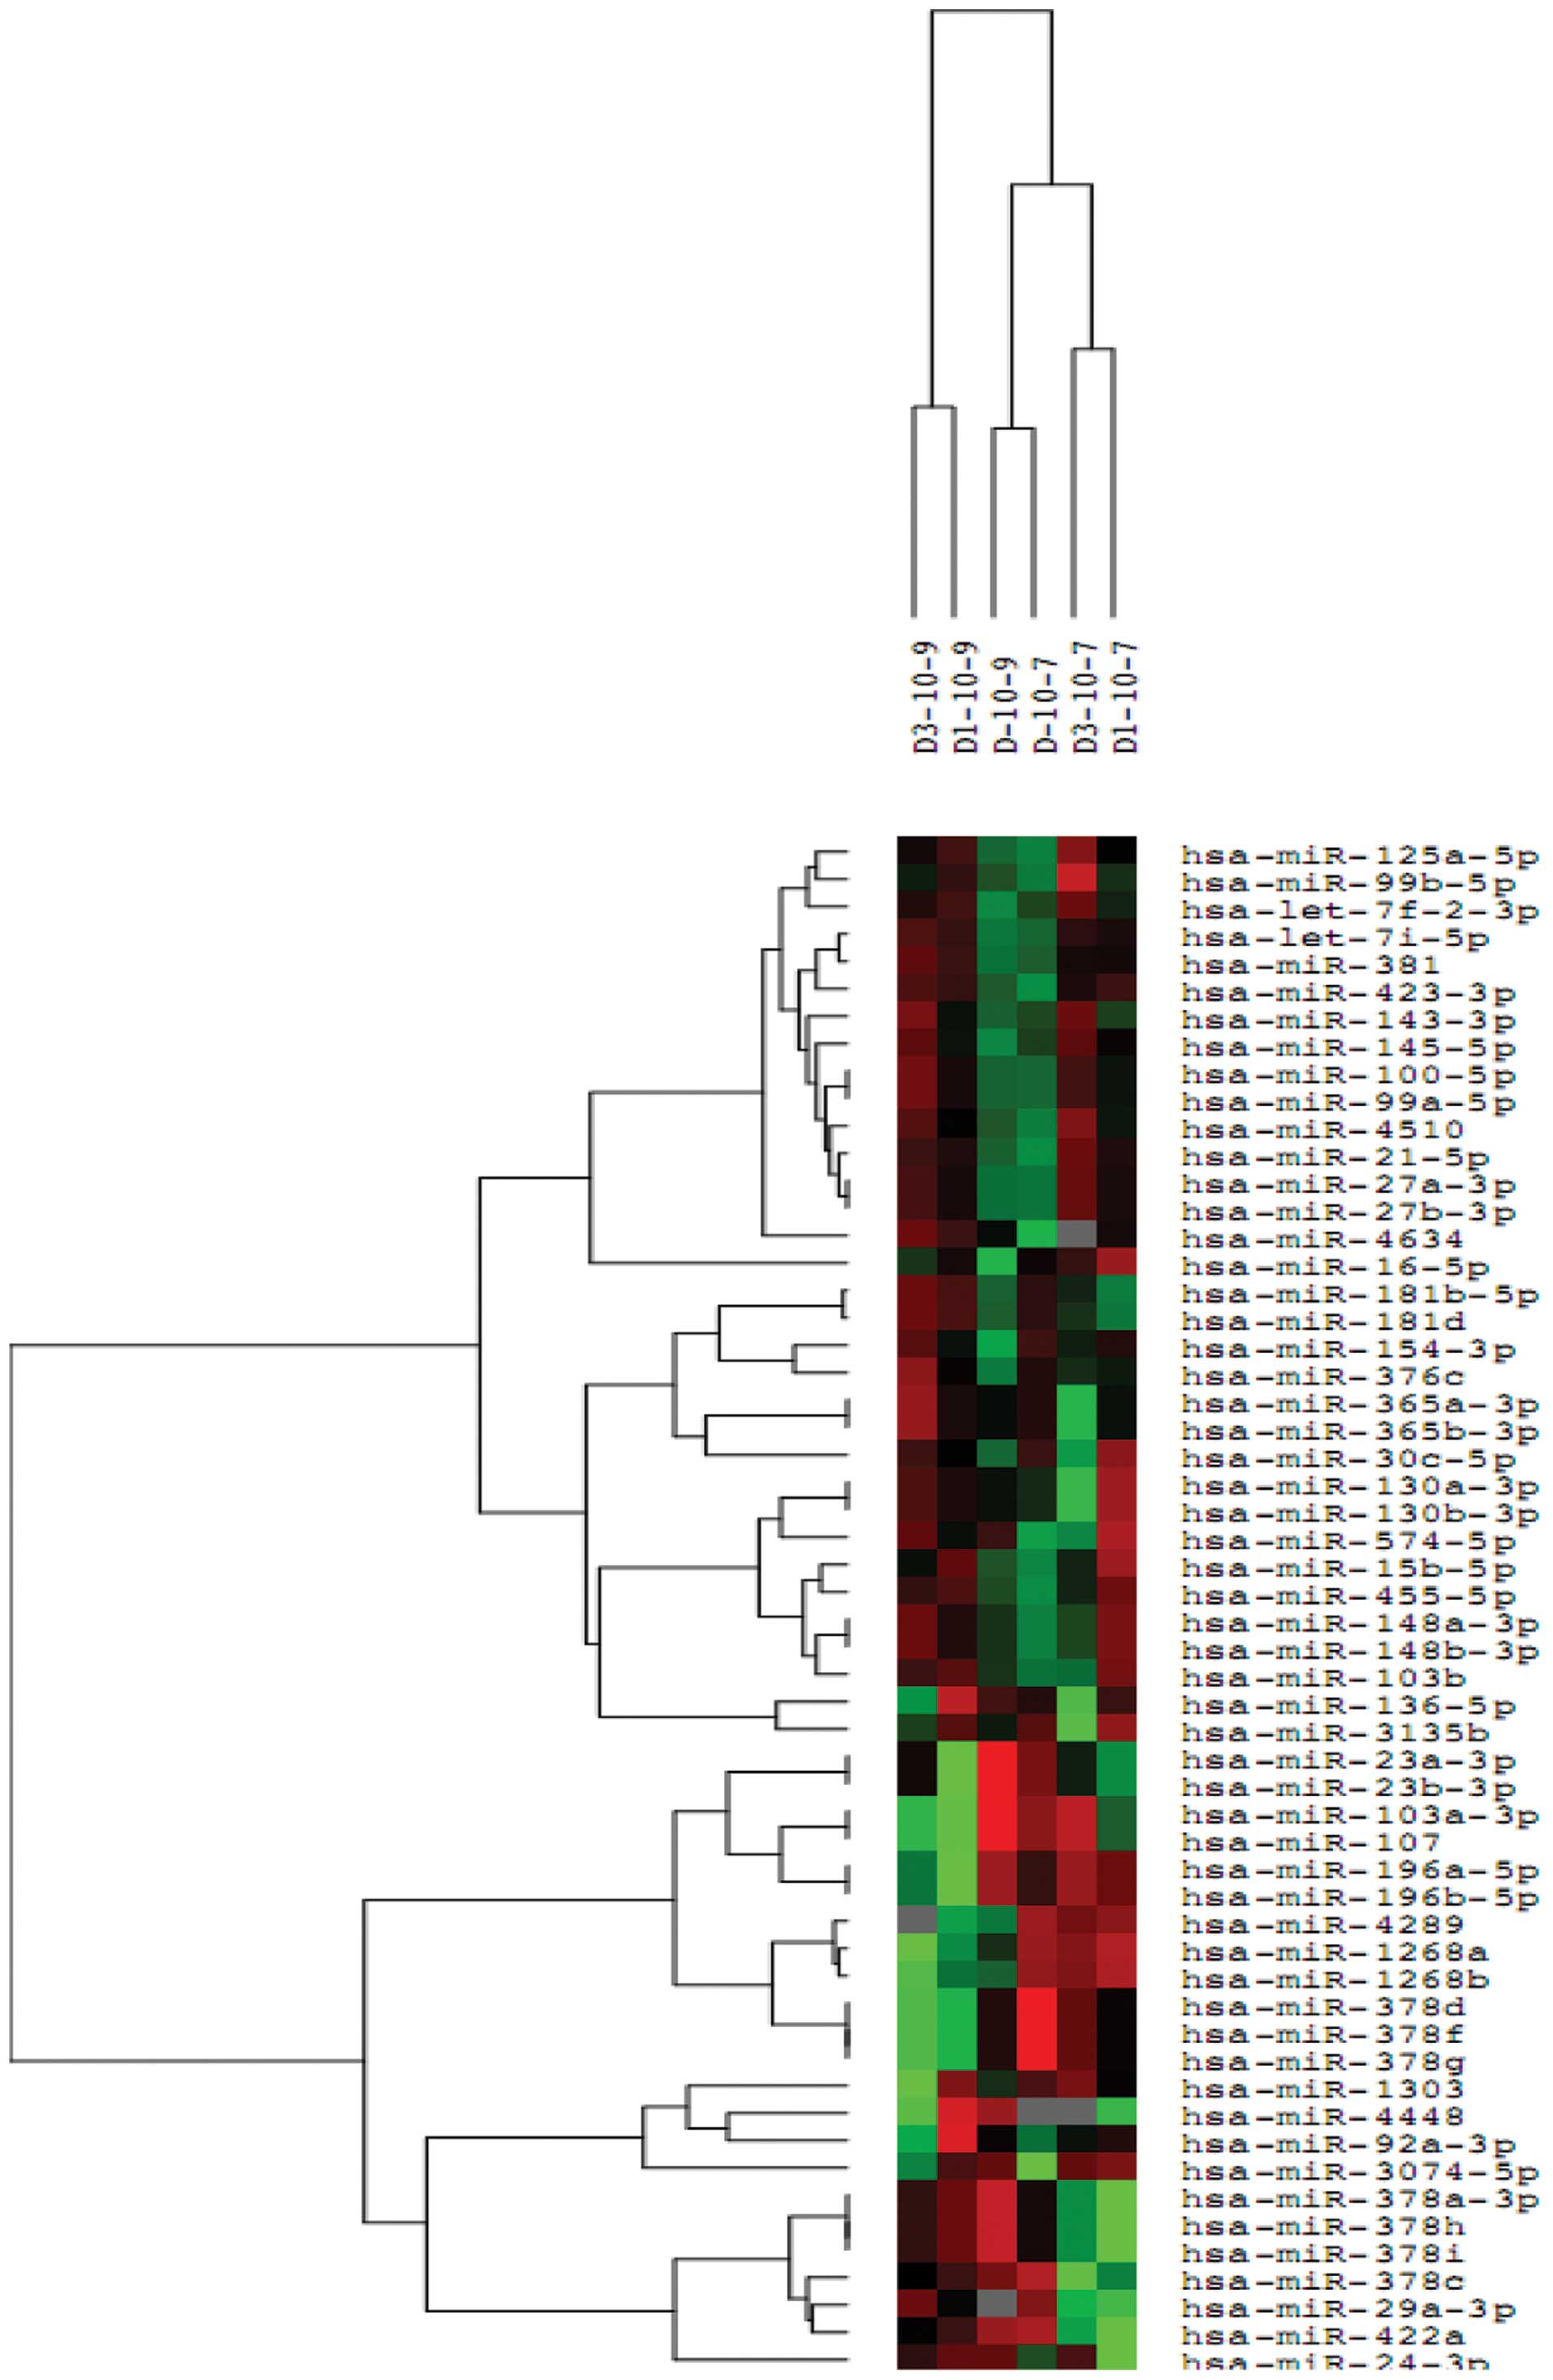
Following the normalization of the sequencing data,
the miRNA expression differences (P<0.05) between the control
cells and cells treated with 10−7 mol/l or
10−9 mol/l dexamethasone were assessed. The statistical
significance between the groups was obtained from the triplicates
of each group (Fig. 7).
The miRNA expression profile of MSCs was altered by
treatment with 10−9 and 10−7 mol/l
dexamethasone. A total of 16 miRNAs were consistently changed in
the triplicates of each condition. Compared to treatment with
10−9 mol/l dexamethasone, 11 miRNAs were upregulated and
6 were downregulated following treatment with 10−7 mol/l
dexamethasone (Table I).
 | Table IChanges in the miRNA expression
profile of human mesenchymal stem cells following treatment with
10−7 or 10−9 mol/l dexamethasone. |
Table I
Changes in the miRNA expression
profile of human mesenchymal stem cells following treatment with
10−7 or 10−9 mol/l dexamethasone.
| Change in
expression | miRNA |
|---|
| Upregulated |
hsa-miR-4289 |
|
hsa-miR-378g |
|
hsa-miR-378f |
|
hsa-miR-378d |
|
hsa-miR-196b-5p |
|
hsa-miR-196a-5p |
|
hsa-miR-16-5p |
|
hsa-miR-1268b |
|
hsa-miR-1268a |
|
hsa-miR-107 |
|
hsa-miR-103a-3p |
| Downregulated |
hsa-miR-4634 |
|
hsa-miR-4448 |
|
hsa-miR-378i |
|
hsa-miR-378h |
|
hsa-miR-378a-3p |
|
hsa-miR-24-3p |
Discussion
miRNAs are highly conserved, small, single-stranded
RNA molecules of 19–25 nucleotides that have been identified in
eukaryotes. miRNAs have important roles in various cell functions
and biological processes by triggering translation repression or
the degradation of the target mRNA.
Currently, the study of miRNAs has received the most
interest in tumor-related fields. For example, in 2002, abnormal
miRNA expression was identified among a group of patients with
chronic lymphocytic leukemia (CLL) characterized by a lack of 13q14
(17). Following this, numerous
studies have reported the differential expression of miRNAs in
cancer tissues. For example, the expression of the miRNA
let-7 family was reduced (18–20) in lung cancer. According to the
study by Yu et al (21),
the expression of let-7 was higher in breast stem cells
compared with breast cancer cells. In an in vivo xenograft
model using breast cancer SK-3rd cells, cells over-expressing
let-7 grew more slowly and formed fewer tumors compared with
the control cells. Using a miRNA microarray, Guo et al
(22) identified that
miRNA-126 was absent in colon cancer and that
miRNA-126 had tumor-suppressive properties. The
investigators also analyzed the miRNA expression profile of
esophagus cancer tissues using the miRNA chip technique and
identified 7 miRNAs (23) that
could be used to distinguish normal and malignant tissues.
Recently, the number of studies on the role of
miRNAs in MSC differentiation and regulation has been increasing.
miRNA-208 (24),
miRNA-141 and miRNA-200a (25) have been shown to contribute to the
differentiation of osteogenic cells through the regulation of
BMP-2, miRNA-125b and BMP-4 (26). PPARγ, Bambi and
Criml are downregulated by the BMP/Runx2 signaling pathway,
and miRNA-20 promotes the differentiation of MSCs towards
the osteogenic fate (27) by
inhibiting these genes. miRNA-210 facilitates the
differentiation of osteogenic cells by inhibiting the TGF-β/activin
signal pathway (28).
miRNA-27 (29),
miRNA-29a (30) and
miRNA-29b (31) facilitate
the differentiation of MSC to osteogenic cells through the Wnt
signaling pathway. However, these studies have not explored the
spontaneous regulatory pathways that are present in stem cells, and
there are still no definite reports regarding miRNA expression
changes in stem cells under pathological conditions, such as
steroid-induced femoral head necrosis.
In the present study, MSCs were obtained from 3
different individuals, and were separated and cultured in
vitro. The differential expression of miRNAs was assessed by
high-throughput sequencing following stimulation with different
concentrations of dexamethasone. Subsequent to comparing and
eliminating the differences among individuals, a large dose of
glucocorticoids not only had a clear impact on the osteogenic
differentiation of cells but also, compared to a normal
physiological dose of dexamethasone, led to changes in the miRNA
expression profile of MSCs.
Taken together with the results obtained in previous
studies, the present study suggests that altered miRNA expression
may have a role in the pathology of steroid-induced femoral head
necrosis. Xia et al (32)
studied the regulatory action of miRNAs in gastric cancer cell
multidrug resistance and identified that the expression levels of
miRNAs were altered in the MDR gastric cancer cells SGC7901/VCR.
Specifically, the expression of miR-15b and miR-16,
which belong to the miR-15/16 family, were
downregulated. However, in vitro, miR-15b and
miR-16 increased the sensitivity and reduced the resistance
of SGC7901/VCR cells to chemotherapeutic drugs. In SGC7901/VCR
cells, the study also reported that the Gcl-2 protein was
upregulated and that the upregulation of miR-15b and
miR-16 reduced the luciferase activity of a reporter
construct for B-cell lymphoma 2 (BCL-2), as well as the
Bcl-2 levels. These findings indicate that BCL-2 is the
direct target of miR-15b and miR-16. Additionally,
the expression of miR-15b and miR-16 induced the
apoptosis of SGC7901/VCR cells. This result indicates that
miR-15 and miR-16 regulate BCL and its downstream
signaling pathways. In the present study, miR-16 expression
was upregulated by a high-dose of dexamethasone.
The present study shows that miRNA-103 and
its homologous gene, miRNA-107, are highly conserved in
vertebrates (33,34) and have a key role in fat
metabolism. Xian-Zi et al (35) identified miRNAs that were
associated with fatty acid metabolism and validated several target
genes of miRNA that were involved in this process. Additionally,
Joven et al (36)
identified that polyphenols could prevent fatty liver disease
induced by a high-fat diet in mice by modulating the expression of
miR-103/107. Wilfred et al (37) reported the mechanism of miRNAs
that regulate metabolism and suggested a possible action pathway of
the miRNA-103/107 intron region that influences the
phosphorylation of pantothenic acid, an important rate-limiting
step for generating coenzyme A. This rate influences several
biochemical reactions involved in fatty acid metabolism, the
tricarboxylic acid cycle and amino acid metabolism. It has been
suggested that steroid-induced femoral head necrosis arises from
disorders in lipid metabolism, and animal experiments (38,39) have shown that femoral head
necrosis can arise following the administration of hormones and
lipid-lowering drugs. These findings further support our
hypothesis.
Kahai et al (40) reported that miRNA-378
regulated the osteogenic differentiation of cells through
nephronectin (NPNT), an extracellular matrix protein. The
expression of NPNT is extremely high, and the stable
transfection of MCST3-E1 primary mouse osteogenic cells with
miRNA-378 altered the NPNT levels. Of note, the
present study identified that the subfamily members of
miRNA-378 are not only upregulated but are also
downregulated following treatment with high concentrations of
dexamethasone. This result may have been due to the sensitivity of
the high-throughput sequencing methods. However, the specific
mechanisms of action of miRNA-378 require elucidation in
future studies.
miRNAs have an important regulatory role in the
osteogenic differentiation of MSCs. The present study shows that
high concentrations of glucocorticosteroids can result in changes
in the miRNA expression profile of MSCs and this change may
regulate the pathophysiological process of steroid-induced femoral
head necrosis. The miRNA expression analysis provides a primary
physiopathological mechanism that accounts for the steroid-induced
ANFH. Additionally, this analysis offers novel treatment methods
and the potential for the development of early intervention and
stem cell therapy methods.
Acknowledgments
The present study was supported by the National
Natural Science Foundation of China (grant no. 81041109).
References
|
1
|
Bartel DP: MicroRNAs: Genomics,
biogenesis, mechanism, and function. Cell. 116:281–297. 2004.
View Article : Google Scholar : PubMed/NCBI
|
|
2
|
Ramírez CM, Rotllan N, Vlassov AV, Dávalos
A, Li M, Goedeke L, Aranda JF, Cirera-Salinas D, Araldi E, Salerno
A, et al: Control of cholesterol metabolism and plasma high-density
lipoprotein levels by microRNA-144. Circ Res. 112:1592–1601. 2013.
View Article : Google Scholar : PubMed/NCBI
|
|
3
|
Shapshak P: Molecule of the month: miRNA
and proteins in Alzheimer's disease. Bioinformation. 9:222–223.
2013. View Article : Google Scholar : PubMed/NCBI
|
|
4
|
Yang Y, Li YX, Yang X, Jiang L, Zhou ZJ
and Zhu YQ: Progress risk assessment of oral premalignant lesions
with saliva miRNA analysis. BMC Cancer. 13:1292013. View Article : Google Scholar : PubMed/NCBI
|
|
5
|
Shi ZM, Wang XF, Qian X, Tao T, Wang L,
Chen QD, Wang XR, Cao L, Wang YY, Zhang JX, et al: MiRNA-181b
suppresses IGF-1R and functions as a tumor suppressor gene in
gliomas. RNA. 19:552–560. 2013. View Article : Google Scholar : PubMed/NCBI
|
|
6
|
Watson JA, Bryan K, Williams R, Popov S,
Vujanic G, Coulomb A, Boccon-Gibod L, Graf N, Pritchard-Jones K and
O'Sullivan M: miRNA profiles as a predictor of chemorespon-siveness
in Wilms' tumor blastema. PLoS One. 8:e534172013. View Article : Google Scholar
|
|
7
|
Perng DW, Yang DM, Hsiao YH, Lo T, Lee OK,
Wu MT, Wu YC and Lee YC: miRNA-146a expression positively regulates
tumor necrosis factor-α-induced interleukin-8 production in
mesenchymal stem cells and differentiated lung epithelial-like
cells. Tissue Eng Part A. 18:2259–2267. 2012. View Article : Google Scholar : PubMed/NCBI
|
|
8
|
Gao J, Yang T, Han J, Yan K, Qiu X, Zhou
Y, Fan Q and Ma B: MicroRNA expression during osteogenic
differentiation of human multipotent mesenchymal stromal cells from
bone marrow. J Cell Biochem. 112:1844–1856. 2011. View Article : Google Scholar : PubMed/NCBI
|
|
9
|
Zeng Y, Qu X, Li H, Huang S, Wang S, Xu Q,
Lin R, Han Q, Li J and Zhao RC: MicroRNA-100 regulates osteogenic
differentiation of human adipose-derived mesenchymal stem cells by
targeting BMPR2. FEBS Lett. 586:2375–2381. 2012. View Article : Google Scholar : PubMed/NCBI
|
|
10
|
Eskildsen T, Taipaleenmäki H, Stenvang J,
Abdallah BM, Ditzel N, Nossent AY, Bak M, Kauppinen S and Kassem M:
MicroRNA-138 regulates osteogenic differentiation of human stromal
(mesenchymal) stem cells in vivo. Proc Natl Acad Sci USA.
108:6139–6144. 2011. View Article : Google Scholar : PubMed/NCBI
|
|
11
|
Wang BL, Sun W, Shi ZC, Lou JN, Zhang NF,
Shi SH, Guo WS, Cheng LM, Ye LY, Zhang WJ, et al: Decreased
proliferation of mesenchymal stem cells in corticosteroid-induced
osteonecrosis of femoral head. Orthopedics. 31:4442008.
|
|
12
|
Li X, Jin L, Cui Q, Wang GJ and Balian G:
Steroid effects on osteogenesis through mesenchymal cell gene
expression. Osteoporos Int. 16:101–108. 2005. View Article : Google Scholar
|
|
13
|
Cárcamo-Orive I, Gaztelumendi A, Delgado
J, Tejados N, Dorronsoro A, Fernández-Rueda J, Pennington DJ and
Trigueros C: Regulation of human bone marrow stromal cell
proliferation and differentiation capacity by glucocorticoid
receptor and AP-1 crosstalk. J Bone Miner Res. 25:2115–2125. 2010.
View Article : Google Scholar : PubMed/NCBI
|
|
14
|
Rauch A, Seitz S, Baschant U, Schilling
AF, Illing A, Stride B, Kirilov M, Mandic V, Takacz A,
Schmidt-Ullrich R, et al: Glucocorticoids suppress bone formation
by attenuating osteoblast differentiation via the monomeric
glucocorticoid receptor. Cell Metab. 11:517–531. 2010. View Article : Google Scholar : PubMed/NCBI
|
|
15
|
Lin L, Dai SD and Fan GY:
Glucocorticoid-induced differentiation of primary cultured bone
marrow mesenchymal cells into adipocytes is antagonized by
exogenous Runx2. APMIS. 118:595–605. 2010.PubMed/NCBI
|
|
16
|
Pittenger MF, Mackay AM, Beck SC, Jaiswal
RK, Douglas R, Mosca JD, Moorman MA, Simonetti DW, Craig S and
Marshak DR: Multilineage potential of adult human mesenchymal stem
cells. Science. 284:143–147. 1999. View Article : Google Scholar : PubMed/NCBI
|
|
17
|
Calin GA, Dumitru CD, Shimizu M, Bichi R,
Zupo S, Noch E, Aldler H, Rattan S, Keating M, Rai K, et al:
Frequent deletions and down-regulation of micro-RNA genes miR15 and
miR16 at 13q14 in chronic lymphocytic leukemia. Proc Natl Acad Sci
USA. 99:15524–15529. 2002. View Article : Google Scholar
|
|
18
|
Tsang WP and Kwok TT: Let-7a microRNA
suppresses therapeutics-induced cancer cell death by targeting
caspase-3. Apoptosis. 13:1215–1222. 2008. View Article : Google Scholar : PubMed/NCBI
|
|
19
|
Karube Y, Tanaka H, Osada H, Tomida S,
Tatematsu Y, Yanagisawa K, Yatabe Y, Takamizawa J, Miyoshi S,
Mitsudomi T, et al: Reduced expression of Dicer associated with
poor prognosis in lung cancer patients. Cancer Sci. 96:111–115.
2005. View Article : Google Scholar : PubMed/NCBI
|
|
20
|
Takamizawa J, Konishi H, Yanagisawa K,
Tomida S, Osada H, Endoh H, Harano T, Yatabe Y, Nagino M, Nimura Y,
et al: Reduced expression of the let-7 microRNAs in human lung
cancers in association with shortened postoperative survival.
Cancer Res. 64:3753–3756. 2004. View Article : Google Scholar : PubMed/NCBI
|
|
21
|
Yu F, Yao H, Zhu P, Zhang X, Pan Q, Gong
C, Huang Y, Hu X, Su F, Lieberman J, et al: let-7 regulates self
renewal and tumorigenicity of breast cancer cells. Cell.
131:1109–1123. 2007. View Article : Google Scholar : PubMed/NCBI
|
|
22
|
Guo C, Sah JF, Beard L, Willson JK,
Markowitz SD and Guda K: The noncoding RNA, miR-126, suppresses the
growth of neoplastic cells by targeting phosphatidylinositol
3-kinase signaling and is frequently lost in colon cancers. Genes
Chromosomes Cancer. 47:939–946. 2008. View Article : Google Scholar : PubMed/NCBI
|
|
23
|
Guo Y, Chen Z, Zhang L, Zhou F, Shi S,
Feng X, Li B, Meng X, Ma X, Luo M, et al: Distinctive microRNA
profiles relating to patient survival in esophageal squamous cell
carcinoma. Cancer Res. 68:26–33. 2008. View Article : Google Scholar : PubMed/NCBI
|
|
24
|
Itoh T, Takeda S and Akao Y: MicroRNA-208
modulates BMP-2-stimulated mouse preosteoblast differentiation by
directly targeting V-ets erythroblastosis virus E26 oncogene
homolog 1. J Biol Chem. 285:27745–27752. 2010. View Article : Google Scholar : PubMed/NCBI
|
|
25
|
Itoh T, Nozawa Y and Akao Y: MicroRNA-141
and -200a are involved in bone morphogenetic protein-2-induced
mouse pre-osteoblast differentiation by targeting distal-less
homeobox 5. J Biol Chem. 284:19272–19279. 2009. View Article : Google Scholar : PubMed/NCBI
|
|
26
|
Mizuno Y, Yagi K, Tokuzawa Y,
Kanesaki-Yatsuka Y, Suda T, Katagiri T, Fukuda T, Maruyama M, Okuda
A, Amemiya T, et al: miR-125b inhibits osteoblastic differentiation
by down-regulation of cell proliferation. Biochem Biophys Res
Commun. 368:267–272. 2008. View Article : Google Scholar : PubMed/NCBI
|
|
27
|
Zhang JF, Fu WM, He ML, Xie WD, Lv Q, Wan
G, Li G, Wang H, Lu G, Hu X, et al: MiRNA-20a promotes osteogenic
differentiation of human mesenchymal stem cells by co-regulating
BMP signaling. RNA Biol. 8:829–838. 2011. View Article : Google Scholar : PubMed/NCBI
|
|
28
|
Mizuno Y, Tokuzawa Y, Ninomiya Y, Yagi K,
Yatsuka-Kanesaki Y, Suda T, Fukuda T, Katagiri T, Kondoh Y, Amemiya
T, et al: miR-210 promotes osteoblastic differentiation through
inhibition of AcvR1b. FEBS Lett. 583:2263–2268. 2009. View Article : Google Scholar : PubMed/NCBI
|
|
29
|
Wang T and Xu Z: miR-27 promotes
osteoblast differentiation by modulating Wnt signaling. Biochem
Biophys Res Commun. 402:186–189. 2010. View Article : Google Scholar : PubMed/NCBI
|
|
30
|
Kapinas K, Kessler C, Ricks T, Gronowicz G
and Delany AM: miR-29 modulates Wnt signaling in human osteoblasts
through a positive feedback loop. J Biol Chem. 285:25221–25231.
2010. View Article : Google Scholar : PubMed/NCBI
|
|
31
|
Li Z, Hassan MQ, Jafferji M, Aqeilan RI,
Garzon R, Croce CM, van Wijnen AJ, Stein JL, Stein GS and Lian JB:
Biological functions of miR-29b contribute to positive regulation
of osteoblast differentiation. J Biol Chem. 284:15676–15684. 2009.
View Article : Google Scholar : PubMed/NCBI
|
|
32
|
Xia L, Zhang D, Du R, Pan Y, Zhao L, Sun
S, Hong L, Liu J and Fan D: miR-15b and miR-16 modulate multidrug
resistance by targeting BCL2 in human gastric cancer cells. Int J
Cancer. 123:372–379. 2008. View Article : Google Scholar : PubMed/NCBI
|
|
33
|
Baskerville S and Bartel DP: Microarray
profiling of microRNAs reveals frequent coexpression with
neighboring miRNAs and host genes. RNA. 11:241–247. 2005.
View Article : Google Scholar : PubMed/NCBI
|
|
34
|
Babak T, Zhang W, Morris Q, Blencowe BJ
and Hughes TR: Probing microRNAs with microarrays: Tissue
specificity and functional inference. RNA. 10:1813–1819. 2004.
View Article : Google Scholar : PubMed/NCBI
|
|
35
|
Xian-Zi L, Jun L, Li-Ping Z, Wang-Sheng Z
and Wei W: Screening miRNAs regulating fatty acid metabolism in
goat (Capra hirus) mammary gland and cloning determination of
related pri-miRNAs. J Agric Biotechnol. 20:589–598. 2012.
|
|
36
|
Joven J, Espinel E, Rull A, Aragonès G,
Rodríguez-Gallego E, Camps J, Micol V, Herranz-López M, Menéndez
JA, Borrás I, et al: Plant-derived polyphenols regulate expression
of miRNA paralogs miR-103/107 and miR-122 and prevent diet-induced
fatty liver disease in hyperlipidemic mice. Biochim Biophys Acta.
1820:894–899. 2012. View Article : Google Scholar : PubMed/NCBI
|
|
37
|
Wilfred BR, Wang WX and Nelson PT:
Energizing miRNA research: A review of the role of miRNAs in lipid
metabolism, with a prediction that miR-103/107 regulates human
metabolic pathways. Mol Genet Metab. 91:209–217. 2007. View Article : Google Scholar : PubMed/NCBI
|
|
38
|
Li W, Li J, Zheng D and Zhang X:
Antilipemics and anticoagulants in prevention of necrosis and
apoptosis of osteocytes in steroid-induced osteonecrosis of the
femoral head. Chin J Orthop Trauma. 9:1078–1079. 2004.In
Chinese.
|
|
39
|
Wangxi WU and Mouwang Z: The experiment of
simvastatin preventing the femoral head necrosis due to
corticosteroid. Zhongguo Kang Fu Yi Xue Za Zhi. 22:28–30. 2007.In
Chinese.
|
|
40
|
Kahai S, Lee SC, Lee DY, Yang J, Li M,
Wang CH, Jiang Z, Zhang Y, Peng C and Yang BB: MicroRNA miR-378
regulates nephronectin expression modulating osteoblast
differentiation by targeting GalNT-7. PLoS One. 4:e75352009.
View Article : Google Scholar : PubMed/NCBI
|