Introduction
Thyroid carcinoma (TC) is the most common malignancy
of the endocrine system. An estimated 62,980 new cases of TC were
diagnosed, and approximately 1,890 deaths were caused by TC in the
United States in 2014 (1). TC is
commonly diagnosed at a younger age than the majority of other
adult cancers (2). The 4 main
histological types of TC are papillary thyroid carcinoma (PTC),
follicular thyroid carcinoma (FTC), medullary thyroid carcinoma
(MTC) and anaplastic (undifferentiated) carcinoma (ATC) (3,4).
PTC and FTC constitute approximately 90% of total number of TC
cases and are treatable and usually curable. However, both PTCs and
FTCs may progress to poorly differentiated thyroid carcinomas
(PDTCs) or may completely lose differentiation and transform into
ATC, a type of poorly differentiated TC, which is aggressive, prone
to early metastasis and is associated with a poor prognosis
(5). Histology is considered the
gold standard for TC diagnosis. However, it is difficult to
distinguish between PTC and FTC under a microscope (6). Furthermore, conventional histology
fails to provide prognostic and therapeutic information for TC.
Some biomarkers, such as thyroglobulin (Tg) (7,8),
galectin-3 (9) and HBME-1
(10), have been used in clinical
practice for the diagnosis of PTC; however, the sensitivity and
specificity of these biomarkers are low, and only a small fraction
of these biomarkers can be used as diagnostic or prognostic
biomarkers. Therefore, it is essential to develop novel diagnostic
and prognostic biomarkers for PTC.
MicroRNAs (miRNAs or miRs), a class of short
non-coding RNAs with a length of 19–22 nucleotides, and play
important roles in tumorigenesis and cancer progression (11,12). miRNAs regulate gene expression at
the post-transcriptional level by binding to the 3′-UTR of their
target mRNAs (13). A number of
studies have demonstrated that miRNA expression is associated with
cell proliferation, metastasis, invasion and and response to
therapy (14–20). miRNA expression differs between
cancer tissues and adjacent normal tissues in patients (21–23). These data indicate that miRNAs may
be used as potential biomarkers for the diagnosis and prognosis of
patients with cancer.
In the present study, we examined the expression
profiles of miRNAs and mRNAs in patients with PTC and evaluated
their potential for use as biomarkers for PTC diagnosis. The
differential expression of miRNAs, combined with that of their
target mRNAs, may serve as a powerful biomarker for distinguishing
PTC from benign tissues.
Materials and methods
Data sources
miRNA expression data, transcription sequencing
(RNA-Seq) data and the corresponding clinical information for 28
patients with PTC were obtained from The Cancer Genome Atlas (TCGA)
data portal (http://cancergenome.nih.gov). This database is freely
available for non-commercial and academic use. The TCGA data, as
well as the cBioPortal for Cancer Genomics (http://www.cbioportal.org) and Oncomine (http://www.oncomine.org) data were in the form of RNA
sequencing data on an array platform. The sequencing data from TCGA
were available in the form of 'reads per million (level 3)' for
each miRNA. As regards RNA-Seq gene expression, only data from
patients with matched tumor and normal samples were used.
cBioPortal and Oncomine were also used to examine the expression of
miRNAs and RNAs from the TCGA data portal. miRNA expression
analysis of the 28 patients with PTC in the TCGA data portal was
carried out using the software package TreeView version 1.1.
Receiver operating characteristic (ROC)
curve analysis
To evaluate the sensitivity of the diagnostic tests,
ROC curve analyses were performed using MedCalc®
statistical software (11.4.2.0; MedCalc statistical software,
Mariakerke, Belgium). The area under the ROC curve (AUC), which has
been described as a simple and convenient overall measure of
diagnostic test accuracy, represents the probability and
correspondence between the ROC curve and the tested factors.
miR-15a/axis inhibition protein 2 (AXIN2)
expression in other types of cancer
Pearson's correlation analysis was used to determine
the correlation between mRNAs and miRNAs, and cancer types,
including p-values and the false discovery rate (FDR).
Statistical analysis
All statistical analyses were carried out using SPSS
for Windows, version 19.0 (SPSS, Inc., Chicago, IL, USA). Combined
predictors were established using the logistic regression method.
ROC curves were established to evaluate the diagnostic effects of
miRNAs. The results are expressed as the means ± SD. P-values
<0.05 were considered to indicate statistically significant
differences.
Results
Screening of differentially expressed
miRNAs
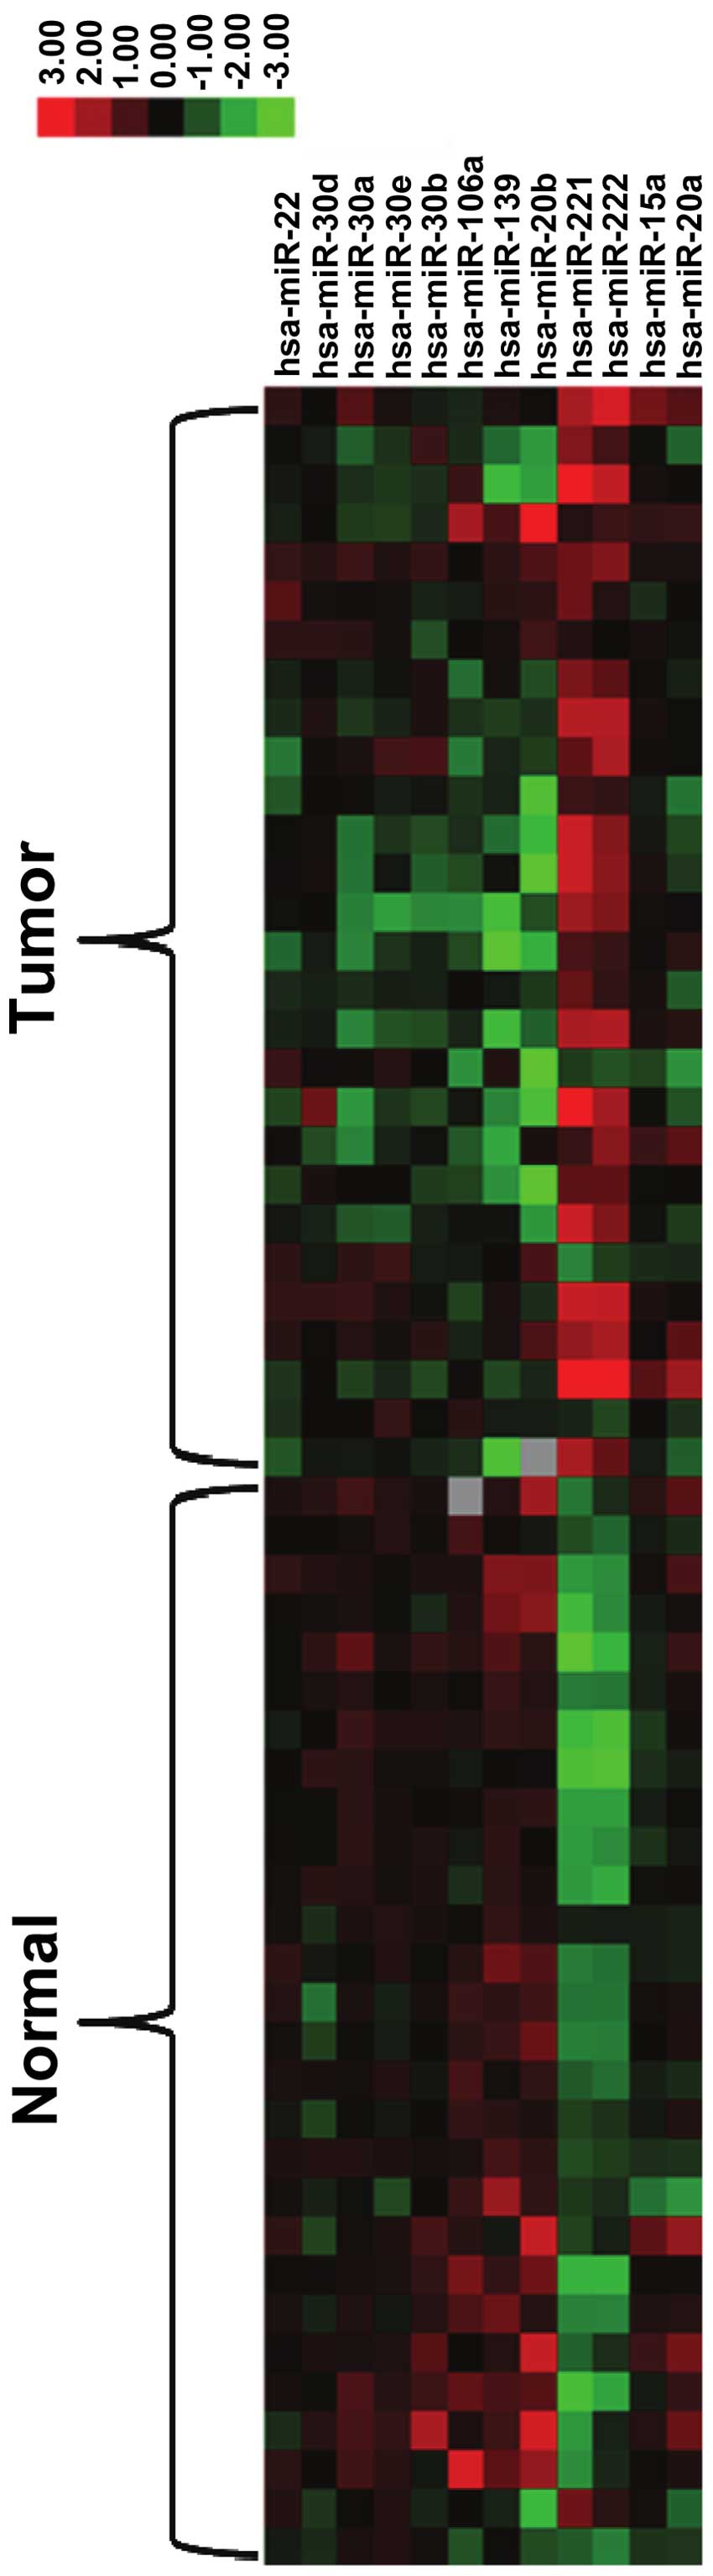
Both tumor tissues and matched normal tissues from
the same patient were used for miRNA expression profile analysis.
The data of 28 patients with PTC, from TCGA, were included in the
present study. miRNA expression was calculated from 'reads per
million' values of the tumor and matched normal samples. We found
that 12 miRNAs (miR-20a, miR-15a, miR222, miR-221, miR-20b,
miR-139, miR-106a, miR-30b, miR-30e, miR-30a, miR-30d and miR-22)
demonstrated a >2-fold difference in expression between the
tumor tissues and normal tissues in 70% of the patients. The
upregulated and downregulated miRNAs are presented in Fig. 1.
Screening of differentially expressed
genes
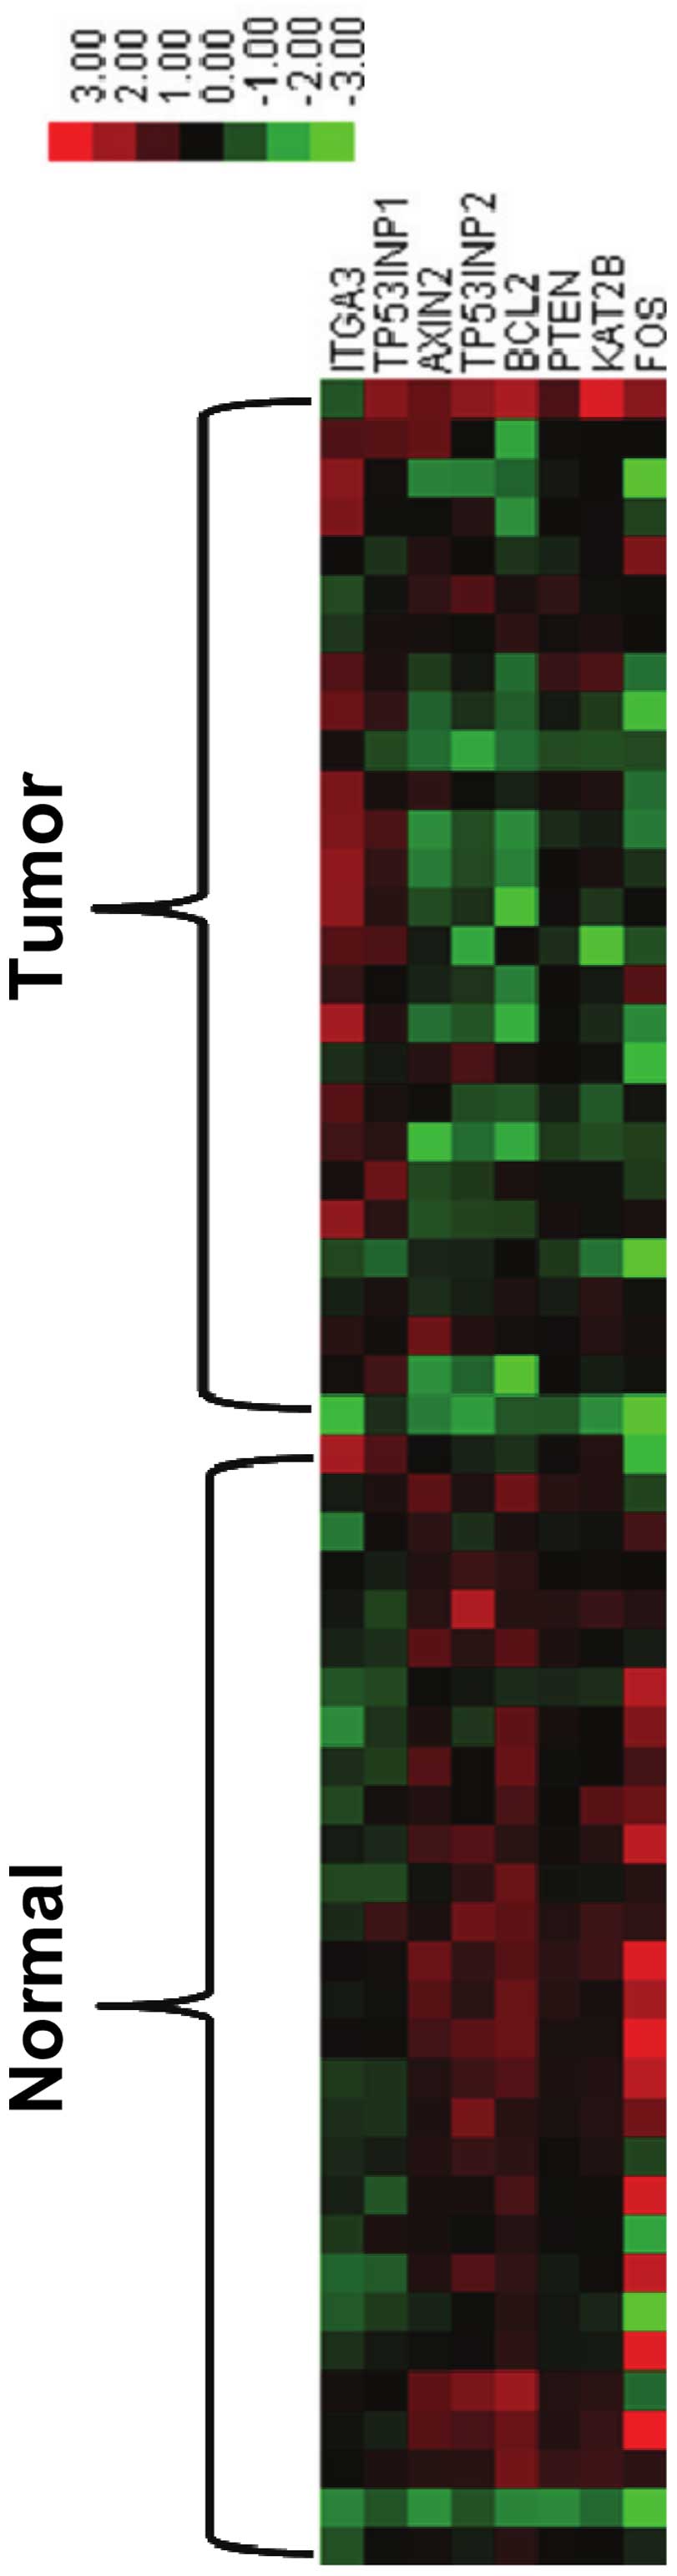
We further examined differentially expressed genes
in the tumor tissues and matched normal tissues in the 28 patients
with PTC. A total of 8 genes [integrin, alpha 3 (antigen CD49C,
alpha 3 subunit of VLA-3 receptor) (ITGA3), tumor protein p53
inducible nuclear protein (TP53INP)1, AXIN2, TP53INP2, B-cell
CLL/lymphoma 2 (BCL2), phosphatase and tensin homolog (PTEN),
K(lysine) acetyltransferase 2B (KAT2B) and FOS] were identified as
differentially expressed between the PTC tissues and the matched
normal thyroid tissues. The upregulated and downregulated genes are
presented in Fig. 2.
ROC curve analysis of the differentially
expressed miRNAs
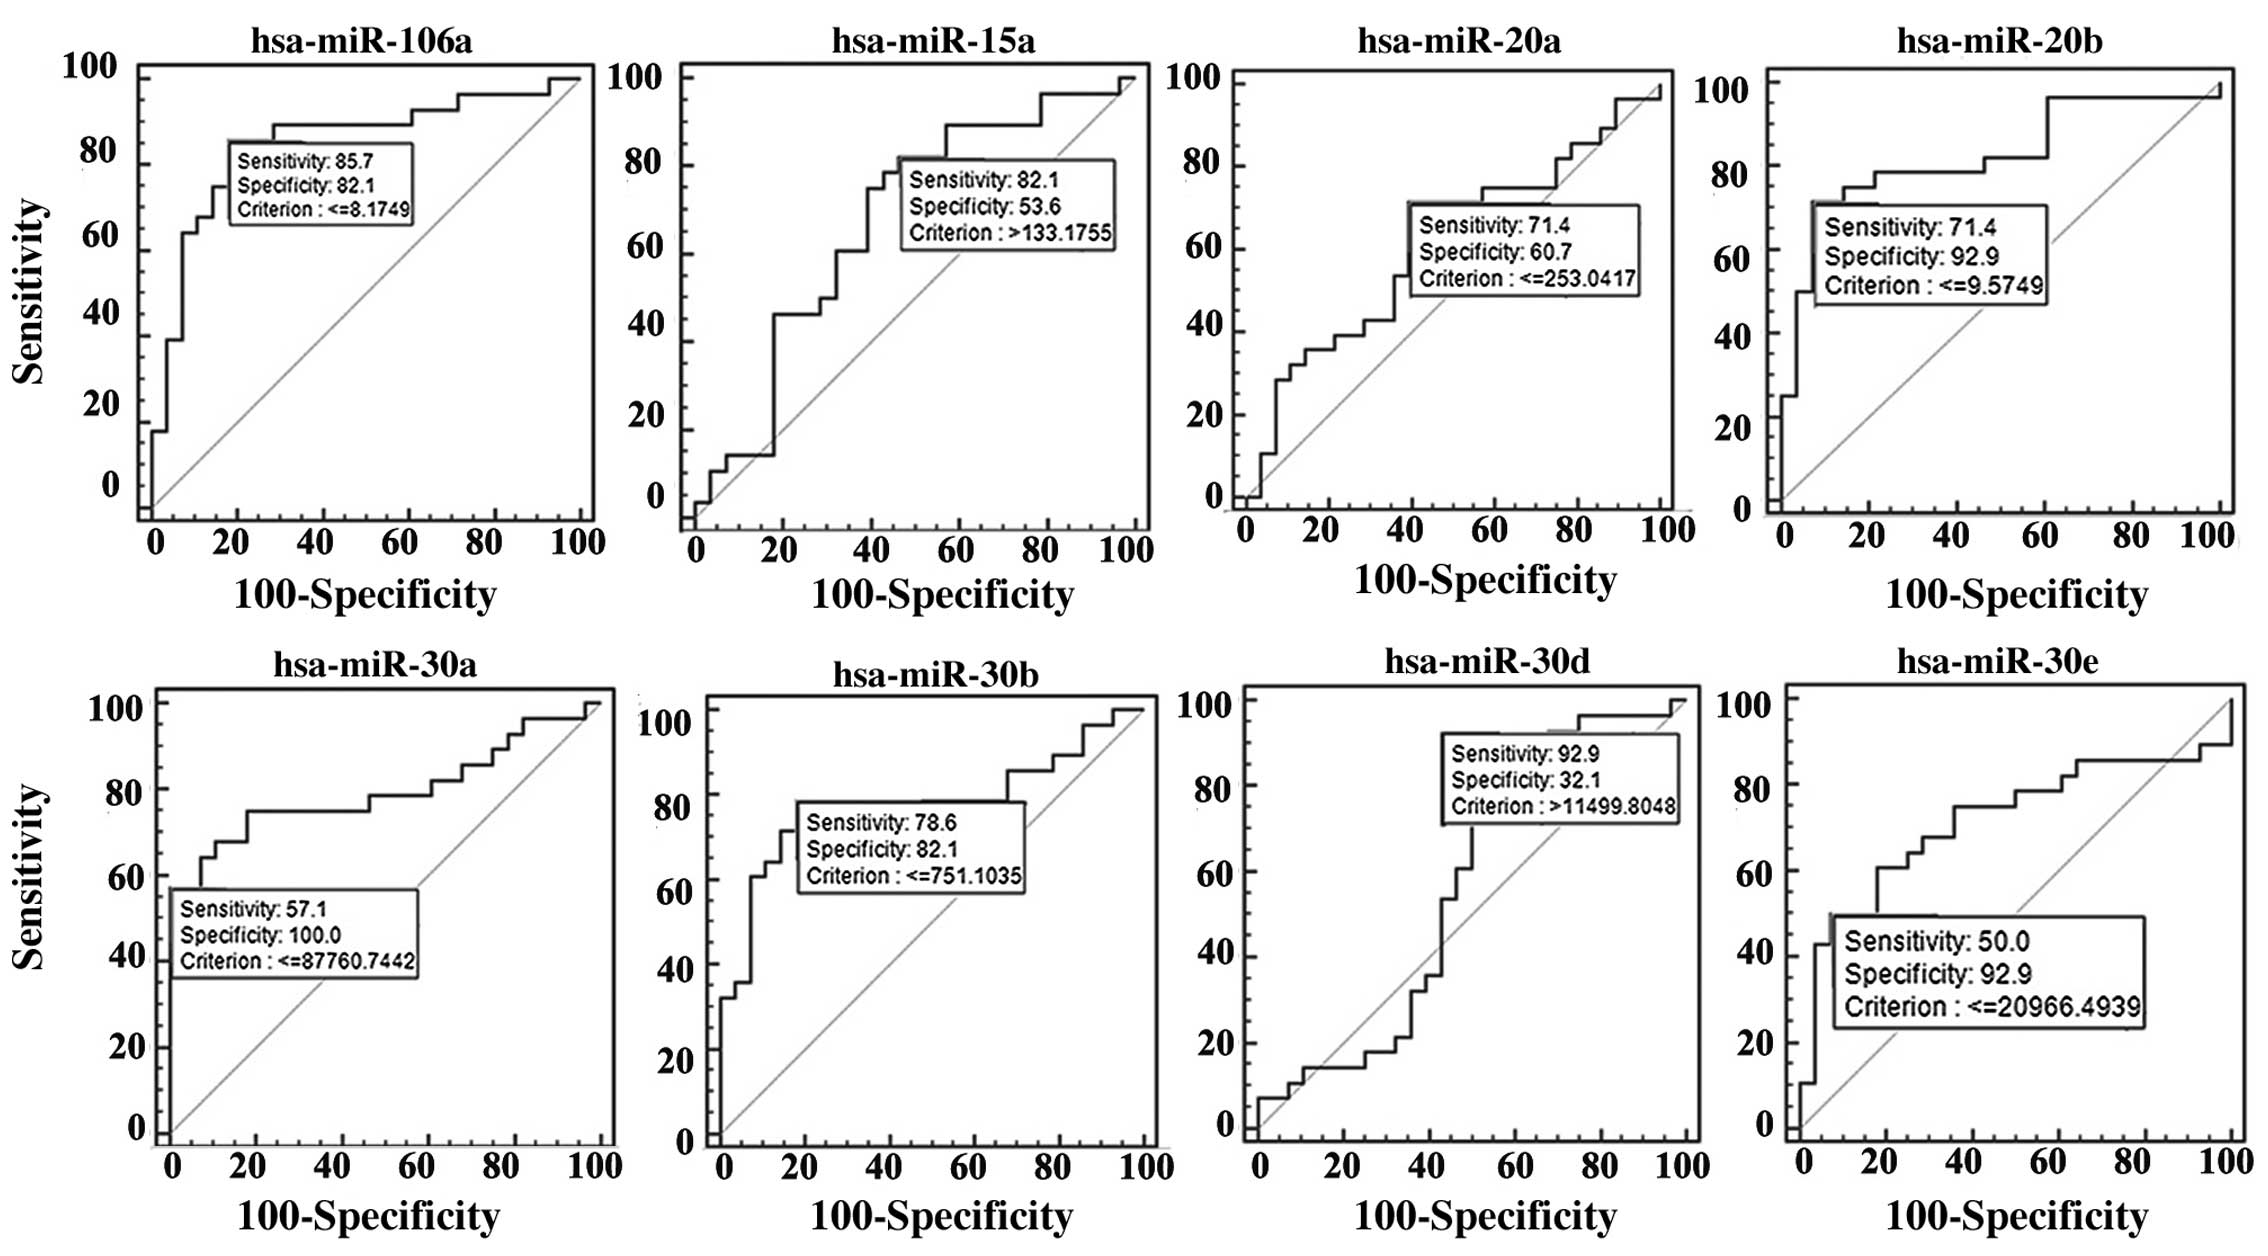
The differentially expressed miRNAs in the PTC
tissue samples were selected for further analysis. ROC curve
analysis was performed on 28 tumor and 28 normal tissues to
determine whether these miRNAs are related to the PTC histological
status. The miRNAs, miR-106a, miR-15a, miR-20a, miR-20b, miR-30a,
miR-30b, miR-30d and miR-30e, were found to be associated with PTC
(Fig. 3). All of their AUC values
were >0.90, and thus, this indicates that these miRNAs can be
used as effective biomarkers for the diagnosis of PTC.
ROC curve analysis of the differentially
expressed genes
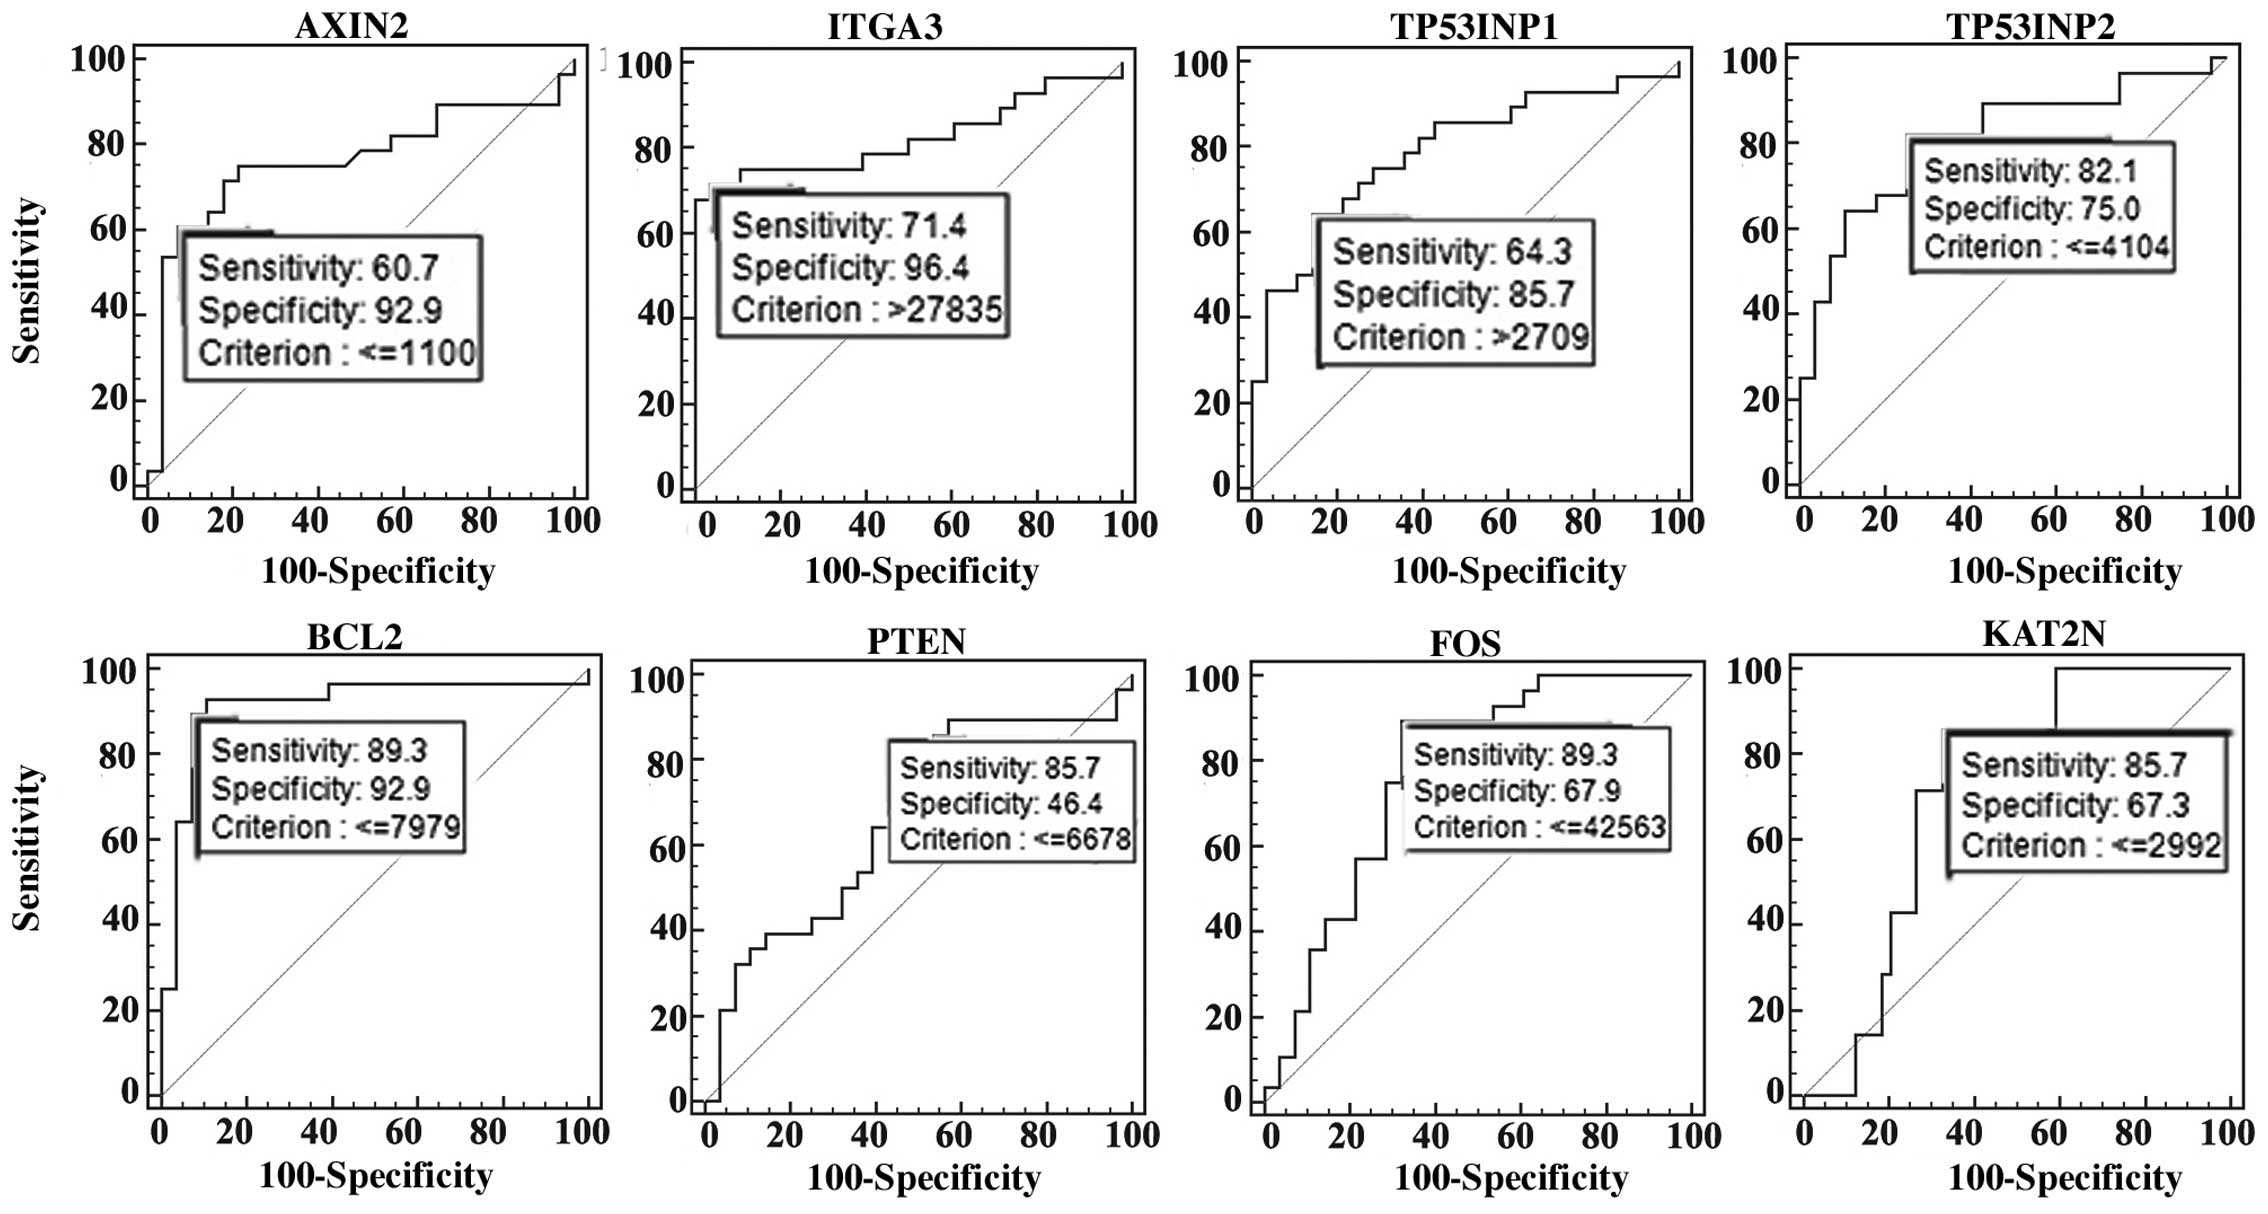
ROC curve analysis was then carried out on the basis
of the results from obtained using the PTC tissues, as compared
with those obtained using the normal tissues. The expression of the
target genes, AXIN2, ITGA3, TP53INP1, TP53INP2, BCL2, PTEN, FOS and
KAT2N, was found to be associated with PTC (Fig. 4). All of these genes exhibited
high sensitivity (60.7, 71.4, 64.3, 82.1, 89.3, 85.7, 89.3 and
85.7%, respectively) and specificity (92.9, 96.4, 85.7, 75.0, 92.9,
46.4, 63.9 and 67.3%, respectively).
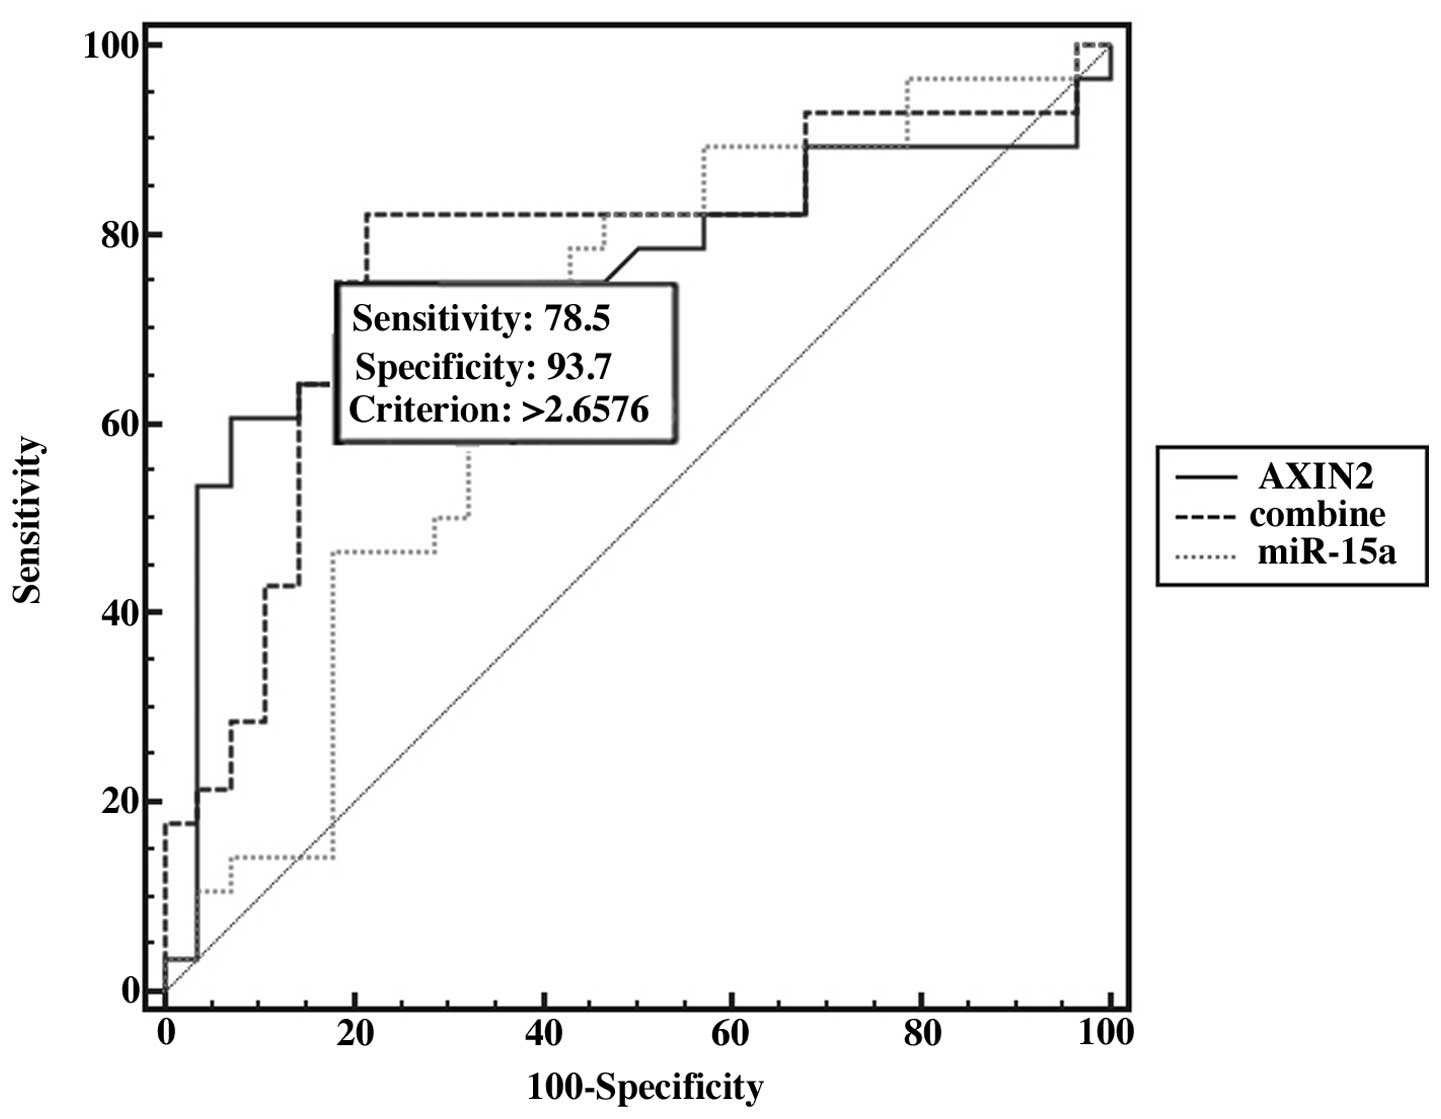
The potential value of combined
biomarkers
We further examined the potential for using miRNAs
combined with their target mRNAs in the diagnosis of PTC. ROC curve
analysis revealed that when miR-15a was combined with its target
gene, AXIN2, the AUC values increased, and miR-15a combined with
AXIN2 improved the sensitivity (78.5%) and specificity (93.7%)
(Fig. 5). Moreover, we found that
miR-15a and AXIN2 expression were changed coordinately in 8 types
of cancer, as shown in Table I.
We also analyzed the expression of the other miRNAs and their
target genes in different types of cancer (Table I). Our results suggest that these
miRNAs and mRNAs may be used as potential biomarkers for the
diagnosis of PTC.
 | Table IExpression of miRNAs and their target
genes in different types of cancer. |
Table I
Expression of miRNAs and their target
genes in different types of cancer.
| miRNA | Target gene | Cancer type | Sample no. | r | Rank | P-value | FDR |
|---|
| hsa-miR-15a | AXIN2 | Bladder urothelial
cancer (BLCA) | 229 | −0.29099 | 32222 | 7.58506E-06 | 9.23922E-05 |
| | Breast cancer
(BRCA) | 748 | −0.21574 | 53605 | 2.50939E-09 | 1.84287E-08 |
| | Head and neck
squamous cell carcinoma (HNSC) | 428 | −0.34684 | 7364 | 1.52465E-13 | 8.20853E-12 |
| | Kidney renal clear
cell carcinoma (KIRC) | 300 | −0.44051 | 9438 | 1.13431E-15 | 4.65868E-14 |
| | Lung adenocarcinoma
(LUAD) | 441 | −0.12922 | 102516 | 0.00657988 | 0.0251174 |
| | Lung squamous cell
carcinoma (LUSC) | 362 | −0.16374 | 101085 | 0.0017737 | 0.00692297 |
| | Papillary thyroid
carcinoma (PTC) | 557 | −0.10371 | 164644 | 0.0143314 | 0.0344256 |
| | Uterine corpus
endometrial carcinoma (UCEC) | 161 | −0.22901 | 59904 | 0.0034772 | 0.0227855 |
| hsa-miR-20b | TP53INP1 | Kidney chromophobe
(KICH) | 91 | −0.37705 | 57043 | 0.000229526 | 0.00156243 |
| | Kidney renal clear
cell carcinoma (KIRC) | 300 | −0.23217 | 71929 | 4.90559E-05 | 0.000264361 |
| | Lung adenocarcinoma
(LUAD) | 441 | −0.11523 | 121627 | 0.015477 | 0.0497973 |
| | Papillary thyroid
carcinoma (PTC) | 557 | −0.19305 | 69177 | 4.4499E-06 | 2.54406E-05 |
| hsa-miR-106a | TP53INP1 | Breast cancer
(BRCA) | 748 | −0.13769 | 120249 | 0.000158461 | 0.000518767 |
| | Colorectal cancer
(CRC) | 299 | −0.33271 | 9916 | 3.68032E-09 | 1.4467E-07 |
| | Kidney chromophobe
(KICH) | 91 | −0.36623 | 61281 | 0.000356682 | 0.00226009 |
| | Kidney renal clear
cell carcinoma (KIRC) | 300 | −0.22882 | 73995 | 0.000063344 | 0.000331829 |
| | Lung squamous cell
carcinoma (LUSC) | 362 | −0.19645 | 74972 | 0.000168949 | 0.00088911 |
| | Papillary thyroid
carcinoma (PTC) | 557 | −0.13739 | 120320 | 0.00115165 | 0.00378548 |
| hsa-miR-20a | TP53INP2 | Bladder urothelial
cancer (BLCA) | 229 | −0.49808 | 2457 | 9.24247E-16 | 1.47643E-13 |
| | Breast cancer
(BRCA) | 748 | −0.33902 | 11844 | 1.42082E-21 | 4.7225E-20 |
| | Colorectal cancer
(CRC) | 299 | −0.17681 | 63670 | 0.00214911 | 0.0131569 |
| | Head and neck
squamous cell carcinoma (HNSC) | 428 | −0.26834 | 24475 | 1.71039E-08 | 2.77065E-07 |
| | Kidney chromophobe
(KICH) | 91 | −0.32027 | 82252 | 0.00196898 | 0.00929535 |
| | Kidney renal clear
cell carcinoma (KIRC) | 300 | −0.17722 | 113053 | 0.00206243 | 0.00707144 |
| | Lung squamous cell
carcinoma (LUSC) | 362 | −0.31744 | 23413 | 6.43229E-10 | 1.08395E-08 |
| | Skin cutaneous
melanoma (SKCM) | 342 | −0.15318 | 71854 | 0.00452332 | 0.0247739 |
| | Papillary thyroid
carcinoma (PTC) | 557 | −0.14565 | 111172 | 0.000564255 | 0.00200733 |
| | Uterine corpus
endometrial carcinoma (UCEC) | 161 | −0.3447 | 18090 | 7.54732E-06 | 0.000163772 |
| hsa-miR-15a | BCL2 | Bladder urothelial
cancer (BLCA) | 229 | −0.40527 | 8501 | 1.83006E-10 | 8.44936E-09 |
| | Breast cancer
(BRCA) | 748 | −0.21583 | 53550 | 2.46948E-09 | 1.81542E-08 |
| | Colorectal cancer
(CRC) | 299 | −0.1683 | 70445 | 0.00351403 | 0.019444 |
| | Head and neck
squamous cell carcinoma (HNSC) | 428 | −0.13371 | 124582 | 0.00559585 | 0.0178082 |
| | Lung adenocarcinoma
(LUAD) | 441 | −0.12502 | 108048 | 0.00858301 | 0.0310865 |
| | Papillary thyroid
carcinoma (PTC) | 557 | −0.26928 | 30480 | 1.04246E-10 | 1.35264E-09 |
| | Uterine corpus
endometrial carcinoma (UCEC) | 161 | −0.32028 | 23449 | 3.44386E-05 | 0.000576509 |
| hsa-miR-20a | KAT2B | Bladder urothelial
cancer (BLCA) | 229 | −0.31374 | 25136 | 1.27E-06 | 1.98E-05 |
| | Breast cancer
(BRCA) | 748 | −0.27776 | 25792 | 1.02E-14 | 1.56E-13 |
| | Colorectal cancer
(CRC) | 299 | −0.37313 | 6006 | 2.61E-11 | 1.69E-09 |
| | Head and neck
squamous cell carcinoma (HNSC) | 428 | −0.37751 | 4310 | 6.05E-16 | 5.56E-14 |
| | Acute myeloid
leukemia (LAML) | 172 | −0.2645 | 28945 | 0.000454575 | 0.00572662 |
| | Lung adenocarcinoma
(LUAD) | 441 | −0.30742 | 8650 | 4.17E-11 | 1.89E-09 |
| | Lung squamous cell
carcinoma (LUSC) | 362 | −0.31728 | 23452 | 6.57E-10 | 1.11E-08 |
| | Ovarian serous
cystadenocarcinoma (OV) | 265 | −0.12206 | 86631 | 0.0471435 | 0.208096 |
| | Papillary thyroid
carcinoma (PTC) | 557 | −0.12636 | 133650 | 0.00281234 | 0.00832219 |
| | Uterine corpus
endometrial carcinoma (UCEC) | 161 | −0.21163 | 70910 | 0.00703863 | 0.0389642 |
Discussion
The current clinical approaches for the diagnosis of
PTC include researching patient history, physical examination,
imaging, fine-needle aspiration (FNA) and surgical pathology. FNA
and surgical pathology are the gold standard for the diagnosis of
PTC. However, both methods are invasive and their predictive value
is limited. Therefore, as has been described in a previous study,
it is essential to identify novel biomarkers to predict the
diagnosis and prognosis of patients with PTC (24). Previous studies have reported that
certain miRNAs may be used as biomarkers for the diagnosis and
prognosis of breast cancer and various diseases (25,26). As compared with conventional
protein-based biomarkers, certain miRNAs have several potential
advantages, including easy detection by PCR, relative homogeneity
and highly specific expression profiles (25).
Several analyses of miRNA and mRNA expression
profiles have demonstrated that the study of the differential
expression of miRNAs and mRNAs has potential value for tumor
diagnosis and prognosis in patients with TC (27–30). Recent studies have demonstrated
that some miRNAs have the potential to be used as diagnostic or
prognostic markers for PTC (24,31). Combining two or three markers
constitutes a more accurate approach to differentiating malignant
tumors from their benign counterparts when compared with using a
single biomarker (32–34). However, to the best of our
knowledge, no studies to date have examined the combined use of
miRNAs and mRNAs as biomarkers for the diagnosis of TC. Previous
studies have reported a series of differentially expressedmiRNAs
and mRNAs in PTC (35–37). The differential expression
profiles were analyzed, and ROC curve analyses were performed to
assess the predictive power of these miRNAs and mRNAs. We found
that 8 miRNAs (miR-106a, miR-15a, miR-30a, miR-30b, miR-20a,
miR-20b, miR-30d and miR-30e) and 8 mRNAs (AXIN2, ITGA3, TP53INP1,
TP53INP2, BCL2, PTEN, FOS and KAT2B) had higher predictive powers,
and the AUC values were >0.90. These results indicated that
these miRNAs and mRNAs are good biomarker candidates for the
clinical diagnosis of PTC.
Currently, FNA is the most accurate diagnostic
method used for detecting TC (38); however, up to 30% of fine-needle
aspiration biopsy cytological samples are reported as ‛suspicious'
or ‛indeterminate' (39).
Therefore, additional methods to increase the sensitivity and
specificity of diagnosis are highly desirable. Molecular markers,
such as B-raf proto-oncogene, serine/threonine kinase (BRAF), RAS,
RET/PTC, paired box 8 (PAX8)/peroxisome proliferator-activated
receptor c (PPARc) or galectin-3 may be considered for determining
cytology, according to the American Thyroid Association guidelines
(40). In a previous study of
ours, TP53INP1, TP53INP2, AXIN2 and ITGA3 were found to be
differentially expressed in PTC tissues when compared with the
normal tissues (34). In the
present study, we revealed that aside from those 4 genes, BCL2,
PTEN, FOS and KAT2B also have potential value for the diagnosis of
PTC. Usually, an AUC value >0.5 is considered suitable for
clinical diagnosis. To increase the sensitivity and specificity and
the AUC, we combined the mRNA expression of AXIN2 and miR-15a in 28
patients using logistic regression analysis. The results revealed
that the combination of AXIN2 and miR-15a increased diagnostic
accuracy, as compared with the use of a single molecule (the
sensitivity was 78.5% and the specificity was 93.7%). These results
suggest that the combination of AXIN2 and miR-15a is a strong and
independent predictor for the diagnosis of PTC.
In conclusion, our data demonstrate that the
combined use of miRNAs and their target mRNAs may provide a novel
predicting tool for the diagnosis of PTC. The combination of miRNAs
and mRNAs significantly improved the diagnostic accuracy. The data
of the present study may serve as the basis for further studies on
PTC diagnosis. Further studies are required to examine the
mechanisms of action of different miRNAs and mRNAs in PTC.
Acknowledgments
The present study was supported by NSFC grants
(30770649 and 30970682), the Research Fund for the Doctoral Program
of Higher Education of China (20100061110070) and the Program for
New Century Excellent Talents in University.
References
|
1
|
Siegel R, Ma J, Zou Z and Jemal A: Cancer
Statistics, 2014. CA Cancer J Clin. 64:9–29. 2014. View Article : Google Scholar : PubMed/NCBI
|
|
2
|
Goldfarb M and Casillas J: Unmet
information and support needs in newly diagnosed thyroid cancer:
comparison of adolescents/young adults (AYA) and older patients. J
Cancer Surviv. 8:394–401. 2014. View Article : Google Scholar : PubMed/NCBI
|
|
3
|
Olaleye O, Ekrikpo U, Moorthy R, Lyne O,
Wiseberg J, Black M and Mitchell D: Increasing incidence of
differentiated thyroid cancer in South East England: 1987–2006. Eur
Arch Otorhinolaryngol. 268:899–906. 2011. View Article : Google Scholar
|
|
4
|
Chen AY, Jemal A and Ward EM: Increasing
incidence of differentiated thyroid cancer in the United States,
1988–2005. Cancer. 115:3801–3807. 2009. View Article : Google Scholar : PubMed/NCBI
|
|
5
|
Li X, Abdel-Mageed AB, Mondal D and Kandil
E: MicroRNA expression profiles in differentiated thyroid cancer, a
review. Int J Clin Exp Med. 6:74–80. 2013.
|
|
6
|
Sethi K, Sarkar S, Das S, Mohanty B and
Mandal M: Biomarkers for the diagnosis of thyroid cancer. J Exp
Ther Oncol. 8:341–352. 2010.
|
|
7
|
Torréns JI and Burch HB: Serum
thyroglobulin measurement. Utility in clinical practice. Endocrinol
Metab Clin North Am. 30:429–467. 2001. View Article : Google Scholar : PubMed/NCBI
|
|
8
|
Kebebew E and Reiff E: Patients with
differentiated thyroid cancer have a venous gradient in
thyroglobulin levels. Cancer. 109:1078–1081. 2007. View Article : Google Scholar : PubMed/NCBI
|
|
9
|
Weinberger PM, Adam BL, Gourin CG, Moretz
WH III, Bollag RJ, Wang BY, Liu Z, Lee JR and Terris DJ:
Association of nuclear, cytoplasmic expression of galectin-3 with
beta-catenin/Wnt-pathway activation in thyroid carcinoma. Arch
Otolaryngol Head Neck Surg. 133:503–510. 2007. View Article : Google Scholar : PubMed/NCBI
|
|
10
|
Ito Y, Yoshida H, Tomoda C, Miya A,
Kobayashi K, Matsuzuka F, Kakudo K, Kuma K and Miyauchi A: HBME-1
expression in follicular tumor of the thyroid: an investigation of
whether it can be used as a marker to diagnose follicular
carcinoma. Anticancer Res. 25:179–182. 2005.PubMed/NCBI
|
|
11
|
Yanaihara N, Caplen N, Bowman E, Seike M,
Kumamoto K, Yi M, Stephens RM, Okamoto A, Yokota J, Tanaka T, et
al: Unique microRNA molecular profiles in lung cancer diagnosis and
prognosis. Cancer Cell. 9:189–198. 2006. View Article : Google Scholar : PubMed/NCBI
|
|
12
|
Sassen S, Miska EA and Caldas C: MicroRNA:
implications for cancer. Virchows Archiv. 452:1–10. 2008.
View Article : Google Scholar
|
|
13
|
Bartel DP: MicroRNAs: genomics,
biogenesis, mechanism, and function. Cell. 116:281–297. 2004.
View Article : Google Scholar : PubMed/NCBI
|
|
14
|
Baranwal S and Alahari SK: miRNA control
of tumor cell invasion and metastasis. Int J Cancer. 126:1283–1290.
2010.
|
|
15
|
Rathod SS, Rani SB, Khan M, Muzumdar D and
Shiras A: Tumor suppressive miRNA-34a suppresses cell proliferation
and tumor growth of glioma stem cells by targeting Akt and Wnt
signaling pathways. FEBS Open Bio. 4:485–495. 2014. View Article : Google Scholar : PubMed/NCBI
|
|
16
|
Pencheva N and Tavazoie SF: Control of
metastatic progression by microRNA regulatory networks. Nat Cell
Biol. 15:546–554. 2013. View
Article : Google Scholar : PubMed/NCBI
|
|
17
|
Ell B, Qiu Q, Wei Y, Mercatali L, Ibrahim
T, Amadori D and Kang Y: The microRNA-23b/27b/24 cluster promotes
breast cancer lung metastasis by targeting metastasis-suppressive
gene prosaposin. J Biol Chem. 289:21888–21895. 2014. View Article : Google Scholar : PubMed/NCBI
|
|
18
|
Gu Y, Cheng Y, Song Y, Zhang Z, Deng M,
Wang C, Zheng G and He Z: MicroRNA-493 suppresses tumor growth,
invasion and metastasis of lung cancer by regulating E2F1. PLoS
One. 9:e1026022014. View Article : Google Scholar : PubMed/NCBI
|
|
19
|
Skinner HD, Lee JH, Bhutani MS, Weston B,
Hofstetter W, Komaki R, Shiozaki H, Wadhwa R, Sudo K, Elimova E, et
al: A validated miRNA profile predicts response to therapy in
esophageal adenocarcinoma. Cancer. 120:3635–3641. 2014. View Article : Google Scholar : PubMed/NCBI
|
|
20
|
Tumilson CA, Lea RW, Alder JE and Shaw L:
Circulating microRNA biomarkers for glioma and predicting response
to therapy. Mol Neurobiol. 50:545–558. 2014. View Article : Google Scholar : PubMed/NCBI
|
|
21
|
Saito Y, Suzuki H, Imaeda H, Matsuzaki J,
Hirata K, Tsugawa H, Hibino S, Kanai Y, Saito H and Hibi T: The
tumor suppressor microRNA-29c is downregulated and restored by
celecoxib in human gastric cancer cells. Int J Cancer.
132:1751–1760. 2013. View Article : Google Scholar
|
|
22
|
Wang J, Zhang J, Wu J, Luo D, Su K, Shi W,
Liu J, Tian Y and Wei L: MicroRNA-610 inhibits the migration and
invasion of gastric cancer cells by suppressing the expression of
vasodilator-stimulated phosphoprotein. Eur J Cancer. 48:1904–1913.
2012. View Article : Google Scholar
|
|
23
|
Oh HK, Tan AL, Das K, Ooi CH, Deng NT, Tan
IB, Beillard E, Lee J, Ramnarayanan K, Rha SY, et al: Genomic loss
of miR-486 regulates tumor progression and the OLFM4 antiapoptotic
factor in gastric cancer. Clin Cancer Res. 17:2657–2667. 2011.
View Article : Google Scholar : PubMed/NCBI
|
|
24
|
Yu S, Liu Y, Wang J, Guo Z, Zhang Q, Yu F,
Zhang Y, Huang K, Li Y, Song E, et al: Circulating microRNA
profiles as potential biomarkers for diagnosis of papillary thyroid
carcinoma. J Clin Endocrinol Metab. 97:2084–2092. 2012. View Article : Google Scholar : PubMed/NCBI
|
|
25
|
Etheridge A, Lee I, Hood L, Galas D and
Wang K: Extracellular microRNA: a new source of biomarkers. Mutat
Res. 717:85–90. 2011. View Article : Google Scholar : PubMed/NCBI
|
|
26
|
Cortez MA, Welsh JW and Calin GA:
Circulating microRNAs as noninvasive biomarkers in breast cancer.
Recent Results Cancer Res. 195:151–161. 2012. View Article : Google Scholar : PubMed/NCBI
|
|
27
|
Yip L, Kelly L, Shuai Y, Armstrong MJ,
Nikiforov YE, Carty SE and Nikiforova MN: MicroRNA signature
distinguishes the degree of aggressiveness of papillary thyroid
carcinoma. Ann Surg Oncol. 18:2035–2041. 2011. View Article : Google Scholar : PubMed/NCBI
|
|
28
|
Fassina A, Cappellesso R, Simonato F, Siri
M, Ventura L, Tosato F, Busund LT, Pelizzo MR and Fassan M: A
4-MicroRNA signature can discriminate primary lymphomas from
anaplastic carcinomas in thyroid cytology smears. Cancer
Cytopathol. 122:274–281. 2014. View Article : Google Scholar
|
|
29
|
Nikiforova MN, Tseng GC, Steward D, Diorio
D and Nikiforov YE: MicroRNA expression profiling of thyroid
tumors: biological significance and diagnostic utility. J Clin
Endocrinol Metab. 93:1600–1608. 2008. View Article : Google Scholar : PubMed/NCBI
|
|
30
|
Hébrant A, Dom G, Dewaele M, Andry G,
Trésallet C, Leteurtre E, Dumont JE and Maenhaut C: mRNA expression
in papillary and anaplastic thyroid carcinoma: molecular anatomy of
a killing switch. PLoS One. 7:e378072012. View Article : Google Scholar : PubMed/NCBI
|
|
31
|
Lee JC, Zhao JT, Clifton-Bligh RJ, Gill A,
Gundara JS, Ip JC, Glover A, Sywak MS, Delbridge LW, Robinson BG
and Sidhu SB: MicroRNA-222 and microRNA-146b are tissue and
circulating biomarkers of recurrent papillary thyroid cancer.
Cancer. 119:4358–4365. 2013. View Article : Google Scholar : PubMed/NCBI
|
|
32
|
Ruggeri RM, Campennì A, Baldari S,
Trimarchi F and Trovato M: What is New on Thyroid Cancer
Biomarkers. Biomark Insights. 3:237–252. 2008.PubMed/NCBI
|
|
33
|
He M, Zhao Y, Yi H, Sun H, Liu X and Ma S:
The combination of TP53INP1, TP53INP2 and AXIN2: potential
biomarkers in papillary thyroid carcinoma. Endocrine. 48:712–720.
2015. View Article : Google Scholar
|
|
34
|
Liu X, He M, Hou Y, Liang B, Zhao L, Ma S,
Yu Y and Liu X: Expression profiles of microRNAs and their target
genes in papillary thyroid carcinoma. Oncol Rep. 29:1415–1420.
2013.PubMed/NCBI
|
|
35
|
He H, Jazdzewski K, Li W, Liyanarachchi S,
Nagy R, Volinia S, Calin GA, Liu CG, Franssila K, Suster S, et al:
The role of microRNA genes in papillary thyroid carcinoma. Proc
Natl Acad Sci USA. 102:19075–19080. 2005. View Article : Google Scholar : PubMed/NCBI
|
|
36
|
Pallante P, Visone R, Ferracin M, Ferraro
A, Berlingieri MT, Troncone G, Chiappetta G, Liu CG, Santoro M,
Negrini M, et al: MicroRNA deregulation in human thyroid papillary
carcinomas. Endocr Relat Cancer. 13:497–508. 2006. View Article : Google Scholar : PubMed/NCBI
|
|
37
|
Shen R, Liyanarachchi S, Li W, Wakely PE
Jr, Saji M, Huang J, Nagy R, Farrell T, Ringel MD, de la Chapelle
A, et al: MicroRNA signature in thyroid fine needle aspiration
cytology applied to 'atypia of undetermined significance' cases.
Thyroid. 22:9–16. 2012. View Article : Google Scholar :
|
|
38
|
Gharib H: Changing trends in thyroid
practice: understanding nodular thyroid disease. Endocr Pract.
10:31–39. 2004. View Article : Google Scholar : PubMed/NCBI
|
|
39
|
Prasad NB, Somervell H, Tufano RP, Dackiw
AP, Marohn MR, Califano JA, Wang Y, Westra WH, Clark DP, Umbricht
CB, et al: Identification of genes differentially expressed in
benign versus malignant thyroid tumors. Clin Cancer Res.
14:3327–3337. 2008. View Article : Google Scholar : PubMed/NCBI
|
|
40
|
American Thyroid Association (ATA)
Guidelines Taskforce on Thyroid Nodules and Differentiated Thyroid
Cancer; Cooper DS, Doherty GM, Haugen BR, Kloos RT, Lee SL, Mandel
SJ, Mazzaferri EL, McIver B, Pacini F, Schlumberger M, et al:
Revised American Thyroid Association management guidelines for
patients with thyroid nodules and differentiated thyroid cancer.
Thyroid. 19:1167–1214. 2009. View Article : Google Scholar : PubMed/NCBI
|