Introduction
Sialic acids, which are mainly attached to the
terminal of N-glycans, are abundantly present in a number of
organisms, particularly during embryonic development. Sialic acids
have been found to mediate various cellular processes in mammals.
Polysialic acid (PSA) is a negatively charged homopolymer composed
of α-(2,8)-linked sialic acid residues, which is
involved in brain development and certain psychiatric disorders,
such as schizophrenia (1–3). PSA is barely expressed during
postnatal development, but may be 're-expressed' in a number of
types of tumor (such as lung cancer, pancreatic cancer,
neuroblastoma and glioma), where it modulates cell adhesion,
migration and invasion (4–7).
The biosynthesis of PSA is catalyzed by two Golgi-resident
polysialyltransferases, ST8SiaIV (PST) and ST8SiaII (STX) (8). It has been demonstrated that the
mRNA levels of PST and STX are closely associated
with the development of pancreatic cancer (9) and non-small cell lung cancer
(10). In patients with breast
cancer (BC), serum levels of PSA and sialyltransferases have been
shown to be positively associated with the presence of malignant
tumors and negatively with responses to anticancer treatment
(11). However, to the best of
our knowledge, few studies to date have examined the expression of
PSA and polysialyltransferases in tissues from patients with
BC.
Epithelial-mesenchymal transition (EMT) plays a role
in tissue repair and pathological processes, notably in tissue
fibrosis and facilitates tumor metastasis (12). During EMT, epithelial cancer cells
acquire a mesenchymal phenotype and express mesenchymal markers,
such as vimentin (13,14). EMT is therefore a potential target
for the development of novel immunotherapeutic approaches. Sialic
acids, the ligands for the sialic-acid-binding immunoglobulin-like
lectins (Siglec) family of cell adhesion molecules, appear to be
involved in regulating the immune response (15). Exploiting the enzymatic
permissiveness of sialic acids has been successfully used for the
immunotargeting of cancer cells (16). Thus, PSA may be a useful
immunotherapeutic target for cancer cells undergoing EMT. The cell
lines, NMuMG and MCF10A, derived respectively from mouse mammary
glands and non-malignant human breast epithelial tissues, are
commonly used for studies on EMT induced by treatment with
transforming growth factor-β1 (TGF-β1) (17). The elucidation of changes in PSA
and polysialyltransferase levels during EMT in these two cell lines
will help to guide future studies on BC.
The major goals of the present study were to i) use
a fluorescence-labeling method followed by HPLC to quantify the PSA
expression levels in normal and malignant breast epithelial cells,
in cells undergoing TGF-β1-induced EMT, and in 24 clinical BC
specimens; ii) evaluate the effects of PSA on cell motility and
migration; iii) examine the correlation between PSA expression with
that of the related polysialyltransferase, PST, in clinical BC
samples.
Materials and methods
Antibodies and reagents
The following antibodies were used: mouse
anti-E-cadherin IgG2a (1:50,000; #610181); mouse anti-β-catenin
IgG1 (1:10,000; #610153) (BD Biosciences, San Jose, CA, USA); mouse
anti-N-cadherin IgG1 (1:1,000; sc-59987) (Santa Cruz Biotechnology,
Inc., Santa Cruz, CA, USA); mouse anti-vimentin IgG1 (1:1,000;
V5255); mouse anti-PSA-neural cell adhesion molecule (NCAM) IgM 5A5
(Developmental Studies Hybridoma Bank, University of Iowa, Iowa
City, IA, USA); anti-β-tubulin I IgG1 (1:1,000,000; T7816) (Sigma,
St. Louis, MO, USA); and horseradish peroxidase (HRP)-labeled goat
anti-mouse IgG (1:5,000; A0216) (Beyotime Institute of
Biotechnology, Haimen, China).
The reagents used in this study were as follows:
TGF-β1 (BD Biosciences), PNGase F (New England BioLabs, Inc.,
Ipswich, MA, USA), urea, DL-dithiothreitol, iodoacetamide,
tetrachloroaurate (AuCl4), Sepharose 4B, methanol,
tunicamycin and 1-butanol (Sigma).
Cell lines and cell culture
Mouse mammary epithelial cells (NMuMG), mouse
mammary carcinoma cells (4T1), normal human breast cells (MCF10A)
and human mammary carcinoma cells (MDA-MB-231; MB-231) were
obtained from the American Type Culture Collection (ATCC, Manassas,
VA, USA). The cells were cultured in Dulbecco's modified Eagle's
medium (DMEM) or RPMI-1640 supplemented with 10% fetal bovine serum
(FBS) (both from HyClone, Logan, UT, USA), 100 IU/ml penicillin and
100 µg/ml streptomycin (Gibco, Carlsbad, CA, USA) in a
humidified 5% CO2 atmosphere at 37°C. The NMuMG cells
were cultured in DMEM containing 10 µg/ml insulin (Sigma).
The MCF10A and MB-231 cells were cultured in DMEM containing 1%
sodium pyruvate (Solarbio, Beijing, China). The 4T1 cells were
cultured in RPMI-1640.
Ethics approval
All procedures performed in experiments involving
human participants were carried out in accordance with the ethical
standards of the institutional and/or national research committee
and with the 1964 Helsinki declaration and its later amendments or
comparable ethical standards.
Patients and tissue samples
BC tissues were obtained from 20 patients with TNM
stage I, II and III BC, and 4 normal breast tissue samples were
obtained from surgical or autopsy specimens performed at the First
Affiliated Hospital of Xi'an Jiaotong University (Xi'an, China).
All the tissues were snap-frozen in liquid nitrogen and stored at
−70°C until use. Informed consent was obtained from all patients in
accordance with the Declaration of Helsinki. The present study was
approved by the Research Ethics Committee of Jiangnan University
(Wuxi, China).
Western blot analysis
The cells were cultured in 6-well plates, washed
with phosphate-buffered saline (PBS), harvested, homogenized in
T-PER lysis buffer (Thermo Fisher Scientific, Waltham, MA, USA)
containing 10 U/ml aprotinin, and centrifuged at 14,000 × g at 4°C
for 15 min. The super-natants were mixed with loading buffer (which
contained 1% β-mercaptoethanol) and heated at 100°C for 10 min.
Proteins were loaded on 7.5% sodium dodecyl sulfate-polyacrylamide
gel electrophoresis (SDS-PAGE) gels and transferred onto a PVDF
membrane. The membrane was blocked with 5% non-fat milk, incubated
with primary antibody overnight at 4°C, probed with appropriate
HRP-conjugated secondary antibody, visualized using the Pro-Light
HRP kit (Tiangen Biotech Co., Ltd., Beijing, China), and
photographed using a Molecular Imager Chemi DOC™XRS+
system (Bio-Rad, Richmond, CA, USA).
Separation of glycans
Total proteins from the tissues were isolated using
an E.Z.N.A. DNA/RNA/Protein Isolation kit (Omega Bio-Tek,
Doraville, CA, USA) according to the manufacturer's instructions.
Glycans on proteins were released by PNGase F and desalted as
previously described (18,19).
The glycan sample was lyophilized and dissolved in
methanol/H2O (1:1, v/v) for further analysis.
Fluorescence labeling of free sialic
acids for 1,2-diamino-4,5-methylenedioxybenzene (DMB) and HPLC
analysis
Free sialic acids were labeled with DMB using a
Sialic Acid Fluorescence Labeling kit (Takara Bio Inc., Otsu,
Japan), according to the instructions provided by the manufacturer.
Briefly, the cell lysate was hydrolyzed with 2 M acetic acid and
labeled with DMB, as described in a previous study (20). A 10-µl aliquot of each
sample was loaded on a Zorbax SB-C18 column (4.6×250 mm) (Agilent
Technologies, Inc., Santa Clara, CA, USA) and eluted with
methanol/acetonitrile/water (8:7:85, v/v/v) on a Waters e2695 HPLC
system with a fluorescence detector (excitation, 373 nm; emission,
448 nm). Free sialic acids were quantified based on peak areas
obtained from a defined standard.
Reverse transcription-quantitative
(real-time) polymerase chain reaction (RT-qPCR)
Total RNA from the cells was isolated using an
RNApure Tissue kit (CWBIO, Beijing, China) and RNA from human
tissues was isolated using an E.Z.N.A. DNA/RNA/Protein Isolation
kit (Omega Bio-Tek) according to the manufacturer's instructions.
First-strand cDNA was synthesized using a ReverTra
Ace-α® kit (Toyobo, Osaka, Japan). Primers were designed
using DNAman software as follows: mouse STX (167 bp) sense,
5′-CTTGGATGCGGAGAAGGAT and anti-sense, 5′-GGCACAAGTCTGGAAATGCT;
mouse PST (126 bp) sense, 5′-GCGAACTGCCTATCCATCAC and
antisense, 5′-TCACAGAATCTGGTGGCAAG; human STX (141 bp)
sense, 5′-TCAGAACCAGAACCCAGTCA and antisense,
5′-CGACAGTCAGTTTCAAAGCC; human PST (106 bp) sense, 5′-ACTGA
AAGTGCGAACTGCCT and antisense, 5′-GAGAAGACCTGTGCTGGGTC; mouse
γ-tubulin (107 bp) sense, 5′-ATCTA CCTGTCGGAGCATGG and
antisense, 5′-GCCTCCCGA TCTATGATGTC; and human β-actin (232
bp) sense, 5′-CTTCC TGGGCATGGAGTC and antisense, 5′-GCCGATCCACA
CGGAGTA. Semi-quantitative PCR was performed as follows: 94°C, 4
min; 94°C, 45 sec, 60°C, 45 sec, 72°C, 15 sec for 30 cycles; 72°C,
5 min; quantitative PCR (qPCR) was performed using Ultra SYBR
Mixture (Cat. no. CW0957; CWBIO) on a CFX96 Real-Time PCR detection
system (Bio-Rad). The transcriptional levels of target genes were
quantified using the 2−ΔΔCt method, as previously
described (21) and expressed as
the means ± SD from triplicate experiments.
Cell motility assay
Phagokinetic gold sol assay was performed as
previously described (22,23).
Briefly, 1.8 ml of a 14.5 mM AuCl4 solution and 6 ml of
a 36.5 mM Na2CO3 solution were added to 11 ml
distilled H2O, heated to a boil, and then 1.8 ml of 0.1%
formaldehyde was added. Colloidal gold solution (gold sol) was
added to 24-well plates, and the plates were blocked with
filter-sterilized 1% BSA, as previously described (22). Cells (2×10³) in
complete culture medium were seeded onto the gold sol-coated wells
and incubated for 18 h. Images were captured using an inverted
microscope (model NA0.3OWD72; Sunny Optical Technology, Ningbo,
China). The track areas of 50 cells were measured using the
ToupView imaging system, as previously described (24) and expressed as square pixels.
Gene silencing with small interfering RNA
(siRNA)
Duplexes of 21 nucleotides of human and mouse STX
siRNA target sequences (hSTXi or mSTXi) and negative control siRNA
(NC), without homology to other known human and mouse genes, were
designed and synthesized by Invitrogen (Carlsbad, CA, USA) as
follows: hSTXi, 5′-GCCUGGAGAUAUUAUUCA UTT (sense); and mSTXi,
5′-CCUGAAGCCUGGAGACAU UTT (sense). siRNA (30 pmol) was transfected
using Lipofectamine 2000 reagent (3 µl) (Invitrogen) and the
4T1 or MB-231 cells were examined 24 h following transfection. The
suppression of the expression of STX was verified by
semi-quantitative and quantitative RT-PCR.
Transwell migration assay
The cells were cultured in 6-well plates and treated
with or without TGF-β1 (5 ng/ml) for 48 h. Tunicamycin (4
µg/ml) was added together with TGF-β1 into 6-well plates,
and the NMuMG or MCF10A cells were cultured for an additional 48 h,
as previously described (25,26). The cells (5×10⁴) were
plated in an upper Transwell insert (12/24-well Transwell; 8
µm polycarbonate membrane; Costar, Corning, NY, USA) in DMEM
or RPMI-1640 medium containing 0.1 ml of 0.2% BSA (RuiTaibio,
Beijing, China). A total of 0.6 ml of DMEM or RPMI-1640 medium
supplemented with 10% FBS, serving as a chemoattractant, was
deposited in the lower chamber. Following incubation for 16 h at
37°C in a 5% CO2 atmosphere, the cells were washed with
PBS and fixed with cold 4% buffered paraformaldehyde. The cells in
the upper Transwell filter were removed with a cotton wool tip and
stained with crystal violet. The Transwells were rinsed with
deionized water and air-dried. The filters were photographed, and
the cells in 5 random optical fields were counted to determine
migration, as previously described (27,28).
Data analysis
Data were statistically analyzed using the Prism 5
software programs as previously described (29). Differences between the means were
assessed by paired or unpaired Student's t-test, and P-values
<0.05 were considered to indicate statistically significant
differences.
Results
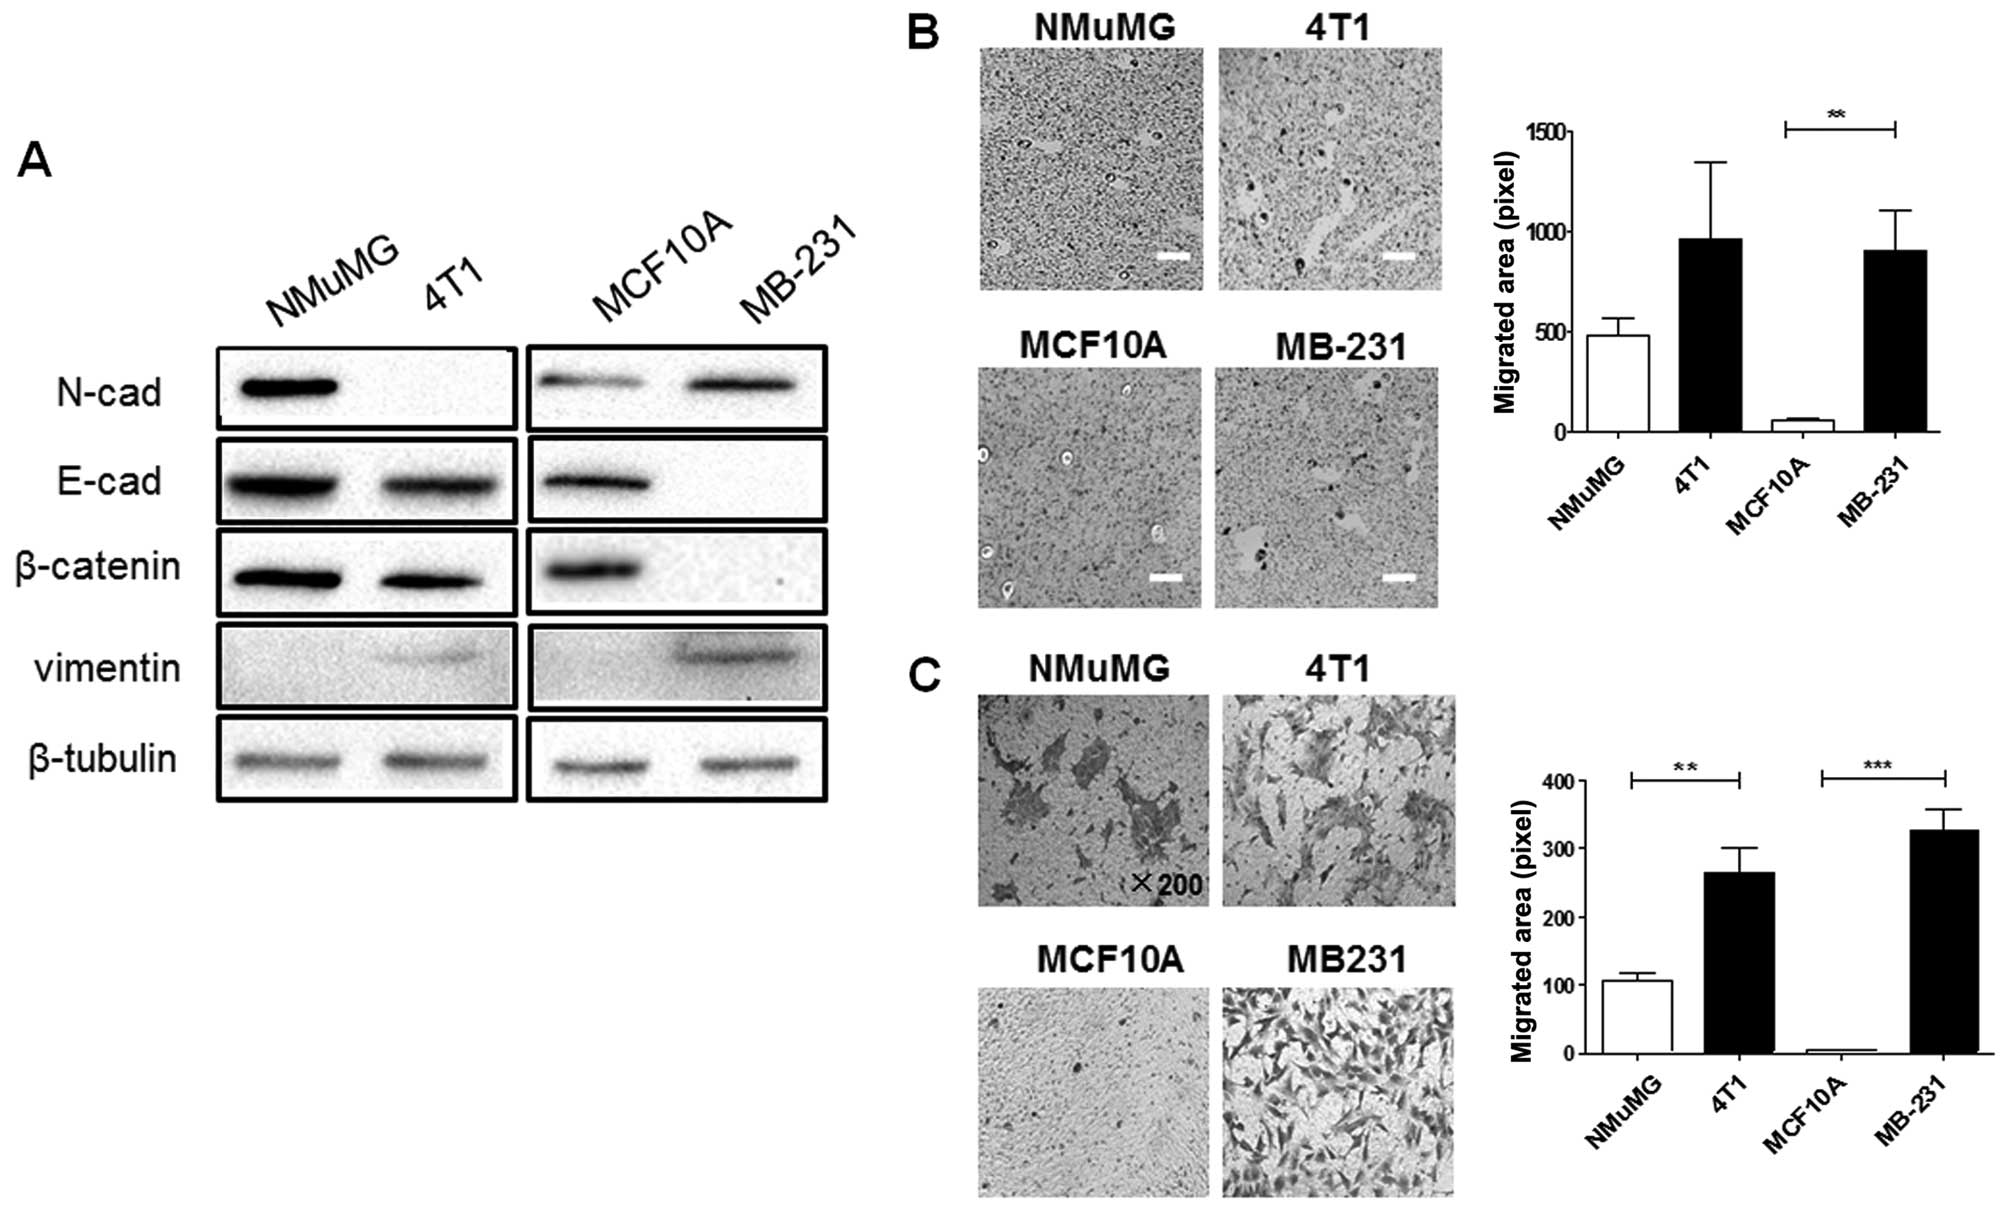
PSA level is higher in malignant cancer
cells than in normal cells
As EMT is one of the main mechanisms involved in the
development of BC metastasis (30), the expression of EMT-related
markers in malignant 4T1 and MB-231 cells, in comparison with
non-malignant NMuMG and MCF10A cells was determined by western blot
analysis (Fig. 1A). The decreased
expression of E-cadherin and β-catenin, as well as the increased
expression of vimentin, were observed in the 4T1 and MB-231 cells.
Tumor progression towards metastasis is often depicted as a
multistage process in which malignant cells spread from their
original site to colonize distant organs through acquired mobility
and migration ability (31,32). In this experiment, increased
motility (Fig. 1B) and migration
(Fig. 1C) were observed in
malignant 4T1 and MB-231 cells compared with normal NMuMG and MCF
10A cells.
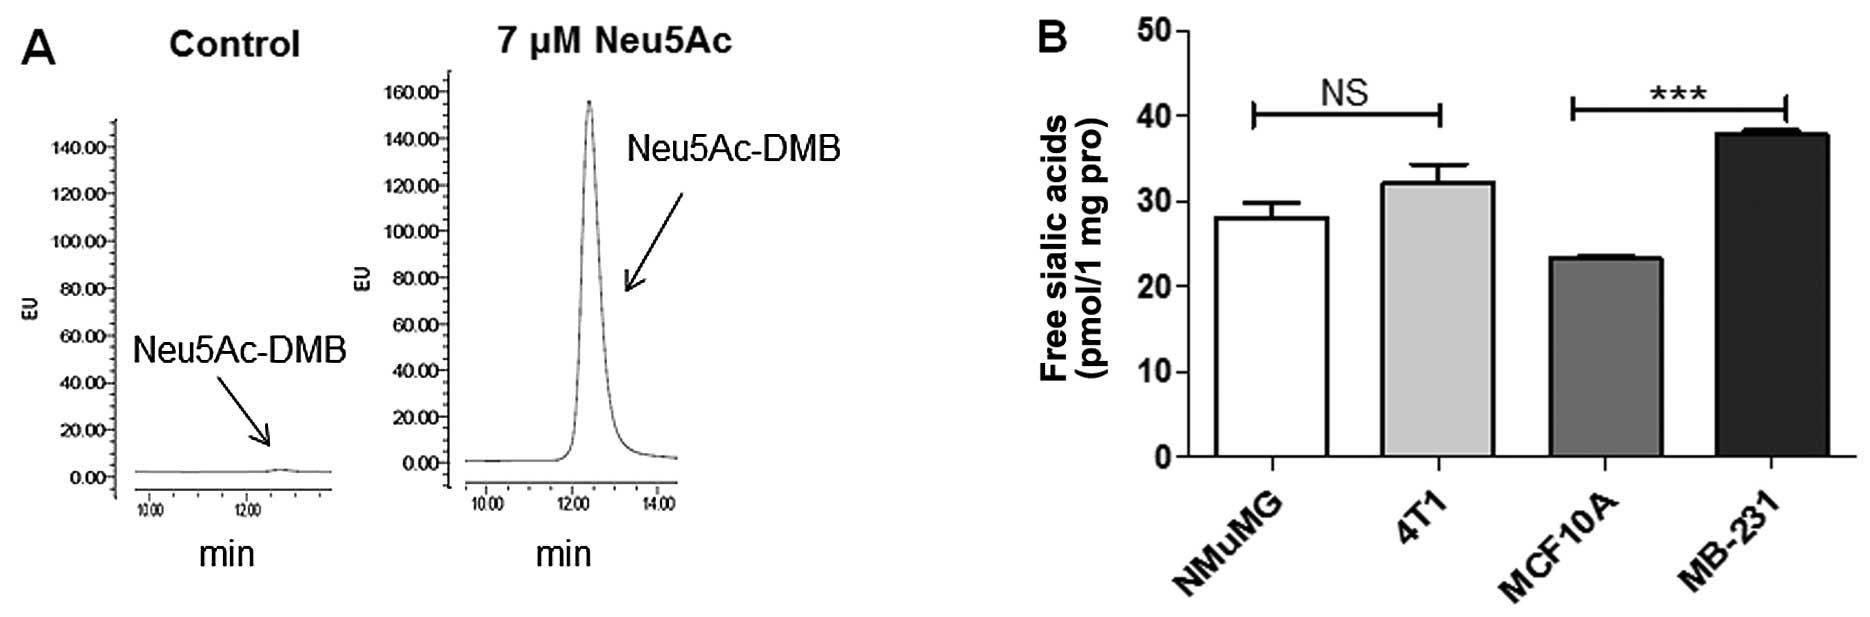
In view of the findings that PSA is re-expressed in
many types of tumor, we thus compared PSAs on N-glycans in these 4
cell lines. PSAs display unique modifications of N-glycans,
particularly of NCAM (33). As
shown in Fig. 2A, PSAs on
N-glycans were hydrolyzed under mild acidic conditions, and free
sialic acids (reflecting PSA levels) were detected using a
fluorescence-labeling method followed by HPLC. In comparison with
the NMuMG or MCF10A cells, the PSA level was slightly higher in the
4T1 cells and significantly higher in the MB-231 cells (Fig. 2B). These findings suggest that a
high PSA expression is associated with the enhanced invasiveness
and metastasis of BC cells.
PSA expression level is increased in
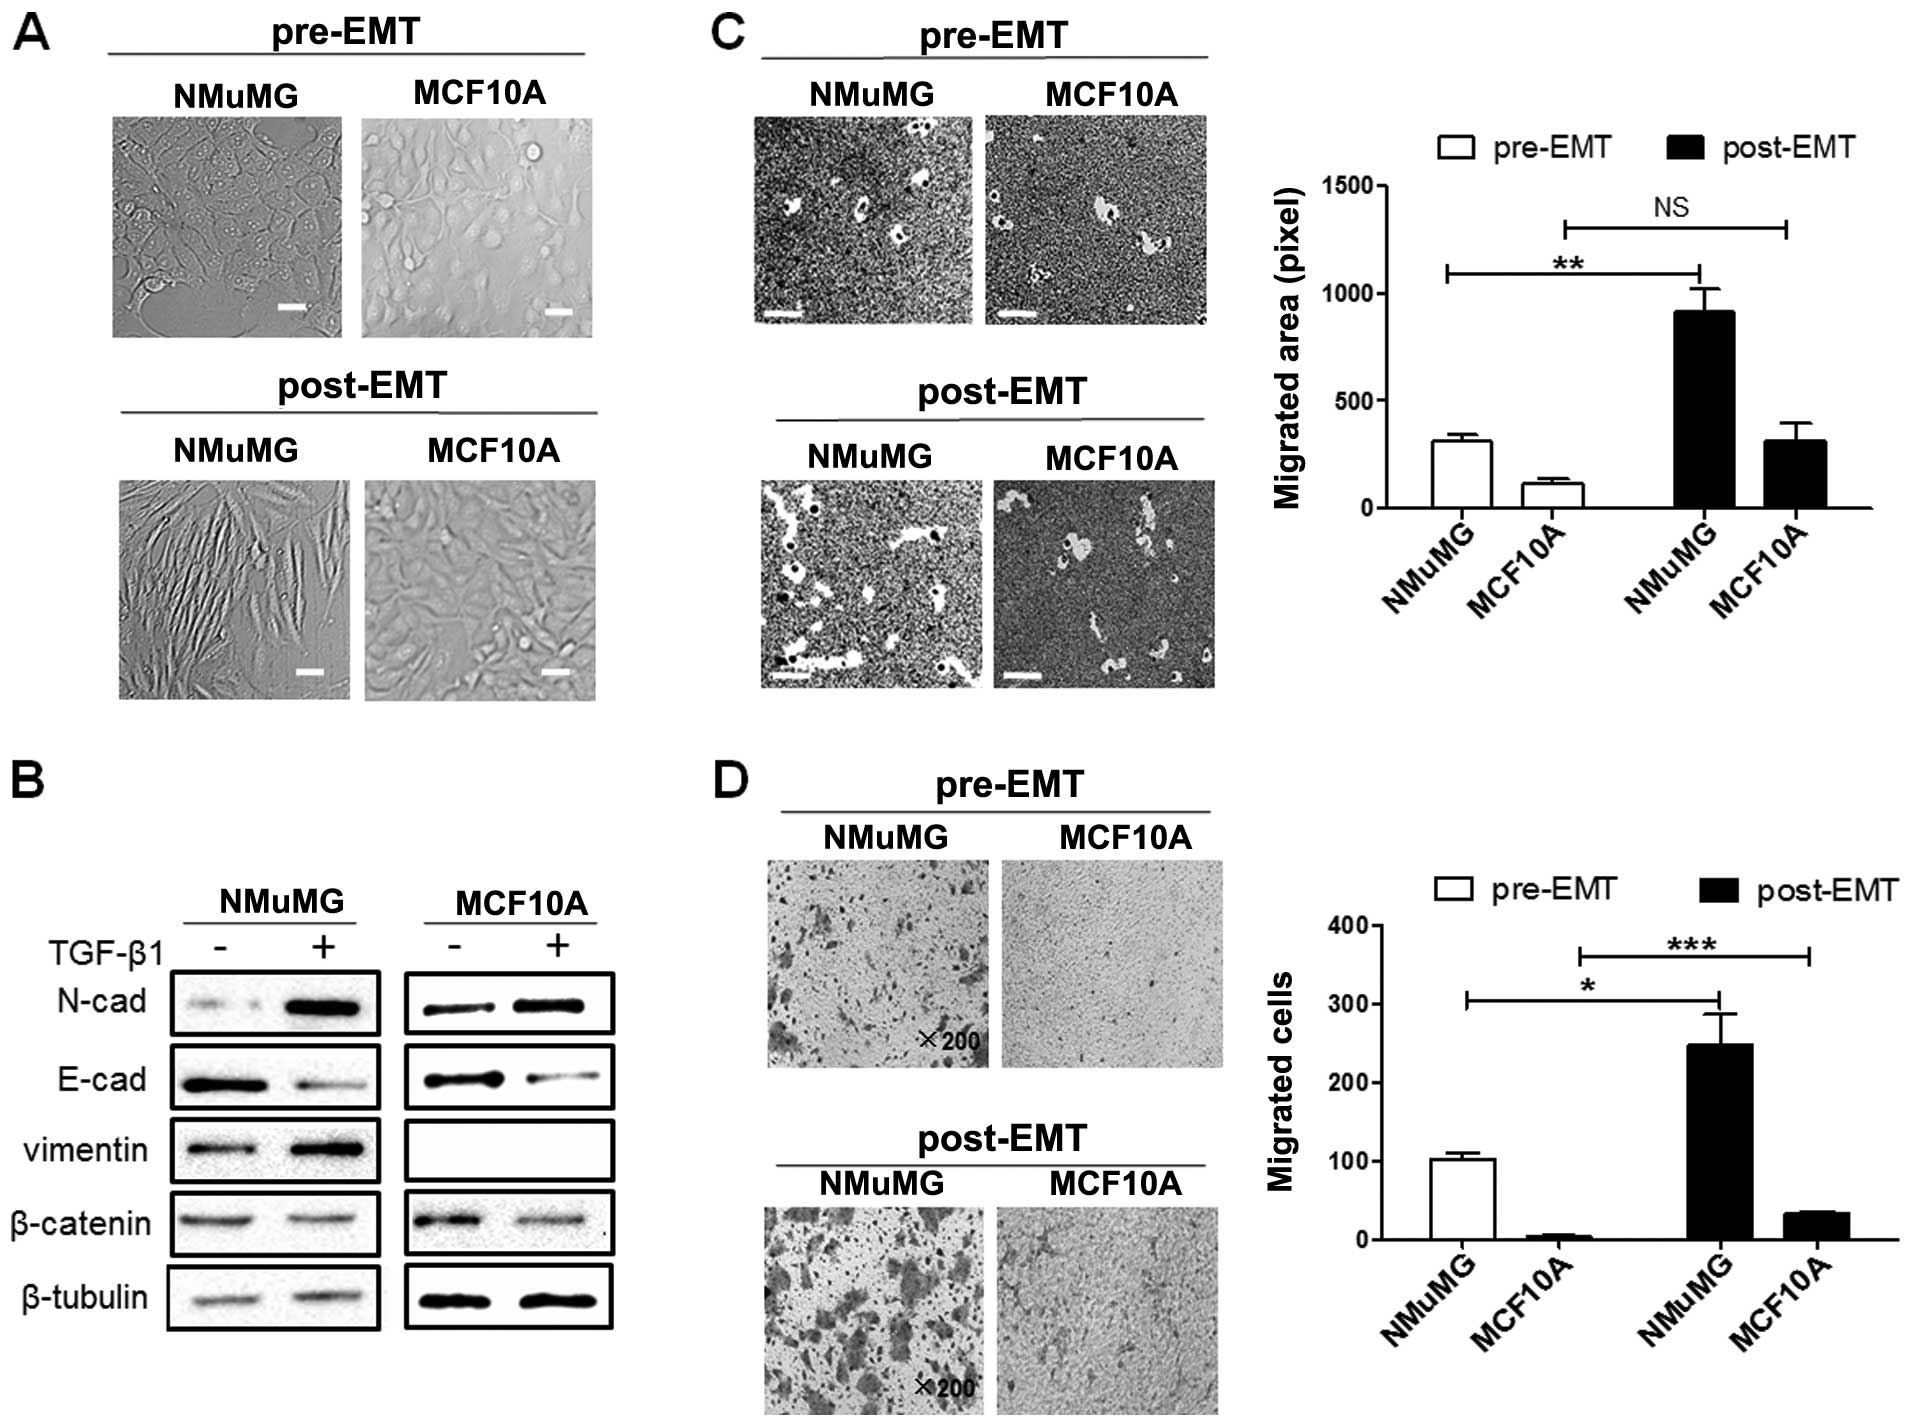
NMuMG and MCF10A cells undergoing EMT
The EMT process has been shown to be associated with
cancer cell motility and metastasis. The non-malignant NMuMG and
MCF10A cells were treated with TGF-β1 to induce EMT, as previously
described (34). The treated
cells displayed a spindle-like, elongated morphology (Fig. 3A), a reduced β-catenin expression,
an increased vimentin expression, and exhibited the typical
'cadherin switch' from E-cadherin to N-cadherin (Fig. 3B). The TGF-β1-treated NMuMG cells
displayed an enhanced motility and migration, whereas the
TGF-β1-treated MCF10A cells exhibited only enhanced migration
(Fig. 3C and D). The levels of
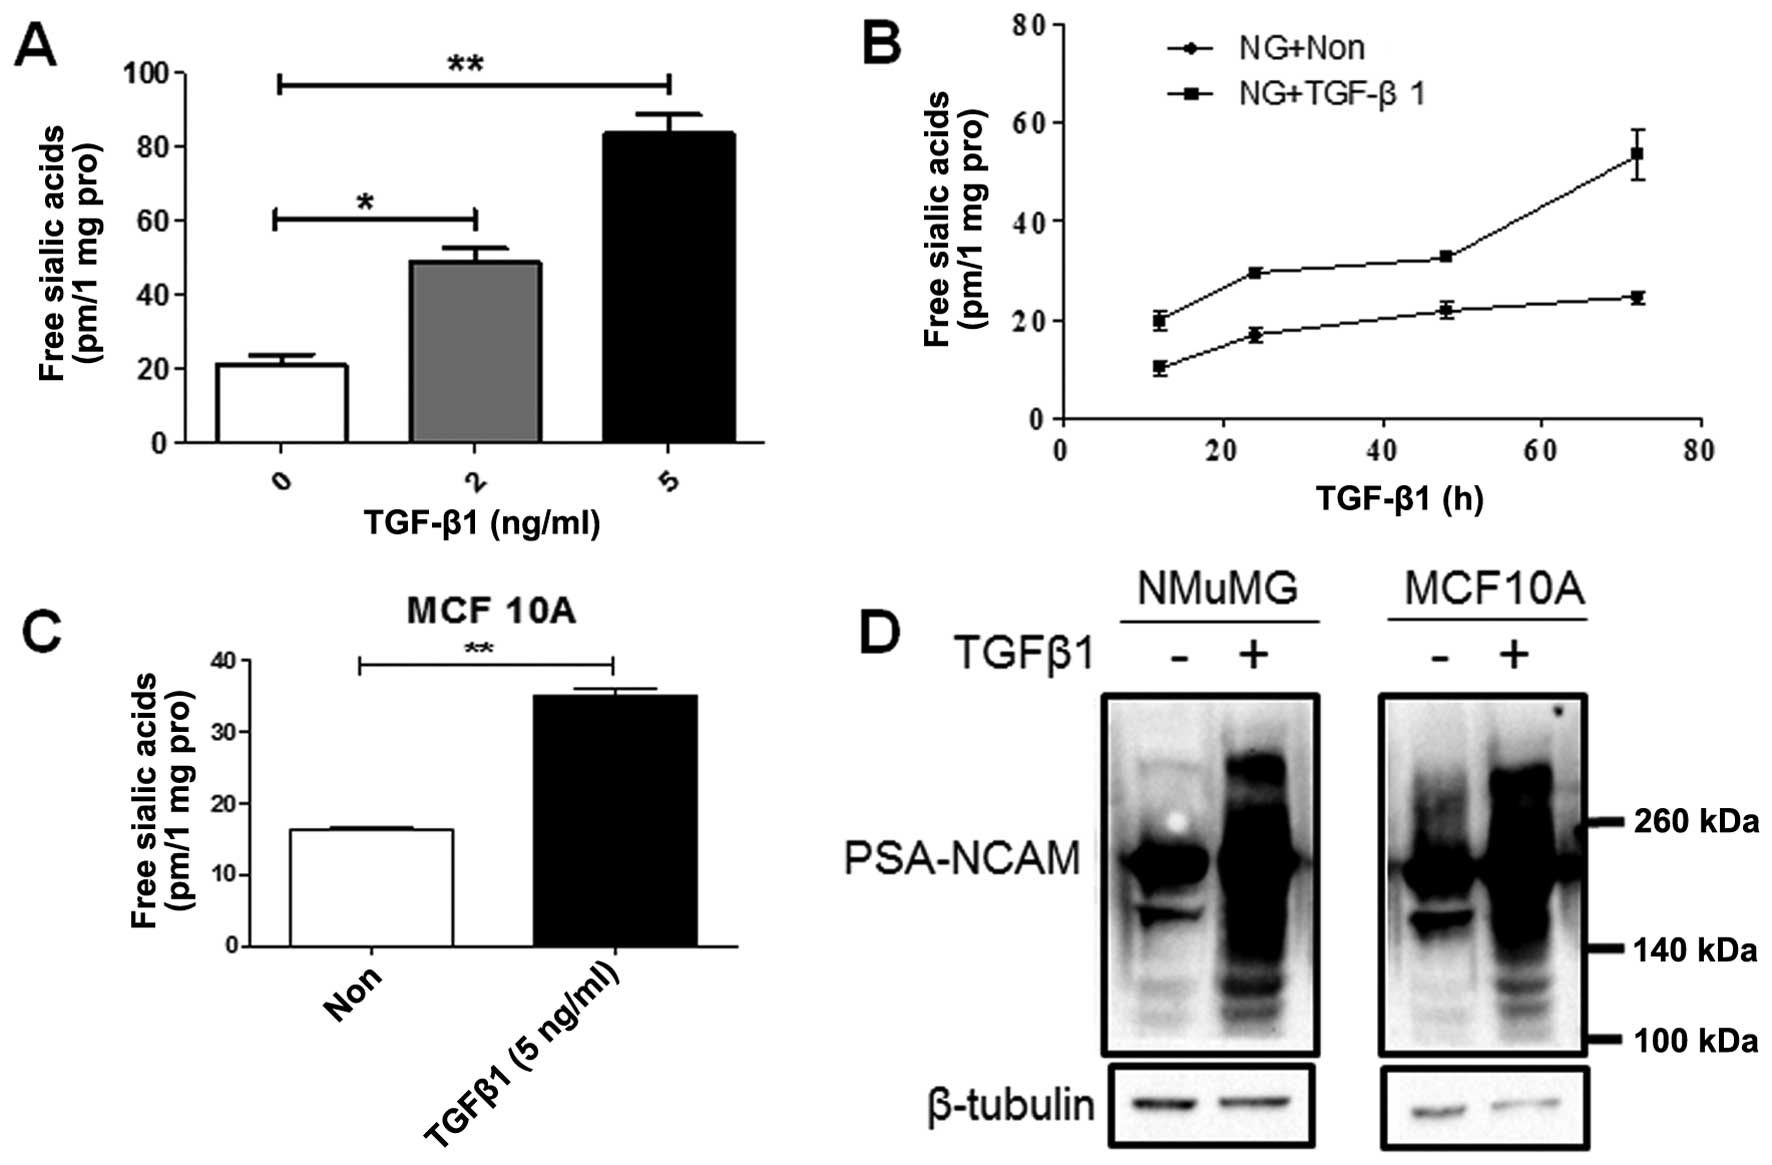
free sialic acid released from N-glycan as a function of dose and
time were examined in the NMuMG cells following treatment with
TGF-β1. The NMuMG cells treated with 2 and 5 ng/ml TGF-β1 exhibited
free sialic acid levels approximately 2.5- and 4-fold higher,
respectively, than those of the untreated cells (Fig. 4A). In order to examine the effects
of high levels of PSA on cell behavior, 5 ng/ml TGF-β1 was used in
the following experiment. The PSA levels were higher in the
TGF-β1-treated NMuMG cells at various time points (Fig. 4B). Similar results were obtained
for the TGF-β1-treated MCF10A cells (Fig. 4C). Moreover, a high expression of
polysialylated NCAM (PSA-NCAM) was observed in the NMuMG and MCF10A
cells undergoing EMT (Fig.
4D).
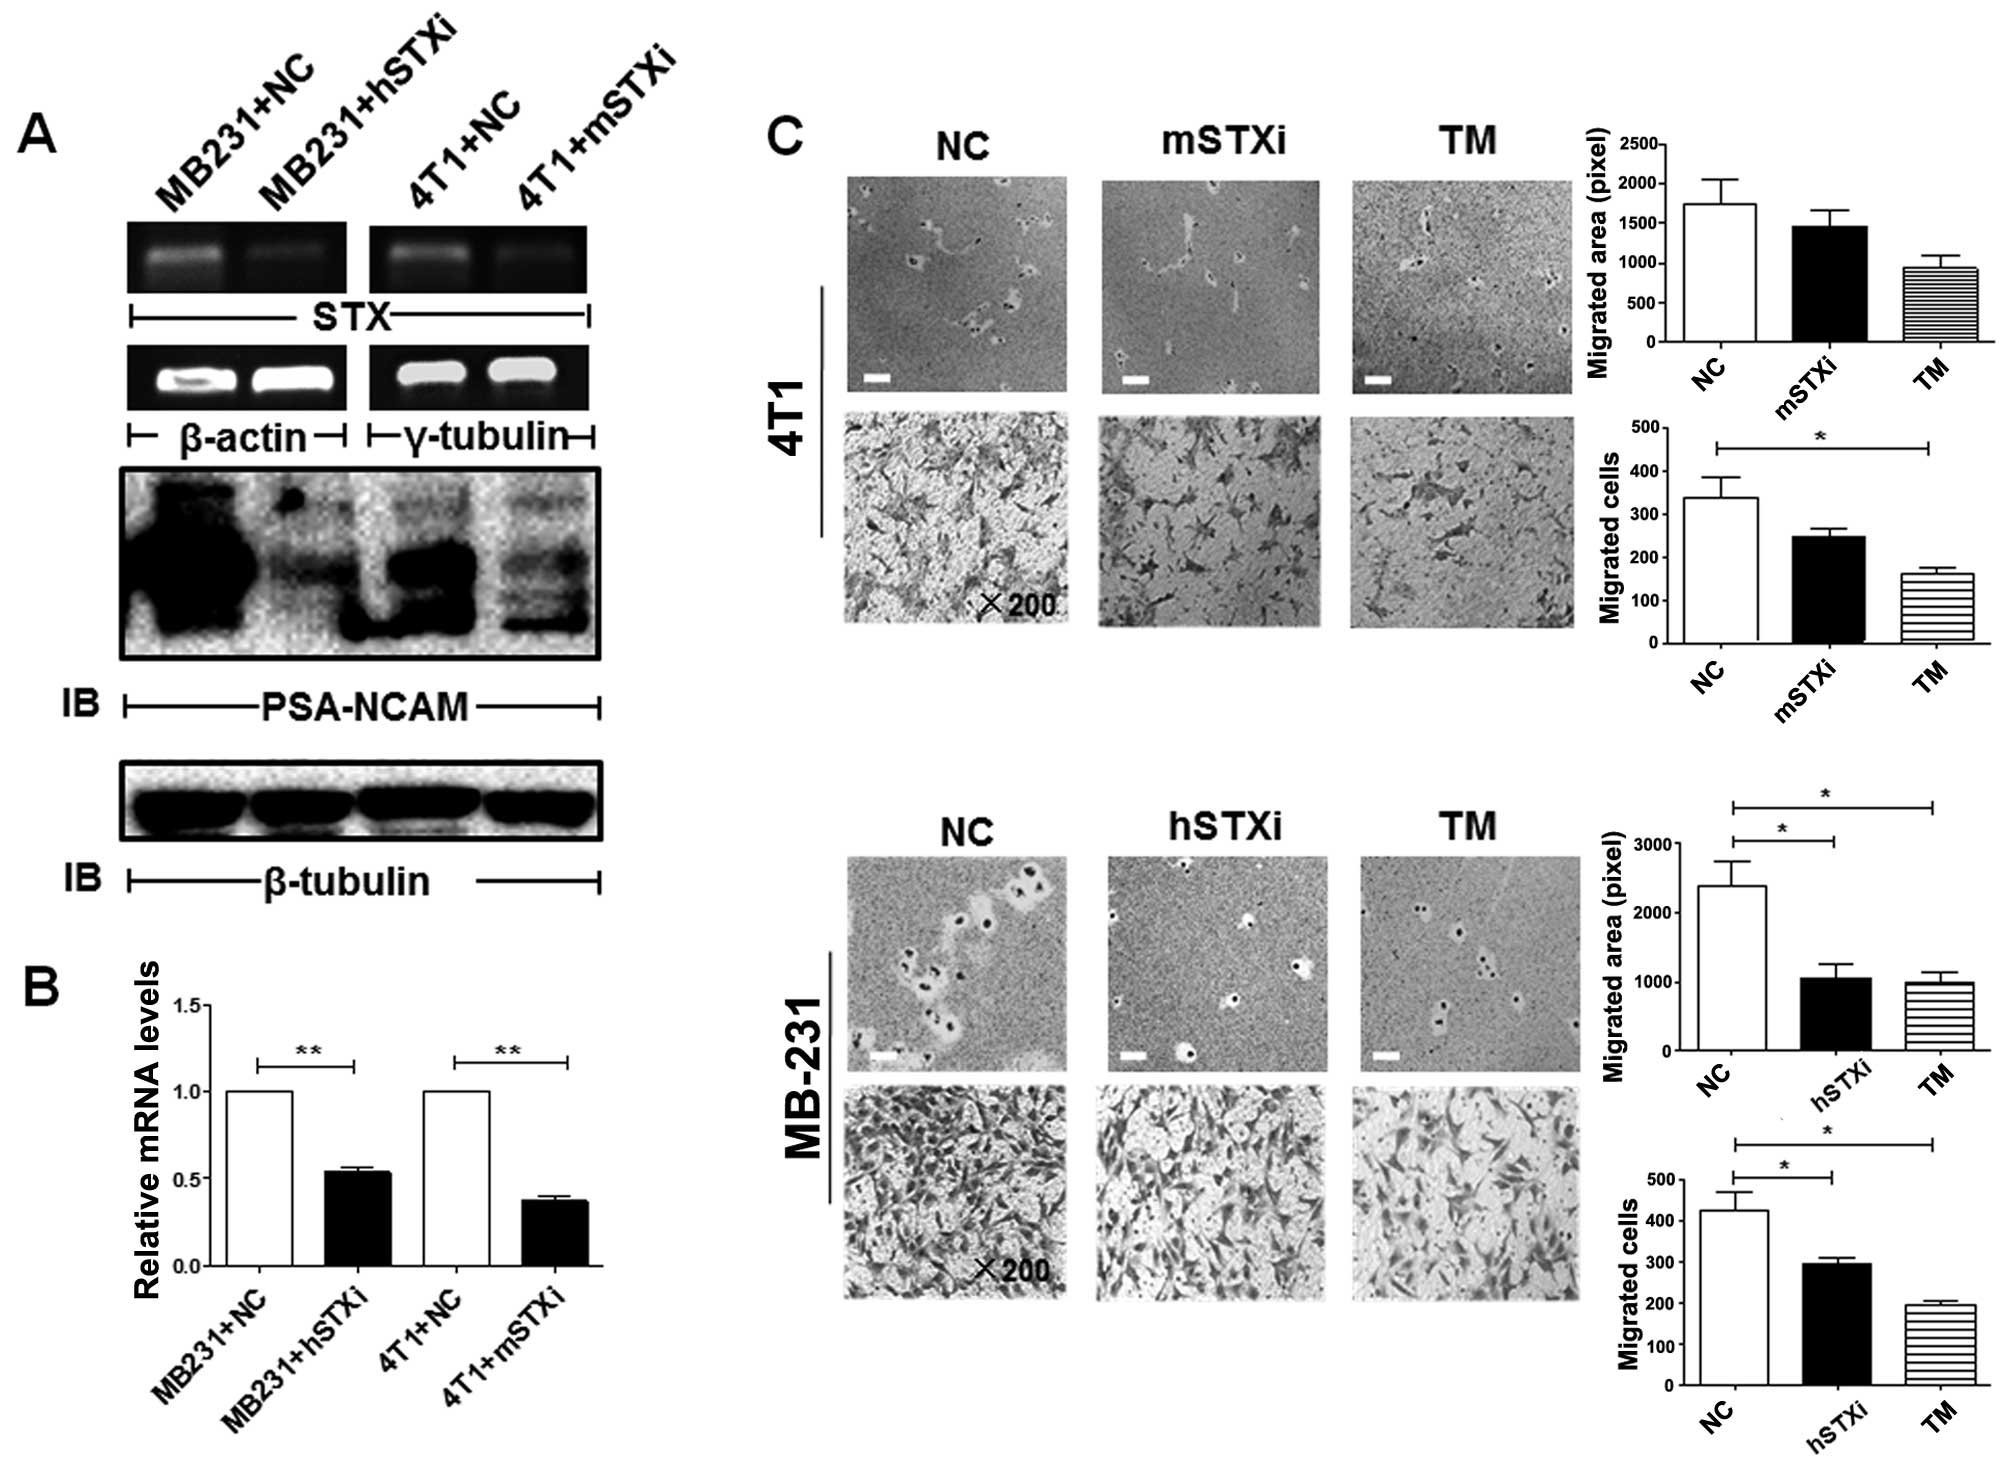
PSA facilitates cell migration in
malignant breast cells and in normal breast cells undergoing
EMT
In view of the correlation of high PSA levels with
the facilitation of cell migration and cell motility during EMT, we
examined the possibility that the downregulation of PSA reverses
EMT in malignant cells. Semi-quantitative RT-PCR was used to
evaluate the mRNA levels of PST and STX, two major
polysialyltransferases responsible for PSA synthesis. The 4T1 and
MB-231 cells exhibited high levels of STX, but undetectable
levels of PST (data not shown). The silencing of PSA by the
suppression of STX resulting in the decreased expression of
PSA-NCAM (Fig. 5A and B), or by
treatment with tunicamycin (which blocks N-glycan synthesis),
significantly decreased the migration of both malignant cell lines
(4T1 and MB-231) (Fig. 5C). The
downregulation of PSA resulted in the decreased motility of the
malignant BC cells (MB-231), but not of the 4T1 cells (Fig. 5C).
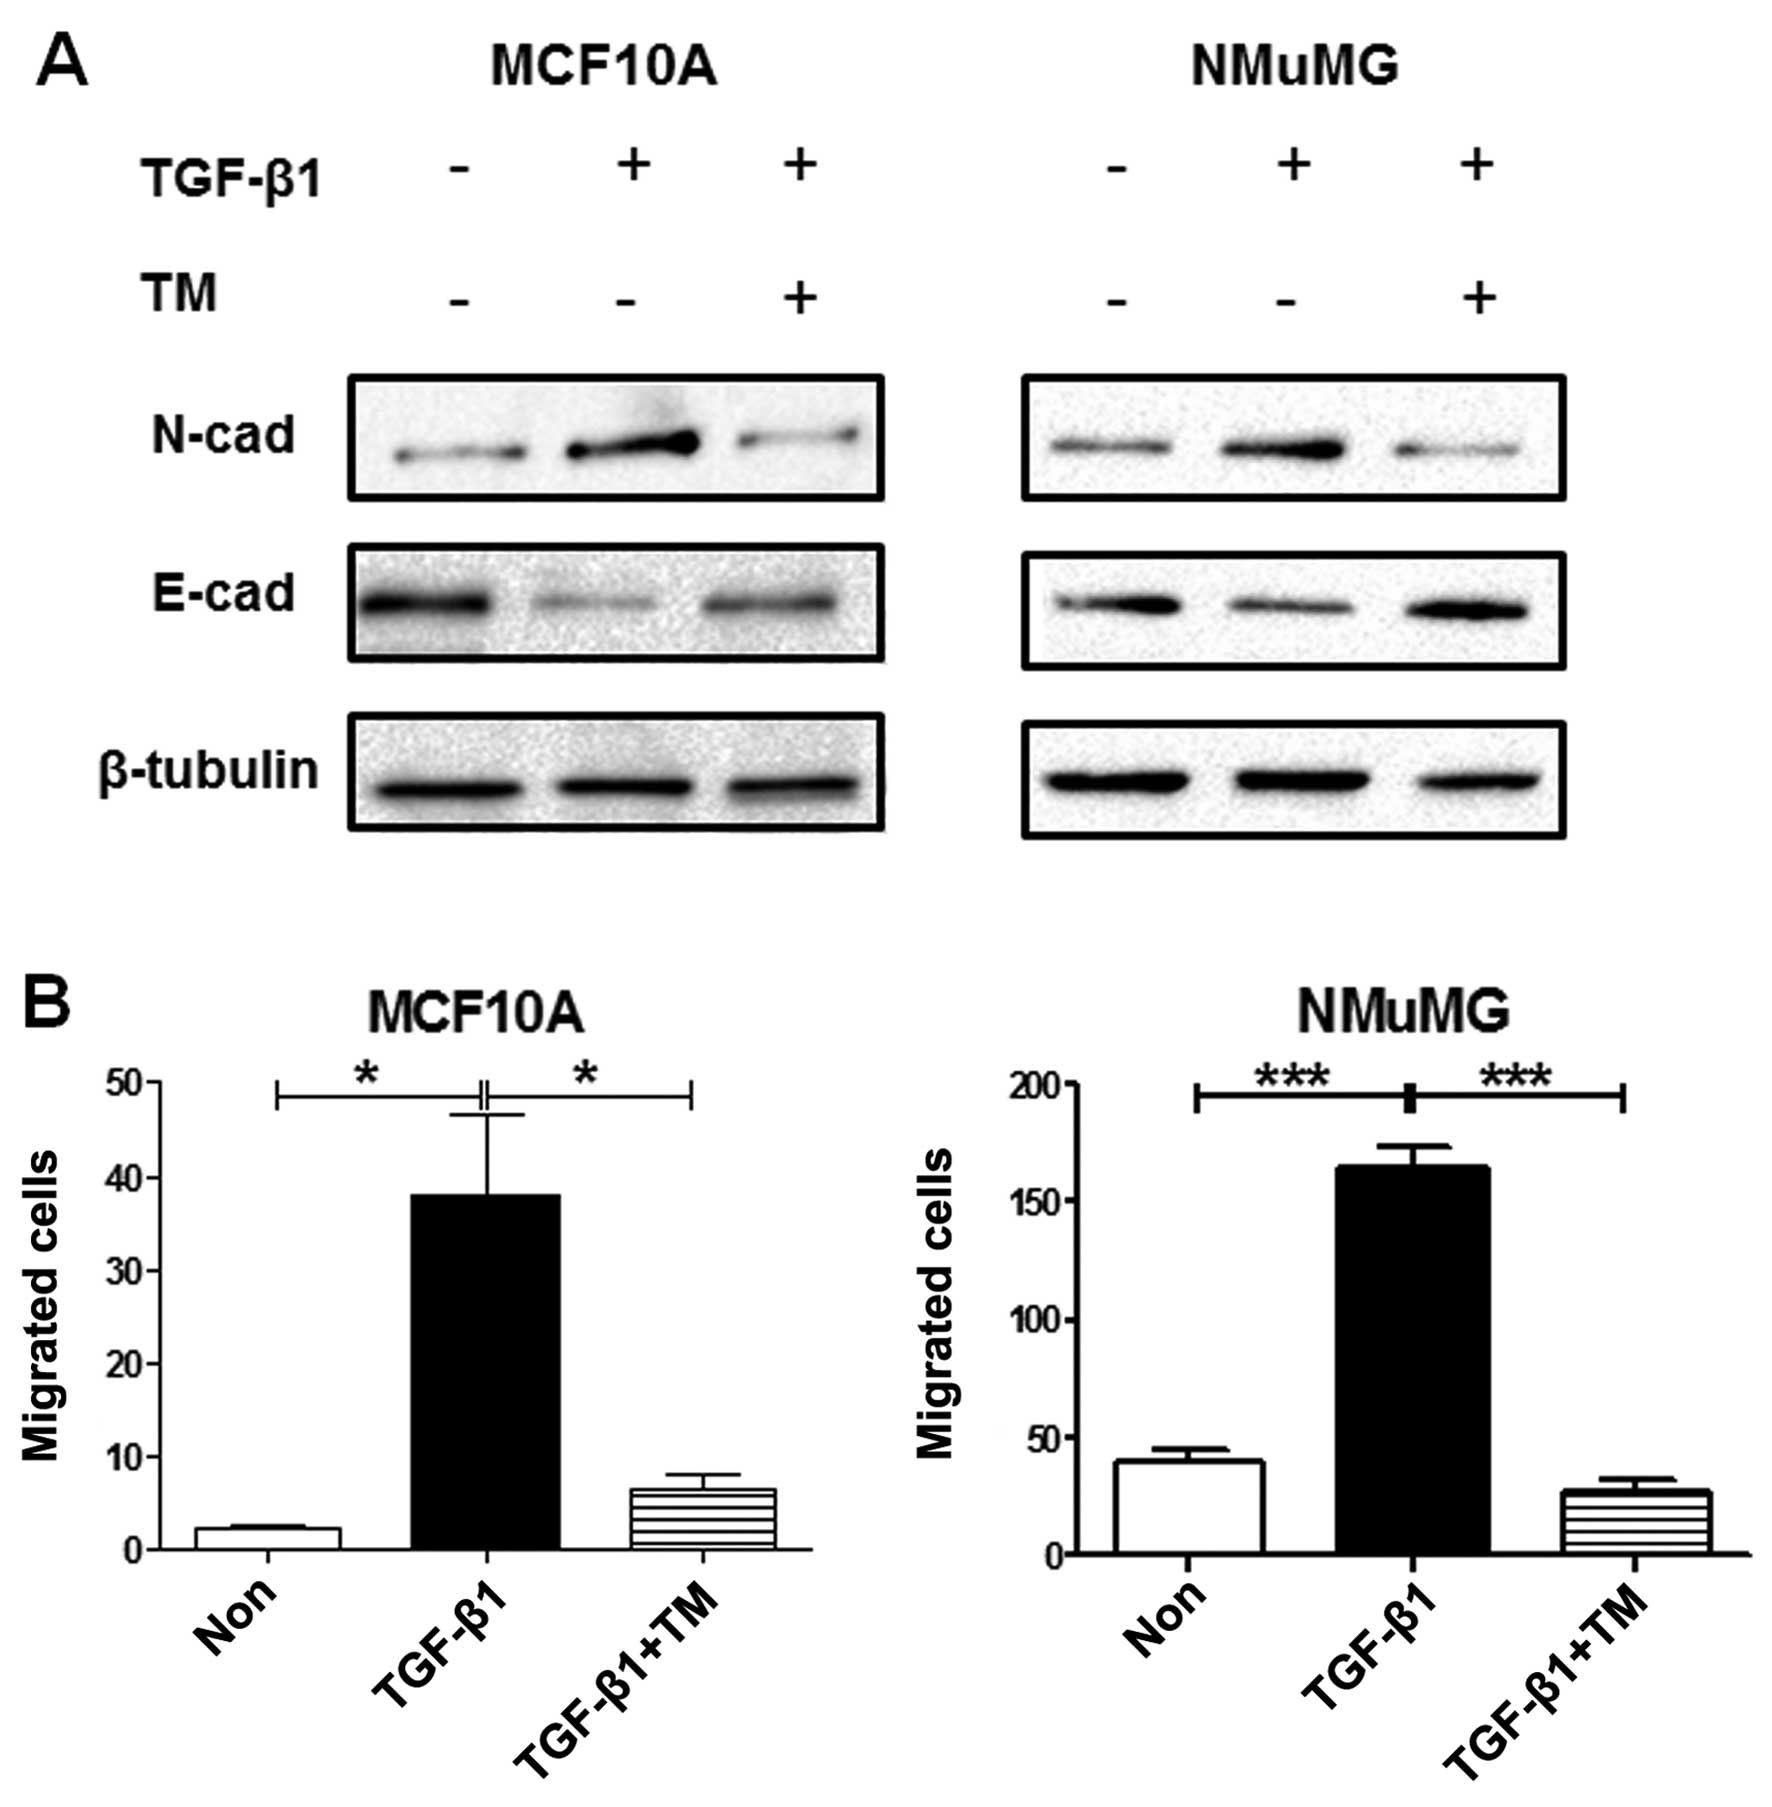
To further investigate the role of PSA during EMT,
we used tunicamycin to inhibit N-glycan synthesis in normal cells
undergoing EMT. The typical 'cadherin switch' from E-cadherin to
N-cadherin and the enhancement of cell migration in the
TGF-β1-treated MCF10A and NMuMG cells were reversed by the presence
of tunicamycin (Fig. 6).
PSA expression level is related to the BC
stage
The patient characteristics and PSA levels in the
normal tissues (n=4) and malignant tissues (n=20) are listed in
Tables I and II. The PSA levels were lower (pmol
level) in the normal tissues and higher in the malignant tumor
tissues (Fig. 7A). The difference
in the PSA levels between the normal tissues and advanced-stage BC
tissues was significant (P<0.0001). The PSA level was
consistently higher in the tumor tissues compared to the normal
controls. In comparison with the controls, the PSA level was
highest in the samples obtained from patients with TNM stage III BC
(n=6, P<0.0001), followed by stage II (n=8, P<0.0001) and
stage I (n=6, P=0.0085), suggesting that an increased PSA
expression correlates with disease progression (Fig. 7B).
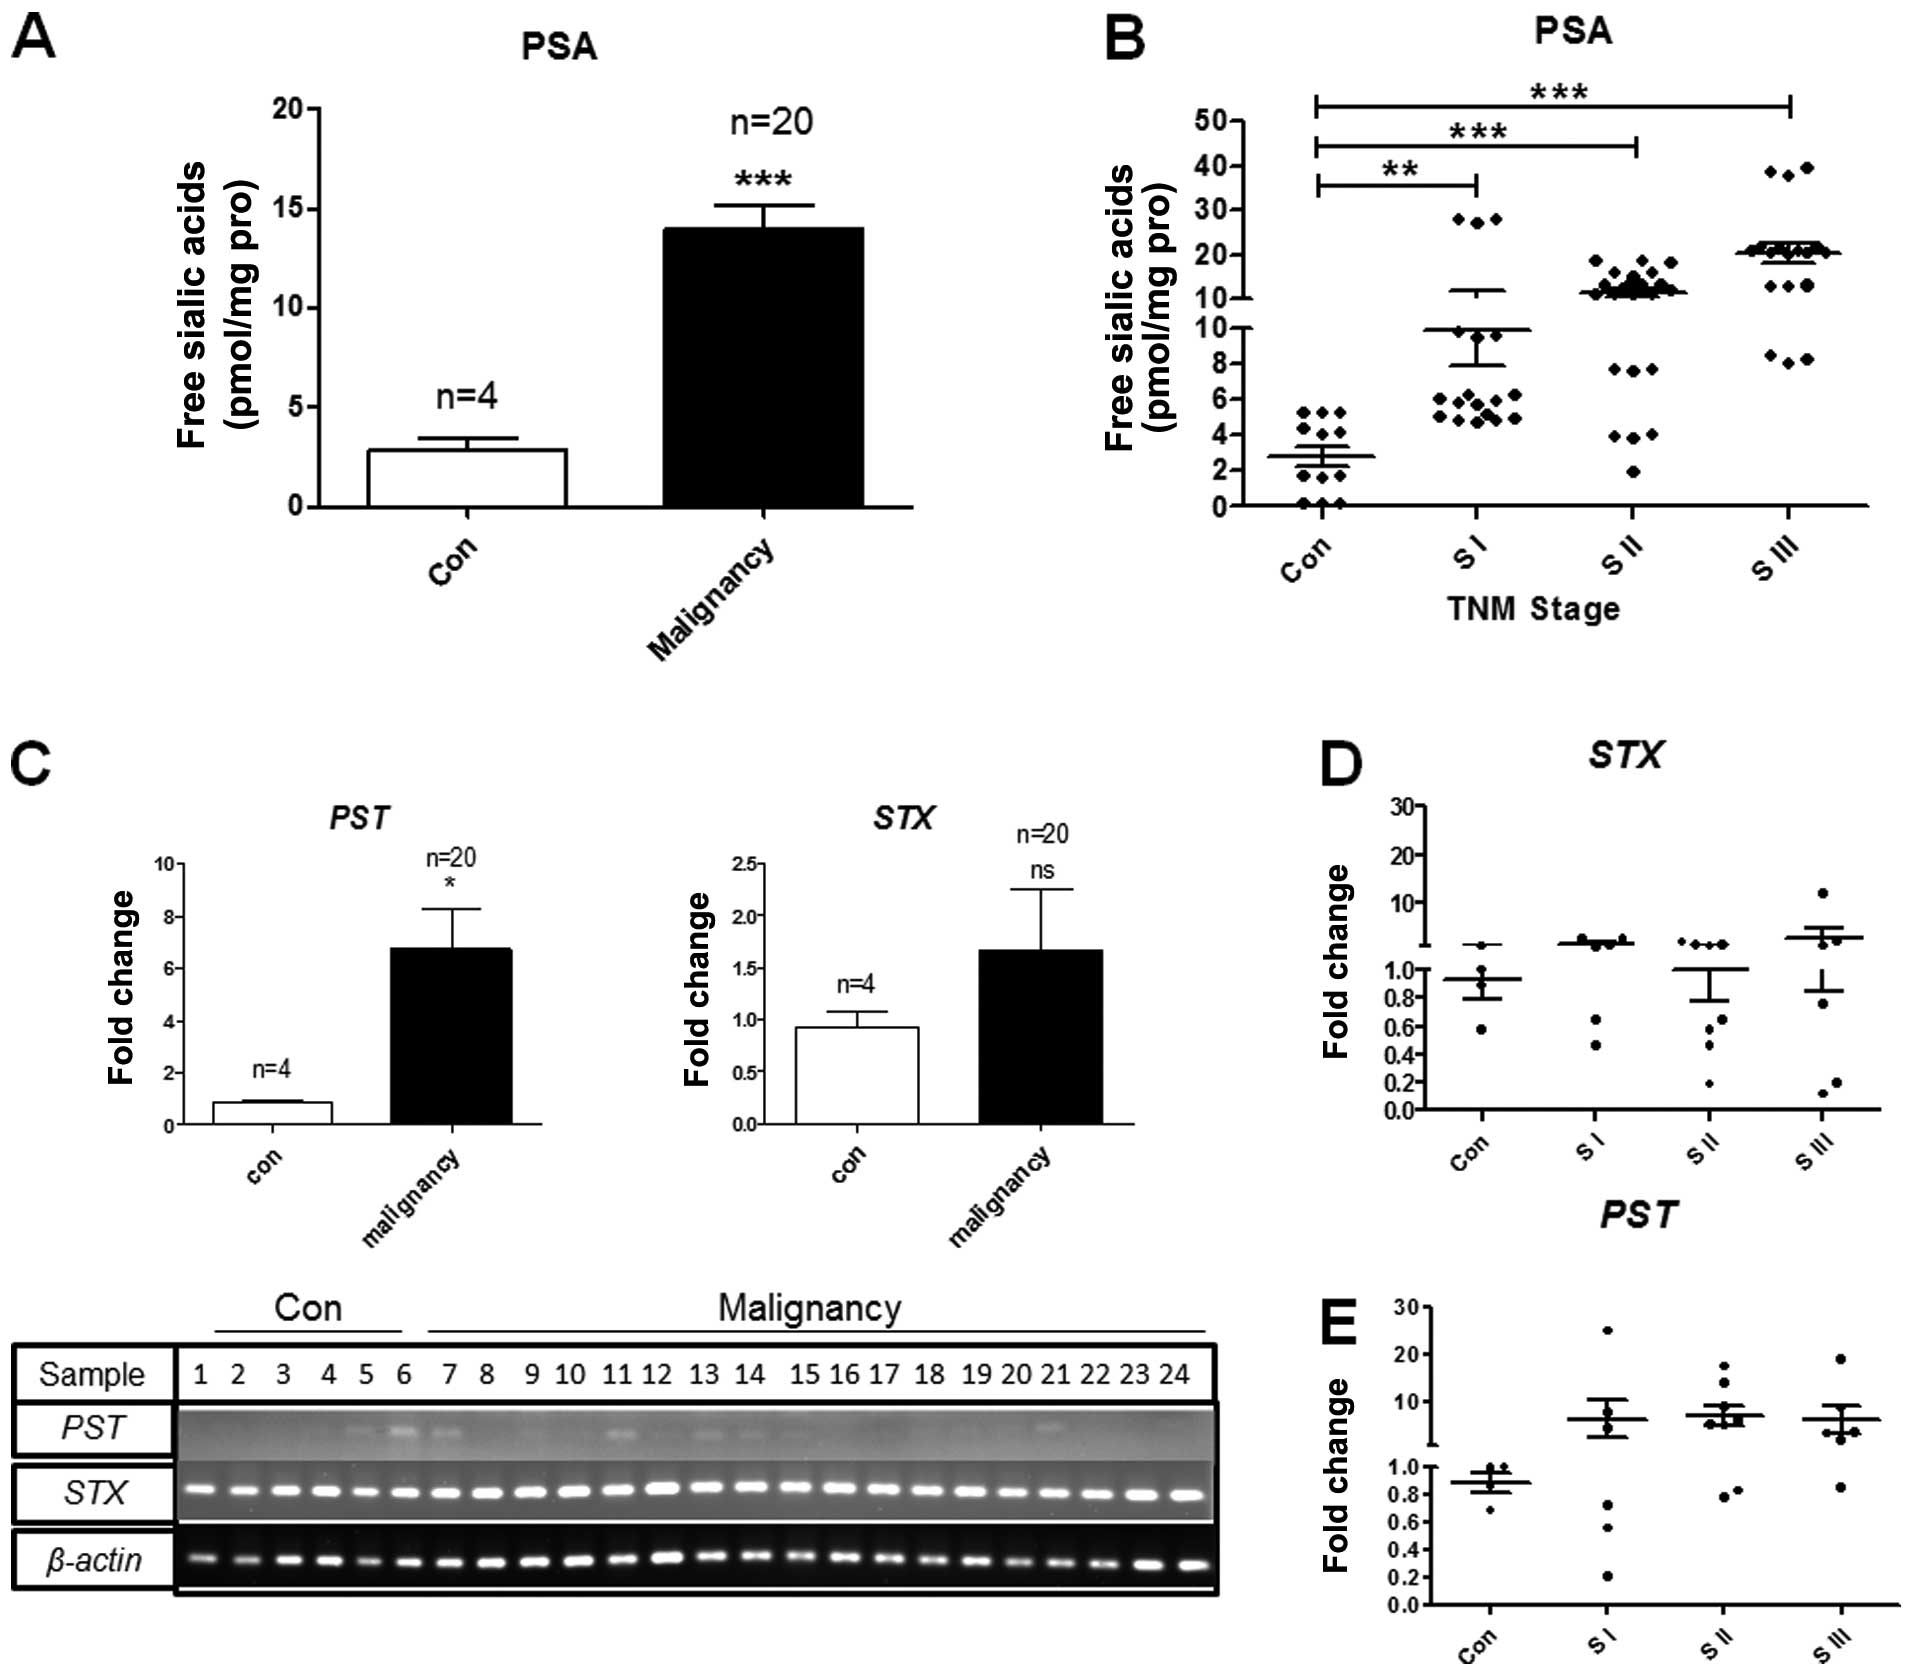 | Figure 7Polysialic acid (PSA) and
polysialyltransferase expression in human breast cancer (BC)
tissues. (A and B) PSA expression in patients with BC. Glycans were
separated and analyzed by HPLC as described in Fig. 2A and B. PSA concentration of each
sample was calculated based on a standard sialic acid (Neu5Ac)
curve. (A) PSA levels in normal and malignant BC tissues. The
values shown are the means ± SD from 3 independent experiments. (B)
Correlation of PSA level with BC stages. PSA level was assessed in
the 24 samples and classified as normal tissue (control; Con, n=4),
TNM stage I (S I, n=6), II (S II, n=8), or III (S III, n=6). Each
sample was visualized 3 times (24×3), and data were analyzed by an
unpaired t-test. **P=0.001 to 0.005;
***P<0.001. (C) mRNA levels of polysialyltransferase
ST8SiaII (STX) and polysialyltransferase ST8SiaIV
(PST) in BC tissues. Expression of PST and STX
genes in clinical BC samples assessed by semi-quantitative and
quantitative RT-PCR. mRNA levels of PST and STX in
malignant tissues (malignancy, n=20) were compared with those in
normal tissues (con, n=4) by quantitative RT-PCR. The gels showed
the mRNA level of PST or STX in 24 samples (normal,
n=4; malignant, n=20). The values shown are the means ± SD from
triplicate experiments. β-actin, control. *P<0.05;
NS, not significant. (D and E) mRNA level of (D) STX and (E)
PST assessed by RT-qPCR. The values shown are the means ± SD
from triplicate experiments. STX and PST levels were
assessed in the 24 samples and classified as normal tissue
(control; Con, n=4), TNM stage I (S I, n=6), II (S II, n=8), or III
(S III, n=6). |
 | Table ISialic acid, STX and PST levels in
normal and malignant breast tissue samples. |
Table I
Sialic acid, STX and PST levels in
normal and malignant breast tissue samples.
| Diagnosis | Age (years) | LN(P) | LN | Stage | D | Sia | STX (fd) | PST (fd) |
|---|
| 1 | N | 36 | – | – | – | – | 4.18±0.11 | 0.89±0.05 | 0.87±0.04 |
| 2 | N | 49 | – | – | – | – | 5.23±0.03 | 0.58±0.09 | 1.00±0.03 |
| 3 | N | 35 | – | – | – | – | 1.70±0.03 | 1.25±0.09 | 0.70±0.50 |
| 4 | N | 54 | – | – | – | – | 0.20±0.005 | 1.0±0.00 | 1.00±0.00 |
| 5 | IDC | 54 | 28 | 33 | T2N3M0 IIIc | U | 20.34±0.24 | 0.76±0.10 | 2.07±0.42 |
| 6 | IDC | 50 | 22 | 24 | T1N3M0 IIIc | 2 | 38.39±0.54 | 0.12±0.01 | 19.04±2.93 |
| 7 | IDC | 32 | 16 | 16 | T2N3M0 IIIc | 2.1 | 21.33±0.39 | 0.20±0.05 | 8.75±0.50 |
| 8 | IDC | 60 | 3 | 14 | T4N1M0 IIIb | 6 | 20.89±0.31 | 12.16±1.00 | 0.85±0.04 |
| 9 | IDC | 65 | 2 | 25 | T4N1M0 IIIb | 6.5 | 8.24±0.11 | 1.26±0.18 | 3.66±0.35 |
| 10 | IC | 73 | U | U | T2N2M0 IIIa | 3.4 | 13.04±0.02 | 2.03±0.09 | 3.43±0.27 |
| 11 | SMC | 57 | 1 | 28 | T2N1M0 IIb | 4 | 18.31±0.08 | 1.45±0.16 | 9.15±0.32 |
| 12 | IDC | 35 | 2 | 18 | T2N1M0 IIb | 2.3 | 11.47±0.23 | 2.07±0.49 | 5.97±0.33 |
| 13 | ILC | 42 | 3 | 22 | T2N1M0 IIb | 2.5 | 10.88±0.005 | 0.64±0.07 | 13.91±0.25 |
| 14 | IDLC | 57 | 0 | 23 | T2N0M0 IIa | 2.5 | 13.27±0.02 | 0.57±0.16 | 17.46±1.45 |
| 15 | MC | 51 | 0 | 19 | T2N0M0 IIa | 2.3 | 15.73±0.29 | 0.46±0.07 | 5.05±0.65 |
| 16 | IDC-NS | 33 | 1 | 25 | T1N1M0 IIa | 2 | 3.93±0.05 | 1.22±0.07 | 0.78±0.06 |
| 17 | IDLC | 72 | 1 | 24 | T1N1M0 IIa | 2 | 12.85±0.20 | 1.40±0.15 | 0.83±0.05 |
| 18 | IDC | 54 | 0 | 20 | T2N0M0 IIa | 2.8 | 7.67±0.05 | 0.19±0.10 | 5.26±0.64 |
| 19 | IDC | 39 | 0 | 12 | T1N0M0 I | 1.6 | 6.20±0.08 | 1.15±0.08 | 4.40±0.68 |
| 20 | IDC | 54 | 0 | U | T1N0M0 I | 1.2 | 18.47±0.19 | 0.65±0.09 | 7.86±0.35 |
| 21 | IDC | 32 | 0 | U | T1N0M0 I | U | 9.37±0.09 | 1.27±0.08 | 24.94±0.92 |
| 22 | IDC | 65 | 0 | U | T1N0M0 I | 1.0 | 5.79±0.05 | 0.46±0.06 | 0.72±0.07 |
| 23 | IDC | 35 | 0 | U | T1N0M0 I | 1.5 | 5.00±0.08 | 2.70±0.62 | 0.21±0.02 |
| 24 | IDC | 39 | 0 | U | T1N0M0 I | U | 4.95±0.03 | 2.73±0.31 | 0.56±0.08 |
| Table IIAssociation of disease
characteristics with polysialyltransferase (STX or
PST) gene expression in malignant BC patients. |
Table II
Association of disease
characteristics with polysialyltransferase (STX or
PST) gene expression in malignant BC patients.
|
Characteristics | TNM stage
|
|---|
| I | II | III | Total |
|---|
| No. of
patients | 6 | 8 | 6 | 20 |
| Site |
| Left | 2 | 2 | 3 | 7 |
| Right | 4 | 6 | 3 | 13 |
| Histology |
|
Invasive/infiltrating ductal | 6 | 2 | 5 | 13 |
|
Invasive/infiltrating lobular | 0 | 1 | 0 | 1 |
|
Invasive/infiltrating ductal-lobular | 0 | 2 | 0 | 2 |
| Others | 0 | 3 | 1 | 4 |
| Lymph node |
| Absent | 6 | 3 | 0 | 9 |
| Involvement |
| Present | 0 | 5 | 6 | 11 |
| Unknown | 0 | 0 | 0 | 0 |
|
STX-positive | 6/6 (100%) | 8/8 (100%) | 6/6 (100%) | 20/20 (100%) |
|
PST-positive | 3/6 (50%) | 6/8 (75%) | 5/6 (83%) | 14/20 (70%) |
PST mRNA level may serve as an indicator
for human BC
The aberrant expression of polysialyltransferases is
often observed in malignant tumors and has thus been considered as
a novel target for detection or treatment of metastatic cancer
(35). As an enhanced level of
PSA was observed in our clinical BC samples, we wished to examine
the expression of polysialyltransferases between normal tissues and
malignant tissues. We used semi-quantitative and quantitative
RT-PCR to examine STX and PST expression at the mRNA
level in BC tissues (Table I).
STX was widely and highly expressed in all tissues examined
(n=24) with no significant differences when compared with the
normal controls (Fig. 7C and D).
However, PST expression was significantly increased in the
malignant tumor tissues compared to the normal tissues (Fig. 7C and E). PST was expressed
distinctively in the tumor samples obtained from patients with
stage I (n=6, 50%), II (n=8, 75%), and III (n=6, 83%) BC (Table II and Fig. 7E). The PST enzyme is clearly
expressed in high-stage BC tissues, but not in normal tissues. The
difference in the PST level between the normal tissues (n=4)
and high-stage/lymph node-positive tissues (n=6, stage III) from
patients with BC was significant at r2=0.8, indicating
that PST expression is increased in BC tissues and correlates with
cancer progression.
Discussion
Highly sialylated glycans on the surface of cancer
cells often correlate with tumor invasiveness and metastasis
(33). α2,6-sialylation on the
cell surface has been shown to affect the adhesion of MDA-MB-435
breast carcinoma cells (36).
Another study revealed that negatively charged PSA led to the
increased motility of pancreatic carcinoma cells and subsequently
reduced cell adhesion (9). In
this study, to assess PSA levels on N-glycans, we applied a
DMB-labeling method followed by HPLC, to quantify PSA expression at
the pmol level. Our results revealed an increased motility of
breast carcinoma 4T1 and MB-231 cells in comparison with the
non-malignant NMuMG and MCF10A cells. PSA levels on N-glycans were
higher in malignant mouse and human cell lines.
Altered PSA levels were observed in the NMuMG and
MCF10A cells undergoing TGF-β1-induced EMT. The EMT process in our
models involved increased motility and migration. PSA expression in
the cells undergoing EMT increased in a TGF-β1 dose- and
time-dependent manner. We further investigated the role of PSA in
malignant and normal breast cells undergoing EMT by downregulating
PSA biosynthesis. The partial removal of PSA from malignant BC
cells using siRNA decreased migration and motility. The treatment
of normal breast cells with tunicamycin, an inhibitor of N-glycan
synthesis, indicated a similar role for PSA during EMT. The
suppression of PSA did not cause significant alterations in the
typical EMT markers (aside from reduced cell migration) in these
cell models. Our findings suggest that PSA has a greater effect on
cell migration than cell motility in malignant cells.
A previous study demonstrated an increased
expression of PSA and sialyltransferases in the sera of patients
with BC (11). In this study, we
directly examined the expression of PSA and polysialyltransferase
genes in human BC tissues, and evaluated the correlation between
the PSA expression level and disease stage in 24 tissue samples
from patients with BC and normal controls. PSA expression was
higher in the clinical BC specimens than in the normal tissues
obtained from patients with BC. Taken together, our findings
indicate that PSA expression in BC tissues is related to the TNM
stage.
The polysialyltransferases STX and PST
differentially and dependently contribute to the re-expression of
PSA based on the histological origin of the tumor (37) and are regarded as anti-metastatic
therapeutic targets. It has been demonstrated that STX is more
important than PST, due to its dominant expression in cells and
tissues (35). In the present
study, we observed a marked increase in PST mRNA expression.
The PST gene exhibited a higher expression in the
advanced-stage cases than in normal tissues, whereas the STX
gene was widely and highly expressed in all clinical cases.
Polysialyltransferase expression appears to be the basis for the
aberrant expression of sialylated structures on N-glycans from BC
tissue samples. The PST gene plays a crucial role in BC
progression and is a potential target for molecular therapy of
BC.
In conclusion, our data demonstrate that PSA is
highly expressed in malignant BC cells and in normal mouse mammary
and human breast cell lines undergoing EMT. The effects of PSA on
cell migration were more pronounced than those on cell motility in
malignant BC cells. PSA expression correlates with the TNM stage in
human BC samples and depends on PST activity, whereas STX is
expressed consistently in both normal and BC tissues. The detailed
functions of these two polysialyltransferases remain unclear,
however. A previous in vitro study found that PST forms more
highly polysialylated N-glycans than does STX (38). Our finding of a higher PST
expression in advanced-stage BC may reflect the presence of more
highly polysialylated N-glycans in these patients. It remains to be
clarified whether the increased PSA expression in BC results from
synthesis by PST alone or by PST in cooperation with STX.
Acknowledgments
This study was supported by the National Science
Foundation for Young Scientists of China (no. 81201572), the
Natural Science Foundation of Jiangsu Province, China (no.
BK2012113), the Fundamental Research Funds for the Central
Universities (no. JUSRP51319B), the Jiangsu Province 'Six Summit
Talent' Foundation (no. 2013-SWYY-019), and the 111 Project (no.
111-2-06). The authors are grateful to Dr S. Anderson for English
editing of the manuscript.
References
|
1
|
Schnaar RL, Gerardy-Schahn R and
Hildebrandt H: Sialic acids in the brain: gangliosides and
polysialic acid in nervous system development, stability, disease,
and regeneration. Physiol Rev. 94:461–518. 2014. View Article : Google Scholar : PubMed/NCBI
|
|
2
|
Cheray M, Petit D, Forestier L,
Karayan-Tapon L, Maftah A, Jauberteau MO, Battu S, Gallet FP and
Lalloué F: Glycosylation-related gene expression is linked to
differentiation status in glioblastomas undifferentiated cells.
Cancer Lett. 312:24–32. 2011. View Article : Google Scholar : PubMed/NCBI
|
|
3
|
Hildebrandt H, Mühlenhoff M and
Gerardy-Schahn R: Polysialylation of NCAM. Adv Exp Med Biol.
663:95–109. 2010. View Article : Google Scholar
|
|
4
|
Scheidegger EP, Lackie PM, Papay J and
Roth J: In vitro and in vivo growth of clonal sublines of human
small cell lung carcinoma is modulated by polysialic acid of the
neural cell adhesion molecule. Lab Invest. 70:95–106.
1994.PubMed/NCBI
|
|
5
|
Kameda K, Shimada H, Ishikawa T, Takimoto
A, Momiyama N, Hasegawa S, Misuta K, Nakano A, Nagashima Y and
Ichikawa Y: Expression of highly polysialylated neural cell
adhesion molecule in pancreatic cancer neural invasive lesion.
Cancer Lett. 137:201–207. 1999. View Article : Google Scholar : PubMed/NCBI
|
|
6
|
Suzuki M, Suzuki M, Nakayama J, Suzuki A,
Angata K, Chen S, Sakai K, Hagihara K, Yamaguchi Y and Fukuda M:
Polysialic acid facilitates tumor invasion by glioma cells.
Glycobiology. 15:887–894. 2005. View Article : Google Scholar : PubMed/NCBI
|
|
7
|
Korja M, Jokilammi A, Salmi TT, Kalimo H,
Pelliniemi TT, Isola J, Rantala I, Haapasalo H and Finne J: Absence
of polysialylated NCAM is an unfavorable prognostic phenotype for
advanced stage neuroblastoma. BMC Cancer. 9:572009. View Article : Google Scholar : PubMed/NCBI
|
|
8
|
Eckhardt M, Mühlenhoff M, Bethe A, Koopman
J, Frosch M and Gerardy-Schahn R: Molecular characterization of
eukaryotic polysialyltransferase-1. Nature. 373:715–718. 1995.
View Article : Google Scholar : PubMed/NCBI
|
|
9
|
Schreiber SC, Giehl K, Kastilan C, Hasel
C, Mühlenhoff M, Adler G, Wedlich D and Menke A: Polysialylated
NCAM represses E-cadherin-mediated cell-cell adhesion in pancreatic
tumor cells. Gastroenterology. 134:1555–1566. 2008. View Article : Google Scholar : PubMed/NCBI
|
|
10
|
Tanaka F, Otake Y, Nakagawa T, Kawano Y,
Miyahara R, Li M, Yanagihara K, Nakayama J, Fujimoto I, Ikenaka K
and Wada H: Expression of polysialic acid and STX, a human
polysialyltransferase, is correlated with tumor progression in
non-small cell lung cancer. Cancer Res. 60:3072–3080.
2000.PubMed/NCBI
|
|
11
|
Raval GN, Parekh LJ, Patel DD, Jha FP,
Sainger RN and Patel PS: Clinical usefulness of alterations in
sialic acid, sialyl transferase and sialoproteins in breast cancer.
Indian J Clin Biochem. 19:60–71. 2004. View Article : Google Scholar : PubMed/NCBI
|
|
12
|
Kalluri R and Weinberg RA: The basics of
epithelial-mesenchymal transition. J Clin Invest. 119:1420–1428.
2009. View
Article : Google Scholar : PubMed/NCBI
|
|
13
|
Yang J and Weinberg RA:
Epithelial-mesenchymal transition: at the crossroads of development
and tumor metastasis. Dev Cell. 14:818–829. 2008. View Article : Google Scholar : PubMed/NCBI
|
|
14
|
Thiery JP: Epithelial-mesenchymal
transitions in tumour progression. Nat Rev Cancer. 2:442–454. 2002.
View Article : Google Scholar : PubMed/NCBI
|
|
15
|
Varki A: Sialic acids in human health and
disease. Trends Mol Med. 14:351–360. 2008. View Article : Google Scholar : PubMed/NCBI
|
|
16
|
Liu T, Guo Z, Yang Q, Sad S and Jennings
HJ: Biochemical engineering of surface alpha 2-8 polysialic acid
for immunotargeting tumor cells. J Biol Chem. 275:32832–32836.
2000. View Article : Google Scholar : PubMed/NCBI
|
|
17
|
Yang X, Pursell B, Lu S, Chang T-K and
Mercurio AM: Regulation of β4-integrin expression by epigenetic
modifications in the mammary gland and during the
epithelial-to-mesenchymal transition. J Cell Sci. 122:2473–2480.
2009. View Article : Google Scholar : PubMed/NCBI
|
|
18
|
Yang G, Cui T, Wang Y, Sun S, Ma T, Wang
T, Chen Q and Li Z: Selective isolation and analysis of
glycoprotein fractions and their glycomes from hepatocellular
carcinoma sera. Proteomics. 13:1481–1498. 2013. View Article : Google Scholar : PubMed/NCBI
|
|
19
|
Tan Z, Lu W, Li X, Yang G, Guo J, Yu H, Li
Z and Guan F: Altered N-Glycan expression profile in
epithelial-to-mesenchymal transition of NMuMG cells revealed by an
integrated strategy using mass spectrometry and glycogene and
lectin microarray analysis. J Proteome Res. 13:2783–2795. 2014.
View Article : Google Scholar : PubMed/NCBI
|
|
20
|
Varki A and Diaz S: The release and
purification of sialic acids from glycoconjugates: methods to
minimize the loss and migration of O-acetyl groups. Anal Biochem.
137:236–247. 1984. View Article : Google Scholar : PubMed/NCBI
|
|
21
|
Livak KJ and Schmittgen TD: Analysis of
relative gene expression data using real-time quantitative PCR and
the 2(−ΔΔC(T)) method. Methods. 25:402–408. 2001. View Article : Google Scholar
|
|
22
|
Albrecht-Buehler G: The phagokinetic
tracks of 3T3 cells. Cell. 11:395–404. 1977. View Article : Google Scholar : PubMed/NCBI
|
|
23
|
Guan F, Handa K and Hakomori SI: Specific
glycosphingolipids mediate epithelial-to-mesenchymal transition of
human and mouse epithelial cell lines. Proc Natl Acad Sci USA.
106:7461–7466. 2009. View Article : Google Scholar : PubMed/NCBI
|
|
24
|
Grosheva I, Shtutman M, Elbaum M and
Bershadsky AD: p120 catenin affects cell motility via modulation of
activity of Rho-family GTPases: A link between cell-cell contact
formation and regulation of cell locomotion. J Cell Sci.
114:695–707. 2001.PubMed/NCBI
|
|
25
|
Hosokawa N, Wada I, Hasegawa K, Yorihuzi
T, Tremblay LO, Herscovics A and Nagata K: A novel ER
α-mannosidase-like protein accelerates ER-associated degradation.
EMBO Rep. 2:415–422. 2001. View Article : Google Scholar : PubMed/NCBI
|
|
26
|
Watanabe S, Kokuho T, Takahashi H,
Takahashi M, Kubota T and Inumaru S: Sialylation of N-glycans on
the recombinant proteins expressed by a baculovirus-insect cell
system under β-N-acetylglucosaminidase inhibition. J Biol Chem.
277:5090–5093. 2002. View Article : Google Scholar
|
|
27
|
Barranco WT and Eckhert CD: Cellular
changes in boric acid-treated DU-145 prostate cancer cells. Br J
Cancer. 94:884–890. 2006. View Article : Google Scholar : PubMed/NCBI
|
|
28
|
Adorno M, Cordenonsi M, Montagner M,
Dupont S, Wong C, Hann B, Solari A, Bobisse S, Rondina MB, Guzzardo
V, et al: A Mutant-p53/Smad complex opposes p63 to empower
TGFbeta-induced metastasis. Cell. 137:87–98. 2009. View Article : Google Scholar : PubMed/NCBI
|
|
29
|
Kelishadi R, Hashemi Pour M, Famouri F,
Sabet B and Sanei M: The impact of breast-feeding in prevention of
obesity in children. J Qazvin Univ Med Sci. 9:88–93. 2005.
|
|
30
|
Gunasinghe NP, Wells A, Thompson EW and
Hugo HJ: Mesenchymal-epithelial transition (MET) as a mechanism for
metastatic colonisation in breast cancer. Cancer Metastasis Rev.
31:469–478. 2012. View Article : Google Scholar : PubMed/NCBI
|
|
31
|
Christofori G: New signals from the
invasive front. Nature. 441:444–450. 2006. View Article : Google Scholar : PubMed/NCBI
|
|
32
|
Gupta GP and Massagué J: Cancer
metastasis: building a framework. Cell. 127:679–695. 2006.
View Article : Google Scholar : PubMed/NCBI
|
|
33
|
Dall'Olio F and Chiricolo M:
Sialyltransferases in cancer. Glycoconj J. 18:841–850. 2001.
View Article : Google Scholar
|
|
34
|
Gotzmann J, Mikula M, Eger A,
Schulte-Hermann R, Foisner R, Beug H and Mikulits W: Molecular
aspects of epithelial cell plasticity: implications for local tumor
invasion and metastasis. Mutat Res. 566:9–20. 2004. View Article : Google Scholar : PubMed/NCBI
|
|
35
|
Falconer RA, Errington RJ, Shnyder SD,
Smith PJ and Patterson LH: Polysialyltransferase: a new target in
metastatic cancer. Curr Cancer Drug Targets. 12:925–939. 2012.
View Article : Google Scholar : PubMed/NCBI
|
|
36
|
Lin S, Kemmner W, Grigull S and Schlag PM:
Cell surface alpha 2,6 sialylation affects adhesion of breast
carcinoma cells. Exp Cell Res. 276:101–110. 2002. View Article : Google Scholar : PubMed/NCBI
|
|
37
|
Tanaka F, Otake Y, Nakagawa T, Kawano Y,
Miyahara R, Li M, Yanagihara K, Inui K, Oyanagi H, Yamada T, et al:
Prognostic significance of polysialic acid expression in resected
non-small cell lung cancer. Cancer Res. 61:1666–1670.
2001.PubMed/NCBI
|
|
38
|
Angata K, Suzuki M and Fukuda M: ST8Sia II
and ST8Sia IV polysialyltransferases exhibit marked differences in
utilizing various acceptors containing oligosialic acid and short
polysialic acid. The basis for cooperative polysialylation by two
enzymes. J Biol Chem. 277:36808–36817. 2002. View Article : Google Scholar : PubMed/NCBI
|