Introduction
Chronic kidney disease (CKD) is increasingly
recognized as a worldwide public health issue (1,2),
and chronic hypoxia often occurs among patients with CKD. Renal
hypoxia is emerging as a key player by influencing tubular
epithelial cells during the process of the acute kidney injury
(AKI)-to-CKD transition. Under hypoxia, these injured cells fail to
redifferentiate, which results in aggravating hypoxia and gives
rise to a vicious circle (3).
Some studies have shown that human renal proximal
tubular cells (namely HK-2 cells) may be the primary target of a
hypoxic insult (4). Although it
is clear that HK-2 cells demand high concentrations of oxygen to
maintain their metabolic functions (5–7),
the relevant mechanisms have not yet been identified. Hypoxia can
regulate the expression of a wide variety of genes that may be
induced or suppressed by transcriptional or post-transcriptional
mechanisms (8–10). Hypoxia response elements have been
identified in the regulatory regions of a number of genes and
contain consensus binding sites for the transcription factor
hypoxia-inducible factor-1α (HIF-1α) (11–13). Several studies have demonstrated
changes in collagen gene expression in various mesenchymal cells
exposed to hypoxia (14–17).
Renal proximal tubular cells are a primary target
for hypoxic injury in the kidneys and some studies have reported a
distinct cohort of 48 genes with a closely shared hypoxia-dependent
expression profile, identified by microarray analysis (18,19). Since the global transcriptional
mechanisms underlying these events are not yet fully understood, in
this study, we undertook an unbiased approach using RNA sequencing
(RNA-Seq) to define the transcriptomic responses regulated by
hypoxia in HK-2 cells. RNA sequencing technology provides major
advantages over microarray technology, providing more precise
information on absolute transcript levels and transcript variants,
and currently unannotated transcribed regions can be analyzed;
therefore, it is increasingly used in various biological
applications (20). However, to
date, and to the best of our knowledge, no RNA-seq assays
demonstrating transcriptomic changes have been reported in HK-2
cells under hypoxic conditions.
In this study, using RNA-seq analysis, we examined
HK-2 cells under hypoxic and normoxic conditions to clarify global
changes in gene expression under such conditions. The expression
levels of selected genes were further validated by reverse
transcription-quantitative PCR (RT-qPCR). Although the expression
levels of the vast majority of genes remained unaltered, a specific
cluster of genes with a closely shared expression profile were
regulated undr hypoxic conditions. By using stringent
bioinformatics analysis of the data, our findings extend those of
previous and related publications on gene expression patterns that
may be critical for the development of CKD.
Materials and methods
Cell culture and exposure to hypoxia
The HK-2 cell line was purchased from the Cell Bank
of Type Culture Collection of Chinese Academy of Sciences
(Shanghai, China). The HK-2 cells were cultured in high-glucose
DMEM supplemented with 10% fetal bovine serum (FBS), 100 U/ml
penicillin and 100 µg/ml streptomycin (both from Thermo
Fisher Scientific, Waltham, MA, USA) in humidified air containing
5% CO2 at 37°C. After the cells doubled and redoubled,
the viability of the cells was at its maximum, and this phase can
be identified as the logarithmic growth phase. Cells in the
logarithmic growth phase were used in all of the experiments.
The cells were seeded in 6-well plates at a density
of 5×10⁵ cells/well and cultured for 24 h. To mimic
hypoxic conditions, the cells in medium were then incubated under
low oxygen conditions. The oxygen concentrations were maintained at
1–3% using a compact gas oxygen controller, which was held under
positive pressure in an atmosphere of 94–92% N2/5%
CO2/1–3% O2 for 24 h. The control cells were
cultured under normoxic conditions (5% CO2 for 24
h).
Western blot analysis
The cells were plated in 24-well plates and cultured
in DMEM supplemented with 10% FBS for 24 h. Following exposure to
hypoxia for 24 h, the cells were lysed with immunoprecipitation
assay buffer containing protease inhibitors. The cell lysates were
centrifuged at 14,000 × g for 10 min at 4°C followed by incubation
on ice. The protein concentrations of the lysates were examined
using the Bradford protein assay kit (Vazyme Biotech Inc., Nanjing,
China). The cell lysates were boiled and separated by sodium
dodecyl sulfate polyacrylamide gel electrophoresis and transferred
onto polyvinylidene difluoride membranes via semi-dry transfer
(Bio-Rad Laboratories Inc., Hercules, CA, USA). The membranes were
washed in Tris-buffered saline containing 0.1% Tween-20 (TBST),
blocked with 5% non-fat milk in TBST for 1 h at room temperature,
and incubated with a primary rabbit monoclonal antibody against
HIF-1α (Cat. no. ab179483; dilution 1:5,000; Abcam, Cambridge, UK)
or glyceraldehyde-3-phosphate dehydrogenase (GAPDH) antibody (Cat.
no. 10494; dilution 1:5,000; Proteintech Technology, Inc., Wuhan,
China) overnight at 4°C. The membranes were washed 3 times in TBST,
followed by incubation with the appropriate horseradish
peroxidase-linked secondary anti-rabbit antibodies (Cat. no.
SA00001-2; dilution 1:5,000; Proteintech Technology, Inc.) for 1 h
at room temperature. The specific proteins on the blots were
developed by enhanced chemiluminescence (ECL; Vazyme Biotech, Inc.)
and visualized as the bands on the CL-XPosure Film (Thermo Fisher
Scientific). The optical densities of the bands were measured on
the GS710 Densitometer and analyzed using Quantity One image
analysis software (Bio-Rad Laboratories Inc.).
RNA extraction and RNA-Seq analysis
Total RNA was isolated from cells using the TRIzol
reagent (Invitrogen, Carlsbad, CA, USA) according to the
manufacturer's instructions. Total RNA sample quality and integrity
were controlled using a Bioanalyzer 2100 (Agilent, Boeblingen,
Germany). For library preparation, 5 µg total RNA were
captured by Dynabeads Oligo(dT) sheared to fragements of ~200 bp,
and reverse transcribed using the SuperScript III cDNA Synthesis
kit, as previously described (21) (both from Life Technologies, Grand
Island, NY, USA). cDNA was end-repaired, A-tailed and ligated to
Illumina sequencing adapters and amplified by PCR. Library
preparation were performed using the TruSeq RNA LT V2 Sample Prep
kit, as previously described (22) (Illumina, San Diego, CA, USA). The
sequencing library was qualified by Qubit 2.0 (Life Technologies)
and Bioanalyzer 2100 (Agilent), then sequenced on a Illumina HiSeq
2000 with 2×100 bp paired-end sequencing, which were controlled by
HiSeq Control software. Raw reads in FASTQ format were aligned to
the human genome (GRCh37/hg19) using TopHat software 2.0.10, as
previously described (23). This
parameter defines -G genes.gtf -r 0–mate-std-dev 80–solexa1.3-qual.
Transcript isoform assembly and abundance estimation were performed
using Cufflinks (v1.3.0) (24)
and combined with gene annotations from the National Center for
Biotechnology Information (ftp://igenome:G3nom3s4u@ussd-ftp.illumina.com/Homo_sapiens/UCSC/hg19/Homo_sapiens_UCSC_hg19.tar.gz).
The cDNA libraries were sequenced using the HiSeq™ 2000 sequencing
platform (Illumina).
Validation by qPCR
qPCR were executed to validate the data obtained by
RNA-seq analysis. Total RNA was isolated from the HK-2 cells using
the RNeasy Mini kit and an RNase-free DNase set (both from Vazyme
Biotech, Inc.). qPCR was performed to determine the expression of
genes in a SYBR-Green PCR Master mix (Vazyme Biotech, Inc.) using
the StepOnePlus™ real-time PCR detection system (Step One Plus 2.1
software) with universal thermal cycling parameters. The primer
sequences are listed in Table I.
GAPDH was used as an internal control for target genes for reaction
efficiency. The ΔΔCt method was used to determine the relative
amounts of product.
 | Table IPrimers used in qPCR. |
Table I
Primers used in qPCR.
| Gene name | Primer
sequences | Length (bp) |
|---|
| COL4A2 | F:
5′-TGCTACCCGGAGAAAGGAG-3′ | 106 |
| R:
5′-CTTTGCGGCCCTGTAGTCC-3′ | |
| COL7A1 | F:
5′-CCAGAGGTCGTTCCGGAG-3′ | 81 |
| R:
5′-GCTCTTCCCACTTCGACC-3′ | |
| THBS3 | F:
5′-ACAGTTCTCCTGCGACTCCG-3′ | 172 |
| R:
5′-GCATCCTCAAATACGCCTTC-3′ | |
| LAMA5 | F:
5′-ACCCAAGGACCCACCTGTAG-3′ | 169 |
| R:
5′-TCATGTGTGCGTAGCCTCTC-3′ | |
| LAMB1 | F:
5′-TGGCTGAAGTGGAACAGCTCTC-3′ | 95 |
| R:
5′-TGTCTTCAACAGAATGTCTTCAGCA-3′ | |
| ITGB4 | F:
5′-AGAGGGAGGAAGAGGATGGC-3′ | 168 |
| R:
5′-GCAGTAGGCGCAGTCCTTAT-3′ | |
| MUC1 | F:
5′-CGTCATGGACATTGATGGTACC-3′ | 228 |
| R:
5′-GGTACCTCCTCTCACCTCCTCCAA-3′ | |
| VEGF | F:
5′-GAGTACATCTTCAAGCCATCCTG-3′ | 203 |
| R:
5′-TGCTCTATCTTTCTTTGGTCTGC-3′ | |
| GLUT1 | F:
5′-AAGGTGATCGAGGAGTTCTACA-3′ | 119 |
| R:
5′-ATGCCCCCAACAGAAAAGATG-3′ | |
| PLIN2 | F:
5′-TGAGATGGCAGAGAACGGTGTGAA-3′ | 84 |
| R:
5′-TTGCGGCTCTAGCTTCTGGATGAT-3′ | |
| TGF-β1 | F:
5′-GAGCCTGAGGCCGACTACTA-3′ | 130 |
| R:
5′-CGGAGCTCTGATGTGTTGAA-3′ | |
| PDGFB | F:
5′-TGATGCCGAGGAACTATTCATCT-3′ | 178 |
| R:
5′-TTTCTTCTCGTGCAGTGTCAC-3′ | |
| HIG2 | F:
5′-CCACAGTGCAAGACTCCATC-3′ | 150 |
| R:
5′-GCCATACTGCTGAGGAAAGC-3′ | |
| BNIP3L | F:
5′-TCGAGCCGCCGCCGCCCCTG-3′ | 138 |
| R:
5′-CATTGCCATTATCATTGCCATTG-3′ | |
| JUNB | F:
5′-GTCACCGAGGAGCAGGAGG-3′ | 63 |
| R:
5′-TCTTGTGCAGATCGTCCAGG-3′ | |
| MMP-1 | F:
5′-GATGAAGTCCGGTTTTTCAAAG-3′ | 71 |
| R:
5′-GGGGTATCCGTGTAGCACCAT-3′ | |
| GLUT3 | F:
5′-TTCGTCTCTAGCCTGCACTG-3′ | 79 |
| R:
5′-ACACAACTTCTCCGGGTGAC-3′ | |
| GAPDH | F:
5′-GGAAGGTGAAGGTCGGAGTCA-3′ | 90 |
| R:
5′-GCAACAATATCCACTTTACCAGAGTTAA-3′ | |
Gene Ontology (GO) and pathway analysis
for differentially expressed genes (DEGs)
GO functional classifications were analyzed at the
macroscopic level based on cellular component, biological process
and molecular function categories. GO terms with a P<0.01 by
Fisher's exact test were considered enriched. Pathway analysis was
determined by the DEGs according to the KEGG, BioCarta and Reactome
databases. Significant pathways were selected in accordance with
Fisher's exact test followed by Benjamini Hochberg multiple testing
correction, and the threshold of significance was defined as a
value of P<0.05.
Identification of alternative splicing
(AS) events and the discovery of novel mRNA transcripts
Mixture of isoforms (MISO) analysis (25) was used to examine differentially
regulated exons across samples. MISO analysis was accomplished
using paired-end reads according to the workflow given (25). The reads alignment files produced
by TopHat and the pre-build human genome alternative events and
were downloaded from the MISO reference manual page (http://genes.mit.edu/burgelab/miso/docs/#gff-event-annotation);
the date of access for the databases was April 30, 2015.
Identification of single nucleotide
polymorphisms (SNPs)
The identification of SNPs was successively
performed using the mutation detection software GATK, as previously
described (26,27).
Results
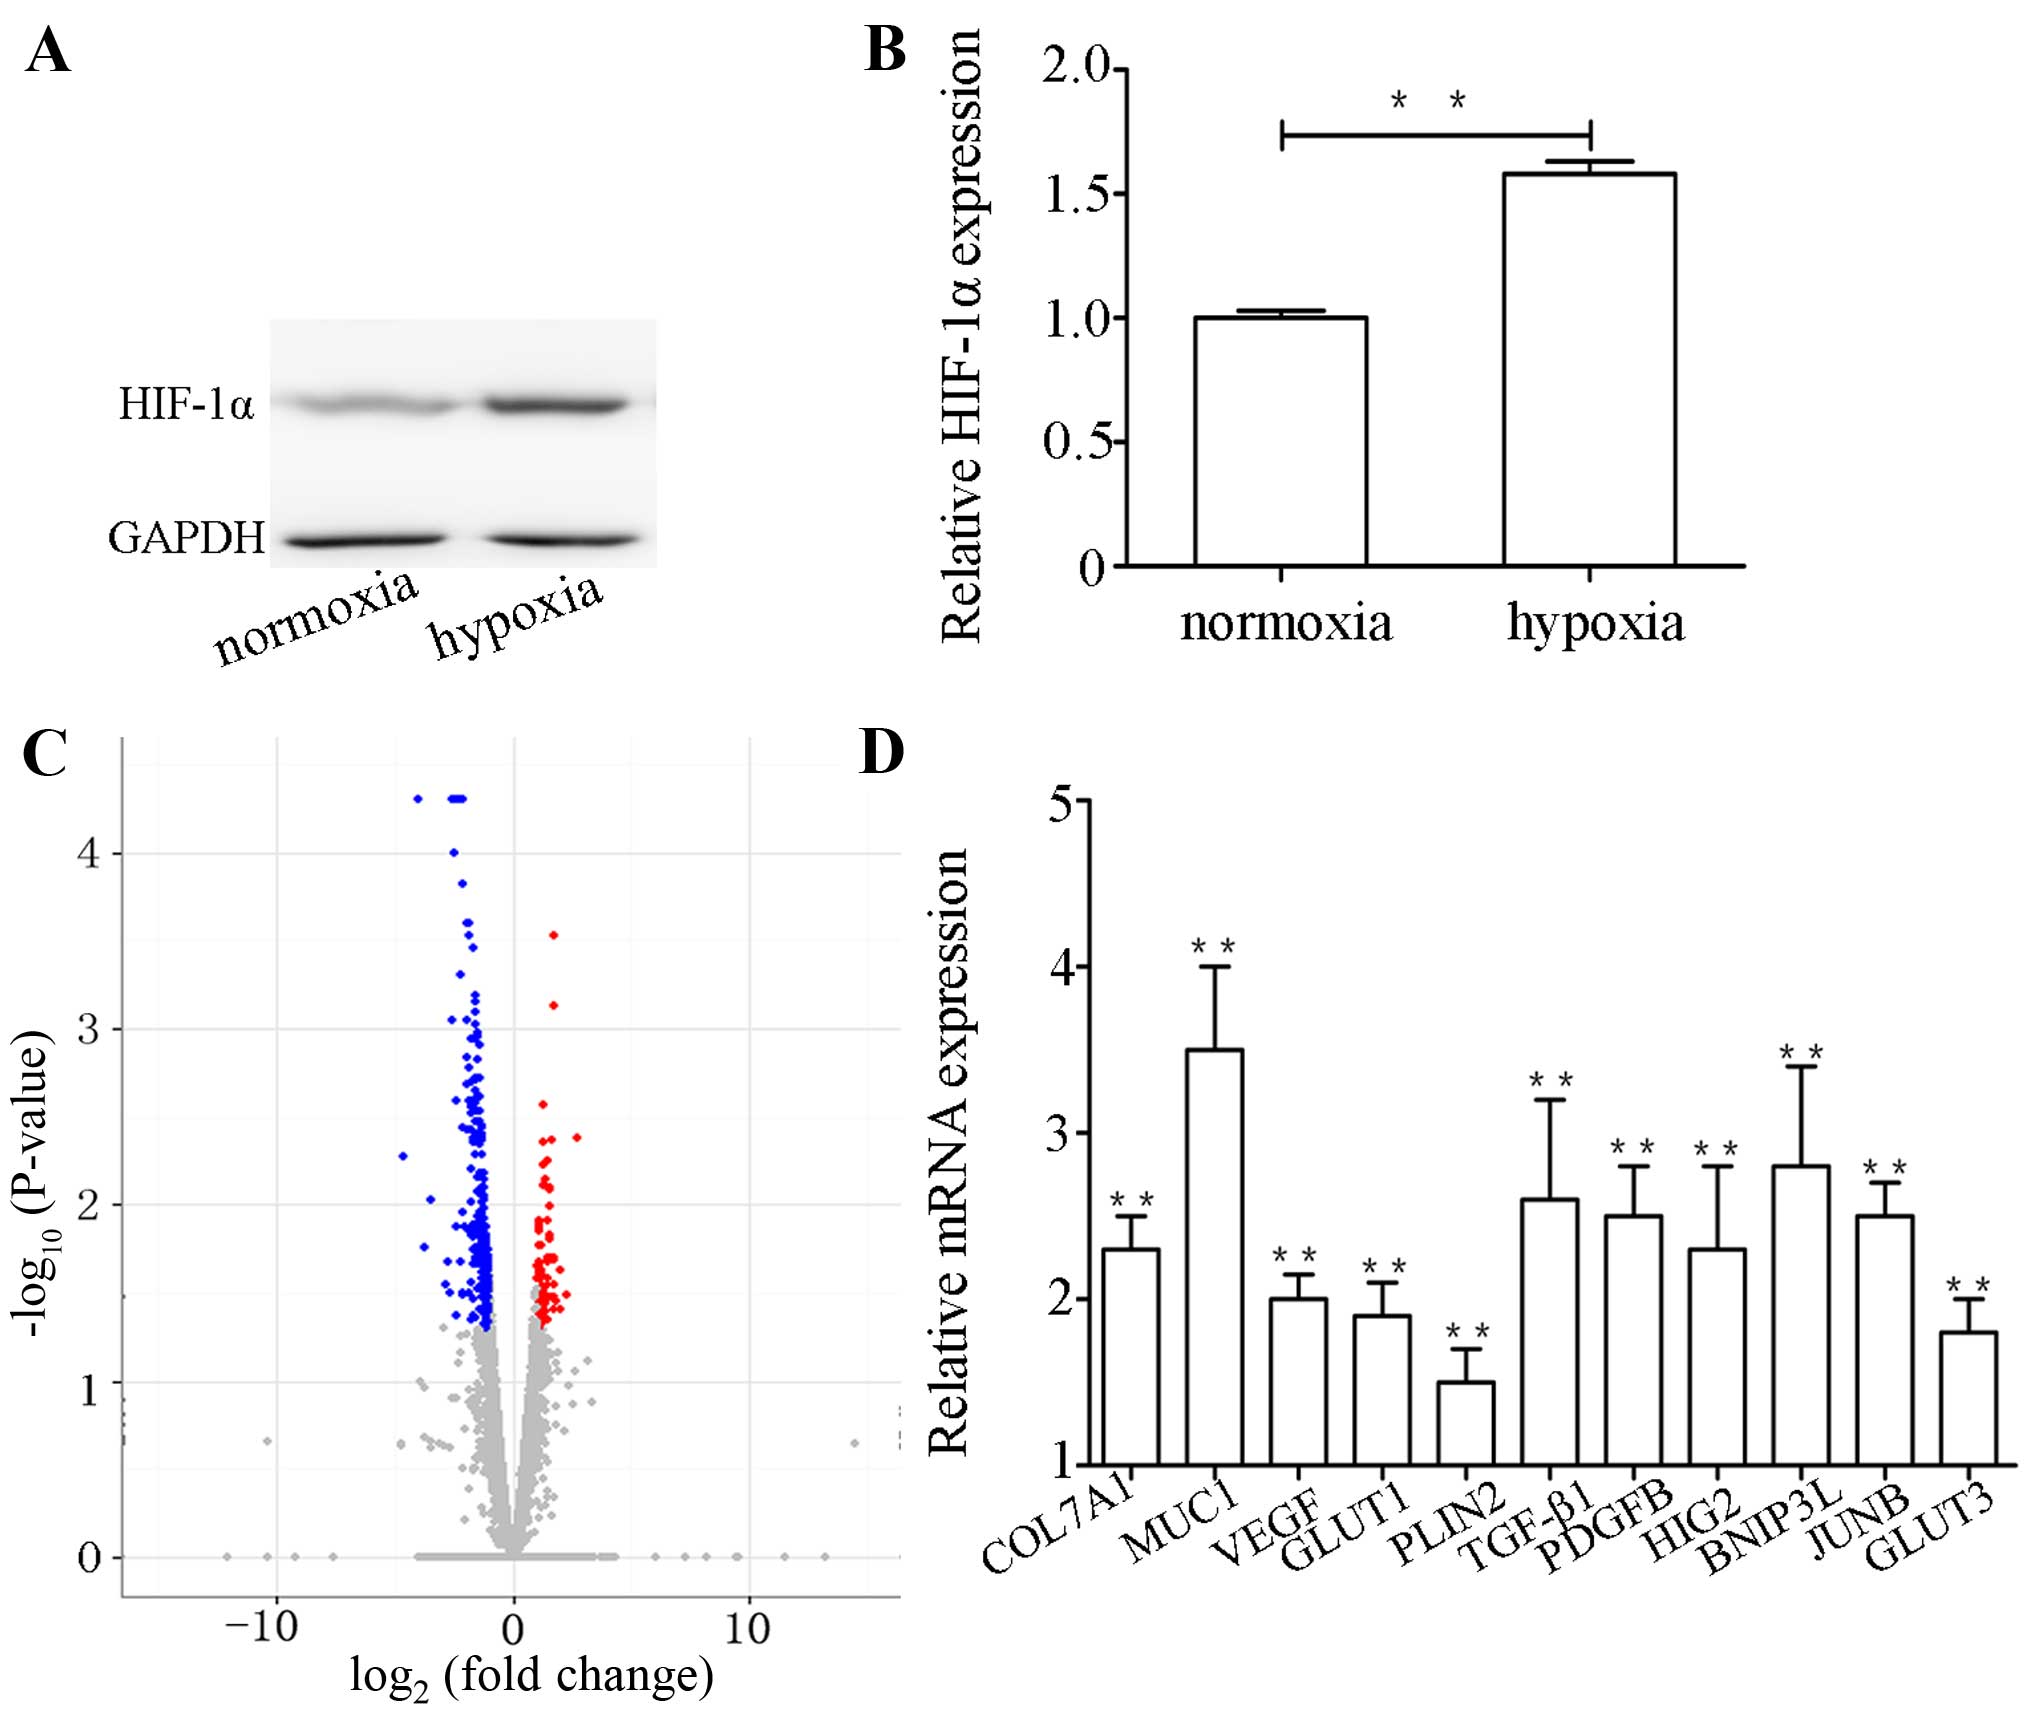
Expression of HIF-1α in HK-2 cells under
hypoxic conditions
The HK-2 cells were exposed to the hypoxic milieu
(1% O2 for 24 h) to examine the effects of oxygen
deprivation on HK-2 cells, and the expression of HIF-1α was
examined by western blot analysis. The results revealed that
hypoxia upregulated the expression level of HIF-1α (Fig. 1A and B).
Illumina sequencing and overview of the
sequence reads
We obtained a global overview of the transcriptome
from the two cDNA libraries separately constructed from HK-2 cells
under hypoxic and normoxic conditions by using the Illumina HiSeq™
2000 sequencing platform. The two libraries were named after the
hypoxic group and normoxic group, respectively. A total of
111,829,528 raw reads was obtained from the cDNA libraries. After
the raw reads were filtered, a total of 93,002,921 high-quality
mappable reads remained, of these, 51,182,720 reads were from cells
under hypoxic conditions and 41,820,201 reads were from cells under
normoxic conditions. The sequencing reads were mapped to the human
genome (GRCh37/hg19); at least 86% of the sequence bases could be
aligned to the genome, and >77% of the mapped read bases were
localized in mRNA regions. In addition, the Q20 (those reads with
an average quality score >20) was >96%, and the GC content
was consistently ~53% for both hypoxic and normoxic conditions,
which suggested that the sequencing was highly accurate.
An overview of the sequencing process is presented
in Table II. Of the total number
of clean reads, 87.06% mapped to multiple (1.69%) or unique
(85.92%) genome locations for hypoxic conditions, and 86.89% mapped
to multiple (1.79%) or unique (85.11%) genome locations for
normoxic conditions. Thus, the read mapping evenness across the
transcripts of two samples was good. Volcano plots in the magnitude
of gene expression ratios are displayed in Fig. 1C and demonstrate the significance
of differences in gene expression between the two samples.
| Table IISummary of clean Illumina RNA-seq
reads and Illumina transcriptome sequencing in HK-2 cells under
hypoxic and normoxic conditions. |
Table II
Summary of clean Illumina RNA-seq
reads and Illumina transcriptome sequencing in HK-2 cells under
hypoxic and normoxic conditions.
| Reads category | Hypoxic HK-2
cells | Normoxic HK-2
cells |
|---|
| Total raw
reads | 61,284,796 | 50,544,732 |
| Total clean
reads | 58,425,234 | 48,128,048 |
| Total mapped
reads | 51,182,720
(87.06%) | 41,820,201
(86.89%) |
| Multiple mapped
reads | 984,919
(1.69%) | 859,998
(1.79%) |
| Uniquely mapped
reads | 50,197,801
(85.92%) | 40,960,203
(85.11%) |
| Q20 (%) | 96.70 (%) | 96.92 (%) |
| GC content (%) | 53.29 (%) | 53.29 (%) |
Evaluation of DEGs
To examine the differences in gene expression
patterns between the hypoxic group and normoxic group, the criteria
for the detection of differential expression gene in this study was
the absolute value of fold change >2 and a higher statistical
significance value (P-value <0.05). A total of 279 genes was
observed to be differentially expressed between the hypoxic group
and normoxic group (data not shown). Of these genes, 201 were
specifically upregulated, and 78 genes were markedly downregulated
in the hypoxic group vs. the normoxic group (data not shown). These
results demonstrated that the number of upregulated DEGs was
considerably higher than the number of downregulated DEGs. Of the
201 upregulated genes, it is notable that a host of genes are
associated with hypoxia, such as encode transforming growth factor
(TGF)-β1, vascular endothelial cell growth factor (VEGF),
6-phosphofructo-2-kinase/fructose-2,6-biphosphatase 4 protein
(PFKFB4) and glucose transporter protein (GLUT1). The
above-mentioned data also demonstrated that the result of RNA-Seq
in this study was reliable.
Validation of gene expression
A total of 17 genes was selected and quantified to
verify the RNA-Seq data by qPCR. As shown in Figs. 1D and 4B, all of the 17 genes were confirmed.
The results illustrated that the expression patterns of these genes
were highly consistent with the RNA-Seq data, which suggested that
our transcriptome analysis was reliable.
GO and KEGG pathway functional enrichment
analysis of the DEGs
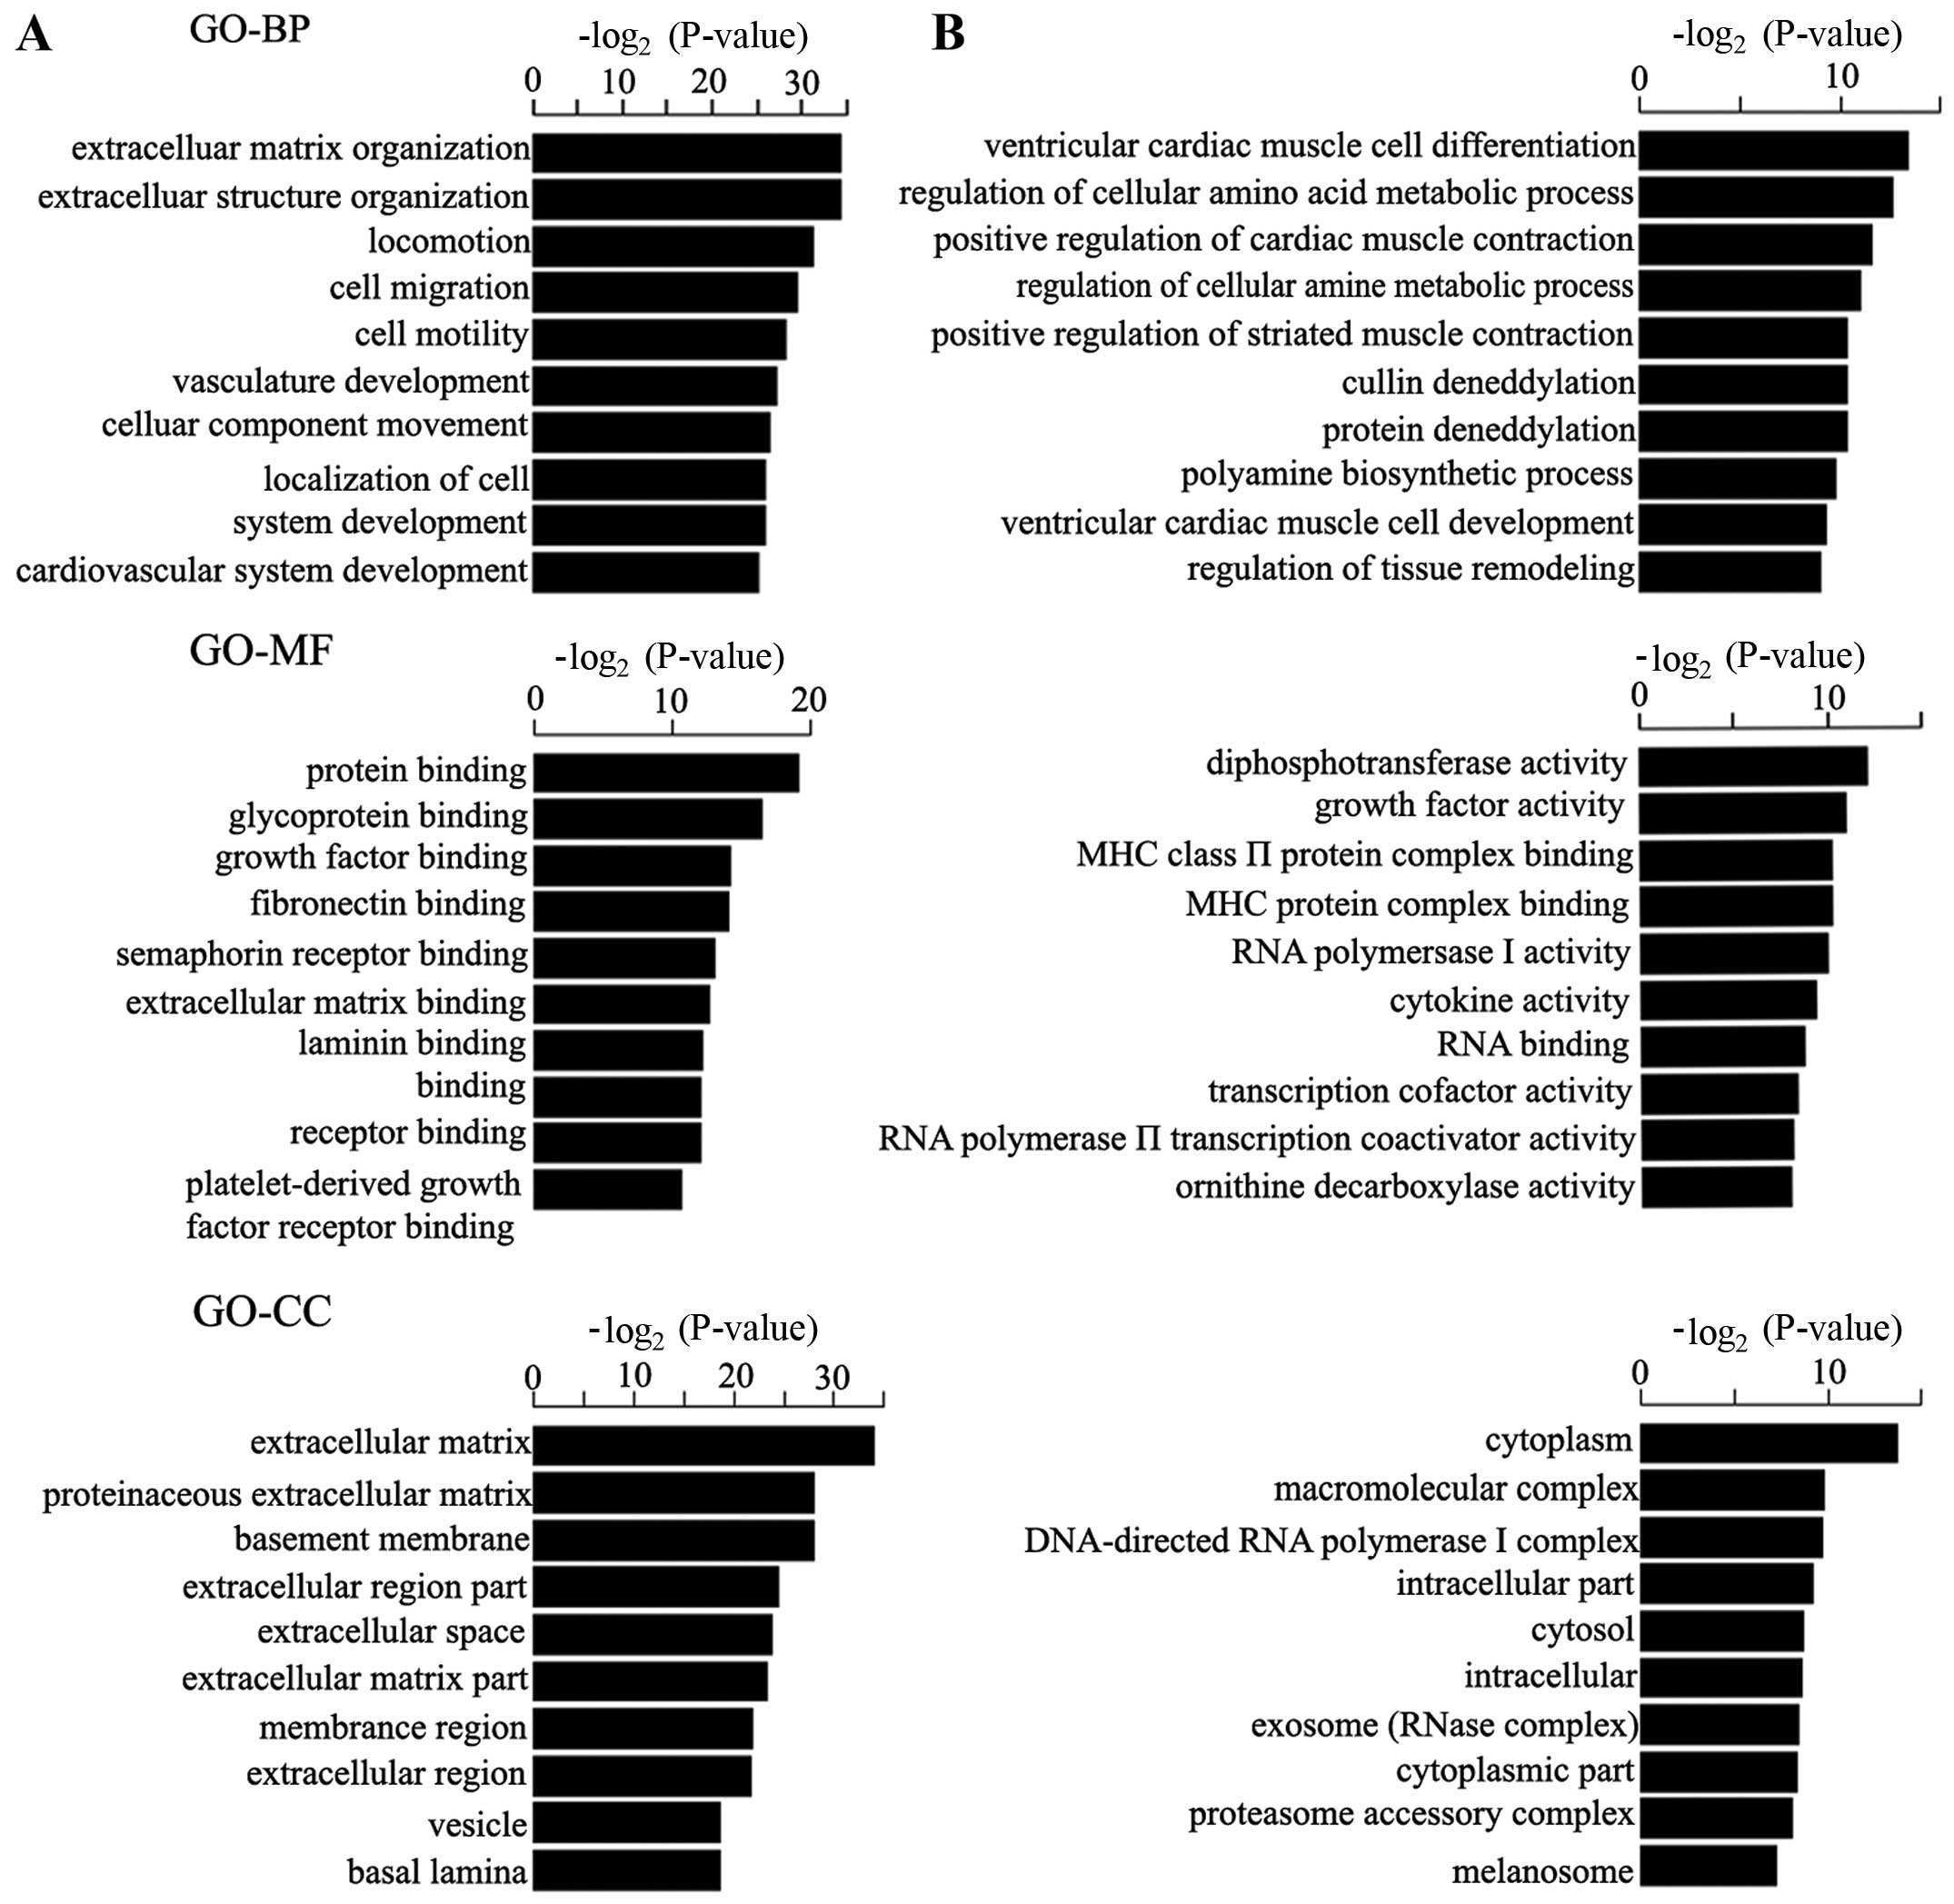
GO enrichment and pathway analysis of the DEGs were
accomplished to determine the potential biological functions of the
DEGs. The enriched GO terms are shown in Fig. 2 according to 3 top-level
ontologies, namely biological process (BP), cellular component (CC)
and molecular function (MF). With respect to biological processes,
the upregulated genes were mainly enriched for extracellular matrix
metabolism, extracellular structure organization and locomotion,
and the downregulated genes were mostly related to ventricular
cardiac muscle cell differentiation, regulation of cellular amino
acid metabolic process and the positive regulation of cardiac
muscle contraction. For molecular function, the upregulated genes
were invovled in protein binding, glycoprotein binding and growth
factor binding, and the downregulated genes were associated with
diphosphotransferase activity, growth factor activity and MHC II
protein complex binding. According to the cellular component
annotation, the upregulated genes were mainly localized in the
extracellular matrix (ECM) including proteinaceous ECM and basement
membrane, while the downregulated genes were enriched in the
cytoplasm, macromolecular complex and DNA-directed RNA polymerase I
complex.
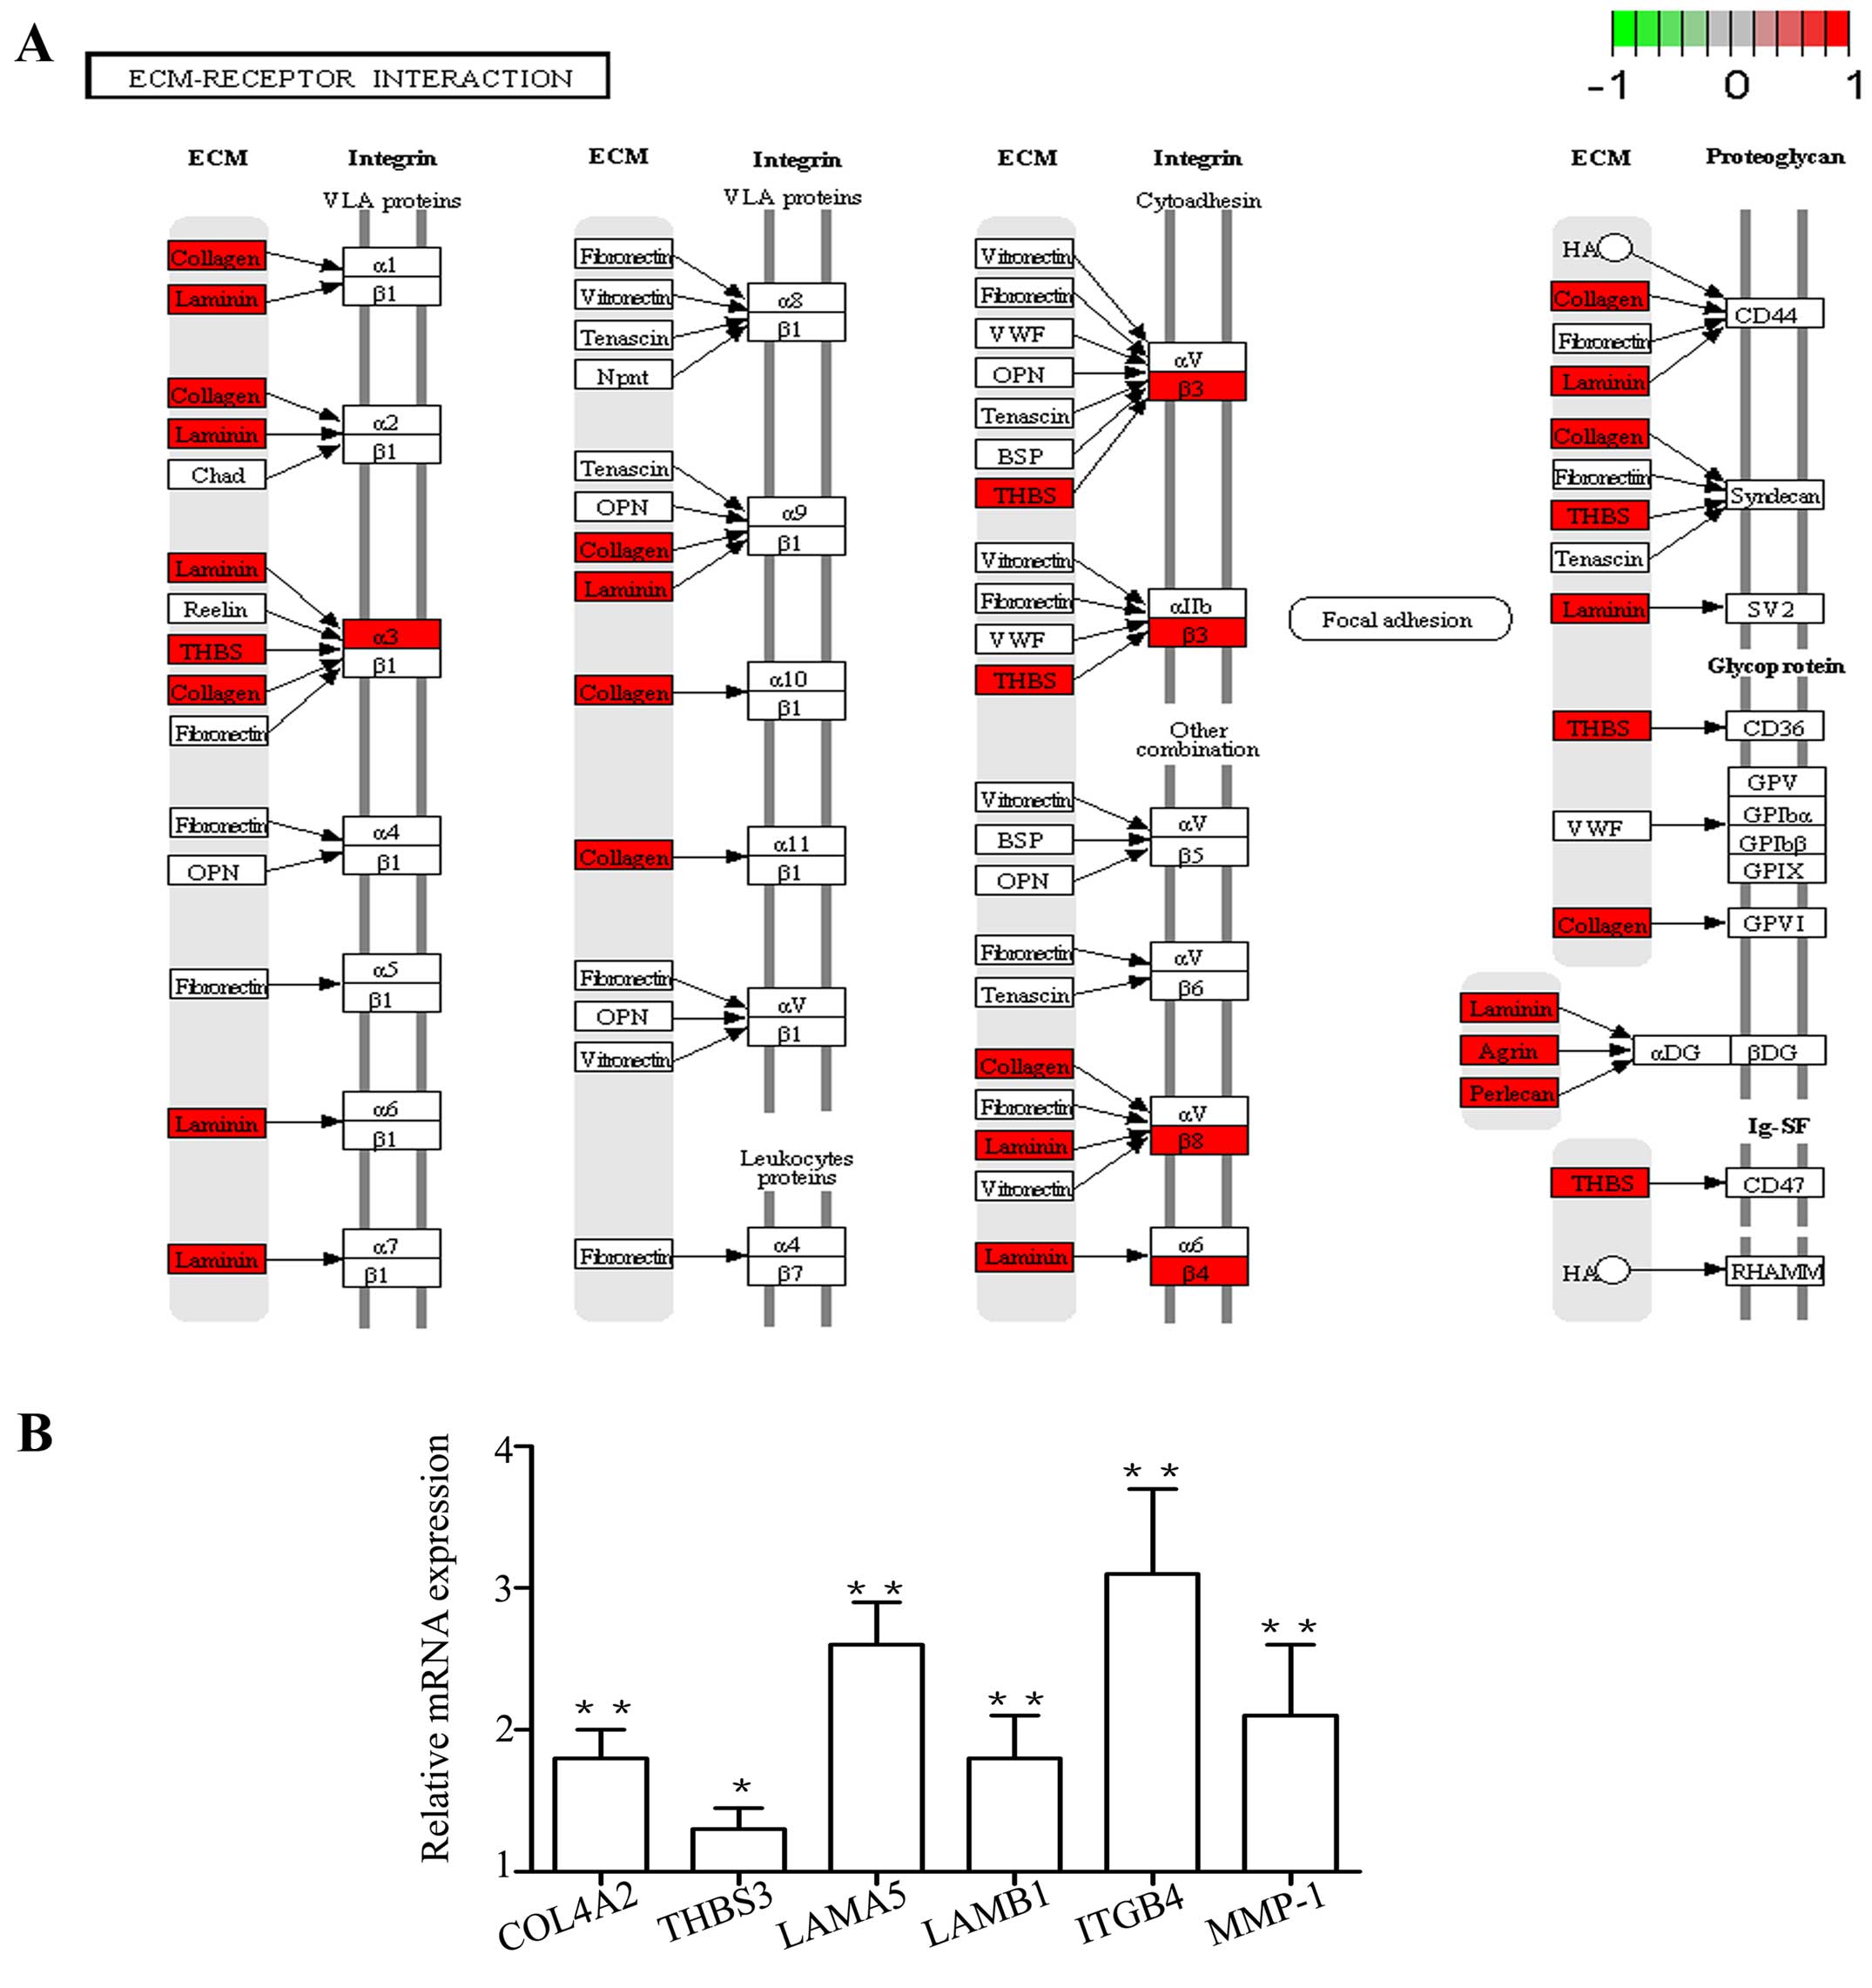
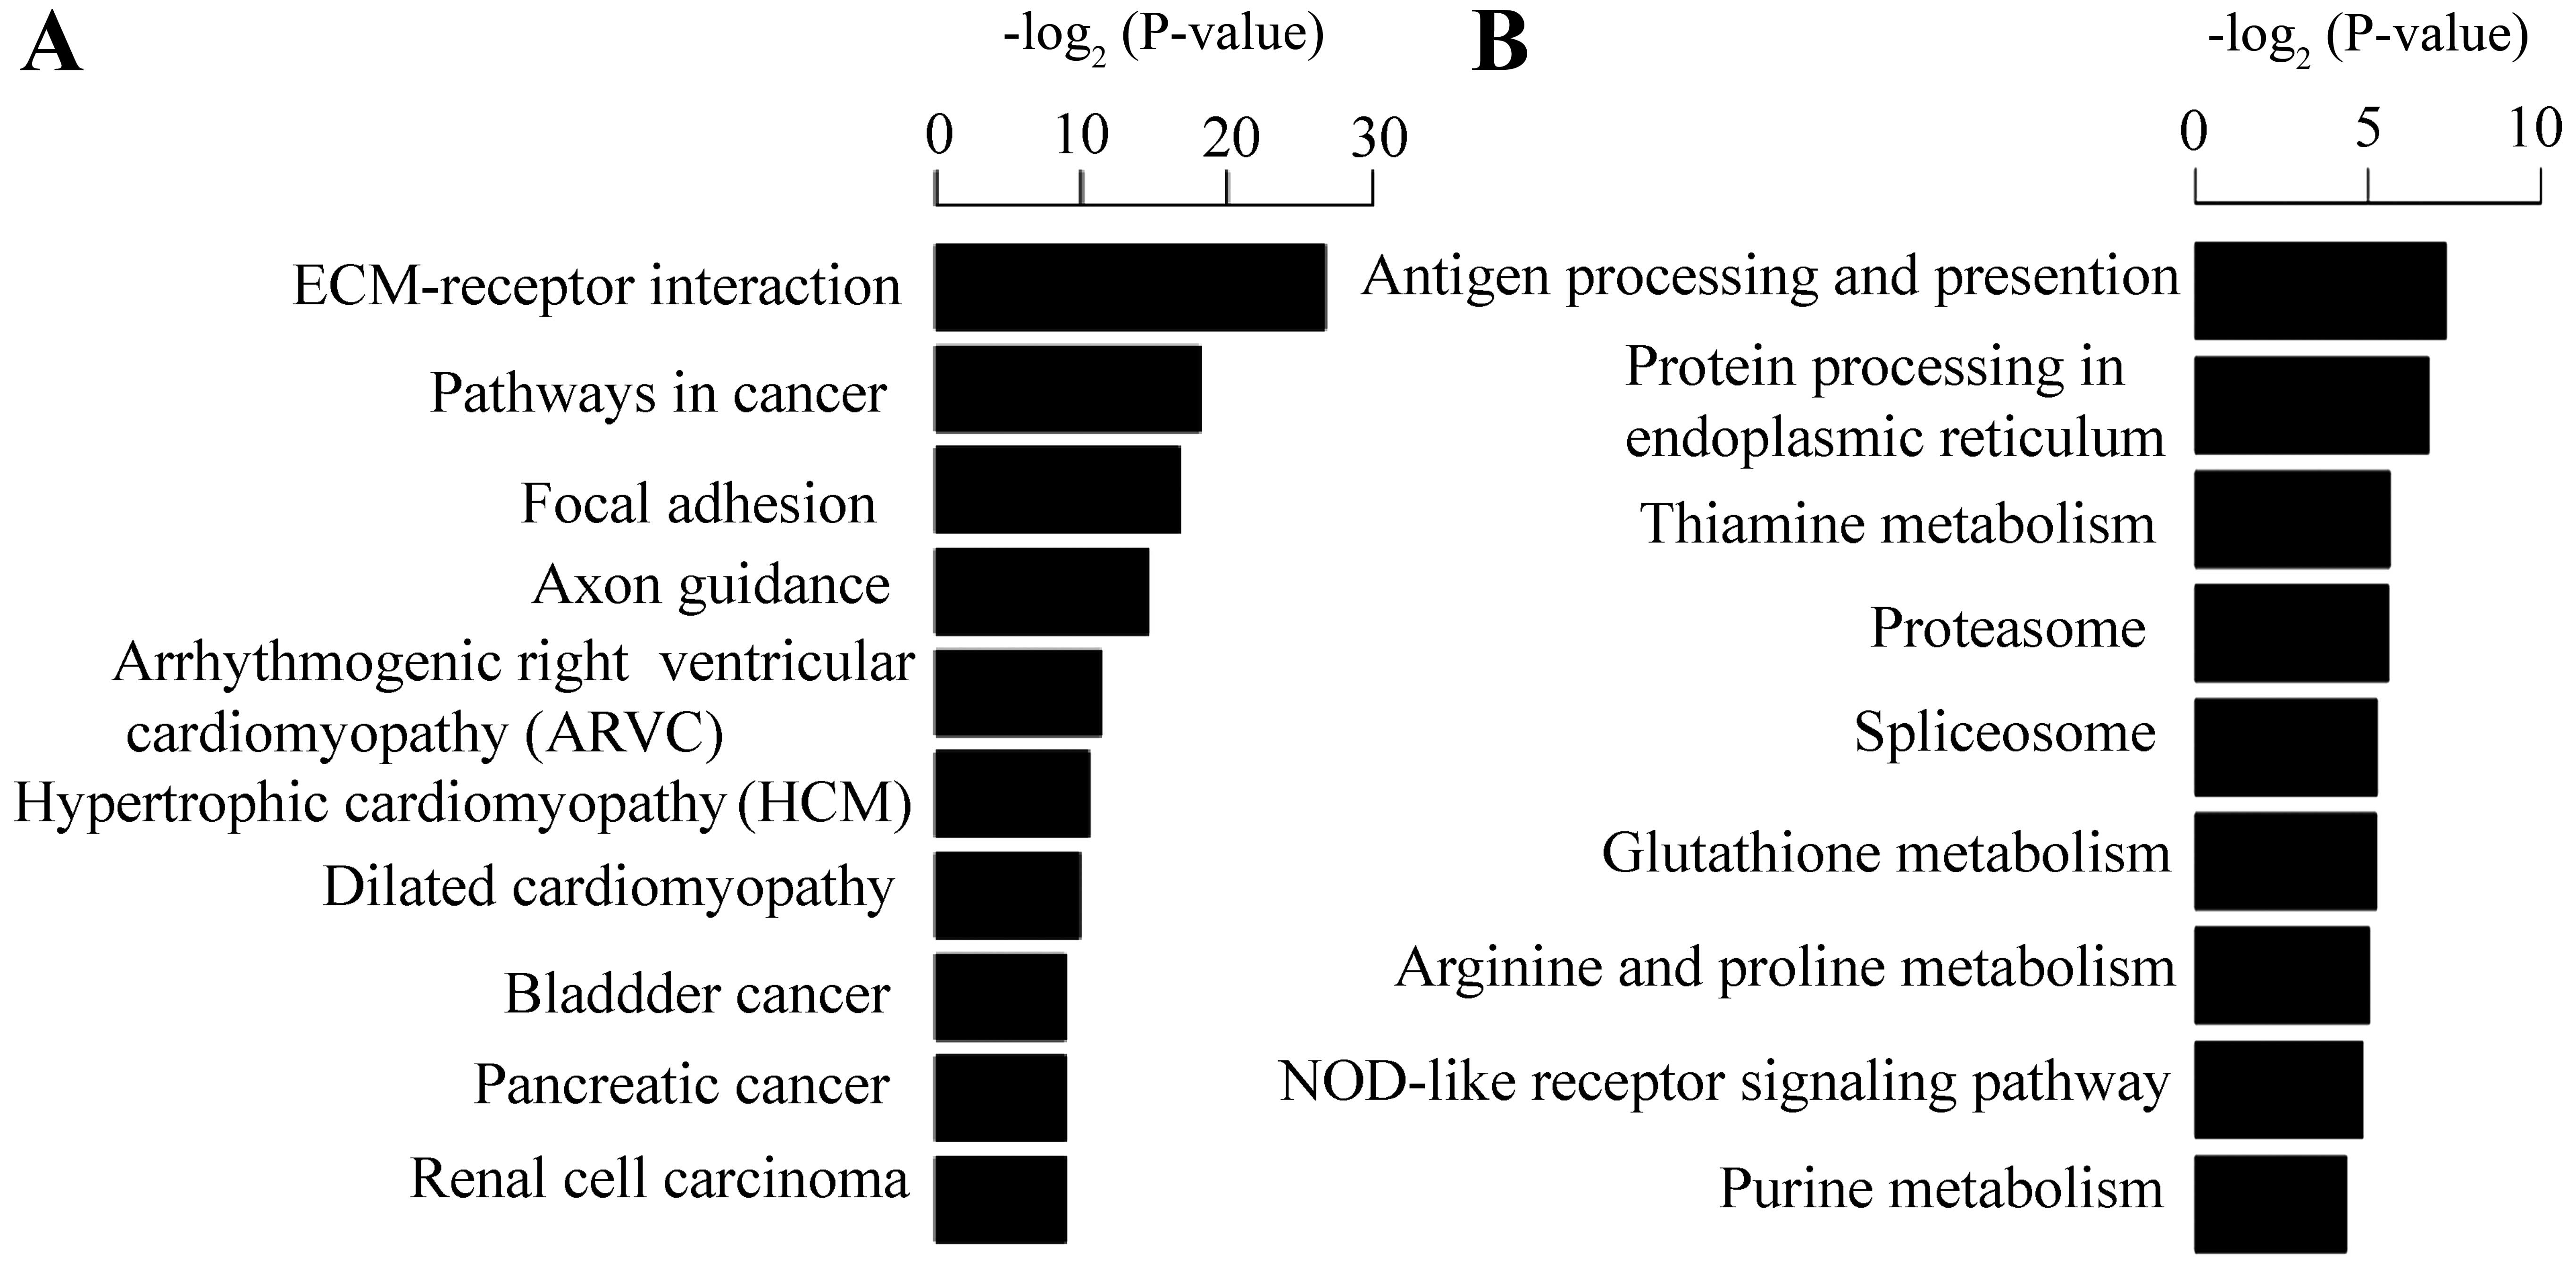
For KEGG pathway enrichment analysis, the up- and
downregulated genes appeared to be significantly enriched in
ECM-receptor interaction (Figs. 3
and 4A) and antigen processing
and presentation, respectively. This result is consistent with that
of the enriched biological process, and pathway-based analyses help
to further understand the biological functions of genes. The 11
DEGs involved in the ECM-receptor interaction pathway included
collagen type IV alpha 2 (COL4A2), heparan sulfate proteoglycan 2
(HSPG2), integrin subunit alpha 3 (ITGA3), integrin subunit beta 3
(ITGB3), integrin subunit beta 4 (ITGB4), integrin subunit beta 8
(ITGB8), laminin subunit alpha 3 (LAMA3), laminin subunit alpha 5
(LAMA5), laminin subunit beta 1 (LAMB1), thrombospondin 3 (THBS3)
and agrin (AGRN); some of these genes were confirmed by qPCR
(Fig. 4B).
Among the upregulated genes, platelet derived growth
factor subunit B (PDGFB), solute carrier family 2 member 1
(SLC2A1), TGFA, TGF-β1 and VEGFA were enriched in the pathway of
renal cell carcinoma (RCC). Furthermore, PDGFB, TGF-β1 and VEGFA
were validated by qPCR. These genes dispalyed differential
expression patterns in the HK-2 cells under hypoxic conditions. Of
the downregulated genes, ornithine decarboxylase 1 (ODC1) and
spermidine synthase (SRM) were enriched in the pathway of
glutathione metabolism. In brief, the DEGs provide a better
understanding of gene expression patterns in HK-2 cells under
hypoxic conditions.
Identification of AS events and the
discovery of novel mRNA transcripts
In this study, we obtained a complete picture of AS
events between the hypoxic group and normoxic group by MISO
(25). All theoretical splicing
junctions were identified, and a total of 51,387 and 49,144 AS
events were found in the hypoxic group and normoxic group,
respectively. In this study, AS events identified contain 5
different types: alternative 5′ splice site (A5SS), alternative 3′
splice site (A3SS), exon skipped (ES), intron retention (IR) and
mutually exclusive exon (MXE) (data not shown). As shown in
Table III, the frequency of
each AS event was highly coincident between the hypoxic group and
normoxic group. Of the 5 types of AS events, ES was the most
prevalent, and was comprised of 27,574 (53.66%) and 26,375
(53.67%). A total of 9,394 novel transcripts coding potential was
found in the two samples (data not shown).
| Table IIINumbers of alternative splicing (AS)
events in 5 classes identified in HK-2 cells under hypoxic and
normoxic conditions |
Table III
Numbers of alternative splicing (AS)
events in 5 classes identified in HK-2 cells under hypoxic and
normoxic conditions
| AS type | HK-2 cells under
hypoxic conditions (%) | HK-2 cells under
normoxic conditions (%) |
|---|
| A5SS | 5,729 (11×.15) | 5,495 (11.18) |
| A3SS | 8,290 (16.13) | 7,898 (16.07) |
| ES | 27,574 (53.66) | 26,375 (53.67) |
| IR | 4,594 (8.94) | 4,401 (8.96) |
| MXE | 5,200 (10.12) | 4,975 (10.12) |
| Total | 51,387 | 49,144 |
Identification of SNPs
SNPs are valuable markers that are widely used in
genetics and evolution, and RNA-Seq technology has the potential to
detect SNPs rapidly and reliably. To understand the changes in SNPs
in HK-2 cells under hypoxic conditions, we identified a total of
69,706 SNPs (data not shown). Among these, 36,747 SNPs were from
the hypoxic group and 32,959 SNPs from the normoxic group. The
types of SNPs included synonymous, missense, stopgain, exonic,
ncRNA, UTR5, UTR5 and UTR3, UTR3, intronic and intergenic (Table IV). The identified SNPs, as
molecular markers, will be extremely helpful for the genetic
linkage mapping of HK-2 cells under hypoxic conditions. In brief,
the transcriptome data will provide a valuable resource for the
future development of molecular markers and functional
genomics.
| Table IVNumber of different types of SNPs
identified by RNA sequencing. |
Table IV
Number of different types of SNPs
identified by RNA sequencing.
| Sample | Hypoxic group | Normoxic group |
|---|
| Total | 36,747 | 32,959 |
| Synonymous | 5,465 | 5,070 |
| Missense | 3,885 | 3,583 |
| Stopgain | 5 | 7 |
| Exonic | 9,488 | 8,788 |
| NcRNA | 2,099 | 1,859 |
| UTR5 | 1,762 | 1,642 |
| UTR5 and UTR3 | 7 | 7 |
| UTR3 | 9,564 | 8,728 |
| Intronic | 8,505 | 7,995 |
| Intergenic | 4,037 | 2,930 |
Discussion
Renal hypoxia is a major factor in the
pathophysiology of AKI to CKD transition (3). To maintain normal metabolism, renal
proximal tubular cells require a large amount of oxygen to function
properly, and renal proximal tubular cells may be the primary
target of a hypoxic insult (7).
Although the hypoxia of HK-2 cells has been widely known in last
decades, the comprehensive study of HK-2 cells under hypoxic
conditions has not yet been reported, at least to the best of our
knowledge. Many hypoxia-related genes have been identified in
different cells, including TGF-β1, VEGF, PFKFB4 and GLUT. The
underlying molecular events however, remain unknown. Leonard et
al found 48 upregulated genes in HK-2 cells exposed to hypoxia
for 8, 16 and 36 h with the aid of cDNA microarrays (19). In this study, the expression of
HIF-1α was increased in the hypoxic HK-2 cells compared to the
nomoxic cells, which confirmed that HK-2 cells were indeed cultured
in a hypoxic environment. Therefore, we then performed a
comprehensive analysis of the transcriptomes of HK-2 cells under
hypoxic and normoxic conditions by RNA-Seq. Compared with a
previous micorray study (19), we
identified a total of 279 DEGs, and 201 DEGs (>2-fold change)
were upregulated in the HK-2 cells exposed to hypoxic conditions
for 24 h. The level and number of DEGs we obtained were not
completely consistent with the previous microarry study (19). The different exposure times to
hypoxia may have resulted in this discrepancy.
All DEGs were classified into GO and KEGG categories
to provide an overview of their biological functions and associated
biochemical pathways. Many studies have shown the expression of
individual hypoxia-related genes in different cells (28–30). In the present study, our analysis
indicated that the upregulated genes were highly enriched in ECM
organization (GO:0030198), protein binding (GO:0005515), extra
ventricular cardiac muscle cell differentiation (GO:0055012),
diphosphotransferase activity (GO:0016778) and the cytoplasm
(GO:0005737). Analysis for pathways revealed that ECM-receptor
interaction was the most enriched upregulated pathway, including
the genes related to the formation of the basement membrane. Of
these genes, the COL4A2 gene encodes one of the 6 subunits of type
IV collagen, the major structural component of basement membranes
(31). Our data based on mRNA
sequencing and qPCR confirmed the upregulated expression of
subunits of type IV collagen gene under hypoxic conditions. LAMA3,
LAMA5, LAMB1 belong to the laminin family for formation and
function of the basement membrane (32). HSPG2 encodes the perlecan protein,
which is a major component of basement membranes (33). Chronic hypoxia often occurs in the
kidney tissues of many patients with CKD (18). Tubulointerstitial fibrosis leads
to thickness of the tubular basement membrane and accumulation of
interstitial ECM (34-37). In this study, hypoxia upregulated
the expression of genes related to the basement membrane. Hypoxia
upregulated the expression of matrix metalloproteinase-1 (MMP-1)
and MMP-1 breaks down the interstitial collagens, types I, II and
III (38). These results aid in
the understanding of the molecular regulatory mechanisms of
tubulointerstitial fibrosis and CKD.
Specifically, we found the upregulated pathway of
RCC and the downregulated pathway of glutathione metabolism in HK-2
cells under hypoxic conditions. A previous study demonstrated that
patients with CKD may have an increased risk of RCC (39), and another study showed that RCC
may be associated with CKD in patients, although the mechanisms
involved are unclear (40). In
this study, our data suggest that hypoxia may be an important
factor in promoting the development of RCC in patients with CKD. A
previous study demonstrated that HIG2 protein was involved in RCC
for molecular targeted therapy (41). In this study, HIG2 mRNA
upregulation induced by hypoxia provides another clue for the
interaction between CKD and RCC. To the best of our knowledge, this
study is the first report that DEGs induced by exposure to hypoxia
upregulated the pathway of RCC in HK-2 cells, as shown by RNA-seq.
Glutathione may directly and indirectly participate in reactive
oxygen (e.g., H2O2) through enzymatic
reactions (42). Glutathione
deficiency contributes to oxidative stress, which plays a key role
in the pathogenesis of many diseases, including cancer,
inflammation, kwashiorkor, seizure, Alzheimer's disease,
Parkinson's disease, sickle cell anemia, liver disease, cystic
fibrosis, attack, stroke and diabetes (43). The present study is the first to
describe that hypoxia downregulated the pathway of glutathione
metabolism in HK-2 cells by RNA-seq. Some studies have shown that
the THBS3 gene, as a stimulator of tumor progression in
osteosarcoma (44–46). This study confirmed that the
expression of THBS3 may be associated with hypoxia in HK-2 cells
under hypoxia by RNA-seq.
This study of the transcriptome analysis enhances
our knowledge of the existing gene annotation and changes in
expression patterns under hypoxic conditions, and supplements AS
events, novel transcripts and SNP identification. AS is an
efficient way for genomes to encode additional transcripts, and
previous studies have shown that AS plays a role in source of
protein diversity (47,48). Novel transcripts and
identification of AS patterns will contribute to a better
understanding of the mechanisms of transcriptional regulation. As
regards SNPs in HK-2 cells under hypoxic and normoxic conditions,
their greatest importance in biomedical research is for comparing
regions of the genome between cohorts in genome-wide association
studies. SNPs without an observable impact on the phenotype
(so-called silent mutations) are still useful as genetic markers in
genome-wide association studies (49).
In conclusion, this study provides a comprehensive
analysis of transcriptome in HK-2 cells under hypoxic and normoxic
conditions. Comparison of the transcriptomes between two groups
revealed a number of DEGs, and potential candidates involved in
CKD, and further functional analysis of these genes may help us to
elucidate the mechanisms responsible for the development of CKD.
This study establishes a solid foundation for future genetic and
functional genomics studies and expression analysis of genes in
CKD.
Acknowledgments
This study was financially supported by the National
Nature Science Foundation of the People's Republic of China (no.
81370868), the Fundamental Research Funds for the Central
Universities and Jiangsu Province Scientific Research Innovation
Project for Graduate Students (no. KYLX_0197).
Abbreviations:
|
CKD
|
chronic kidney disease
|
|
DEGs
|
differentially expressed genes
|
|
ECM
|
extracellular matrix
|
References
|
1
|
Levey AS, Atkins R, Coresh J, Cohen EP,
Collins AJ, Eckardt KU, Nahas ME, Jaber BL, Jadoul M, Levin A, et
al: Chronic kidney disease as a global public health problem:
Approaches and initiatives - a position statement from Kidney
Disease Improving Global Outcomes. Kidney Int. 72:247–259. 2007.
View Article : Google Scholar : PubMed/NCBI
|
|
2
|
Schieppati A and Remuzzi G: Chronic renal
diseases as a public health problem: Epidemiology, social, and
economic implications. Kidney Int Suppl. 98:S7–S10. 2005.
View Article : Google Scholar : PubMed/NCBI
|
|
3
|
Tanaka S, Tanaka T and Nangaku M: Hypoxia
as a key player in the AKI-to-CKD transition. Am J Physiol Renal
Physiol. 307:F1187–F1195. 2014. View Article : Google Scholar : PubMed/NCBI
|
|
4
|
Fine LG, Ong AC and Norman JT: Mechanisms
of tubulo-interstitial injury in progressive renal diseases. Eur J
Clin Invest. 23:259–265. 1993. View Article : Google Scholar : PubMed/NCBI
|
|
5
|
Kuncio GS, Neilson EG and Haverty T:
Mechanisms of tubulointerstitial fibrosis. Kidney Int. 39:550–556.
1991. View Article : Google Scholar : PubMed/NCBI
|
|
6
|
Norman JT, Clark IM and Garcia PL: Hypoxia
promotes fibrogenesis in human renal fibroblasts. Kidney Int.
58:2351–2366. 2000. View Article : Google Scholar : PubMed/NCBI
|
|
7
|
Norman JT, Orphanides C, Garcia P and Fine
LG: Hypoxia-induced changes in extracellular matrix metabolism in
renal cells. Exp Nephrol. 7:463–469. 1999. View Article : Google Scholar : PubMed/NCBI
|
|
8
|
Bunn HF and Poyton RO: Oxygen sensing and
molecular adaptation to hypoxia. Physiol Rev. 76:839–885.
1996.PubMed/NCBI
|
|
9
|
Bauer C and Kurtz A: Oxygen sensing in the
kidney and its relation to erythropoietin production. Annu Rev
Physiol. 51:845–856. 1989. View Article : Google Scholar : PubMed/NCBI
|
|
10
|
Pugh CW: Oxygen and genes in health and
disease. QJM. 90:307–310. 1997. View Article : Google Scholar : PubMed/NCBI
|
|
11
|
Vaux EC, Wood SM, Cockman ME, Nicholls LG,
Yeates KM, Pugh CW, Maxwell PH and Ratcliffe PJ: Selection of
mutant CHO cells with constitutive activation of the HIF system and
inactivation of the von Hippel-Lindau tumor suppressor. J Biol
Chem. 276:44323–44330. 2001. View Article : Google Scholar : PubMed/NCBI
|
|
12
|
Semenza GL: Hypoxia-inducible factor 1 and
the molecular physiology of oxygen homeostasis. J Lab Clin Med.
131:207–214. 1998. View Article : Google Scholar : PubMed/NCBI
|
|
13
|
Wenger RH and Gassmann M: Oxygen(es) and
the hypoxia-inducible factor-1. Biol Chem. 378:609–616.
1997.PubMed/NCBI
|
|
14
|
Falanga V, Zhou L and Yufit T: Low oxygen
tension stimulates collagen synthesis and COL1A1 transcription
through the action of TGF-beta1. J Cell Physiol. 191:42–50. 2002.
View Article : Google Scholar : PubMed/NCBI
|
|
15
|
Durmowicz AG, Parks WC, Hyde DM, Mecham RP
and Stenmark KR: Persistence, re-expression, and induction of
pulmonary arterial fibronectin, tropoelastin, and type I
procollagen mRNA expression in neonatal hypoxic pulmonary
hypertension. Am J Pathol. 145:1411–1420. 1994.PubMed/NCBI
|
|
16
|
Orphanides C, Fine LG and Norman JT:
Hypoxia stimulates proximal tubular cell matrix production via a
TGF-beta1-independent mechanism. Kidney Int. 52:637–647. 1997.
View Article : Google Scholar : PubMed/NCBI
|
|
17
|
Tamamori M, Ito H, Hiroe M, Marumo F and
Hata RI: Stimulation of collagen synthesis in rat cardiac
fibroblasts by exposure to hypoxic culture conditions and
suppression of the effect by natriuretic peptides. Cell Biol Int.
21:175–180. 1997. View Article : Google Scholar : PubMed/NCBI
|
|
18
|
Fine LG and Norman JT: Chronic hypoxia as
a mechanism of progression of chronic kidney diseases: From
hypothesis to novel therapeutics. Kidney Int. 74:867–872. 2008.
View Article : Google Scholar : PubMed/NCBI
|
|
19
|
Leonard MO, Cottell DC, Godson C, Brady HR
and Taylor CT: The role of HIF-1 alpha in transcriptional
regulation of the proximal tubular epithelial cell response to
hypoxia. J Biol Chem. 278:40296–40304. 2003. View Article : Google Scholar : PubMed/NCBI
|
|
20
|
Ulbrich SE: Groebner AE and Bauersachs S:
Transcriptional profiling to address molecular determinants of
endometrial receptivity - lessons from studies inlivestock species.
Methods. 59:108–115. 2013. View Article : Google Scholar
|
|
21
|
Lahr DJ, Grant JR and Katz LA: Multigene
phylogenetic reconstruction of the Tubulinea (Amoebozoa)
corroborates four of the six major lineages, while additionally
revealing that shell composition does not predict phylogeny in the
Arcellinida. Protist. 164:323–339. 2013. View Article : Google Scholar : PubMed/NCBI
|
|
22
|
Carrara M, Lum J, Cordero F, Beccuti M,
Poidinger M, Donatelli S, Calogero RA and Zolezzi F: Alternative
splicing detection workflow needs a careful combination of sample
prep and bioinformatics analysis. BMC Bioinformatics. 16(Suppl 9):
S22015. View Article : Google Scholar : PubMed/NCBI
|
|
23
|
Trapnell C, Pachter L and Salzberg SL:
TopHat: Discovering splice junctions with RNA-Seq. Bioinformatics.
25:1105–1111. 2009. View Article : Google Scholar : PubMed/NCBI
|
|
24
|
Trapnell C, Williams BA, Pertea G,
Mortazavi A, Kwan G, van Baren MJ, Salzberg SL, Wold BJ and Pachter
L: Transcript assembly and quantification by RNA-Seq reveals
unannotated transcripts and isoform switching during cell
differentiation. Nat Biotechnol. 28:511–515. 2010. View Article : Google Scholar : PubMed/NCBI
|
|
25
|
Katz Y, Wang ET, Airoldi EM and Burge CB:
Analysis and design of RNA sequencing experiments for identifying
isoform regulation. Nat Methods. 7:1009–1015. 2010. View Article : Google Scholar : PubMed/NCBI
|
|
26
|
McKenna A, Hanna M, Banks E, Sivachenko A,
Cibulskis K, Kernytsky A, Garimella K, Altshuler D, Gabriel S, Daly
M and DePristo MA: The Genome Analysis Toolkit: A MapReduce
framework for analyzing next-generation DNA sequencing data. Genome
Res. 20:1297–1303. 2010. View Article : Google Scholar : PubMed/NCBI
|
|
27
|
DePristo MA, Banks E, Poplin R, Garimella
KV, Maguire JR, Hartl C, Philippakis AA, del Angel G, Rivas MA,
Hanna M, et al: A framework for variation discovery and genotyping
using next-generation DNA sequencing data. Nat Genet. 43:491–498.
2011. View
Article : Google Scholar : PubMed/NCBI
|
|
28
|
Zscharnack K, Kessler R and Bleichert F:
Warnke JP and Eschrich K: The PFKFB3 splice variant UBI2K4 is
downregulated in high-grade astrocytomas and impedes the growth of
U87glioblastoma cells. Neuropathol Appl Neurobiol. 35:566–578.
2009. View Article : Google Scholar : PubMed/NCBI
|
|
29
|
Starska K, Forma E, Jóźwiak P, Bryś M,
Lewy-Trenda I, Brzezińska-Błaszczyk E and Krześlak A: Gene and
protein expression of glucose transporter 1 and glucose transporter
3 in human laryngeal cancer-the relationship with regulatory
hypoxia-inducible factor-1α expression, tumor invasiveness, and
patient prognosis. Tumour Biol. 36:2309–2321. 2015. View Article : Google Scholar
|
|
30
|
Hu JW, Sun P, Zhang DX, Xiong WJ and Mi J:
Hexokinase 2 regulates G1/S checkpoint through CDK2 in
cancer-associated fibroblasts. Cell Signal. 26:2210–2216. 2014.
View Article : Google Scholar : PubMed/NCBI
|
|
31
|
Kalluri R and Sukhatme VP: Fibrosis and
angiogenesis. Curr Opin Nephrol Hypertens. 9:413–418. 2000.
View Article : Google Scholar : PubMed/NCBI
|
|
32
|
Lee SM, Chung M, Hwang KJ, Ju YR, Hyeon
JW, Park JS, Kim CK, Choi S, Lee J and Kim SY: Biological network
inferences for a protection mechanism against familial
Creutzfeldt-Jakob disease with E200K pathogenic mutation. BMC Med
Genomics. 7:522014. View Article : Google Scholar : PubMed/NCBI
|
|
33
|
Warren CR, Grindel BJ and Francis L:
Carson Dd and Farach-Carson MC: Transcriptional activation by NFκB
increases perlecan/HSPG2 expression in the desmoplastic prostate
tumormicroenvironment. J Cell Biochem. 115:1322–1333. 2014.
View Article : Google Scholar : PubMed/NCBI
|
|
34
|
Jacobson HR: Chronic renal failure:
Pathophysiology. Lancet. 338:419–423. 1991. View Article : Google Scholar : PubMed/NCBI
|
|
35
|
Luo X, Deng L, Lamsal LP, Xu W, Xiang C
and Cheng L: AMP-activated protein kinase alleviates extracellular
matrix accumulation in high glucose-induced renal fibroblasts
through mTOR signaling pathway. Cell Physiol Biochem. 35:191–200.
2015. View Article : Google Scholar : PubMed/NCBI
|
|
36
|
Zhou X, Zhang J, Xu C and Wang W: Curcumin
ameliorates renal fibrosis by inhibiting local fibroblast
proliferation and extracellular matrix deposition. J Pharmacol Sci.
126:344–350. 2014. View Article : Google Scholar : PubMed/NCBI
|
|
37
|
Eddy AA: Molecular insights into renal
interstitial fibrosis. J Am Soc Nephrol. 7:2495–2508.
1996.PubMed/NCBI
|
|
38
|
Huang SF, Li YH, Ren YJ, Cao ZG and Long
X: The effect of a single nucleotide polymorphism in the matrix
metalloproteinase-1 (MMP-1) promoter on force-induced MMP-1
expression in human periodontal ligament cells. Eur J Oral Sci.
116:319–323. 2008. View Article : Google Scholar : PubMed/NCBI
|
|
39
|
Hofmann JN and Purdue MP: CKD and risk of
renal cell carcinoma: A causal association? J Am Soc Nephrol.
25:2147–2148. 2014. View Article : Google Scholar : PubMed/NCBI
|
|
40
|
Kim YW, Kim WT, Yun SJ, Lee SC, Kim WJ, Ha
YS, Park YH, Kang SH, Hong SH, Kwon TG, et al: Preoperative chronic
kidney disease status is an independent prognostic factor in
patients with renal cell carcinoma. Ann Surg Oncol. 22:4098–4103.
2015. View Article : Google Scholar : PubMed/NCBI
|
|
41
|
Togashi A, Katagiri T, Ashida S, Fujioka
T, Maruyama O, Wakumoto Y, Sakamoto Y, Fujime M, Kawachi Y, Shuin T
and Nakamura Y: Hypoxia-inducible protein 2 (HIG2), a novel
diagnostic marker for renal cell carcinoma and potential target for
molecular therapy. Cancer Res. 65:4817–4826. 2005. View Article : Google Scholar : PubMed/NCBI
|
|
42
|
Fang YZ, Yang S and Wu G: Free radicals,
antioxidants, and nutrition. Nutrition. 18:872–879. 2002.
View Article : Google Scholar : PubMed/NCBI
|
|
43
|
Wu G, Fang YZ, Yang S, Lupton JR and
Turner ND: Glutathione metabolism and its implications for health.
J Nutr. 134:489–492. 2004.PubMed/NCBI
|
|
44
|
Straume O and Akslen LA: Expresson of
vascular endothelial growth factor, its receptors (FLT-1, KDR) and
TSP-1 related to microvessel density and patient outcome in
vertical growth phase melanomas. Am J Pathol. 159:223–235. 2001.
View Article : Google Scholar : PubMed/NCBI
|
|
45
|
Qian X and Tuszynski GP: Expression of
thrombospondin-1 in cancer: A role in tumor progression. Proc Soc
Exp Biol Med. 212:199–207. 1996. View Article : Google Scholar : PubMed/NCBI
|
|
46
|
Chandrasekaran L, He CZ, Al-Barazi H and
Krutzsch HC: Iruela-Arispe Ml and Roberts DD: Cell
contact-dependent activation of alpha3beta1 integrin modulates
endothelial cell responses tothrombospondin-1. Mol Biol Cell.
11:2885–2900. 2000. View Article : Google Scholar : PubMed/NCBI
|
|
47
|
Brett D, Pospisil H, Valcárcel J, Reich J
and Bork P: Alternative splicing and genome complexity. Nat Genet.
30:29–30. 2002. View
Article : Google Scholar
|
|
48
|
Li HD, Menon R, Omenn GS and Guan Y: The
emerging era of genomic data integration for analyzing splice
isoform function. Trends Genet. 30:340–347. 2014. View Article : Google Scholar : PubMed/NCBI
|
|
49
|
Thomas PE, Klinger R, Furlong LI,
Hofmann-Apitius M and Friedrich CM: Challenges in the association
of human single nucleotide polymorphism mentions with unique
database identifiers. BMC Bioinformatics. 12(Suppl 4): S42011.
View Article : Google Scholar :
|