Introduction
In 2010, 285 million adults (aged 20 to 79 years)
were estimated to have diabetes globally, and this number is
expected to reach 439 million by 2030 (1). Currently, although several types of
medications used to treat type 2 diabetes have been marketed,
pioglitazone and metformin are most commonly used as insulin
sensitizers (2).
In humans, skeletal muscle is the major site of
glucose uptake and glycogen storage, with both processes being
regulated by insulin. Impaired glycogen synthesis is the major
abnormality in type 2 diabetes (3,4).
For example, carbon-13 nuclear magnetic resonance
(13C-NMR) spectroscopy in subjects undergoing
hyperglycemic-hyperinsulinemic clamping revealed that patients with
diabetes have a 50% or greater decrease in glycogen synthesis
relative to healthy individuals (5). In analyses performed at the cellular
level, patients with type 2 diabetes involving insulin resistance
were found to have decreased glycogen synthase (GS) activity in
skeletal muscle (6,7). Insulin sensitivity was found to be
enhanced by exercise or weight loss associated with exercise
(8–10). Exercise activates GS and enhances
insulin sensitivity (11–13). Activation of GS in type 2 diabetes
and correction of glucose metabolism in skeletal muscle have
therefore been regarded as effective approaches to treating
diabetes (14).
In skeletal muscle, GS is one of the key enzymes in
glucose metabolism. Glucose-6-phosphate (G6P) is converted to
UDP-glucose, and GS forms α-1,4-glycosidic linkages, whereas
branching enzymes create α-1,6-glycosidic linkages (15). There are two GS isoforms in
mammals, with 69% homology. One is encoded by the glycogen synthase
2 (GYS2) gene and is expressed only in the liver, whereas the other
is encoded by GYS1 and is expressed in the skeletal muscle, brain,
kidneys, pancreas and adipose tissue (16,17).
Recently, GS activators have been developed by Roche
(18,19). One of the reported compounds was
shown to activate GS in the skeletal muscle and liver in a
concentration-dependent manner. Repeated administration of this
compound in ob/ob mice at a dose of 75 mg/kg
significantly reduced the blood glucose level but did not result in
weight gain. We identified AJS1669, as a novel allosteric activator
of GYS1. AJS1669 activates human GYS1 (hGYS1) in a
concentration-dependent manner. Its activation was found to be
additive with G6P, an allosteric activator. AJS1669 accelerated not
only glycogen accumulation, but also glycogen degradation in
vitro, since the accumulation rate was higher with
co-administration of a glycogen phosphorylase inhibitor. In the
present study, we selected ob/ob mice for evaluating the
effects of this compound on blood glucose level, oral glucose
tolerance and β-oxidation, since AJS1669 has the potential for
normalizing blood glucose levels through glycogen metabolism,
similar to exercise, and ob/ob mice do not have exercise
capacity. We were thus able to exclude the potential effects of
exercise and increased skeletal muscle mass in our experimental
design. Repeated administration of 10 mg/kg of AJS1669 over 4 weeks
effectively reduced blood glucose level and improved glucose
tolerance without excessive body weight gain. Excessive glycogen
accumulation in skeletal muscle was not observed, as reflected by
in vitro testing. Moreover, fat mass was decreased, and we
observed upregulation of genes related to mitochondrial biogenesis
in the skeletal muscle. Our results suggest that AJS1669 has
potential as a new insulin sensitizer, as it reduces fat mass with
upregulation of β-oxidation through acceleration of glycogen
turnover.
Materials and methods
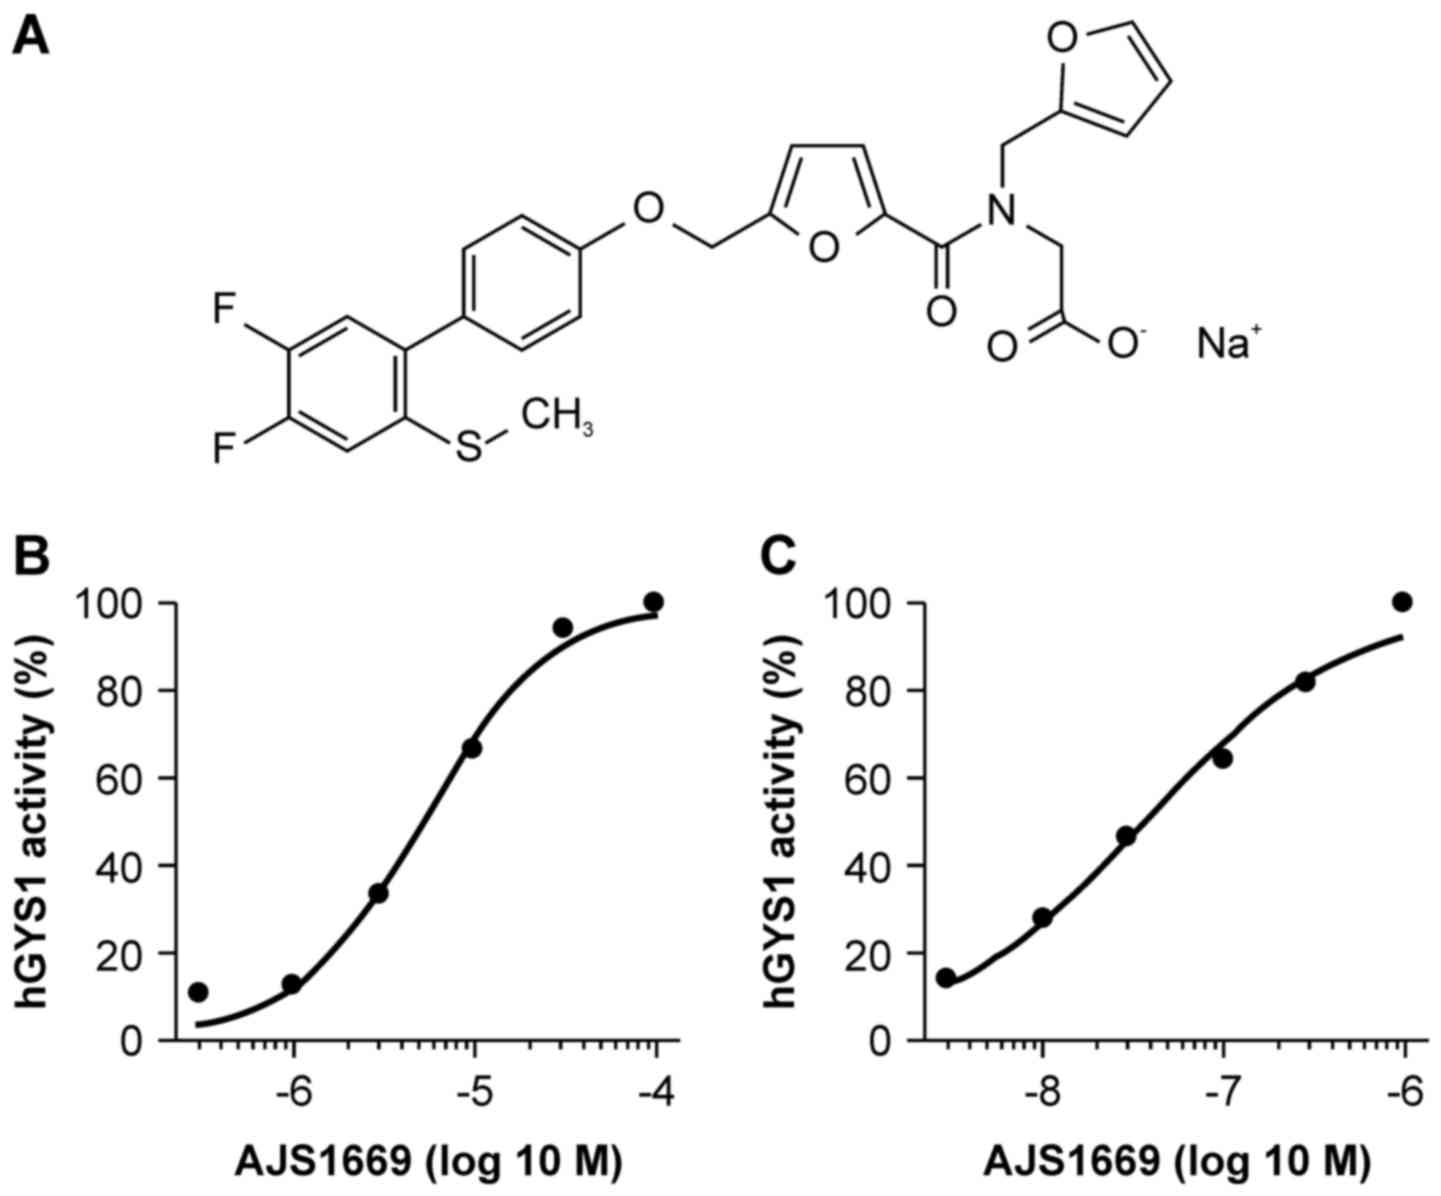
Chemicals and materials
Sodium
2-[[5-[[4-(4,5-difluoro-2-methylsulfanyl-phenyl)phenoxy]methyl]furan-2-carbonyl]-(2-furyl-methyl)amino]
acetate (AJS1669) (Fig. 1A) was
synthesized by Ajinomoto Pharmaceuticals Co., Ltd. (Kanagawa,
Japan). Product purity was over 99%, as determined using a Waters
BEH C18 column, 1.7 μM, 2.1×50 mm (Waters, Milford, MA, USA)
and a Waters Acquity UPLC® (ultra-performance liquid
chromatography) system, with a mobile phase consisting of
acetonitrile:H2O including 0.1% trifluoroacetic acid
each. The acetonitrile fraction was increased in a linear fashion
from 5 to 95% over 2 min and kept at 95% over the next 0.5 min,
after which the column was equilibrated to 5% for 1.5 min.
Pioglitazone was purchased from Tokyo Chemical
Industry Co., Ltd. (Tokyo, Japan). Glycogen phosphorylase inhibitor
(GPI) was purchased from Millipore (Bedford, MA, USA).
Animals
Male C57BL/6J and ob/ob mice (both 6-weeks of
age) were purchased from Charles River Laboratories (Kanagawa,
Japan). The mice were fed standard laboratory chow (CRF-1; Charles
River, Tokyo, Japan) and tap water ad libitum for the
duration of the experiments. All animals were subjected to a
reverse 12-h light/dark cycle. All procedures involving the care
and use of animals were approved by the Institutional Animal Care
and Use Committee of the Pharmaceutical Research Laboratories of
Ajinomoto Pharmaceuticals Co., Ltd. prior to the start of
experimentation.
In vitro hGYS1 assay
293T cells were obtained from American Type Culture
Collection (Manassas, VA, USA). hGYS1 gene cDNA was derived from
the muscle cDNA in human MTC Panel I (Takara Bio, Shiga, Japan).
The pcDNA 3.1(+) expression vector (Life Technologies Japan,
Kanagawa, Japan) containing hGYS1 was transiently transfected into
293T cells. All transfected cells were cultured for 2 days, then
washed with phosphate-buffered saline (PBS) and dissolved in lysis
buffer consisting of 50 mM Tris-HCl (pH 8.0), 10 mM EDTA, 2 mM
EGTA, 100 mM NaF, 1 mM PMSF, 1 mM DTT, and 1X Complete Protease
Inhibitor Cocktail Tablet (Roche Diagnostics K.K., Tokyo, Japan).
The mixture was homogenized and centrifuged at 16,000 × g at 4°C
for 15 min. The precipitated fraction was then reconstituted in
lysis buffer and used as a source of the GS enzyme for evaluation
after enzyme expression levels were verified by immunoblotting.
The GS (hGYS1) assay was performed as described
previously (20). In short, a
solution containing AJS1669 at various concentrations with or
without 10 mM G6P was added to a polystyrene 96-well half-area
plate (12 μl/well). Next, 18 μl of a substrate
solution containing 21.6 mM UDP-glucose, 21.6 mM phosphoenolpyruvic
acid and 4.05 mM NADH was added to each well. An enzyme solution
containing GS lysates (0.17 mg/ml) and 1.5 μl of a pyruvate
kinase/lactate dehydrogenase solution was added (18 μl/well)
to prepare a reaction solution. All reagents in the hGYS assay were
purchased from Sigma-Aldrich Japan (Tokyo, Japan). After the
reaction solution was incubated at 37°C for 25 min, the absorbance
at 340 nm was measured using Benchmark Plus (Bio-Rad Laboratories,
Tokyo, Japan).
Test compound activity was calculated according to
the change in absorbance at 340 nm (ΔA340). The ΔA340 of the
reaction solutions containing AJS1669 at a final concentration of
100 μM (without any G6P present) or 1 μM (with 2.5 mM
G6P) was taken as a normalization value (100%) to calculate the
relative activity (%) at various concentrations. The concentration
of the compound that elicited a 50% increase in relative activity
(EC50) was calculated using XLfit (IDBS, Tokyo,
Japan).
Glucose incorporation into glycogen assay
in human muscle cells
Human muscle cells were used after differentiation
of SkGM-2 cells (Lonza, Basel, Switzerland). The assay evaluating
glucose incorporation into glycogen was performed using previously
published methods (21) with
slight modification. Briefly, after cells were plated onto a
collagen-coated 96-well plate with SkGM-2 containing 10% fetal
bovine serum (FBS) for one day, the cells were subsequently
differentiated using serum-reduced SkGM-2 containing 2% FBS for 3
days. The cells were then starved for 4 h with glucose-free
Dulbecco's modified Eagle's medium (DMEM) (Life Technologies Japan)
containing 0.1% bovine serum albumin (BSA). They were then
incubated for 3 h with DMEM containing 0.1% BSA, 1 g/l glucose, and
0.19 μ/l [14C] glucose (Perkin-Elmer Japan,
Tokyo, Japan). After washing with ice-cold PBS, cell homogenates
were dissolved using 1 N NaOH for 10 min at 60°C and transferred to
96-well MultiScreen HTS plates (Merck Millipore, Billerica, MA,
USA). Multiscreen plates were washed twice with ice-cold 66% (v/v)
ethanol and allowed to dry completely. Incorporation of
[14C] UDP-glucose into glycogen was measured using a
scintillation counter. The decay rate (counts/min, cpm) measured in
the wells containing AJS1669 at the final concentration of 100
μM was taken as 100% in the calculations of relative
activity (%) after subtracting the cpm of the background wells,
which contained dimethyl sulfoxide (DMSO) only.
Assay of GS activity in mouse tissue
lysates
Lysates of muscle and liver tissues obtained from
mice fasted for 16 h were homogenized by Microson XL2000 (Qsonica,
Newtown, CT, USA) in ice-cold buffer containing 50 mM KF (pH 7.0),
10 mM EDTA (pH 7.0), and 10% glycerol. After centrifugation (16,000
× g for 10 min), the supernatant was collected and used as the
enzyme solution. The enzyme was incubated 3 times with each studied
concentration of test compounds for 30 min before the GS assay was
performed. GS assay was performed using previously described
methods (22). Briefly, a 30
μl mixture of enzyme and compounds was added to 60 μl
of an assay mixture containing 0.5 μCi/ml [14C]
UDP-glucose (Perkin-Elmer Japan, Kanagawa, Japan). After incubation
for 20 min at 30°C, 75 μl of aliquots was immediately
spotted onto a filter paper. The filter paper, which completely
absorbed the sample, was placed into a vial, washed twice with 10
ml of 66% (v/v) ethanol, and completely dried. Incorporation of
[14C] UDP-glucose into glycogen was measured using a
scintillation counter. The decay rate was measured as previously
described.
Repeated administration study
Male ob/ob mice (8-weeks of age) were divided
into 4 groups (n=6–8). Group allocation was specifically designed
so that no significant differences in hemoglobin A1c (HbA1c) level,
body weight, and blood glucose level was observed across groups.
Mice were orally administered vehicle alone (0.5% methylcellulose),
with AJS1669 (3 or 10 mg/kg), or with pioglitazone (10 mg/kg) twice
daily (at 9:00 a.m. and 4:00 p.m.) for 4 weeks. Body weight and
food intake were monitored every 2 or 3 days. Blood samples were
taken from unrestrained mice by cutting off the tip of the tail.
Blood glucose levels were measured every 2 weeks using a Lifecheck
sensor (Gunze, Osaka, Japan), and blood HbA1c levels was measured
on day 28 (Tosoh, Tokyo, Japan). Body composition was analyzed on
day 26 using EchoMRI (EchoMRI LLC, Houston, TX, USA). EchoMRI
provides a precise and accurate method for determining the fat and
lean tissue content of mice without requiring anesthesia (23). Change in fat mass and lean mass
were analyzed by comparing the fat mass before administration and
after 4 weeks of treatment. After 4 weeks of treatment, oral
glucose tolerance testing (OGTT) was performed following an
overnight fast. After OGTT was performed, the mice were fed for
another 3 days and then sacrificed. Post-mortem blood and tissue
samples were collected for further analysis.
Oral glucose tolerance test
After 4 weeks of compound administration, the mice
were fasted overnight. After body weight measurement to determine
required administration volumes, glucose (Otsuka, Tokushima, Japan)
was orally administered at 1 g/kg. Blood was collected from the
tail vein 1 min prior to and 30, 60 and 120 min after the
administration of glucose, and blood glucose levels were determined
using a Lifecheck sensor as described above.
Determination of glycogen content and
pancreatic insulin
Frozen tissue samples were weighed and hydrolyzed in
30% (wt/vol) KOH solution in a boiling water bath for 30 min, and
were agitated vigorously once at 15 min. After cooling on ice, 25
μl of 6% Na2SO4 and 750 μl of
100% ethanol were added. After overnight storage at −80°C, samples
were centrifuged at 10,000 × g for 15 min. The glycogen pellet was
dried and dissolved in 200 μl of water in a water bath at
55°C, following which 800 μl of water was added for a total
volume of 1 ml. Aliquots (25 μl) of resulting glycogen
solution were used for subsequent measurements. Glycogen content
was determined using a glycogen assay kit (BioVision, Milpitas, CA,
USA) according to the manufacturer's instructions. Pancreatic
tissue was weighed, homogenized, and extracted with 2 ml of 1.5%
HCl-75% ethanol buffer overnight with shaking in the cold room. For
measurements, samples were centrifuged at 3,000 × g for 10 min. The
insulin level in the supernatant was measured using an insulin kit
(Morinaga Institute of Biological Science, Tokyo, Japan) after a
1:3,000 dilution.
RNA extraction, real-time PCR, and
measurement of mitochondrial DNA content
Total RNA was extracted using an RNeasy Plus Mini
kit (Qiagen, Tokyo, Japan) according to the manufacturer's
instructions. The concentration and purity of total RNA samples
were measured using a NanoDrop ND-1000 spectrophotometer (Thermo
Scientific, Kanagawa, Japan). cDNA generated via a high capacity
cDNA synthesis kit (Life Technologies Japan) was analyzed by
quantitative PCR using Power SYBR Premix (Life Technologies Japan).
Primer sequences are provided in Table I. Expression data were normalized
to the geometric mean of β-actin levels to control for variability
in expression, and were analyzed using the 2−ΔΔCT
method. Mitochondrial DNA content was quantified using primers for
both NADH dehydrogenase subunit 1 (ND1, an index of mitochondrial
DNA) and lipoprotein lipase (LPL, index of genomic DNA). ND1 levels
were normalized to LPL DNA content.
 | Table IList of primers used for real-time
PCR. |
Table I
List of primers used for real-time
PCR.
| Forward 5′→3′ | Reverse 5′→3′ |
|---|
| Gys1 |
TCAGAGCAAAGCACGAATCCAG |
CATAGCGGCCAGCGATAAAGA |
| Ucp3 |
CTGAAGATGGTGGCTCAGGA |
CCGCAGTACCTGGACTTTCATTA |
| Tfam |
CCTTCGATTTTCCACAGAACA |
GCTCACAGCTTCTTTGTATGCTT |
|
Ppargc1α |
GCGCCGTGTGATTTACGTTG |
CGGTAGGTGATGAAACCATAGCTG |
| Cpt1b |
TATCCCAATCATCTGGGTGCTG |
GCGGATGTGGTTCCCAAAG |
| Acadl |
CCAAGAAGAAGTGATTCCTCACCAC |
ACCAATGCCGCCATGTTTCT |
| Acadm |
CAACACTCGAAAGCGGCTCA |
ACTTGCGGGCAGTTGCTTG |
| mt-Nd1 |
CCCATTCGCGTTATCTT |
AAGTTGATCGTAACGGAAGC |
| Lpl |
GGATGGACGGTAAGAGTGATTC |
ATCCAAGGGTAGCAGACAGGT |
| Gys2 |
ACTGCTTGGGCGTTATCTCTGTG |
ATGCCCGCTCCATGCAGTA |
| Acox1 |
CTGTGGCATTGGCATCGTG |
GCAAATCTGATGGCTTTGACTTGA |
| Cd36 |
GATGGCCTTACTTGGGATTGGA |
GGCTTTACCAAAGATGTAGCCAGTG |
| Fabp1 |
AAGTACCAATTGCAGAGCCAGGA |
GGTGAACTCATTGCGGACCA |
| Cpt1a |
TGTTCAGCTCAGACAGTGGTTTCA |
AGGATCCACCAGGATGCCATA |
| Ucp2 |
CAGTACCACAGCGCAGGTCA |
TCACTACGTTCCAGGATCCCAAG |
| Pck1 |
GGTGTCATCCGCAAGCTGAA |
CTGCTCTTGGGTGATGATGACTG |
| G6pase |
GTGCAGCTGAACGTCTGTCTGTC |
TCCGGAGGCTGGCATTGTA |
| β-actin |
CATCCGTAAAGACCTCTATGCCAAC |
ATGGAGCCACCGATCCACA |
Statistical analysis
In this study, data are expressed as the mean ± SE.
Differences among multiple groups (vehicle- vs. AJS1669-treated)
and between two groups (vehicle- vs. pioglitazone-treated) were
evaluated using step-down Dunnett's multiple comparison test and
Student's t-test, respectively, with p<0.05 considered to
represent statistically significant differences. All statistical
analyses were performed using the EXSUS 8 software package (CAC
Exicare Corp., Tokyo, Japan).
Results
AJS1669, a novel GS activator
Since GYS1 is a key enzyme involved in glycogen
metabolism in skeletal muscle, we screened compounds on the basis
of their ability to activate hGYS1 in vitro and identified
AJS1669 as a novel allosteric activator of hGYS1. AJS1669 activated
hGYS1 in a concentration-dependent manner when incubated alone
(EC50=5.2 μM) (Fig.
1B). A lower concentration of AJS1669 was required to elicit an
effect on hGYS1 activity when compared to the
concentration-response relationship without G6P
(EC50=0.037 μM) (Fig. 1C). AJS1669 did not affect hGYS2 in
a concentration-dependent manner (data not shown).
Prior to evaluating its action in vivo, we
assessed whether AJS1669 has the ability to activate each of the
subtypes of peroxisome proliferator-activated receptor (PPAR) using
a reporter assay system. Each PPAR ligand-binding domain was
overexpressed in CV-1 kidney fibroblast cells derived from African
green monkey as a protein fused to the yeast GAL4 DNA-binding
domain, and the luciferase activity was measured. AJS1669 did not
exhibit any ability to activate PPARα, γ and δ subtypes (data not
shown).
GS activation in mouse tissue lysates and
glycogen incorporation in human muscle cells induced by
AJS1669
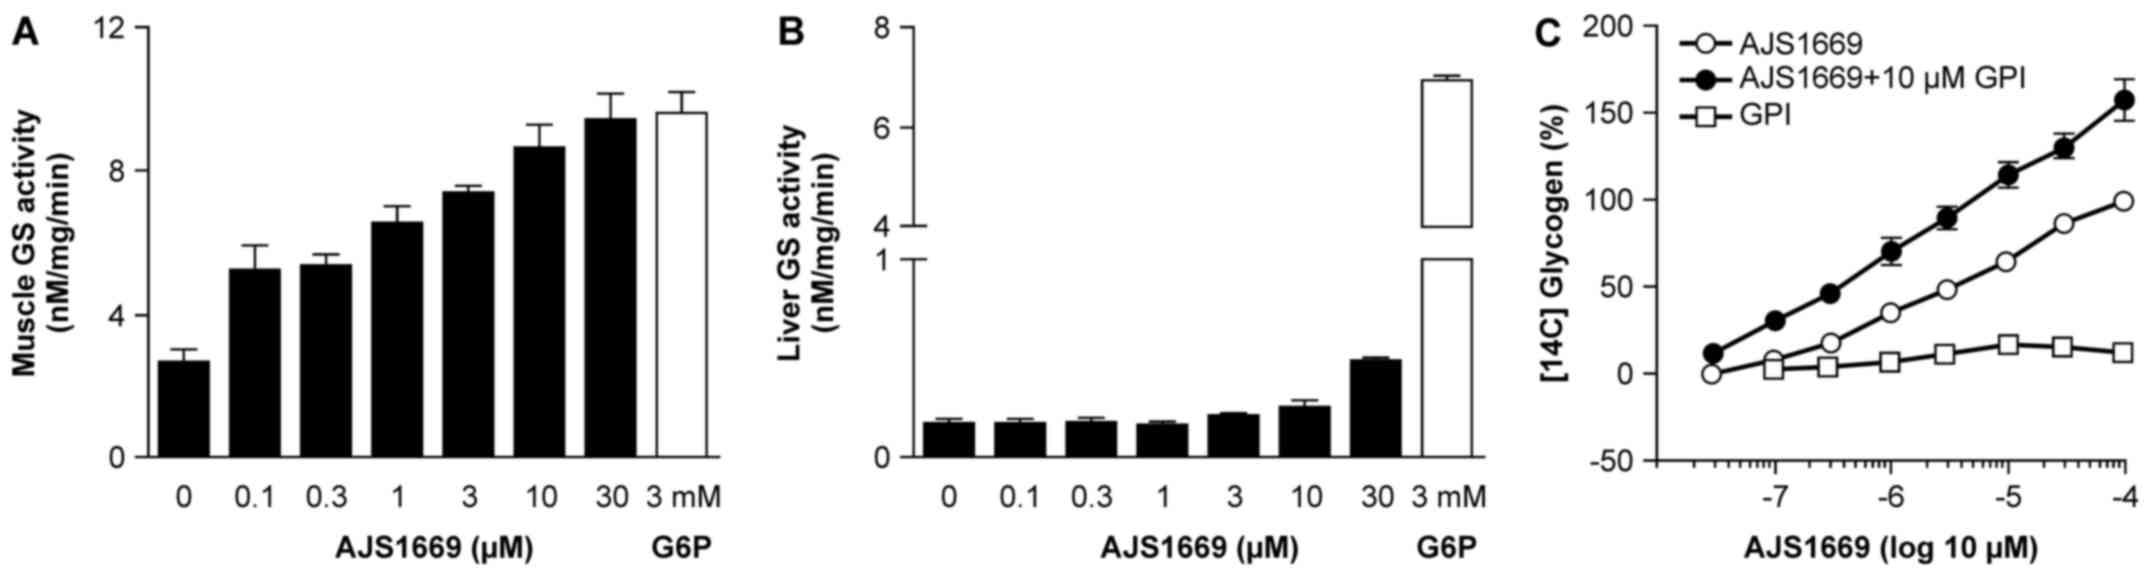
To assess the ability of AJS1669 to activate GS in
each organ, mouse skeletal muscle and liver tissue were homogenized
and [14C] UDP-glucose was used to evaluate GS activity
through measurement of 14C-labeled glycogen.
Intriguingly, AJS1669 exhibited a concentration-dependent
activation of GS in the skeletal muscle lysates (Fig. 2A), which was not observed in the
liver lysates (Fig. 2B).
Next, to confirm the stimulation of glycogen
production by AJS1669 in skeletal muscle tissue, human skeletal
muscle cells were incubated with [14C] glucose and
AJS1669, and the incorporation of [14C] glucose into
cellular glycogen was measured. Incubation with AJS1669 alone
increased the [14C] glycogen level in a
concentration-dependent manner (Fig.
2C). AJS1669 showed increased stimulation of glycogen
production in the presence of glycogen phosphorylase inhibitor
(GPI) than in the absence of GPI, whereas GPI alone did not
increase the [14C] glycogen level (Fig. 2C). These results indicate that the
ability of AJS1669 to increase glycogen level is not a consequence
of glycogenolysis inhibition, but rather reflects an activation of
glycogen synthesis, with AJS1669 upregulating the turnover of
glycogen metabolism in the muscle cells by activating both glycogen
synthesis and glycogenolysis (Fig.
2C).
Effects of chronic 4-week administration
of AJS1669 in normal mice and diabetic ob/ob mice
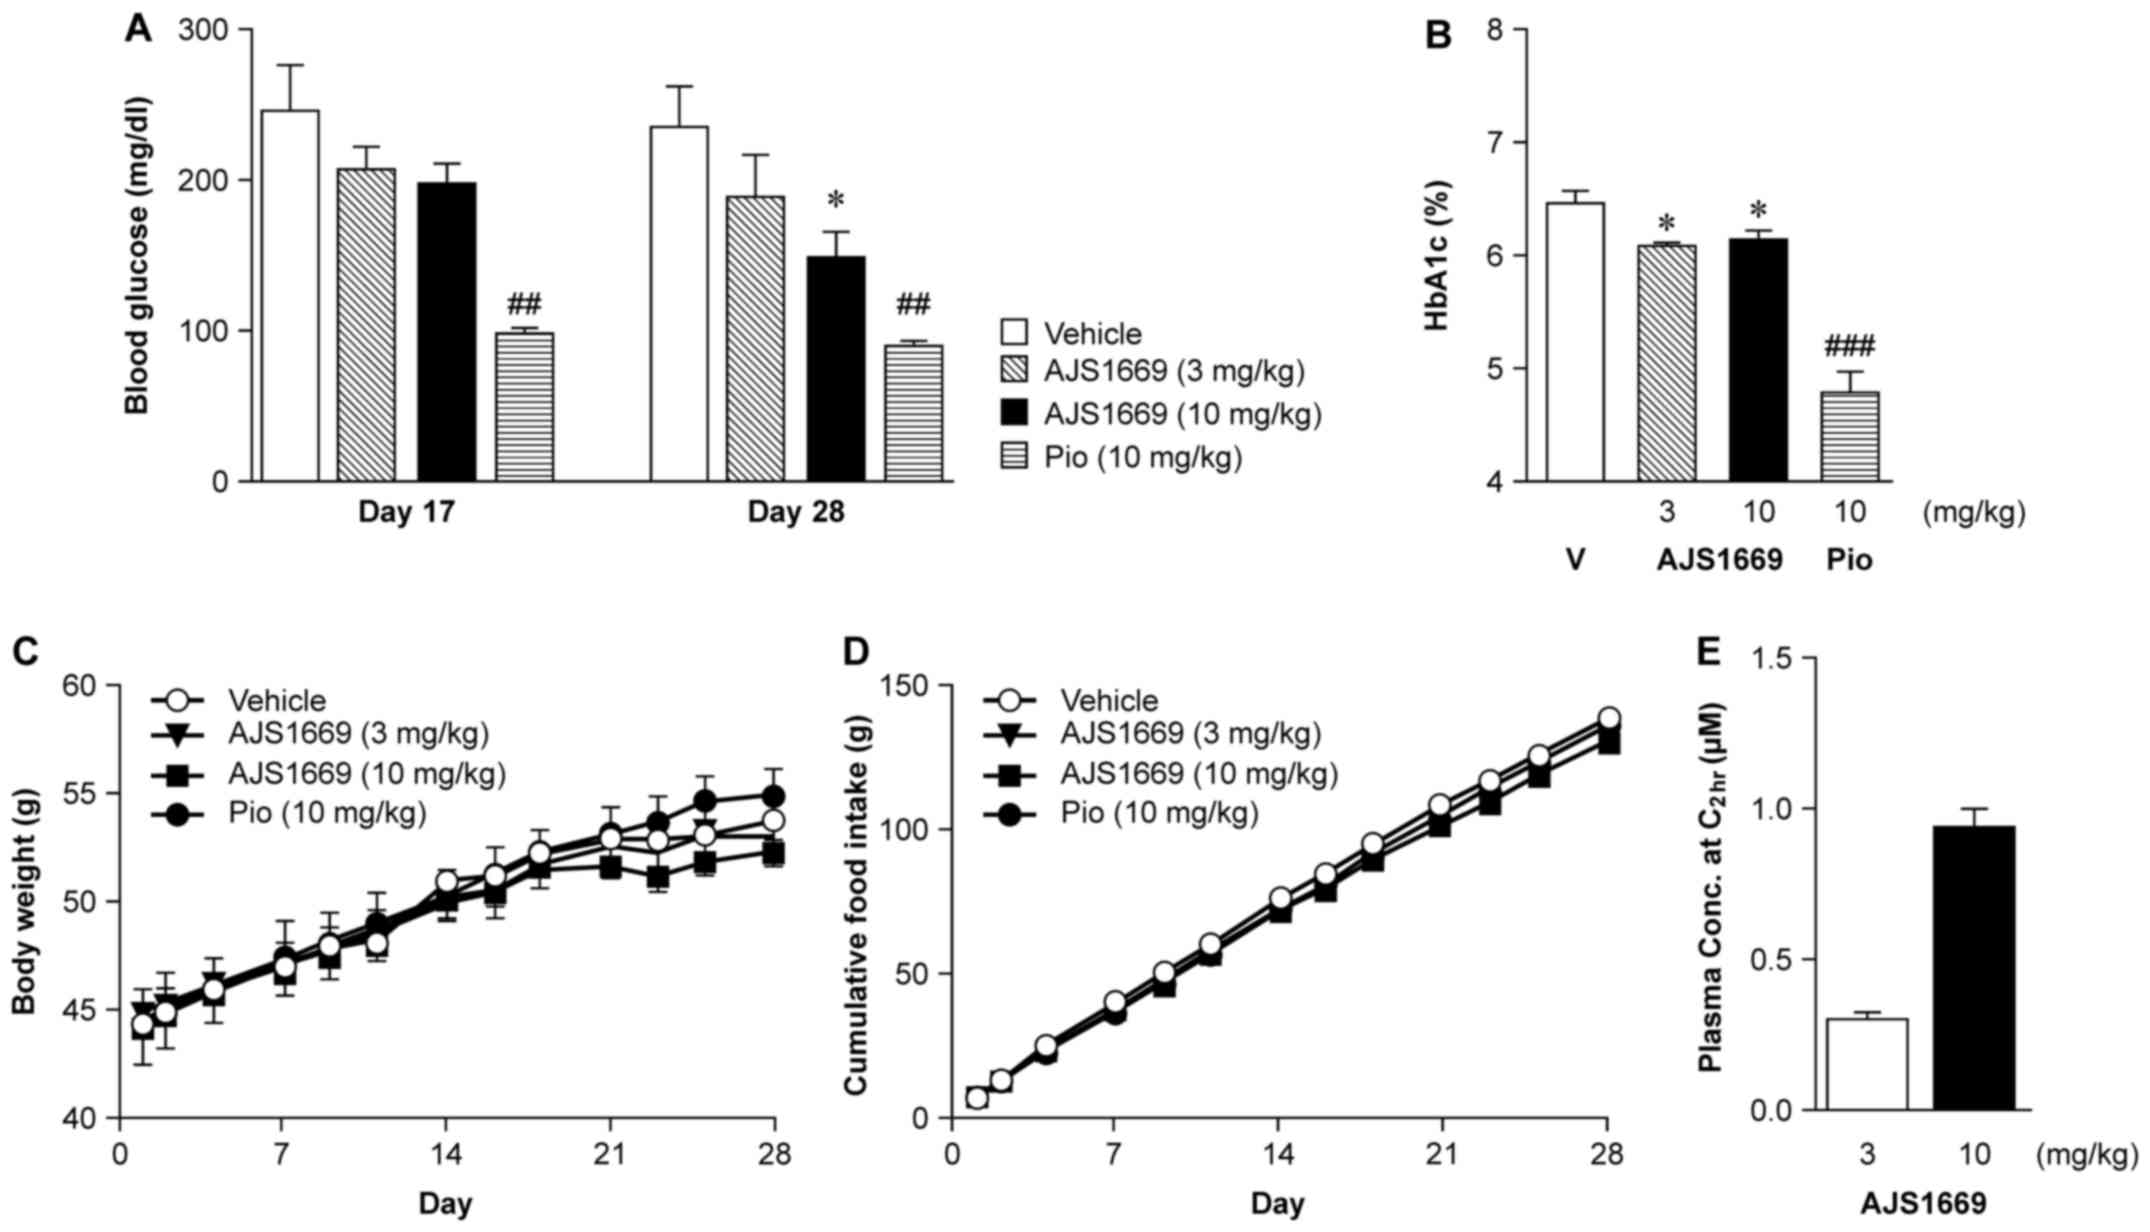
To confirm the ability of AJS1669 to act as a GYS1
activator with long-term administration, ob/ob mice were
administered 3 or 10 mg/kg of AJS1669 orally twice daily. As a
positive control, mice were administered pioglitazone, a PPARγ
agonist known to significantly reduce blood glucose levels and
improve insulin resistance. The group receiving 10 mg/kg AJS1669
exhibited a significant decrease in blood glucose level at day 28
(Fig. 3A). Additionally, a
reduction in glycated hemoglobin (HbA1c) was observed at day 28
(Fig. 3B). Weight gain over the 4
week administration period was slightly lower in AJS1669-treated
animals compared to the vehicle-treated group (Fig. 3C). No major differences in food
consumption amount was observed between the treatment groups
(Fig. 3D). Next, we measured the
plasma level of AJS1669 in samples collected 2 h after the final
administration. Plasma levels were shown to increase linearly in a
concentration-dependent manner, with a concentration of 0.92±0.18
μM following administration of the 10 mg/kg dose (Fig. 3E). The concentration of AJS1669 in
skeletal muscle at the same time was determined to be 0.31
μM (data not shown).
Effect of repeated administration of
AJS1669 on OGTT in ob/ob mice
During the 4th week of AJS1669 administration, mice
were administered 1 g/kg of D-glucose orally following a 16-h fast.
Blood was collected 0, 30, 60 and 120 min later to measure glucose
level. Repeated administration of 3 or 10 mg/kg AJS1669 induced
significant dose-dependent decreases in blood glucose level at 30
min after administration (Fig.
4A). As a result, AJS1669 was shown to significantly improve
glucose tolerance in a dose-dependent manner (Fig. 4B). Fasting blood glucose and
insulin level were measured at the same time, and the calculated
homeostatic model for the assessment of insulin resistance
(HOMA-IR) decreased at higher doses relative to the vehicle-treated
group, although there was no significant difference (Fig. 4C).
Chronic effects of AJS1669 on body
composition and blood parameters in diabetic ob/ob mice
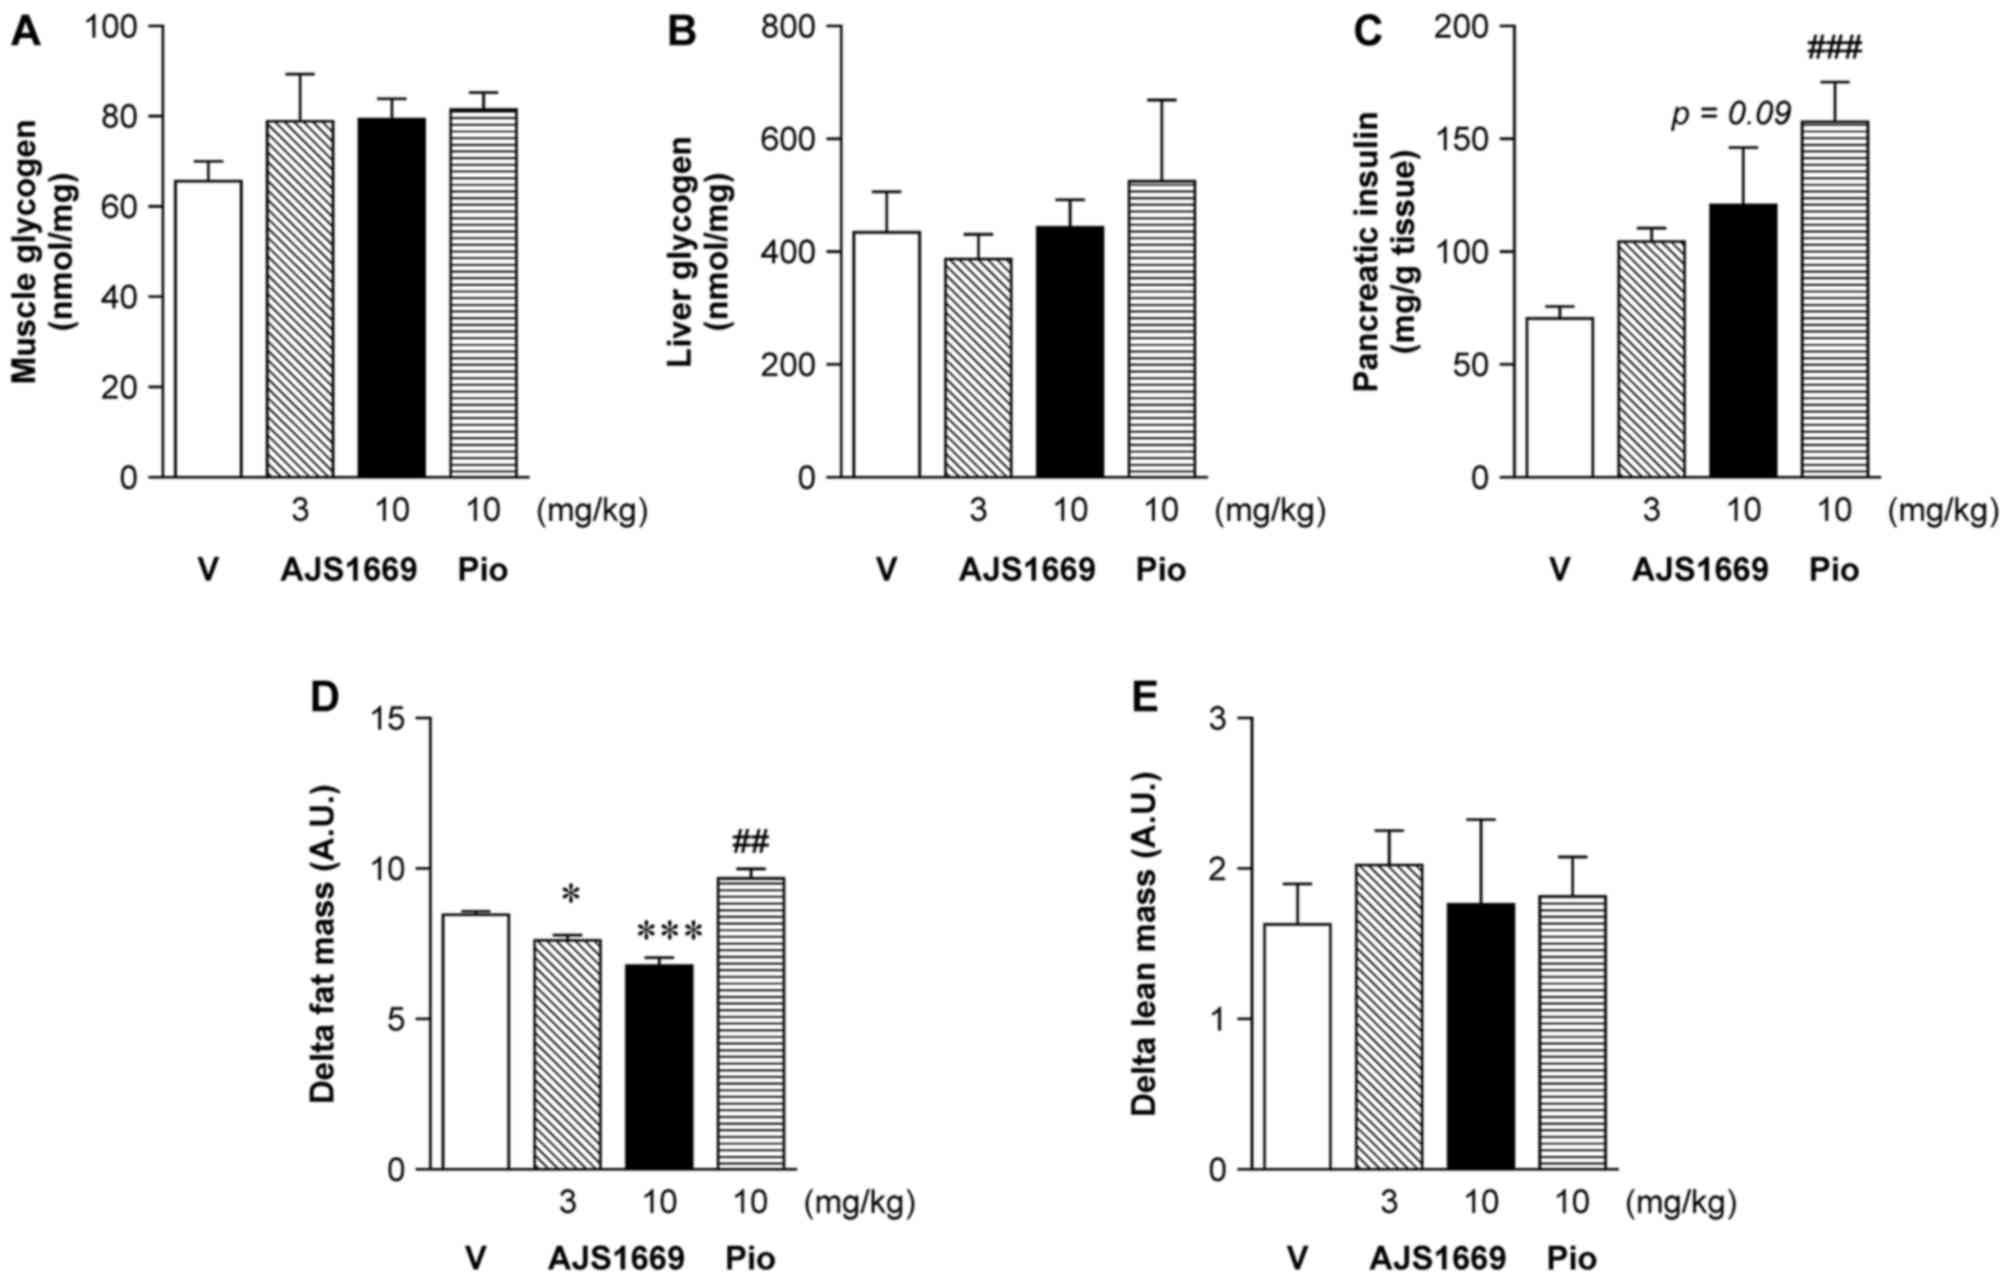
Glycogen levels in both the skeletal muscle and
liver did not significantly increase after 4 weeks of repeated
administration of AJS1669 or pioglitazone, as compared to the
levels measured in the vehicle-treated animals (Fig. 5A and B). Insulin content in the
pancreas showed a tendency to increase at higher doses (Fig. 5C). Treatment-induced changes in
body composition were assessed using EchoMRI, with measurements
performed on the day before the start of administration and
following 4 weeks of administration. A significant decrease in Δfat
mass was observed following administration of 10 mg/kg of AJS1669.
Conversely, animals treated with pioglitazone exhibited a
significant elevation in Δfat mass (Fig. 5D). No difference in Δlean mass was
observed between the groups (Fig.
5E).
Effect of repeated administration of
AJS1669 on mitochondrial biogenesis in skeletal muscle and hepatic
fatty acid oxidation in ob/ob mice
In the skeletal muscle, treatment with AJS1669
elicited no change in Gys1 mRNA levels. A trend towards a
decrease was observed in uncoupling protein 3 (Ucp3) mRNA
levels. However, a significant increase was observed in mRNA
encoding mitochondrial transcription factor A (Tfam), which
is involved in the replication and translation of mitochondrial DNA
(Fig. 6A). Subsequent evaluation
of the mRNA level of genes involved in fatty acid oxidation
detected a trend towards elevated levels of carnitine
palmitoyltransferase 1B (Cpt1b), long chain acyl-CoA
dehydrogenase (Acadl), and medium chain acyl-CoA
dehydrogenase (Acadm) following AJS1669 treatment.
Additionally, AJS1669 administration was observed to increase
mitochondrial DNA content in skeletal muscle tissue (Fig. 6B).
The gene expression in the liver was also evaluated.
Significant increases in the mRNA levels of genes involved in fatty
acid oxidation, including Cd36, Fabp1 (which encodes
fatty acid binding protein 1), Cpt1a and Ucp2, were
observed (Fig. 6C). No change,
however, was observed in the transcription of Pck1 and
G6pase, which are involved in hepatic gluconeogenesis.
Discussion
In the present study, we identified AJS1669 as a
novel, small-molecule GS activator. In vitro testing showed
that this compound activated hGYS1 in a concentration-dependent
manner when administered alone, whereas its action was further
potentiated in the presence of 2.5 mM of G6P. AJS1669 also
exhibited the ability to activate skeletal muscle GS to the same
extent as 3 mM G6P in assessment using lysates of mouse skeletal
muscle. However, the ability of AJS1669 to activate liver GS was
not stronger than its effect on skeletal muscle. AJS1669 acted
potently in skeletal muscle and exhibited greater activation with a
lower dose in the presence of a high G6P concentration.
To assess the effects at the phenotypic level,
skeletal muscle cells were incubated with AJS1669. AJS1669
increased the glycogen level in a concentration-dependent manner.
Intriguingly, incubation with AJS1669 and GPI increased glycogen
levels to a greater extent than did AJS1669 administered alone. In
contrast, no increase was observed following incubation with a GPI
alone.
These observations suggest that in addition to
promoting glycogen synthesis, AJS1669 caused some glycogen
degradation, apparently enhancing the glycogen metabolism turnover.
AJS1669 was developed as a hypoglycemic agent for transforming
blood glucose into glycogen in both skeletal muscle and liver.
However, if AJS1669 can ameliorate insulin resistance as a PPAR
agonist, then it could be the first in a new class of insulin
sensitizers.
Reportedly, PPARγ and PPARδ agonists do not directly
activate glycogen synthesis, but rather act to enhance glycogen
formation by stimulation of insulin receptors (24,25). We therefore assessed the effect of
AJS1669 on the activity of each PPAR subtype. AJS1669 did not
elicit any increase in PPARα, γ or δ activity at a concentration of
100 μM (data not shown), which is higher than the
physiological level resulting from administration of 10 mg/kg
AJS1669 (Fig. 3E).
To evaluate the pharmacological effect of AJS1669,
we measured the concentration of AJS1669 in both the muscle and
liver of ob/ob mice. The concentration in the muscle was
0.31 μM, which was higher than the EC50 of 0.037
μM with G6P (Fig. 1C).
Based on the potential of AJS1669 for improving glycogen metabolism
determined through in vitro tests, we selected ob/ob
mice, which are hyperinsulinemic, bulimic, and do not actively
exercise. Diabetic-induced mice (DIO) were not used because they
are easily affected by food consumption and exercise capacity.
Additionally, db/db mice were not used because they may experience
body weight loss as a result of hyperglycemia.
Since the AJS1669 concentration of 3 mg/kg observed
in the muscle in vivo was sufficient to activate GYS1 in
vitro, and following the 3Rs policy, we decided to use 10 mg/kg
as the maximum dose for the in vivo experiments. The
concentration of AJS1669 was much higher in the liver than that
noted in muscle. As previously reported, the furanyl group of
AJS1669 has high stability with respect to liver metabolism as it
is a 5-membered ring (26). The
ability of AJS1669 to reduce blood glucose levels, decrease HbA1c
levels, and improve glucose tolerance was observed following 4
weeks of repeated administration (Fig. 4). Interestingly, repeated
administration of AJS1669 did not elicit a major change in food
consumption. Additionally, 4 weeks of repeated administration of
AJS1669 did not elevate the blood lactic acid level (data not
shown). No abnormalities were observed in the plasma alanine
aminotransferase (ALT) and aspartate aminotransferase (AST) level,
which reflect the liver safety profile (Table II). Similarly, C57BL/6 mice
treated for 4 weeks with 30 mg/kg AJS1669 exhibited no changes in
body weight, food intake, blood glucose levels, ALT levels, or AST
levels (data not shown). AJS1669 therefore does not appear to
reduce fat mass by any toxic mechanism.
| Table IIEffect of AJS1669 on liver weight and
hepatic functional parameters in ob/ob mice. |
Table II
Effect of AJS1669 on liver weight and
hepatic functional parameters in ob/ob mice.
| Treatment | Liver weight
(g) | Plasma ALT
(IU/l) | Plasma AST
(IU/l) |
|---|
| Vehicle | 3.89±0.08 | 683.29±134.91 | 977.57±206.36 |
| AJS1669 (10
mg/kg) | 3.72±0.71 | 471.38±65.39 | 544.25±88.32 |
| Pioglitazone (10
mg/kg) | 4.33±0.84 | 621.00±116.99 | 978.00±268.51 |
Intriguingly, although muscle glycogen levels in all
animals in the group treated with 10 mg/kg AJS1669 was increased in
comparison with the vehicle-treated group levels, the change was
not significant. The same results were observed for
pioglitazone-treated animals. Because both AJS1669 and pioglitazone
improved glucose tolerance (Fig.
4), glycogen levels could be increased by administration of
these compounds. In this study, utilizing ad libitum feeding
in ob/ob mice, a significant increase in muscle glycogen may
not have been detected (Fig. 5).
However, AJS1669 increased the glycogen level in muscle cells, and
this level was additively increased under treatment with both
AJS1669 and GPI (Fig. 2).
Therefore, AJS1669 increased not only glycogen accumulation but
also glycogen degradation, and this machinery could improve
glycogen metabolism. In exercise, both glycogen accumulation and
glycogen degradation are involved in energy homeostasis and
regulation of insulin sensitivity (27). Since AJS1669 improves the energy
capacity of skeletal muscles, it was necessary for us to choose
diabetic animals for evaluating this compound. Evaluation of these
mice showed that pioglitazone treatment significantly increased the
whole body fat mass (a harmful side effect), whereas AJS1669 was
observed to markedly decrease the fat mass as we hypothesized
(Fig. 5). AJS1669 thus appears to
directly induce both glycogen synthesis and glycogen turnover, and
therefore may be the first in a new class of insulin
sensitizers.
To examine the possibility that the effect of
AJS1669 on muscle glycogen causes a metabolic response in muscle,
β-oxidation-related genes were also evaluated (28). Increases in the expression of
β-oxidation-related genes involved in lipid metabolism in the
skeletal muscle and liver, as well as in the expression of genes
involved in mitochondrial biogenesis, were observed following 4
weeks of repeated administration of AJS1669. Although AJS1669
treatment did not alter the expression of Gys1 in skeletal
muscle tissue, it significantly increased the expression of
Tfam, a gene involved in the stability and transport of
mitochondrial gene transcripts. Additionally, a trend towards an
increase in the expression of genes involved in β-oxidation, such
as Cpt1b and Acadm, was observed following 4 weeks of
repeated administration. Regulation of genes involved in
mitochondrial biogenesis and fatty acid oxidation by AJS1669 is
likely to be associated with a decrease in fat mass. In the liver,
no significant modulation of genes controlling gluconeogenesis was
observed. As evidenced by the lack of effect on the liver observed
through in vitro experiments, AJS1669 may not alter glucose
metabolism by directly affecting the liver as excessive liver
glycogen accumulation would inhibit the fat mass decrease (29) or reduce body fat mass by
attenuating food intake in high-fat-diet model mice (30). In the present study, AJS1669 did
not induce accumulation of liver glycogen or decrease fat mass.
Following the upregulation of β-oxidation-related genes involved in
lipid metabolism in the skeletal muscle, lipid flow may be altered
across the entire body, thus affecting oxidation in the liver.
Although AJS1669 improved glucose homeostasis while
decreasing the fat mass in ob/ob mice, this effect was not
stronger than the action of pioglitazone. No significant
glucose-lowering action was observed at day 17 following
administration, and a longer administration period may be required
to accurately demonstrate drug efficacy relative to pioglitazone.
The physiological mechanism underlying this difference is currently
not known, but a number of factors may be involved. AJS1669 could
potentially activate GYS1 at a concentration of <1 μM
in vitro (Figs. 1B and C
and 2A). However, the plasma
concentration of AJS1669 at 2 h after administration was below 1
μM (Fig. 3E). The dose of
AJS1669 used in our experiments (10 mg/kg) may thus not be the
optimal dose to elicit the desired pharmacological actions.
Moreover, 4 weeks of repeated administration may result in
attainment of a homeostatic phase and thus may not be an
appropriate term for evaluating the maximum pharmacological effect
of this compound. Our aim was to determine the length of time over
which administration of AJS1669 can maintain the initial change in
glucose metabolism, and we found the duration to surpass 4 weeks.
Since fat mass was reduced in AJS1669-treated animals, glucose
tolerance was improved, and because the mRNA levels of a number of
genes were significantly altered in both skeletal muscle and liver,
long-term administration may elicit stronger pharmacological
effects. Another factor affecting body composition may be the
difference in glycogen metabolism between muscle and liver tissue.
In mice, the basal amount of glycogen in the skeletal muscle at
satiation is approximately one-tenth of that in the liver, and
glycogen metabolism is thought to affect glucose metabolism more
significantly in the liver than in the skeletal muscle (31). In humans, however, skeletal muscle
accounts for ~40% of body composition (32) and plays a central role in glucose
metabolism (33). In the present
study in mouse tissue lysates, AJS1669 elicited a stronger effect
in the skeletal muscle than in the liver (Fig. 2A and B), with intense effects not
achieved in vivo (Fig. 3).
We therefore postulate that the pharmacological effect of AJS1669
observed in mice should be far more pronounced in humans.
In skeletal muscle tissue of patients suffering from
type 2 diabetes or obese patients, a decrease in mitochondrial
oxidative capacity has been reported (34,35), along with lower expression of
genes related to mitochondrial biogenesis (36,37). Increased physical activity and
weight loss interventions in these patients were the main inducers
of improved mitochondrial functional capacity, and these changes in
the mitochondria were associated with improvement of insulin
resistance (38,39). Considering the association between
GS activity and mitochondrial function, a number of unanswered
questions remain regarding the molecules that are directly
involved. It is, however, conceivable that repeated administration
of AJS1669 may alter glycogen metabolism, and may therefore mimic
the effects of exercise and weight loss.
In conclusion, previous studies suggest that
beneficial alterations of glycogen metabolism, similar to the
physiological effects of physical exercise, may result from
attenuation of GS activity in type 2 diabetes. In the present
study, AJS1669 enhanced glycogen metabolism and improved
mitochondrial biogenesis, and consequently elicited a reduction in
body fat mass and exhibited anti-diabetic activity. AJS1669
therefore exhibits potential for use as a new insulin
resistance-improving drug with a mechanism of action distinct from
that of pioglitazone. AJS1669 can be regarded as a promising
candidate compound for the management of type 2 diabetes.
Abbreviations:
|
GS
|
glycogen synthase
|
|
GYS1
|
glycogen synthase 1
|
|
G6P
|
glucose-6-phosphate
|
|
GPI
|
glycogen phosphorylase inhibitor
|
|
HbA1c
|
hemoglobin A1c
|
|
HOMA-IR
|
homeostatic model for assessment of
insulin resistance
|
|
hGYS1
|
human GYS1
|
|
13C-NMR
|
carbon-13 nuclear magnetic resonance
spectroscopy
|
|
OGTT
|
oral glucose tolerance test
|
|
PPAR
|
peroxisome proliferator-activated
receptor
|
|
SGLT2
|
sodium/glucose co-transporter 2
|
Acknowledgments
We would like to give special thanks to Atsushi
Konishi and Yukio Iino (Ajinomoto Pharmaceuticals Co., Ltd.) for
supervising us in this study. Advice given by Yuki Saitoh and
Tomomi Yoshida (Ajinomoto Pharmaceuticals Co., Ltd.) has helped
immensely with establishing our in vivo and in vitro
experiments. Kayo Matsumoto and Manami Shuto (Ajinomoto
Pharmaceuticals Co., Ltd.) who synthesized and analyzed other types
of GS activators, except for AJS1669, provided us with important
information. A special note of gratitude is owed to Eri Tabuchi
(Ajinomoto Pharmaceuticals Co., Ltd.), who analyzed the 3D
structure of human Gys1 protein using information of yeast Gys2
protein and gave us great advice.
References
|
1
|
Shaw JE, Sicree RA and Zimmet PZ: Global
estimates of the prevalence of diabetes for 2010 and 2030. Diabetes
Res Clin Pract. 87:4–14. 2010. View Article : Google Scholar
|
|
2
|
Raskin P: Why insulin sensitizers but not
secretagogues should be retained when initiating insulin in type 2
diabetes. Diabetes Metab Res Rev. 24:3–13. 2008. View Article : Google Scholar
|
|
3
|
Damsbo P, Vaag A, Hother-Nielsen O and
Beck-Nielsen H: Reduced glycogen synthase activity in skeletal
muscle from obese patients with and without type 2
(non-insulin-dependent) diabetes mellitus. Diabetologia.
34:239–245. 1991. View Article : Google Scholar : PubMed/NCBI
|
|
4
|
Schalin-Jäntti C, Härkonen M and Groop LC:
Impaired activation of glycogen synthase in people at increased
risk for developing NIDDM. Diabetes. 41:598–604. 1992. View Article : Google Scholar : PubMed/NCBI
|
|
5
|
Shulman GI, Rothman DL, Jue T, Stein P,
DeFronzo RA and Shulman RG: Quantitation of muscle glycogen
synthesis in normal subjects and subjects with
non-insulin-dependent diabetes by 13C nuclear magnetic
resonance spectroscopy. N Engl J Med. 322:223–228. 1990. View Article : Google Scholar : PubMed/NCBI
|
|
6
|
Gaster M, Petersen I, Højlund K, Poulsen P
and Beck-Nielsen H: The diabetic phenotype is conserved in myotubes
established from diabetic subjects: Evidence for primary defects in
glucose transport and glycogen synthase activity. Diabetes.
51:921–927. 2002. View Article : Google Scholar : PubMed/NCBI
|
|
7
|
Henry RR, Ciaraldi TP, Abrams-Carter L,
Mudaliar S, Park KS and Nikoulina SE: Glycogen synthase activity is
reduced in cultured skeletal muscle cells of non-insulin-dependent
diabetes mellitus subjects. Biochemical and molecular mechanisms. J
Clin Invest. 98:1231–1236. 1996. View Article : Google Scholar : PubMed/NCBI
|
|
8
|
Goodpaster BH, Katsiaras A and Kelley DE:
Enhanced fat oxidation through physical activity is associated with
improvements in insulin sensitivity in obesity. Diabetes.
52:2191–2197. 2003. View Article : Google Scholar : PubMed/NCBI
|
|
9
|
Nordby P, Auerbach PL, Rosenkilde M,
Kristiansen L, Thomasen JR, Rygaard L, Groth R, Brandt N, Helge JW,
Richter EA, et al: Endurance training per se increases metabolic
health in young, moderately overweight men. Obesity (Silver
Spring). 20:2202–2212. 2012. View Article : Google Scholar
|
|
10
|
Ross R, Dagnone D, Jones PJ, Smith H,
Paddags A, Hudson R and Janssen I: Reduction in obesity and related
comorbid conditions after diet-induced weight loss or
exercise-induced weight loss in men. A randomized, controlled
trial. Ann Intern Med. 133:92–103. 2000. View Article : Google Scholar : PubMed/NCBI
|
|
11
|
Jensen J, Tantiwong P, Stuenæs JT,
Molina-Carrion M, DeFronzo RA, Sakamoto K and Musi N: Effect of
acute exercise on glycogen synthase in muscle from obese and
diabetic subjects. Am J Physiol Endocrinol Metab. 303:E82–E89.
2012. View Article : Google Scholar : PubMed/NCBI
|
|
12
|
Manabe Y, Gollisch KS, Holton L, Kim YB,
Brandauer J, Fujii L, Hirshman MF and Goodyear LJ: Exercise
training-induced adaptations associated with increases in skeletal
muscle glycogen content. FEBS J. 280:916–926. 2013.
|
|
13
|
Ryan AS, Ortmeyer HK and Sorkin JD:
Exercise with calorie restriction improves insulin sensitivity and
glycogen synthase activity in obese postmenopausal women with
impaired glucose tolerance. Am J Physiol Endocrinol Metab.
302:E145–E152. 2012. View Article : Google Scholar :
|
|
14
|
Abdul-Ghani MA and DeFronzo RA:
Pathogenesis of insulin resistance in skeletal muscle. J Biomed
Biotechnol. 2010:4762792010. View Article : Google Scholar : PubMed/NCBI
|
|
15
|
Roach PJ, Depaoli-Roach AA, Hurley TD and
Tagliabracci VS: Glycogen and its metabolism: Some new developments
and old themes. Biochem J. 441:763–787. 2012. View Article : Google Scholar : PubMed/NCBI
|
|
16
|
Browner MF, Nakano K, Bang AG and
Fletterick RJ: Human muscle glycogen synthase cDNA sequence: A
negatively charged protein with an asymmetric charge distribution.
Proc Natl Acad Sci USA. 86:1443–1447. 1989. View Article : Google Scholar : PubMed/NCBI
|
|
17
|
Nuttall FQ, Gannon MC, Bai G and Lee EY:
Primary structure of human liver glycogen synthase deduced by cDNA
cloning. Arch Biochem Biophys. 311:443–449. 1994. View Article : Google Scholar : PubMed/NCBI
|
|
18
|
Bolin D, Ahmad M, Banner B, Boros LG, Cai
J, Gillespie P, Goodnow R, Gubler ML, Hamilton MM, Hayden S, et al:
A novel approach for the treatment of type 2 diabetes (T2D):
characterization of a potent, orally active, small molecule
glycogen synthase activator. Presented at 70th ADA Scientific
Sessions; Abstract 1389-P. 2010
|
|
19
|
Qian Y, Bolin D, Conde-Knape K, Gillespie
P, Hayden S, Huang KS, Olivier AR, Sato T, Xiang Q, Yun W, et al:
Design and synthesis of 2-N-substituted indazolone derivatives as
non-carboxylic acid glycogen synthase activators. Bioorg Med Chem
Lett. 23:2936–2940. 2013. View Article : Google Scholar : PubMed/NCBI
|
|
20
|
Danforth WH: Glycogen synthetase activity
in skeletal muscle. Interconversion of two forms and control of
glycogen synthesis. J Biol Chem. 240:588–593. 1965.PubMed/NCBI
|
|
21
|
Berger J and Hayes NS: A high-capacity
assay for activators of glucose incorporation into glycogen in L6
muscle cells. Anal Biochem. 261:159–163. 1998. View Article : Google Scholar : PubMed/NCBI
|
|
22
|
Thomas JA, Schlender KK and Larner J: A
rapid filter paper assay for UDPglucose-glycogen
glucosyltransferase, including an improved biosynthesis of
UDP-14C-glucose. Anal Biochem. 25:486–499. 1968.
View Article : Google Scholar : PubMed/NCBI
|
|
23
|
Nixon JP, Zhang M, Wang C, Kuskowski MA,
Novak CM, Levine JA, Billington CJ and Kotz CM: Evaluation of a
quantitative magnetic resonance imaging system for whole body
composition analysis in rodents. Obesity (Silver Spring).
18:1652–1659. 2010. View Article : Google Scholar
|
|
24
|
Dimopoulos N, Watson M, Green C and Hundal
HS: The PPARdelta agonist, GW501516, promotes fatty acid oxidation
but has no direct effect on glucose utilisation or insulin
sensitivity in rat L6 skeletal muscle cells. FEBS Lett.
581:4743–4748. 2007. View Article : Google Scholar : PubMed/NCBI
|
|
25
|
Sugiyama Y, Taketomi S, Shimura Y, Ikeda H
and Fujita T: Effects of pioglitazone on glucose and lipid
metabolism in Wistar fatty rats. Arzneimittelforschung. 40:263–267.
1990.PubMed/NCBI
|
|
26
|
St Jean DJ Jr and Fotsch C: Mitigating
heterocycle metabolism in drug discovery. J Med Chem. 55:6002–6020.
2012. View Article : Google Scholar : PubMed/NCBI
|
|
27
|
Jensen J, Rustad PI, Kolnes AJ and Lai YC:
The role of skeletal muscle glycogen breakdown for regulation of
insulin sensitivity by exercise. Front Physiol. 2:1122011.
View Article : Google Scholar
|
|
28
|
Egan B and Zierath JR: Exercise metabolism
and the molecular regulation of skeletal muscle adaptation. Cell
Metab. 17:162–184. 2013. View Article : Google Scholar : PubMed/NCBI
|
|
29
|
Izumida Y, Yahagi N, Takeuchi Y, Nishi M,
Shikama A, Takarada A, Masuda Y, Kubota M, Matsuzaka T, Nakagawa Y,
et al: Glycogen shortage during fasting triggers
liver-brain-adipose neurocircuitry to facilitate fat utilization.
Nat Commun. 4:23162013.PubMed/NCBI
|
|
30
|
López-Soldado I, Zafra D, Duran J, Adrover
A, Calbó J and Guinovart JJ: Liver glycogen reduces food intake and
attenuates obesity in a high-fat diet-fed mouse model. Diabetes.
64:796–807. 2015. View Article : Google Scholar
|
|
31
|
Kasuga M, Ogawa W and Ohara T: Tissue
glycogen content and glucose intolerance. J Clin Invest.
111:1282–1284. 2003. View Article : Google Scholar : PubMed/NCBI
|
|
32
|
Clarys JP, Martin AD, Marfell-Jones MJ,
Janssens V, Caboor D and Drinkwater DT: Human body composition: A
review of adult dissection data. Am J Hum Biol. 11:167–174. 1999.
View Article : Google Scholar
|
|
33
|
Ivy JL: Role of carbohydrate in physical
activity. Clin Sports Med. 18:469–484. v1999. View Article : Google Scholar : PubMed/NCBI
|
|
34
|
Kelley DE, He J, Menshikova EV and Ritov
VB: Dysfunction of mitochondria in human skeletal muscle in type 2
diabetes. Diabetes. 51:2944–2950. 2002. View Article : Google Scholar : PubMed/NCBI
|
|
35
|
Simoneau JA, Veerkamp JH, Turcotte LP and
Kelley DE: Markers of capacity to utilize fatty acids in human
skeletal muscle: Relation to insulin resistance and obesity and
effects of weight loss. FASEB J. 13:2051–2060. 1999.PubMed/NCBI
|
|
36
|
Mootha VK, Lindgren CM, Eriksson KF,
Subramanian A, Sihag S, Lehar J, Puigserver P, Carlsson E,
Ridderstråle M, Laurila E, et al: PGC-1alpha-responsive genes
involved in oxidative phosphorylation are coordinately
downregulated in human diabetes. Nat Genet. 34:267–273. 2003.
View Article : Google Scholar : PubMed/NCBI
|
|
37
|
Patti ME, Butte AJ, Crunkhorn S, Cusi K,
Berria R, Kashyap S, Miyazaki Y, Kohane I, Costello M, Saccone R,
et al: Coordinated reduction of genes of oxidative metabolism in
humans with insulin resistance and diabetes: Potential role of GC1
and NRF1. Proc Natl Acad Sci USA. 100:8466–8471. 2003. View Article : Google Scholar
|
|
38
|
Toledo FG, Watkins S and Kelley DE:
Changes induced by physical activity and weight loss in the
morphology of inter-myofibrillar mitochondria in obese men and
women. J Clin Endocrinol Metab. 91:3224–3227. 2006. View Article : Google Scholar : PubMed/NCBI
|
|
39
|
Toledo FG, Menshikova EV, Ritov VB, Azuma
K, Radikova Z, DeLany J and Kelley DE: Effects of physical activity
and weight loss on skeletal muscle mitochondria and relationship
with glucose control in type 2 diabetes. Diabetes. 56:2142–2147.
2007. View Article : Google Scholar : PubMed/NCBI
|