Introduction
The incidence of diabetes mellitus is increasing,
and this condition is becoming one of the major causes of morbidity
and mortality across the globe (1). Blood glucose levels are maintained
within a narrow range in healthy individuals by the liver through
the opposing actions of insulin and glucagon (2). Hepatic gluconeogenesis, which is
inhibited by insulin and stimulated by glucagon, serves an
essential role in the maintenance of a normal blood glucose level
during fasting. Gluconeogenesis becomes unrestrained in diabetes
due to either deficient insulin secretion in type 1 diabetes
mellitus or deficient insulin action in type 2 diabetes mellitus,
which contributes to hyperglycemia (3). Therefore, elucidation of the
molecular mechanism involved in the regulation of hepatic
gluconeogenesis is likely to provide new avenues for the treatment
of type 2 diabetes mellitus.
Long non-coding RNAs (lncRNAs) are defined as
transcripts of >200 nucleotides (nt) that do not encode protein.
According to their position relative to nearby coding genes,
lncRNAs can generally be classified into four categories, namely
sense overlap, antisense overlap, bidirectional and intergenic
noncoding RNAs (4). It has been
suggested that lncRNAs serve a pivotal role in physiology and
disease (5,6). Morán et al (7) uncovered hundreds of islet lncRNAs by
strand-specific analysis, some of which were dysregulated in type 2
diabetes or mapped to genetic loci underlying diabetes
susceptibility. In adipose tissue, numerous lncRNAs have been
identified to regulate adipogenesis (8). In muscle cells, H19 LncRNA has been
indicated to mediate the regulation of glucose metabolism (9). However, little is known about the
role of lncRNAs in hepatic gluconeogenesis.
In the fasting state, the increased secretion of the
catabolic hormone glucagon stimulates gluconeogenesis by triggering
the cyclic adenosine monophosphate (cAMP)/protein kinase A pathway
and promoting the transcription of gluconeogenic genes (10). Metformin is currently the first
drug of choice for the treatment of type 2 diabetes mellitus
(11). It has been demonstrated
that metformin reduces glucose output mainly via the inhibition of
gluconeogenesis (12). However,
the exact mechanism remains unclear (13–15). To identify whether lncRNAs are
involved in the metformin-mediated inhibition of gluconeogenesis, a
systematic analysis of the lncRNA expression profile in
cAMP-stimulated primary mouse hepatocytes was performed in the
present study. The cAMP-induced changes in lncRNA expression that
were attenuated by metformin were identified. Among them, the
expression levels of eight lncRNAs were validated by reverse
transcription-quantitative polymerase chain reaction (RT-qPCR). The
aim of the present study was to identify the potential role of
lncRNAs in the regulation of gluconeogenesis.
Materials and methods
Materials
A total of 48 C57Bl/6 mice (age, 8–12 weeks old;
weight, 18–20 g) were purchased from Shanghai Slack Experimental
Center (Shanghai, China) and were housed in a specific pathogen
free (SPF) environment (24–26°C; relative humidity 50–60%) with a
12-h light/dark cycle and free access to food and water. Dulbecco's
modified Eagle's medium (DMEM) and Hank's balanced salt solution
(HBSS) were obtained from Gibco (Thermo Fisher Scientific, Inc.,
Waltham, MA, USA). Hepatocyte medium was purchased from ScienCell
Research Laboratories, Inc. (Carlsbad, CA, USA). Sodium pyruvate,
sodium lactate, dexamethasone, bovine serum albumin (BSA),
8-bromoadenosine 3′,5′-cyclic monophosphate (8-br-cAMP) and
metformin were acquired from Sigma-Aldrich (Merck KGaA, Darmstadt,
Germany). All the primers used in RT-qPCR were synthesized by
Shanghai Sangon Biological Engineering Technology and Services Co.,
Ltd. (Shanghai, China).
Primary mouse hepatocyte isolation and
culture
All experiments were supervised and approved by the
laboratory ethics committee of Ruijin Hospital affiliated with
Shanghai Jiaotong University School of Medicine (Shanghai, China).
Hepatocytes were isolated from 8–12 week old male C57Bl/6 mice.
Briefly, following anesthesia, mouse livers were perfused with 10
ml 1X HBSS without calcium, followed by perfusion with 0.05%
collagenase IV in calcium-containing HBSS in a recirculating
manner. The liver was then detached and filtered through a 70
μm nylon mesh and hepatocytes were sedimented by
centrifugation at 200 × g for 5 min at 4°C. The hepatocytes were
plated onto 6-well plates and grown in hepatocyte medium
supplemented with BSA, penicillin/streptomycin and hepatocyte
growth factor. The cultures were maintained at 37°C in humidified
atmosphere (95% air and 5% CO2). After 24 h, the cells
had become attached to the plates and the medium was replaced with
low glucose DMEM containing 0.25% BSA with dexamethasone (100 nM)
for prestimulation for 12–16 h. The cells were then incubated with
100 μM 8-br-cAMP (a permeable analogue of cAMP) in the
presence or absence of 2 mM metformin in glucose-free DMEM
containing gluconeogenic substrates (10 mM sodium lactate and 1 mM
sodium pyruvate) for 8 h.
RNA extraction and quality control
Total RNA was extracted from primary mice
hepatocytes using TRIzol reagent (Invitrogen; Thermo Fisher
Scientific, Inc.) according to the manufacturer's protocol. The RNA
purity and concentration was evaluated with a NanoDrop-2000
spectrophotometer (Thermo Fisher Scientific, Inc.). The optical
density (OD) absorbance ratio at 260 and 280 nm
(A260/A280 ratio) was ~2.0 and the OD
A260/A230 ratio was ~1.8. RNA integrity was
determined by standard denaturing agarose gel electrophoresis,
which revealed that the samples were good quality.
Microarray analysis
ArrayStar mouse LncRNA microarray version 2.0
(ArrayStar Inc., Rockville, MD, USA) is designed for the global
profiling of mouse lncRNAs in hepatocytes isolated from 3 mice
(i.e., 3 groups at 3 replicates). The sample preparations and
microarray hybridization were performed based on the manufacturer's
protocols. Briefly, 1 μg total RNA from each sample was
amplified and transcribed into fluorescent cRNA using Agilent's
Quick Amp Labeling kits (Agilent Technologies, Inc., Santa Clara,
CA, USA) according to the manufacturer's protocol. The labeled
cRNAs were hybridized onto the mouse 8×60K LncRNA array. After
washing, the arrays were scanned using the Agilent G2505C
Microarray Scanner System, and Agilent Feature Extraction software
was used to analyze the acquired array images (Agilent
Technologies, Inc.). Quantile normalization and subsequent data
processing were performed using the GeneSpring GX v12.0 software
package (Agilent Technologies, Inc.). The threshold set for
significantly differential genes was an absolute log value of
fold-change ≥2 and a P-value ≤0.05. The microarray analysis was
performed by KangChen Bio-tech Inc. Corporations (Shanghai,
China).
RT-qPCR
Following total RNA extraction, as described above,
cDNA was synthesized by reverse transcription using Superscript II
RT reagent kit (Promega Corporation, Madison, WI, USA) according to
the manufacturer's protocol. RT-qPCR was performed with the Roche
LightCycler® 480 instrument (Roche Diagnostics, Basel,
Switzerland) using SYBR Premix Ex Taq (Takara Bio, Inc., Otsu,
Japan) in a final volume of 10 μl. The PCR conditions were
as follows: Denaturation at 95°C for 10 sec, 40 cycles at 95°C for
5 sec and 60°C for 31 sec. A melting curve was constructed in the
temperature range of 60 to 95°C at the end of the amplification.
The sequences of the primers used are shown in Table I. Relative gene expression levels
were quantified based on the cycle threshold (Cq) values and
normalized to the internal control gene β-actin, which received a
value of 1. The relative gene expression was calculated using the
2−ΔΔCq method (16).
 | Table ISequence of the primers used for
reverse transcription-quantitative polymerase chain reaction. |
Table I
Sequence of the primers used for
reverse transcription-quantitative polymerase chain reaction.
| Gene | Forward sequence
(5′ to 3′) | Reverse sequence
(5′ to 3′) |
|---|
| PEPCK |
GTGCTGGAGTGGATGTTCGG |
CTGGCTGATTCTCTGTTTCAGG |
| AK133602 |
GACCAGTCTGACCCCTATCC |
TAACCAGCCATTCACCCTC |
|
ENSMUST00000138573 |
CCTCAGCACAGAAACCACC |
AGCCTGTCCAACTATGCGT |
|
ENSMUST00000129953 |
TTCAGCCTACAATCCCAAG |
GTGGAATACACCCCGAAGT |
| uc009njr.1 |
TTTGTCGCTCATCCACGCT |
GCAAATGGTCCCGCAAATA |
| AA591058 |
GACCACCAGGCAGCACTTC |
ACCACACACACCCACACACAC |
| NR_027710 |
TGCCATATCTTCCAGTGACC |
TAAGGTTCGCTCAATAGTCTTG |
| NR_030715 |
TGGGGTGGAGAAGACAACA |
AGCACAACCACAAGCATCTAC |
|
ENSMUST00000145208 |
TCTCAACTCTATGCCGCCTT |
GCACACTTCCGCTTCACCT |
| Gpr155 |
GTTTTTCTGTGCCGTGTTTAACT |
GGGGGATTCTCTGTCTGCT |
| PGC-1α |
ATACCGCAAAGAGCACGAGAAG |
CTCAAGAGCAGCGAAAGCGTCACAG |
| β-actin |
GGCTGTATTCCCCTCCATCG |
CCAGTTGGTAACAATGCCATGT |
Statistical analysis
All values are presented as mean ± standard
deviation from at least three independent experiments, and P≤0.05
was considered to indicate a statistically significant difference.
Differential expression levels of genes were compared using ANOVA
for multiple groups or Student's t-test for two groups. Statistical
analysis was performed by SPSS 18.0 software (IBM, Armonk, NY,
USA).
Results
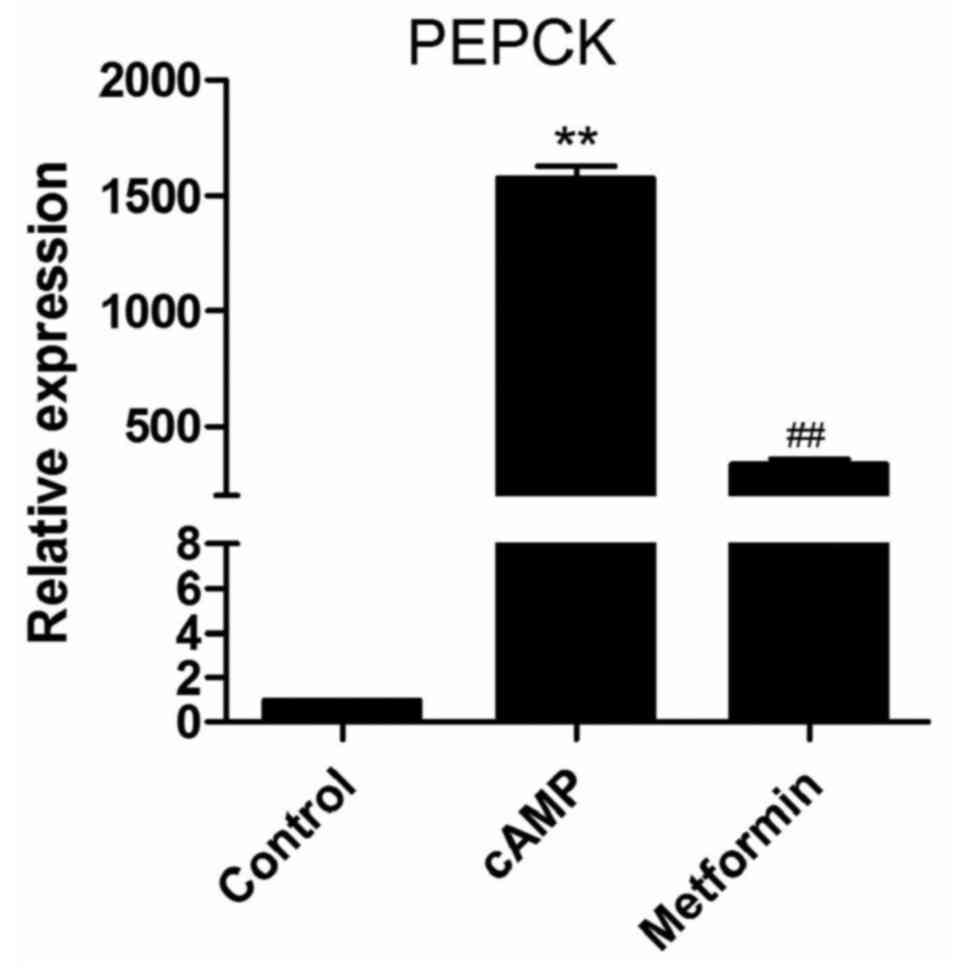
Phosphoenolpyruvate carboxykinase (PEPCK)
expression levels under different conditions
Gluconeogenesis is tightly controlled through the
transcriptional regulation of PEPCK, the rate-limiting enzyme of
hepatic gluconeogenesis (17).
Metformin has been reported to suppress PEPCK expression in primary
hepatocytes (14). Prior to
microarray analysis, the effect of metformin on PEPCK mRNA
expression in the primary mouse hepatocytes was investigated.
Following the incubation of primary mouse hepatocytes with 100
μM 8-br-cAMP for 8 h, PEPCK mRNA expression was
significantly increased, and this increase was significantly
suppressed by 2 mM metformin (Fig.
1). This indicates that the experimental conditions are
suitable for studying the mechanism of gluconeogenesis. Therefore,
the microarray analysis of the lncRNAs expression profile was
performed using the same conditions.
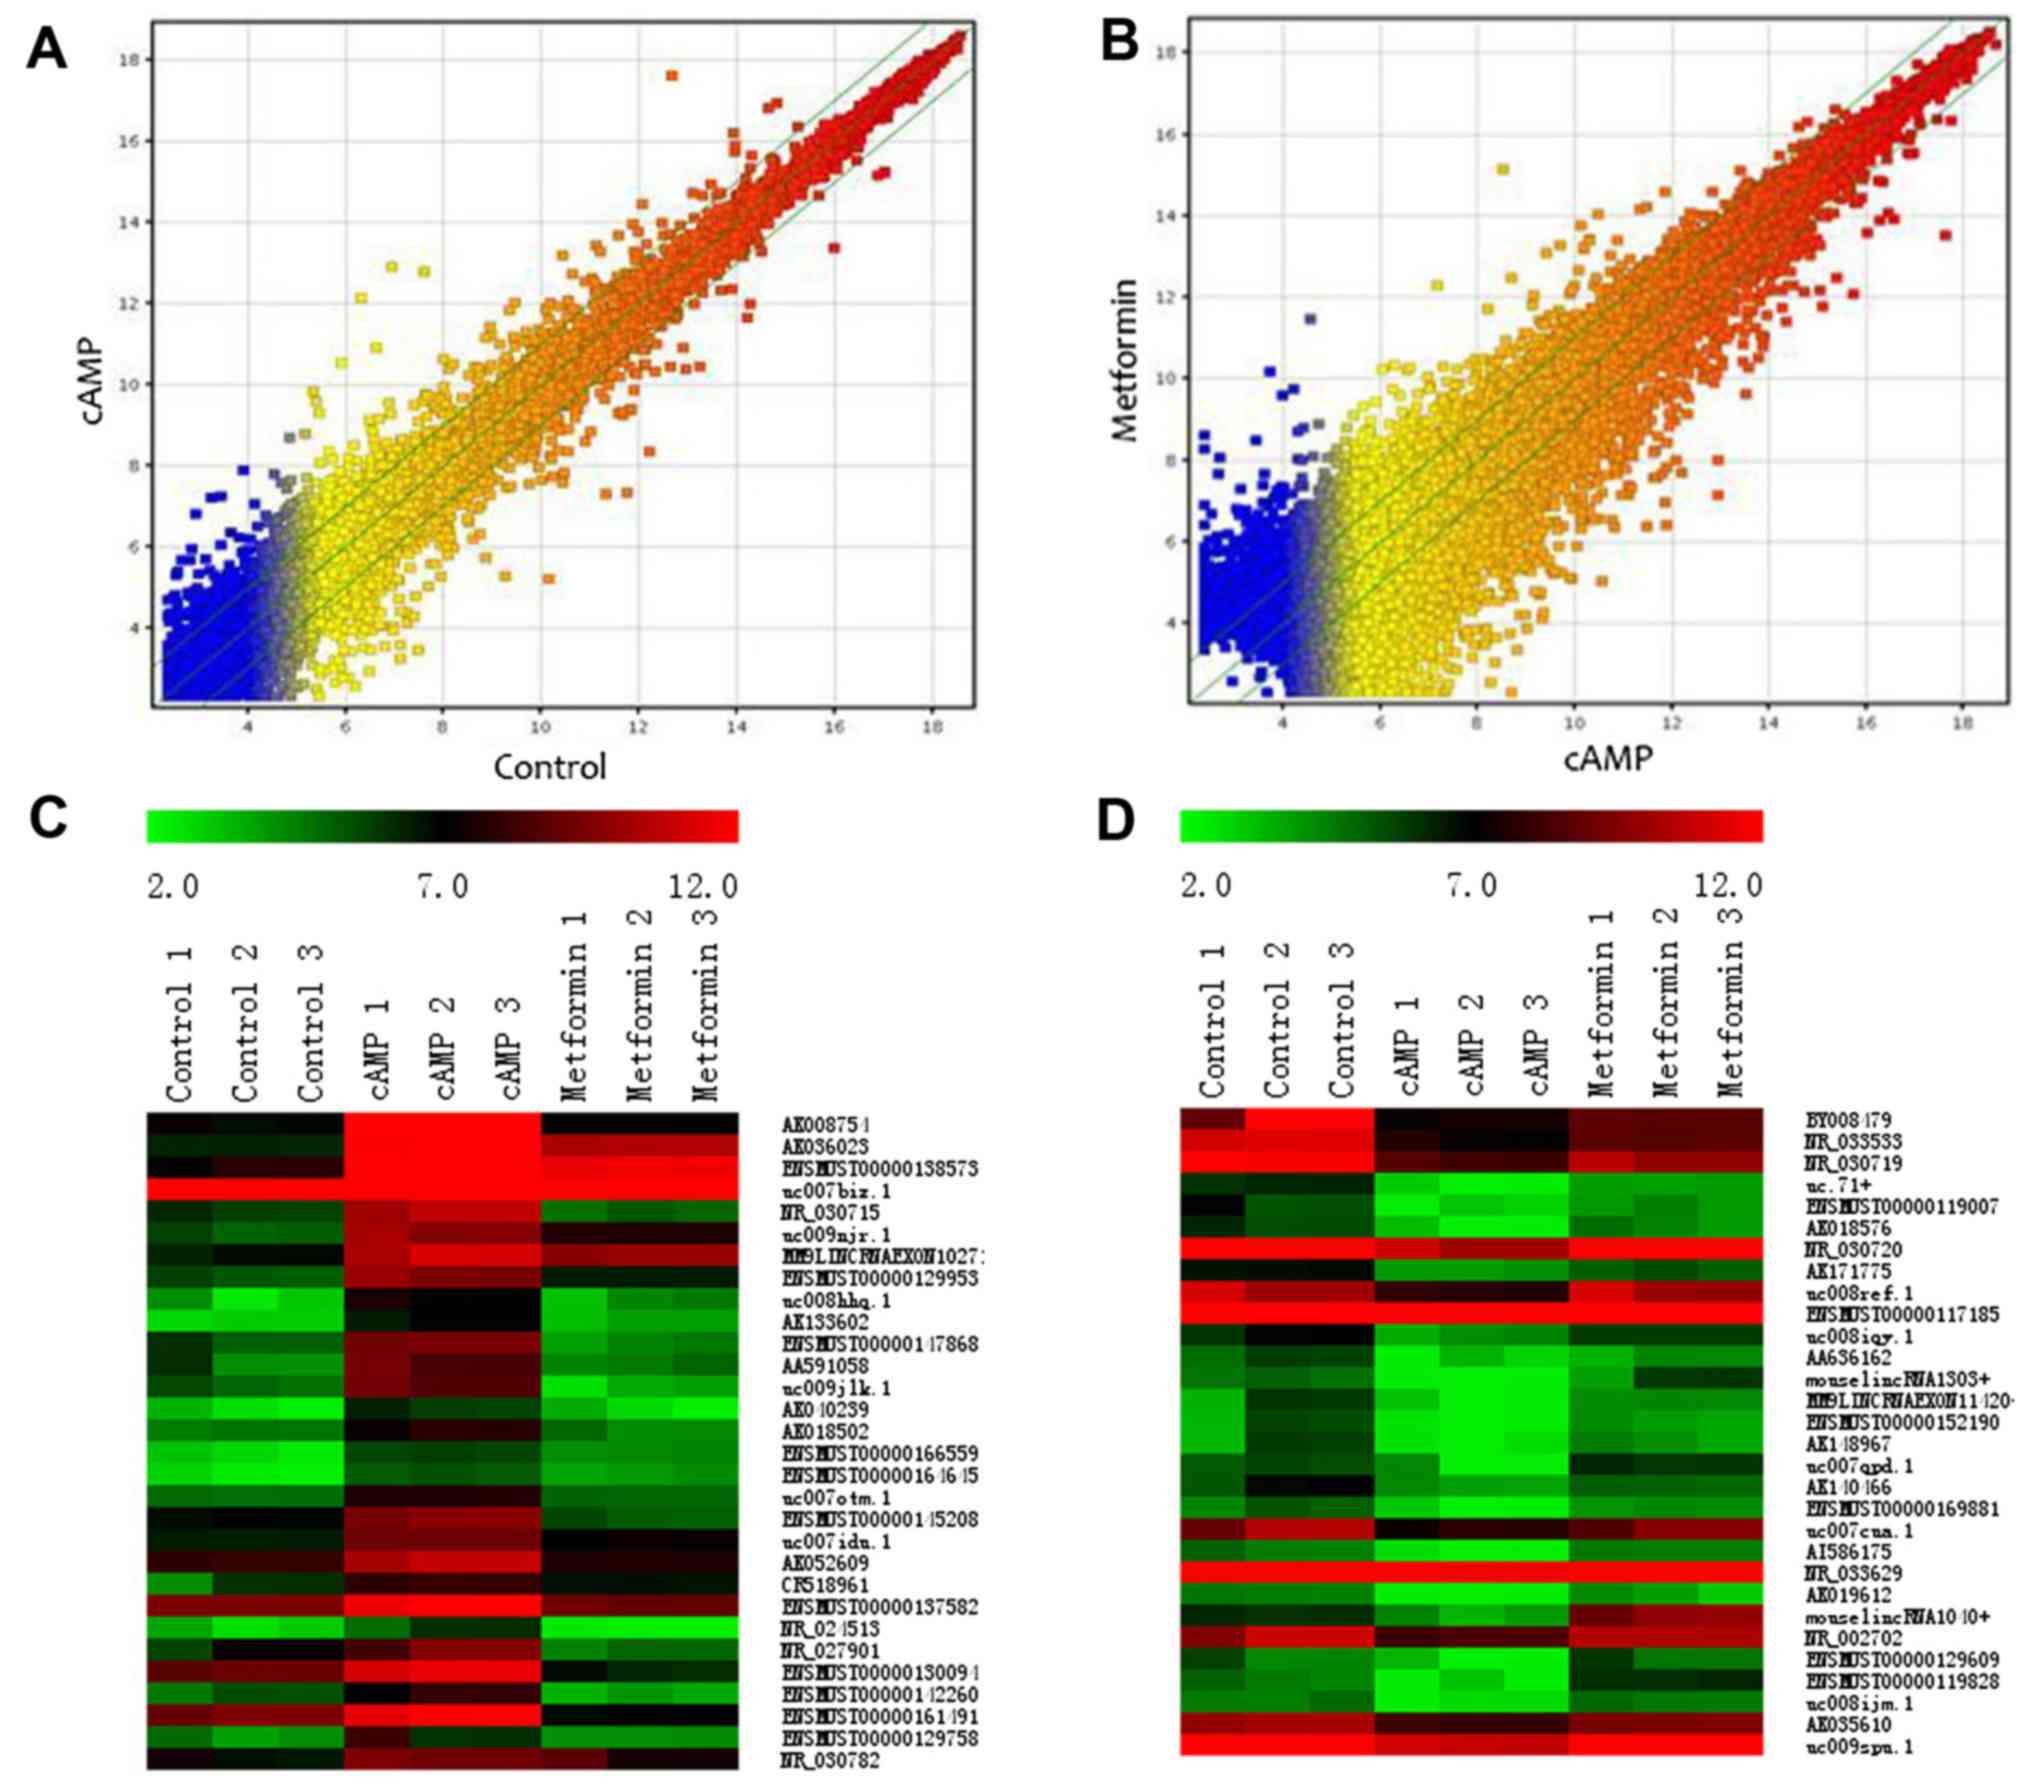
Profile of the microarray data
A total of 22,016 lncRNAs were detected in the
primary mouse hepatocytes using ArrayStar Mouse LncRNA Microarray
version 2.0. The lncRNAs represented in this microarray have been
sourced from authoritative databases, including RefSeq, UCSC
Knowngenes and Ensembls. Scatter plots were used to assess the
variation in the expression of lncRNAs between the cAMP group and
the control group (Fig. 2A) or
between the metformin group and the cAMP group (Fig. 2B). By setting a threshold for
differential expression at fold-change >2.0-fold, 865
differentially expressed lncRNAs (456 upregulated and 409
downregulated lncRNAs) were identified in the cAMP group vs. the
control group. Compared with the cAMP group, 4,580 differentially
expressed lncRNAs were identified, of which 2,114 lncRNAs were
upregulated and 2,466 lncRNAs were downregulated in the metformin
group. Among the cAMP-upregulated lncRNAs, 189 were downregulated
by metformin. Among the cAMP-downregulated lncRNAs, 167 were
upregulated by metformin. Heatmaps demonstrate the lncRNA
expression profiles of the groups, and the expression values of the
30 most strongly cAMP-upregulated and cAMP-downregulated lncRNAs
(Fig. 2C and D and Table II) reversed by metformin are
presented.
| Table IITop 30 cAMP-upregulated lncRNAs and
cAMP-downregulated lncRNAs reversed by metformin. |
Table II
Top 30 cAMP-upregulated lncRNAs and
cAMP-downregulated lncRNAs reversed by metformin.
| Seqname | Fold-change | Regulation (cAMP
vs. control) | Fold-change | Regulation
(metformin vs. cAMP) |
|---|
| AK008754 | 63.58867 | Up | 55.04594 | Down |
| AK036023 | 57.2507 | Up | 3.325115 | Down |
|
ENSMUST00000138573 | 37.43524 | Up | 2.130461 | Down |
| uc007biz.1 | 31.35165 | Up | 17.08355 | Down |
| NR_030715 | 25.00611 | Up | 45.54781 | Down |
| uc009njr.1 | 22.53223 | Up | 4.457007 | Down |
|
MM9LINCRNAEXON10271− | 19.73751 | Up | 2.071386 | Down |
|
ENSMUST00000129953 | 18.7799 | Up | 8.698158 | Down |
| uc008hhq.1 | 15.70811 | Up | 8.776502 | Down |
| AK133602 | 15.02128 | Up | 8.871666 | Down |
|
ENSMUST00000147868 | 14.96649 | Up | 32.93101 | Down |
| AA591058 | 14.75416 | Up | 16.43587 | Down |
| uc009jlk.1 | 12.59451 | Up | 43.2916 | Down |
| AK040239 | 8.804657 | Up | 8.449728 | Down |
| AK018502 | 7.718255 | Up | 8.491624 | Down |
|
ENSMUST00000166559 | 7.339848 | Up | 2.552899 | Down |
|
ENSMUST00000164645 | 6.906824 | Up | 2.483507 | Down |
| uc007otm.1 | 6.888684 | Up | 6.263191 | Down |
|
ENSMUST00000145208 | 6.529995 | Up | 19.36338 | Down |
| uc007idu.1 | 6.296531 | Up | 3.856799 | Down |
| AK052609 | 6.237578 | Up | 7.895747 | Down |
| CR518961 | 6.112049 | Up | 2.601747 | Down |
|
ENSMUST00000137582 | 6.028889 | Up | 8.330698 | Down |
| NR_024513 | 6.003099 | Up | 10.10774 | Down |
| NR_027901 | 5.708479 | Up | 20.74246 | Down |
|
ENSMUST00000130094 | 5.705397 | Up | 33.7096 | Down |
|
ENSMUST00000142260 | 5.699138 | Up | 15.27239 | Down |
|
ENSMUST00000161491 | 5.59761 | Up | 29.0643 | Down |
|
ENSMUST00000129758 | 5.463225 | Up | 5.843725 | Down |
| NR_030782 | 5.312138 | Up | 2.623824 | Down |
| BY008479 | 21.01573 | Down | 2.650546 | Up |
| NR_033533 | 15.91963 | Down | 2.650648 | Up |
| NR_030719 | 14.39216 | Down | 3.259029 | Up |
| uc.71+ | 12.23815 | Down | 2.515803 | Up |
|
ENSMUST00000119007 | 8.960969 | Down | 2.669164 | Up |
| AK018576 | 8.671295 | Down | 3.36866 | Up |
| NR_030720 | 6.8741 | Down | 4.131914 | Up |
| AK171775 | 6.527647 | Down | 2.402267 | Up |
| uc008ref.1 | 6.215065 | Down | 5.873268 | Up |
|
ENSMUST00000117185 | 6.061 | Down | 3.369349 | Up |
| uc008iqy.1 | 6.043397 | Down | 3.388012 | Up |
| AA636162 | 5.986786 | Down | 2.320948 | Up |
|
mouselincRNA1303+ | 5.755683 | Down | 7.49714 | Up |
|
MM9LINCRNAEXON11420+ | 5.640478 | Down | 3.268149 | Up |
|
ENSMUST00000152190 | 5.534303 | Down | 2.962099 | Up |
| AK148967 | 5.531486 | Down | 3.036806 | Up |
| uc007qpd.1 | 5.508539 | Down | 8.222444 | Up |
| AK140466 | 5.259056 | Down | 2.131494 | Up |
|
ENSMUST00000169881 | 5.179452 | Down | 3.134108 | Up |
| uc007cua.1 | 5.058929 | Down | 3.124969 | Up |
| AI586175 | 4.876382 | Down | 4.435117 | Up |
| NR_033629 | 4.820504 | Down | 2.005511 | Up |
| AK019612 | 4.674555 | Down | 2.644345 | Up |
|
mouselincRNA1040+ | 4.510026 | Down | 49.62078 | Up |
| NR_002702 | 4.507347 | Down | 4.266528 | Up |
|
ENSMUST00000129609 | 4.367185 | Down | 5.31341 | Up |
|
ENSMUST00000119828 | 4.262482 | Down | 11.6708 | Up |
| uc008ijm.1 | 4.213697 | Down | 4.486794 | Up |
| AK035610 | 4.009485 | Down | 2.407165 | Up |
| uc009spu.1 | 3.959393 | Down | 2.946273 | Up |
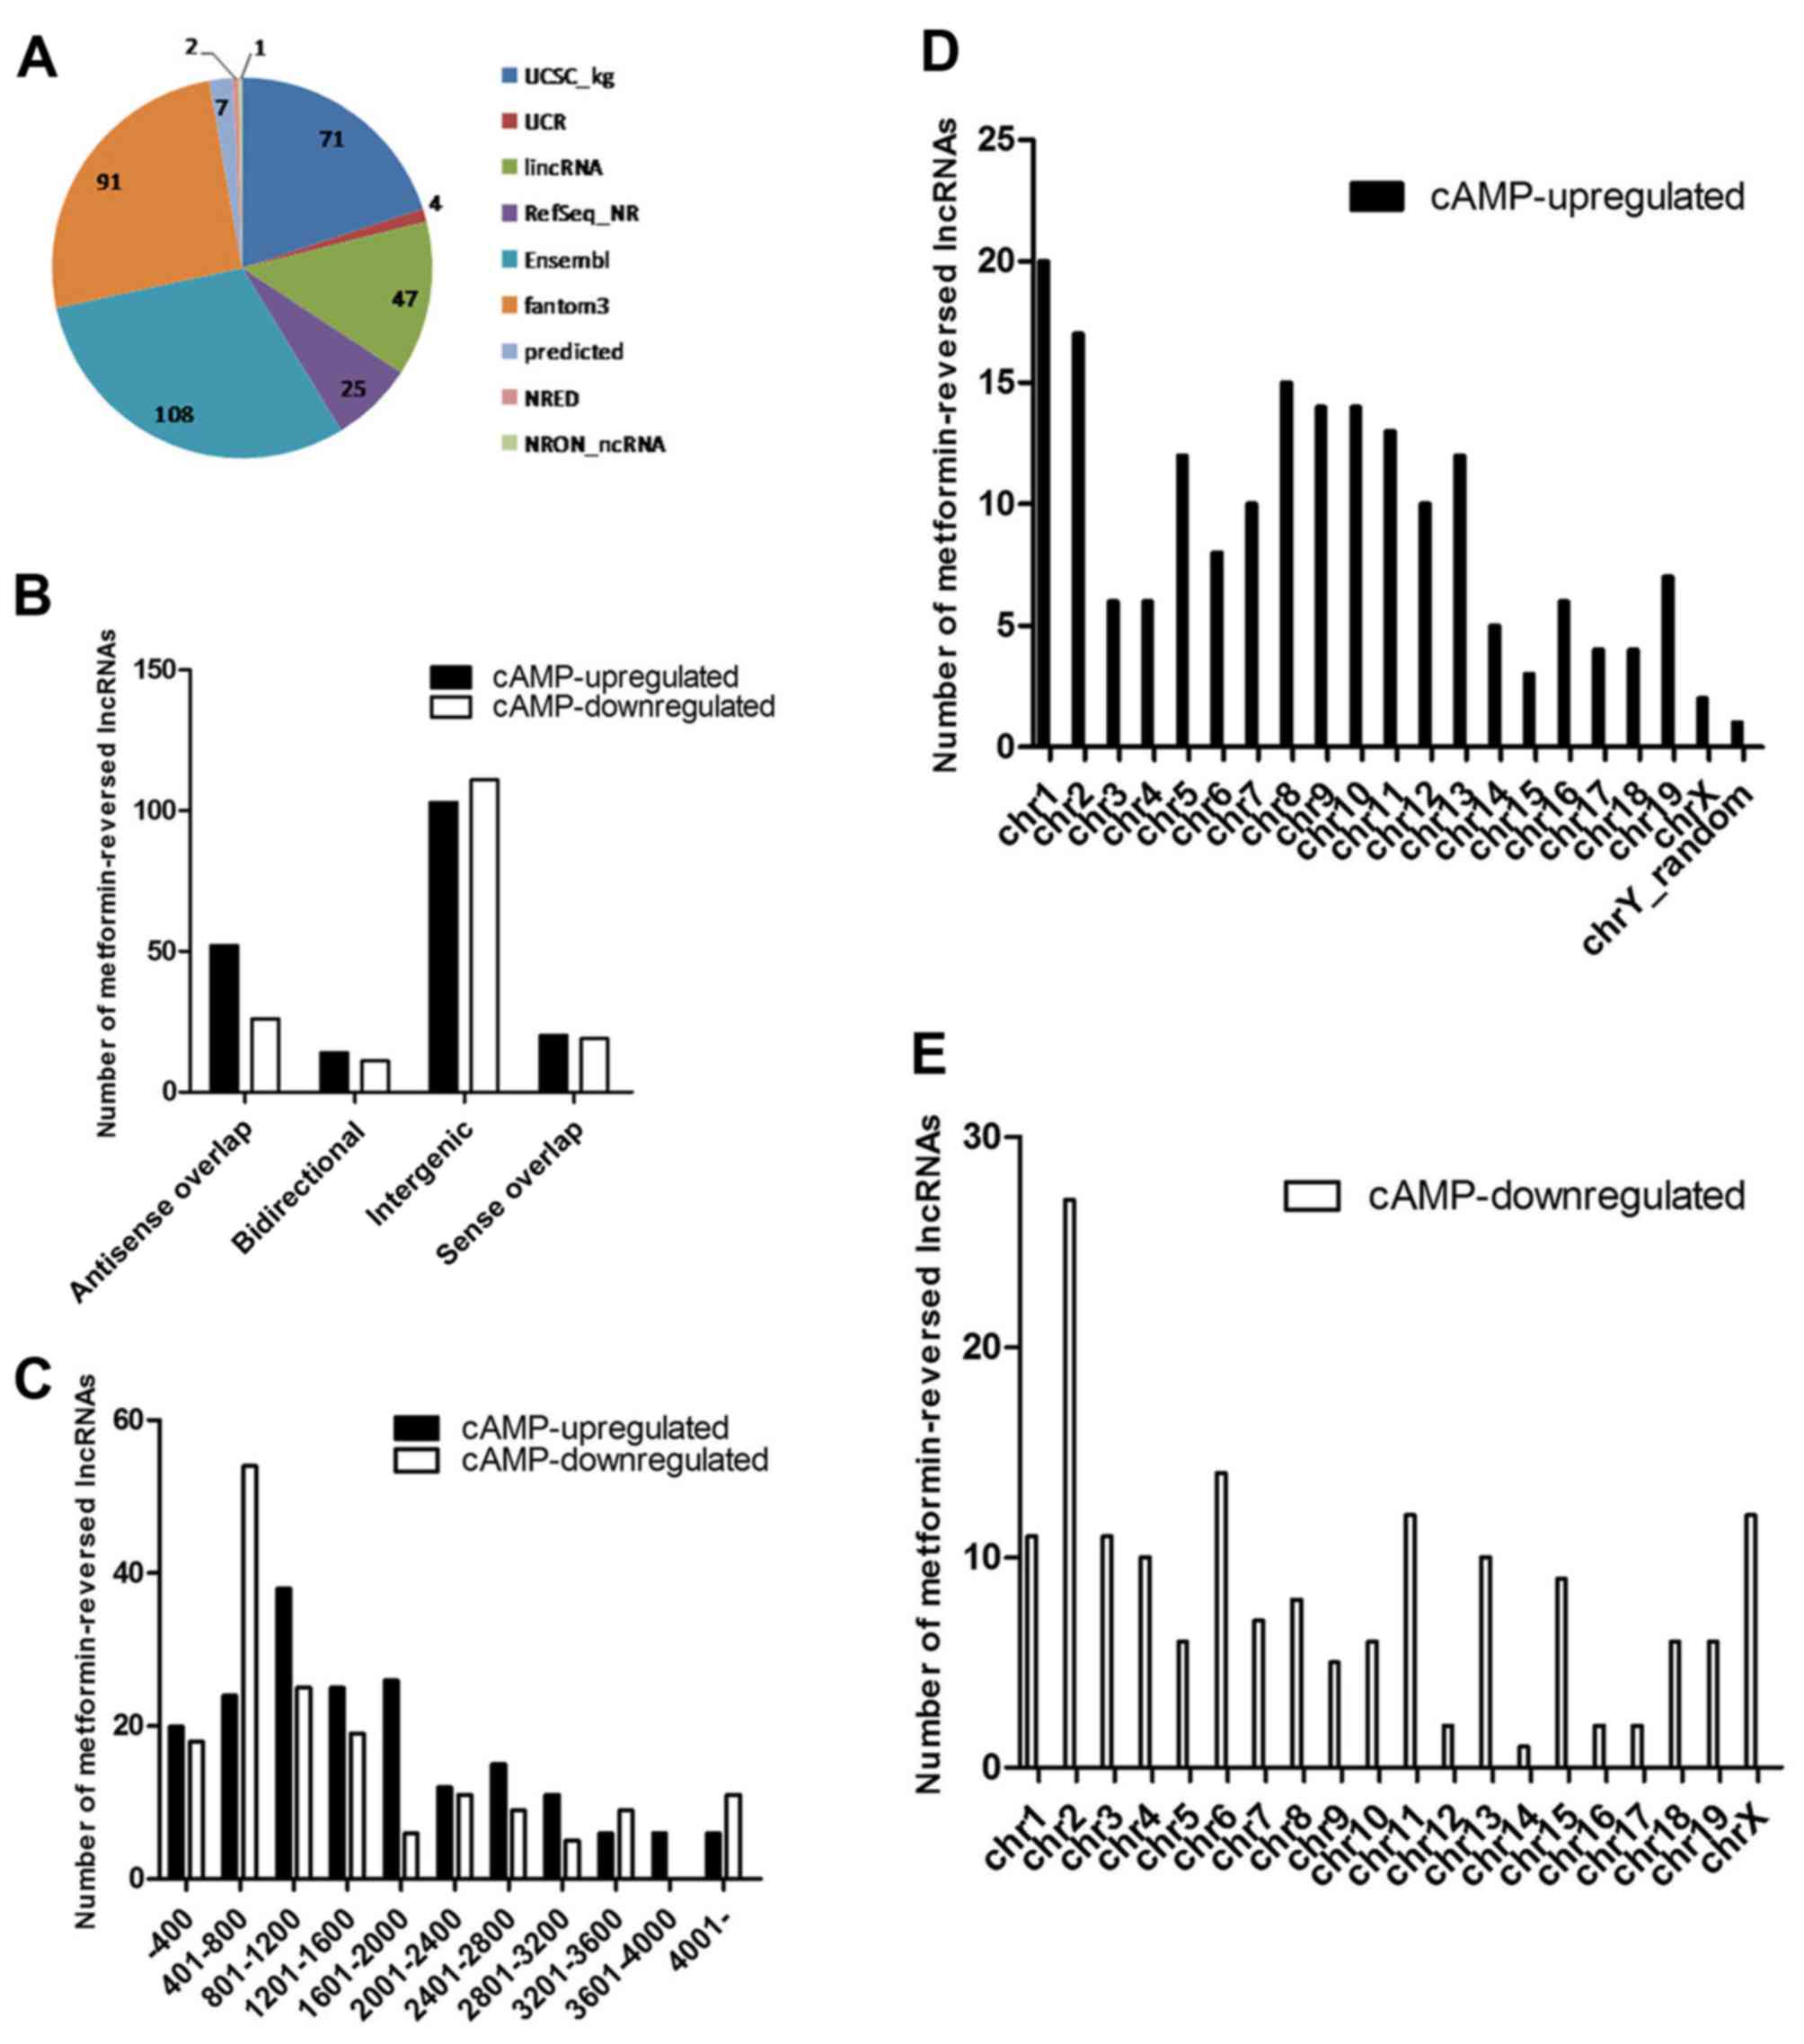
Expression signatures of
metformin-reversed lncRNAs
It is likely that these metformin-reversed lncRNAs
serve a critical role in the regulation of gluconeogenesis.
Therefore, some general signatures of these lncRNAs, such as their
sources, classification, length distribution and chromosome
distribution, were investigated. A pie chart was constructed to
show the number of metformin-reversed lncRNAs collected from
different databases (Fig. 3A).
There were 78 antisense overlap, 25 bidirectional, 214 intergenic
and 39 sense overlap lncRNAs among these lncRNAs (Fig. 3B), which were mainly between 400
and 3,600 nt in length (Fig. 3C).
Chromosome distribution analysis demonstrated that these
metformin-reversed lncRNAs were located on a number of different
chromosomes (Fig. 3D and E).
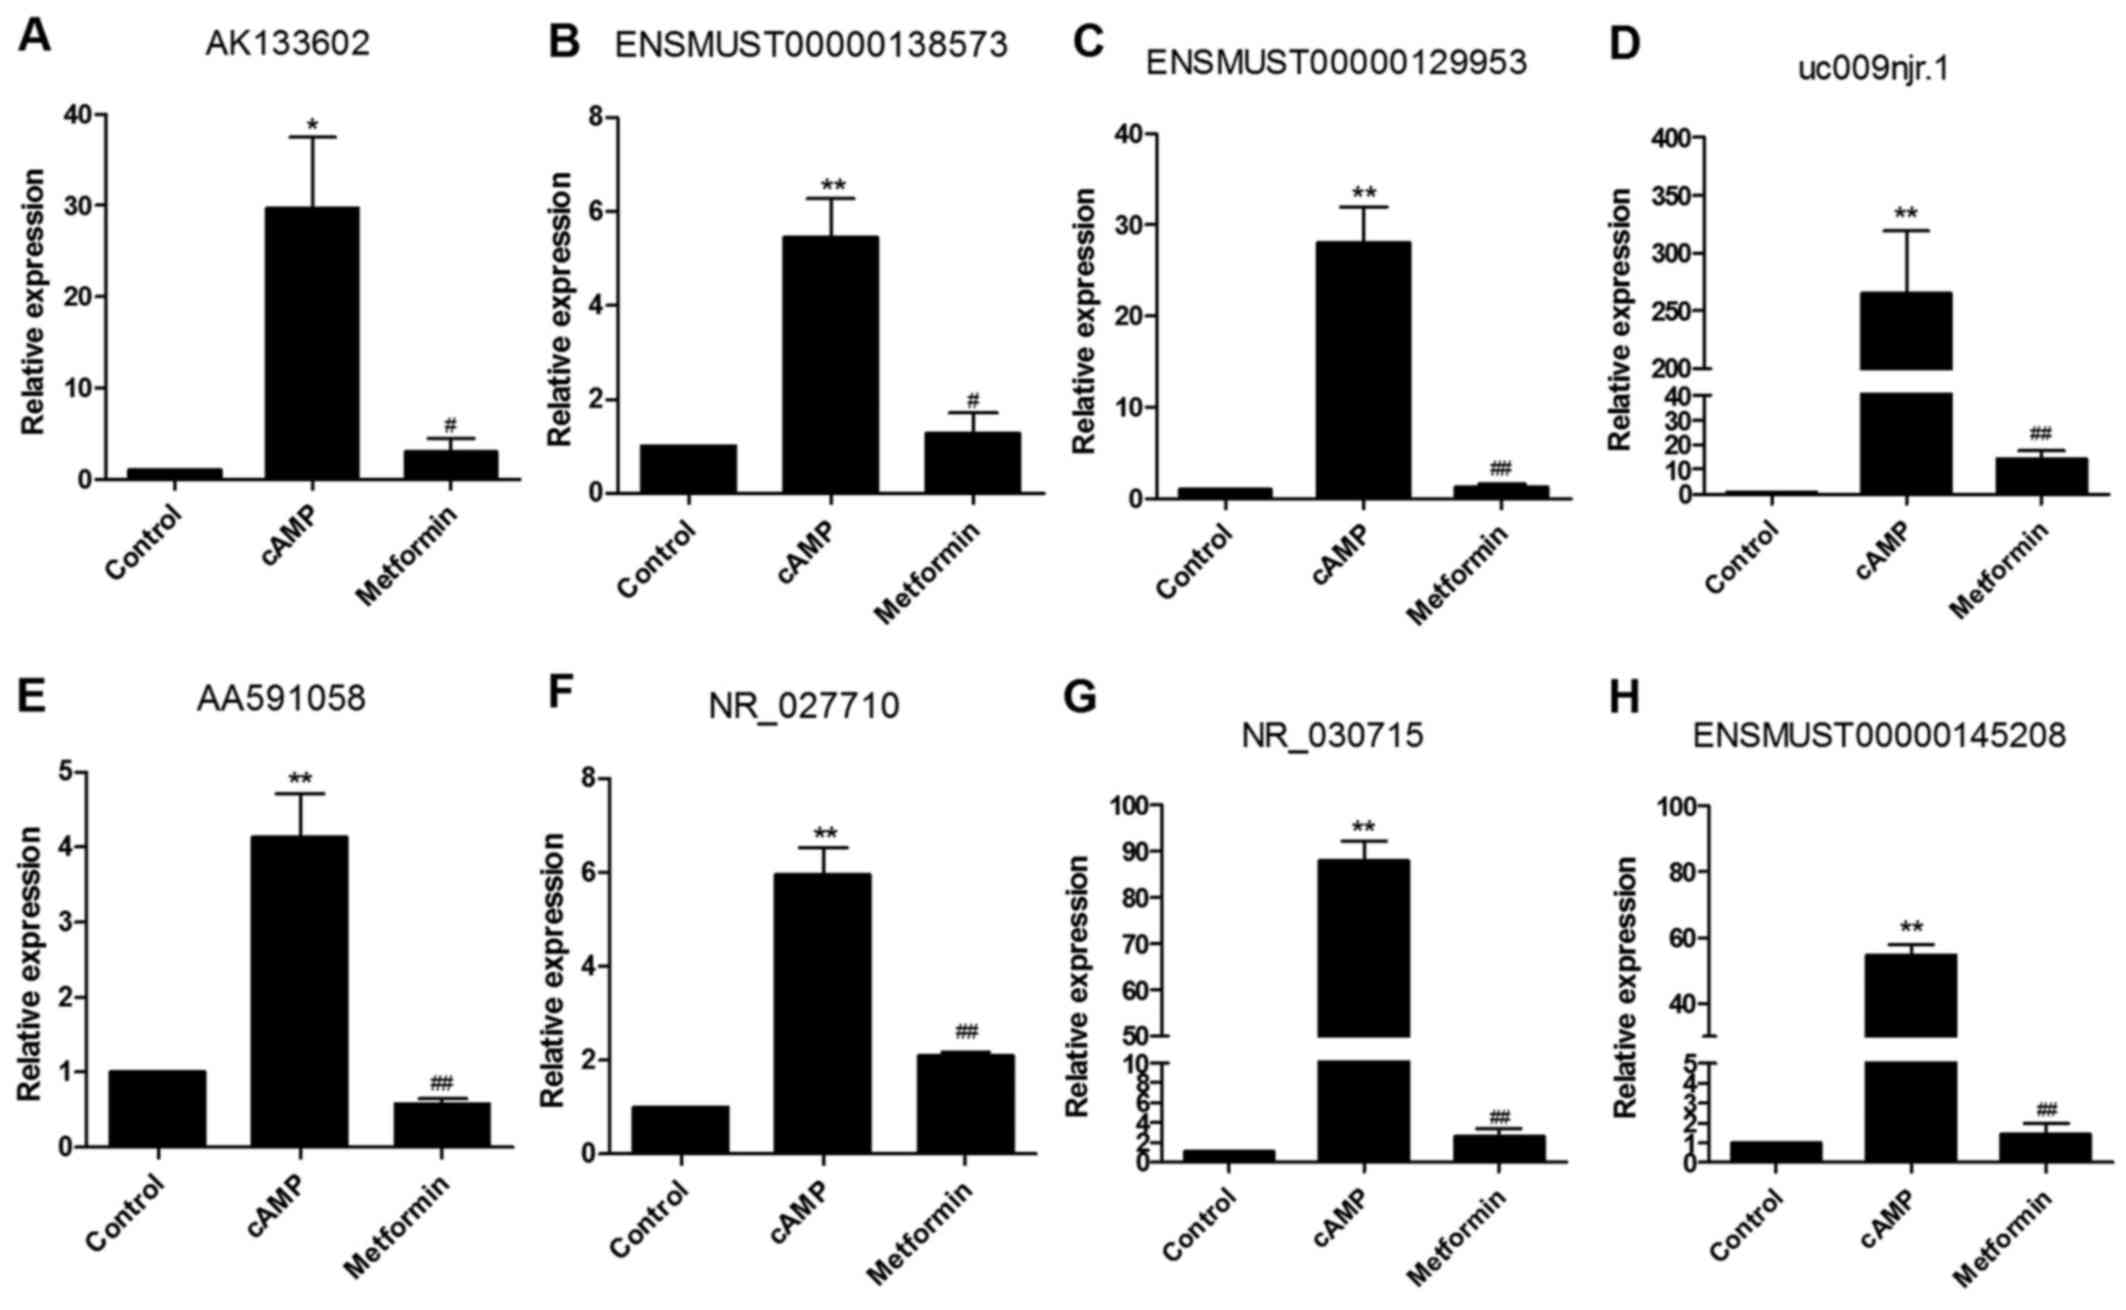
RT-qPCR validation
Among the identified metformin-reversed lncRNAs, 8
cAMP-stimulated and metformin-inhibited l ncR NAs (A K1336 02, ENSM
UST 0 0 0 0 0138573, ENSMUST00000129953, uc009njr.1, AA591058,
NR_027710, NR_030715 and ENSMUST00000145208) were selected for
analysis by RT-qPCR in order to verify the microarray data. The
expression levels of all 8 cAMP-stimulated lncRNAs were
significantly decreased in the presence of metformin as shown by
RT-qPCR (Fig. 4), consistent with
the results of the microarray analysis.
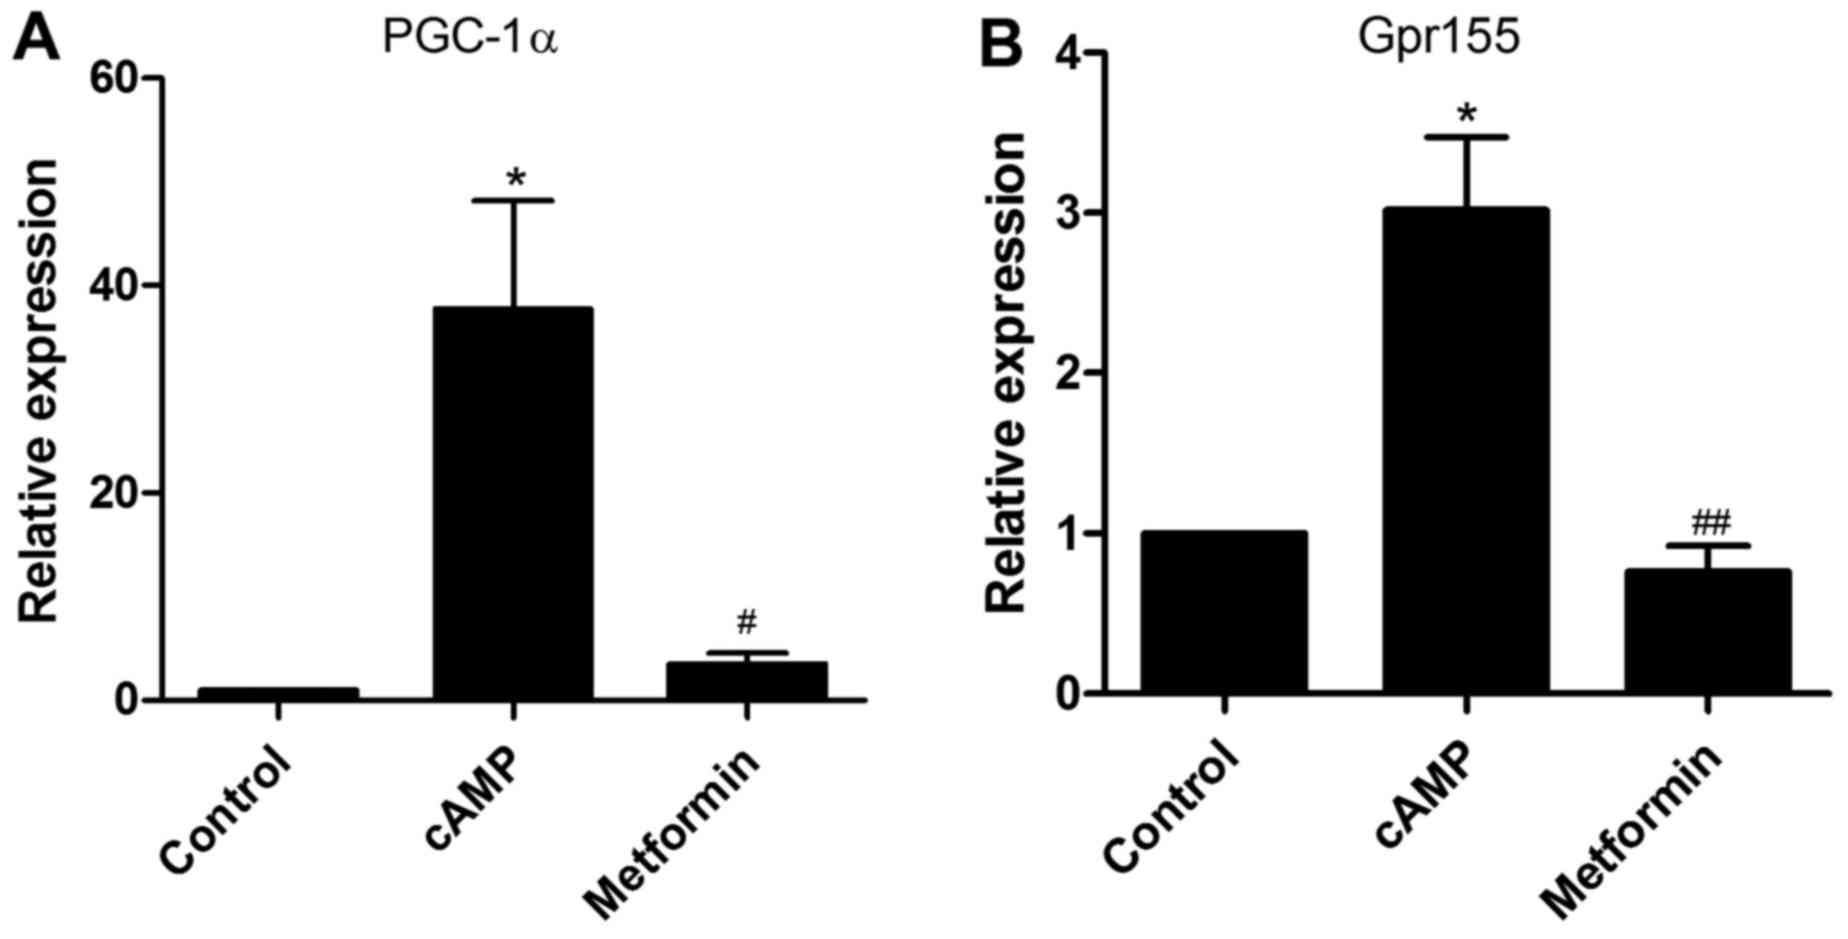
Associated coding gene expression
Ponjavic et al (18) emphasized the importance of lncRNA
and its adjacent protein-coding gene pairs when investigating the
function of lncRNAs. Therefore, using the UCSC genome browser
(http://genome.ucsc.edu/) and NONCODE database
(http://www.noncode.org), the sequences of the
eight validated lncRNAs and their associated coding genes were
obtained (data not shown). The lncRNA ENSMUST00000138573 is a
614-nt antisense overlapping lncRNA associated with the G
protein-coupled receptor 155 (Gpr155) gene. LncRNA NR_027710 is a
sense overlapping lncRNA, which is located near the PGC-1α gene.
Notably, RT-qPCR analysis demonstrated that Gpr155 and PGC-1α
displayed a similar expression pattern to their associated lncRNAs
under the same treatment conditions (Fig. 5A and B). Therefore, it is possible
that the two lncRNAs modulate gluconeogenesis through their
associated protein-coding genes.
Discussion
Excessive glucose output via gluconeogenesis is a
critical pathological factor contributing to hyperglycemia in type
2 diabetes mellitus, during which the liver synthesizes glucose
from non-carbohydrate precursors, including pyruvate and lactate
(19,20). Under the fasting state, increased
pancreatic hormone glucagon interacts with the glucagon receptor
and activates adenylate cyclase, thus leading to an elevation of
intracellular cAMP (10).
Elevated cAMP then triggers gluconeogenesis via activation of the
transcriptional factor cAMP-response element binding protein (CREB)
(10, 21). It is well known that the activity
of the gluconeogenic pathway is controlled by the gene expression
of several key enzymes, including PEPCK. A large body of evidence
from animal studies and diabetic patients has demonstrated that
metformin lowers blood glucose levels by inhibiting gluconeogenesis
(12–14). The present research team have also
observed that metformin decreases glucose production in primary
mouse hepatocytes (data not shown). In the present study,
cAMP-induced PEPCK mRNA expression was demonstrated to be
suppressed by metformin, consistent with previous studies (13,14).
lncRNAs were initially considered to be
transcriptional 'noise' of the mammalian genome; however, there is
considerable evidence that lncRNAs serve key roles in various
biological processes via the regulation of gene expression at the
level of chromatin remodeling, transcriptional control and
post-transcriptional processing (22). LncRNAs have also been implicated
in numerous human diseases, including Alzheimer's disease (23), cardiovascular diseases (24), diabetes (25) and various cancers (26). There are many studies
demonstrating that lncRNAs are involved in the differentiation and
homeostasis of metabolic tissues, including islets, skeletal muscle
and adipose tissues, as summarized in a recent review (27). Particularly in islets, there is
growing evidence that lncRNAs are involved in the determination of
β-cell identity and participate in the misregulation of gene
expression during type 2 diabetes (7,28).
However, to the best of our knowledge, the effect of lncRNA on
hepatic gluconeogenesis has not been elucidated. In the present
study, a hepatocyte model with cAMP and metformin treatment was
used to better understand the potential role of lncRNAs in the
hepatic gluconeogenesis process.
Using microarray analysis, 865 and 4,580
differentially expressed lncRNAs were identified in the cAMP group
vs. the control group and the metformin group vs. the cAMP group,
respectively. Among the cAMP-regulated lncRNAs, 356 were reversed
by metformin treatment, and the expression of 189 AMP-upregulated
lncRNAs was decreased by metformin. Previous studies have
demonstrated that metformin suppresses the cAMP-stimulated
expression of genes involved in gluconeogenesis (14,29). By analyzing the expression
signatures of the metformin-reversed lncRNAs, it was found that the
majority were long intergenic noncoding RNAs. Therefore, it is
possible that these lncRNAs regulate the expression of neighbouring
protein-coding genes. A set of 8 cAMP-upregulated and
metformin-downregulated lncRNAs was selected with which to validate
the results of the micro-array using RT-qPCR. The results suggest
that metformin may decrease gluconeogenesis by globally altering
hepatic lncRNA expression.
Although the precise roles of these lncRNAs in
gluconeogenesis remain unknown, lncRNAs have been demonstrated to
regulate neighbouring gene expression through cis- and
trans-mechanisms (5). Notably, a
strong co-expression of lncRNA NR_027710 and PGC-1α was validated
by the RT-qPCR analysis in the present study, as shown in Figs. 4F and 5A. This implies a potential role of
NR_027710 in the regulation of PGC-1α expression. Hormonal
signaling regulates hepatic gluconeogenesis by triggering a cascade
of transcriptional events involving various transcriptional
activators and coactivators, including PGC-1α, CREB and transducer
of regulated CREB activity 2 (30–32). LncRNA NR_027710 has been found to
be transcribed from the natural-sense strand of the gene PGC-1α,
which encodes the transcriptional coactivator PGC-1α. Herzig et
al (30) demonstrated that
PGC-1α is induced by CREB to trigger the expression of
gluconeogenic genes. The results of the present study and previous
studies (14,17) demonstrated that 8-br-cAMP caused a
significant increase in the PGC-1α transcript, which was suppressed
by metformin. According to the bioinformatic analysis,
ENSMUST00000138573, a 614-nt lncRNA exhibits a natural antisense
association with the coding gene Gpr155 in chromosome 2. In the
present study, the expression level of Gpr155 displayed a similar
pattern of change to that of lncRNA ENSMUST00000138573. Kobayashi
et al (33) revealed that
Gpr155 was one of four candidate genes for type 2 diabetes by
performing exome sequencing analysis. It has been shown that
lncRNAs act as transcriptional cofactors to modulate the
transcription of adjacent protein coding genes (34), which suggests that lncRNA
NR_027710 and lncRNA ENSMUST00000138573 may affect the expression
of PGC-1α and Gpr155 through an unknown mechanism. These two
lncRNA-mRNA gene pairs highlight the importance of lncRNAs in the
modulation of glucose homeostasis.
In conclusion, to the best of our knowledge, the
present study is the first to reveal the role of lncRNA in
gluconeogenesis by conducting a global microarray analysis. It is
likely that metformin inhibits hepatic gluconeogenesis by
regulating lncRNA expression. In addition, two lncRNAs NR_027710
and ENSMUST00000138573 are associated with PGC-1α and Gpr155,
respectively. The two pairs of lncRNAs and coding protein genes
exhibit a similar expression pattern, suggesting that lncRNAs may
exert their functions through interactions with coding transcripts
and proteins in gluconeogenesis. The present study provides a new
perspective for understanding the glucose-lowering mechanism of
metformin. However, the exact regulatory mechanisms of the specific
lncRNAs involved in gluconeogenesis require further investigation,
potentially via loss and gain of function studies.
Acknowledgments
The present study was funded by grants from the
National Natural Science Foundation of China (grant nos. 81170720,
81270910, 81370876 and 81471030).
Glossary
Abbreviations
Abbreviations:
|
lncRNA
|
long non-coding RNA
|
|
cAMP
|
cyclic adenosine monophosphate
|
|
PGC-1α
|
peroxisome proliferator-activated
receptor-γ coactivator-1α
|
|
Gpr155
|
G protein-coupled receptor 155
|
|
8-br-cAMP
|
8-bromoadenosine 3′,5′-cyclic
monophosphate
|
|
RT-qPCR
|
reverse transcription-quantitative
polymerase chain reaction
|
|
PEPCK
|
phosphoenolpyruvate carboxykinase
|
|
CREB
|
cAMP-response element binding
protein
|
References
|
1
|
Ning G: Decade in review-type 2 diabetes
mellitus: At the centre of things. Nat Rev Endocrinol. 11:636–638.
2015. View Article : Google Scholar : PubMed/NCBI
|
|
2
|
Kitamura Y and Accili D: New insights into
the integrated physiology of insulin action. Rev Endocr Metab
Disord. 5:143–149. 2004. View Article : Google Scholar : PubMed/NCBI
|
|
3
|
Accili D: Lilly lecture 2003: The struggle
for mastery in insulin action: From triumvirate to republic.
Diabetes. 53:1633–1642. 2004. View Article : Google Scholar : PubMed/NCBI
|
|
4
|
Mercer TR, Dinger ME and Mattick JS: Long
non-coding RNAs: Insights into functions. Nat Rev Genet.
10:155–159. 2009. View
Article : Google Scholar : PubMed/NCBI
|
|
5
|
Guttman M and Rinn JL: Modular regulatory
principles of large non-coding RNAs. Nature. 482:339–346. 2012.
View Article : Google Scholar : PubMed/NCBI
|
|
6
|
Wang KC and Chang HY: Molecular mechanisms
of long noncoding RNAs. Mol Cell. 43:904–914. 2011. View Article : Google Scholar : PubMed/NCBI
|
|
7
|
Morán I, Akerman I, van de Bunt M, Xie R,
Benazra M, Nammo T, Arnes L, Nakić N, García-Hurtado J,
Rodríguez-Seguí S, et al: Human β cell transcriptome analysis
uncovers lncRNAs that are tissue-specific, dynamically regulated,
and abnormally expressed in type 2 diabetes. Cell Metab.
16:435–448. 2012. View Article : Google Scholar
|
|
8
|
Sun L, Goff LA, Trapnell C, Alexander R,
Lo KA, Hacisuleyman E, Sauvageau M, Tazon-Vega B, Kelley DR,
Hendrickson DG, et al: Long noncoding RNAs regulate adipogenesis.
Proc Natl Acad Sci USA. 110:3387–3392. 2013. View Article : Google Scholar : PubMed/NCBI
|
|
9
|
Gao Y, Wu F, Zhou J, Yan L, Jurczak MJ,
Lee HY, Yang L, Mueller M, Zhou XB, Dandolo L, et al: The H19/let-7
double-negative feedback loop contributes to glucose metabolism in
muscle cells. Nucleic Acids Res. 42:13799–13811. 2014. View Article : Google Scholar : PubMed/NCBI
|
|
10
|
Pilkis SJ, el-Maghrabi MR and Claus TH:
Hormonal regulation of hepatic gluconeogenesis and glycolysis. Annu
Rev Biochem. 57:755–783. 1988. View Article : Google Scholar : PubMed/NCBI
|
|
11
|
Chan JC, Deerochanawong C, Shera AS, Yoon
KH, Adam JM, Ta VB, Chan SP, Fernando RE, Horn LC, Nguyen TK, et
al: Role of metformin in the initiation of pharmacotherapy for type
2 diabetes: An Asian-Pacific perspective. Diabetes Res Clin Pract.
75:255–266. 2007. View Article : Google Scholar
|
|
12
|
Inzucchi SE, Maggs DG, Spollett GR, Page
SL, Rife FS, Walton V and Shulman GI: Efficacy and metabolic
effects of metformin and troglitazone in type II diabetes mellitus.
N Engl J Med. 338:867–872. 1998. View Article : Google Scholar : PubMed/NCBI
|
|
13
|
Shaw RJ, Lamia KA, Vasquez D, Koo SH,
Bardeesy N, Depinho RA, Montminy M and Cantley LC: The kinase LKB1
mediates glucose homeostasis in liver and therapeutic effects of
metformin. Science. 310:1642–1646. 2005. View Article : Google Scholar : PubMed/NCBI
|
|
14
|
Foretz M, Hébrard S, Leclerc J,
Zarrinpashneh E, Soty M, Mithieux G, Sakamoto K, Andreelli F and
Viollet B: Metformin inhibits hepatic gluconeogenesis in mice
independently of the LKB1/AMPK pathway via a decrease in hepatic
energy state. J Clin Invest. 120:2355–2369. 2010. View Article : Google Scholar : PubMed/NCBI
|
|
15
|
Madiraju AK, Erion DM, Rahimi Y, Zhang XM,
Braddock DT, Albright RA, Prigaro BJ, Wood JL, Bhanot S, MacDonald
MJ, et al: Metformin suppresses gluconeogenesis by inhibiting
mitochondrial glycerophosphate dehydrogenase. Nature. 510:542–546.
2014. View Article : Google Scholar : PubMed/NCBI
|
|
16
|
Livak KJ and Schmittgen TD: Analysis of
relative gene expression data using real-time quantitative PCR and
the 2-ΔΔCT method. Methods. 25:402–408. 2001. View Article : Google Scholar
|
|
17
|
Yoon JC, Puigserver P, Chen G, Donovan J,
Wu Z, Rhee J, Adelmant G, Stafford J, Kahn CR, Granner DK, et al:
Control of hepatic gluconeogenesis through the transcriptional
coactivator PGC-1. Nature. 413:131–138. 2001. View Article : Google Scholar : PubMed/NCBI
|
|
18
|
Ponjavic J, Oliver PL, Lunter G and
Ponting CP: Genomic and transcriptional co-localization of
protein-coding and long non-coding RNA pairs in the developing
brain. PLoS Genet. 5:e10006172009. View Article : Google Scholar : PubMed/NCBI
|
|
19
|
Nordlie RC, Foster JD and Lange AJ:
Regulation of glucose production by the liver. Annu Rev Nutr.
19:379–406. 1999. View Article : Google Scholar : PubMed/NCBI
|
|
20
|
Pilkis SJ and Granner DK: Molecular
physiology of the regulation of hepatic gluconeogenesis and
glycolysis. Annu Rev Physiol. 54:885–909. 1992. View Article : Google Scholar : PubMed/NCBI
|
|
21
|
Gonzalez GA and Montminy MR: Cyclic AMP
stimulates somatostatin gene transcription by phosphorylation of
CREB at serine 133. Cell. 59:675–680. 1989. View Article : Google Scholar : PubMed/NCBI
|
|
22
|
Lee JT and Bartolomei MS: X-inactivation,
imprinting, and long noncoding RNAs in health and disease. Cell.
152:1308–1323. 2013. View Article : Google Scholar : PubMed/NCBI
|
|
23
|
Faghihi MA, Modarresi F, Khalil AM, Wood
DE, Sahagan BG, Morgan TE, Finch CE, St Laurent G III, Kenny PJ and
Wahlestedt C: Expression of a noncoding RNA is elevated in
Alzheimer's disease and drives rapid feed-forward regulation of
beta-secretase. Nat Med. 14:723–730. 2008. View Article : Google Scholar : PubMed/NCBI
|
|
24
|
Archer K, Broskova Z, Bayoumi AS, Teoh JP,
Davila A, Tang Y, Su H and Kim IM: Long non-coding RNAs as master
regulators in cardiovascular diseases. Int J Mol Sci.
16:23651–23667. 2015. View Article : Google Scholar : PubMed/NCBI
|
|
25
|
Ding GL, Wang FF, Shu J, Tian S, Jiang Y,
Zhang D, Wang N, Luo Q, Zhang Y, Jin F, et al: Transgenerational
glucose intolerance with Igf2/H19 epigenetic alterations in mouse
islet induced by intrauterine hyperglycemia. Diabetes.
61:1133–1142. 2012. View Article : Google Scholar : PubMed/NCBI
|
|
26
|
Yang G, Lu X and Yuan L: LncRNA: A link
between RNA and cancer. Biochim Biophys Acta. 1839:1097–1109. 2014.
View Article : Google Scholar : PubMed/NCBI
|
|
27
|
Zhao XY and Lin JD: Long noncoding RNAs: A
new regulatory code in metabolic control. Trends Biochem Sci.
40:586–596. 2015. View Article : Google Scholar : PubMed/NCBI
|
|
28
|
Fadista J, Vikman P, Laakso EO, Mollet IG,
Esguerra JL, Taneera J, Storm P, Osmark P, Ladenvall C, Prasad RB,
et al: Global genomic and transcriptomic analysis of human
pancreatic islets reveals novel genes influencing glucose
metabolism. Proc Natl Acad Sci USA. 111:13924–13929. 2014.
View Article : Google Scholar : PubMed/NCBI
|
|
29
|
Cao J, Meng S, Chang E, Beckwith-Fickas K,
Xiong L, Cole RN, Radovick S, Wondisford FE and He L: Low
concentrations of metformin suppress glucose production in
hepatocytes through AMP-activated protein kinase (AMPK). J Biol
Chem. 289:20435–20446. 2014. View Article : Google Scholar : PubMed/NCBI
|
|
30
|
Herzig S, Long F, Jhala US, Hedrick S,
Quinn R, Bauer A, Rudolph D, Schutz G, Yoon C, Puigserver P, et al:
CREB regulates hepatic gluconeogenesis through the coactivator
PGC-1. Nature. 413:179–183. 2001. View
Article : Google Scholar : PubMed/NCBI
|
|
31
|
Puigserver P, Rhee J, Donovan J, Walkey
CJ, Yoon JC, Oriente F, Kitamura Y, Altomonte J, Dong H, Accili D,
et al: Insulin-regulated hepatic gluconeogenesis through
FOXO1-PGC-1alpha interaction. Nature. 423:550–555. 2003. View Article : Google Scholar : PubMed/NCBI
|
|
32
|
Koo SH, Flechner L, Qi L, Zhang X,
Screaton RA, Jeffries S, Hedrick S, Xu W, Boussouar F, Brindle P,
et al: The CREB coactivator TORC2 is a key regulator of fasting
glucose metabolism. Nature. 437:1109–1111. 2005. View Article : Google Scholar : PubMed/NCBI
|
|
33
|
Kobayashi M, Ohno T, Ihara K, Murai A,
Kumazawa M, Hoshino H, Iwanaga K, Iwai H, Hamana Y, Ito M, et al:
Searching for genomic region of high-fat diet-induced type 2
diabetes in mouse chromosome 2 by analysis of congenic strains.
PLoS One. 9:e962712014. View Article : Google Scholar : PubMed/NCBI
|
|
34
|
Feng J, Bi C, Clark BS, Mady R, Shah P and
Kohtz JD: The Evf-2 noncoding RNA is transcribed from the Dlx-5/6
ultraconserved region and functions as a Dlx-2 transcriptional
coactivator. Genes Dev. 20:1470–1484. 2006. View Article : Google Scholar : PubMed/NCBI
|