Introduction
An increasing number of individuals are being
diagnosed with diabetes, particularly type 2 diabetes (T2D)
(1). In addition to genetic
factors, environmental factors contribute to the occurrence of T2D.
In human and animal experiments, a negative association between
intrauterine nutrition and metabolic disease risk has been
observed. Hales et al reported a U-shaped relationship
between birth weight and glucose intolerance at 64 years of age
(2). Furthermore, low-birth
weight subjects exhibited increased plasma levels of proinsulin,
which is an indication of islet β cell dysfunction. Based on these
findings, Hales and Barker proposed the 'thrifty phenotype
hypothesis', which addresses the important role of poor nutrition
in early life on permanent changes in glucose-insulin metabolism,
to explain this relationship (3).
Chromium (Cr) is an essential glucose regulator
(4,5). The normal human range of blood Cr is
0.12–0.67 μg/l (6).
However, total body Cr concentrations decrease by 25–40% with age.
Subjects with Cr deficiency have increased blood glucose and
insulin levels (7). In addition,
the tissue Cr levels of patients with diabetes are lower compared
with in normal control subjects, and a correlation exists between
low serum Cr levels and the occurrence of T2D (8).
A previous study demonstrated that maternal Cr
deficiency leads to insulin resistance (IR) and impaired glucose
tolerance in WNIN rat offspring. The underlying mechanism involves
increased oxidative stress (9).
In addition, the molecular mechanisms underlying fetal programming
may be partly associated with epigenetic regulation of the
expression of key genes (10).
Our recent research indicates that maternal chromium restriction
leads the miRNA dysfunction involved with MAPK signaling pathway in
the adipose of female offspring (11).
MicroRNAs (miRNA/miRs) are associated with important
epigenetic mechanisms. miRNAs are short noncoding RNA molecules
that bind to target genes to regulate various cellular processes.
Increasing research has suggested that miRNAs are involved in the
incidence and development of diabetes. miR-125a is upregulated in
Goto-Kakizaki (GK) rats (T2D rat model) compared with in normal
rats (12), and may lead to IR.
In addition, increased miR-143 has been detected in the livers of
diabetic rats (13); miR-143
downregulates oxysterol-binding protein-related protein 8 and
subsequently impairs the ability of insulin to induce the
activation of protein kinase B (AKT) signaling, a central node of
insulin action to induce glucose metabolism. Upregulation of
miR-181a in diabetic livers and hepatocytes decreases sirtuin 1
expression, thus inactivating insulin signaling and glucose
metabolism (14). Furthermore,
miR-96 and miR-126 directly target the insulin receptor substrate 1
(IRS1) 3′-untranslated region; a reduction in IRS1 is involved in
IR under mitochondrial dysfunction in hepatocytes (15,16). Downregulation of miR-200 also
impairs AKT/glycogen synthase kinase-mediated glycogenesis in the
liver, resulting in hepatic IR (17).
The present study hypothesized that an association
exists between maternal low Cr (LC) status and epigenetic
reprogramming of the transcriptome by means of miRNA in offspring.
To test this hypothesis, a whole miRNA expression array was
performed in mice exposed to maternal Cr restriction.
Materials and methods
Animals and protocol
All procedures were performed in strict accordance
with the recommendations of the Guide for the Care and Use of
Laboratory Animals of the National Institute of Health (18). The present study was approved by
the Animal Care Committee of the Peking Union Medical Hospital
(Beijing, China; permit no. MC-07-6004), and all efforts were made
to minimize suffering. Female (n=20) and male (n=10) C57BL mice
(age, 7 weeks; weight, 18.7±1.8 g) were purchased from the
Institute of Laboratory Animal Science, Chinese Academy of Medical
Sciences and Peking Union Medical College (Beijing, China;
SCXK-2013-0107). All mice were maintained in ventilated individual
cages at 24±1°C and had access to food and water ad libitum;
lights were switched on between 6 a.m. and 6 p.m.. Mating was
confirmed by the presence of sperm in a vaginal smear the following
morning. Pregnant females (n=16) were randomly divided into two
groups: Control group (CON, fed a standard rodent casein-based diet
based on the American Institute of Nutrition AIN-93G diet) and LC
diet group (fed a LC diet, which lacked only in Cr) (n=8/group;
Table I). The diet protocol was
maintained throughout the gestation and lactation periods. The
concentration of Cr in the CON and LC diets was 1.19 and 0.14 mg
Cr/kg−1 diet, respectively [assessed by atomic
absorption spectrometer (TAS986; Beijing Persee General
Corporation, Beijing, China)]. All diets were provided by Research
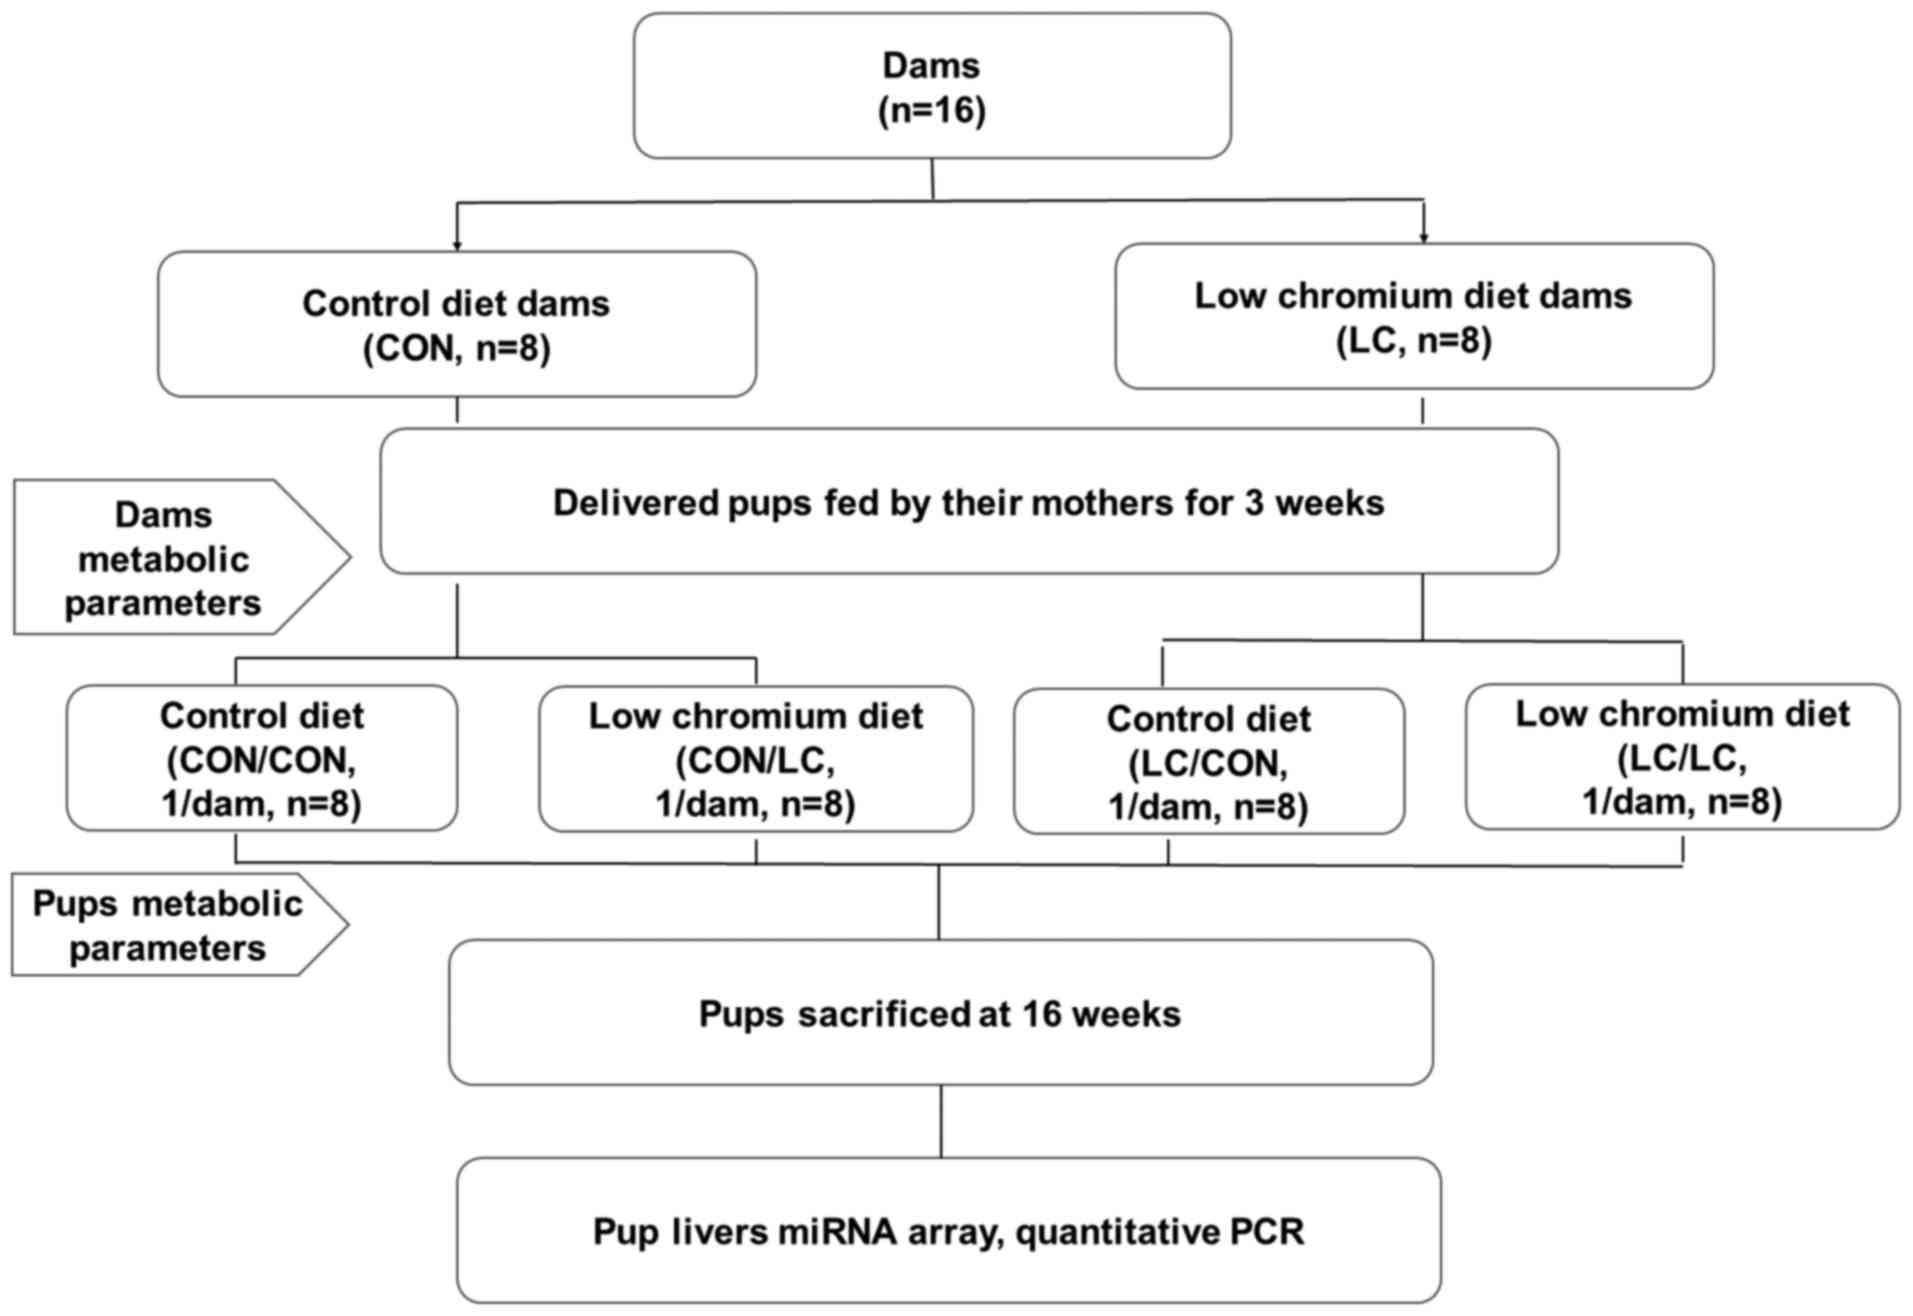
Diets, Inc. (New Brunswick, NJ, USA). Following birth of the
offspring, the litter size in each cage was randomly adjusted to 6
pups (3 males, 3 females, if possible) to ensure equal nutrition
until the pups were weaned. Pups were kept under the same housing
conditions as the adult mice. After weaning, pups were randomly
subdivided into four groups: i) Pregnancy and lactation CON diet
group fed a CON diet after weaning (CON/CON); ii) pregnancy and
lactation CON diet group fed a LC diet after weaning (CON/LC); iii)
pregnancy and lactation LC group fed a LC diet after weaning
(LC/LC) and iv) pregnancy and lactation LC group fed a CON diet
after weaning (LC/CON) (n=8/group; 1 male pup from each litter was
randomly assigned to the experimental groups). Male offspring only
were used for the present study to avoid sex differences on the
effect of maternal nutrition on glucose metabolism (19). At the end of the experimental
period (16 weeks of age), blood samples were collected from the
intraorbital retrobulbar plexus in anesthetized mice (ketamine 100
mg/kg, i.p.; Pfizer, Inc., New York, NY, USA) following a 10-h
fast. All male mice (n=8/group) from eight different litters (1
male offspring/litter) were then sacrificed. Whole livers of the
offspring were quickly removed and stored at −80°C for further
analysis. The experimental design is presented in Fig. 1.
 | Table IComposition of dietsa. |
Table I
Composition of dietsa.
| Ingredient (g or
mg/kg diet) | CON | LC |
|---|
| Cornstarch, g | 397.5 | 397.5 |
| Casein, g | 200.0 | 200.0 |
| Dextrinized
cornstarch, g | 132.0 | 132.0 |
| Sucrose, g | 100.0 | 100.0 |
| Soybean oil, g | 70.0 | 70.0 |
| Fiber, g | 50.0 | 50.0 |
| Mineral mix, g | 35.0 | 35.0 |
| Vitamin mix
AIN-93-VX, g | 10.0 | 10.0 |
| L-Cystine, g | 3.0 | 3.0 |
| Choline bitartrate,
g | 2.6 | 2.6 |
|
Tert-butylhydroquinone, mg | 14.0 | 14.0 |
| Chromium potassium
sulfate 12H2O (10.42% Cr), mg | 275.0 | 0.0 |
Measurement of serum Cr levels
The blood samples from the dams at weaning and the
16-week-old offspring were centrifuged and the resulting serum was
collected for Cr analysis. Serum Cr concentrations were measured
using an atomic absorption spectrometer (Atomic Absorption
Spectrophotometer; Hitachi, Ltd., Tokyo, Japan).
Measurement of body weight and blood
glucose levels
Body weight and blood glucose levels of dams were
measured at weaning, and were measured in pups at birth, weaning
and at 16 weeks of age. Tail blood glucose measurements were
recorded using a blood glucose analyzer (Bayer Contour TS
Glucometer; Bayer AG, Leverkusen, Germany).
Oral glucose tolerance test (OGTT)
An OGTT was performed on dams at weaning and on pups
at 16 weeks, after 12 h of food deprivation. The OGTT was performed
in the morning. Glucose was introduced into the mice via oral
gavage at a final dose of 2 g/kg body weight. Blood samples were
obtained from the tail vein 30, 60 and 120 min after glucose load
in order to analyze glucose concentration using a glucometer (Bayer
Contour TS Glucometer; Bayer AG). Glucose responses during the OGTT
were evaluated by estimating the total area under the curve (AUC)
using the trapezoidal method.
Serum insulin levels and homeostasis
model assessment of IR (HOMA-IR) index
After 12 h of food deprivation, tail blood samples
were obtained and centrifuged. Serum insulin concentration was
quantified using an ELISA method (mouse insulin kit; EZRMI-13K; EMD
Millipore, Billerica, MA, USA) according to the manufacturer's
protocol. Serum glucose was measured by an enzyme end-point method
(Roche Diagnostics, GmnH, Mannheim, Germany). HOMA-IR was
calculated as follows: Fasting serum glucose × fasting serum
insulin/22.5.
RNA extraction, cDNA synthesis and miRNA
array hybridization
Total liver RNA was isolated using the mirVana™ RNA
Isolation kit (Ambion; Thermo Fisher Scientific, Inc., Waltham, MA,
USA) according to the manufacturer's protocol. All RNA samples were
examined for the absence of DNA and RNA degradation by denaturing
agarose gel electrophoresis. Total RNA was then reverse transcribed
using the PrimeScript Reverse Transcription (RT) kit (Takara Bio,
Inc., Shiga, Japan) according to the manufacturer's protocol. The
expression of miRNAs contained in miRBase version 20.0 (released in
June, 2013; http://www.mirbase.org) was analyzed
by microarray using the Affymetrix Multispecies miRNA 4.0 array
(Affymetrix; Thermo Fisher Scientific, Inc.) according to the
manufacturer's protocol. Raw data were normalized, processed, and
analyzed for statistical significance using Student's t-test and
post hoc Tukey's test was applied for a multiple testing
correction.
miRNA quantitative polymerase chain
reaction (qPCR) validation
Total RNA obained using the mirVana™ RNA Isolation
kit mentioned above was quantified using a NanoDrop 1000, and then
reverse transcribed using TaqMan MicroRNA RT kit and RT primers
from the respective TaqMan MicroRNA assay kit. qPCR was performed
on an ABI 7900 thermocycler using the TaqMan Universal PCR Master
Mix and TaqMan probes from the TaqMan MicroRNA assay kit (all from
Applied Biosystems; Thermo Fisher Scientific, Inc.). Taqman probes
were synthesized according to miRNA mature sequneces (Table III). Amplification was performed
at 95°C for 10 min, followed by 40 cycles of 95°C for 15 sec and
60°C for 60 sec. The reaction conditions were 16°C for 30 min, 42°C
for 30 min and 85°C for 5 min. Tissue miRNA levels were normalized
to endogenous U6.
| Table IIISignificantly differentially
expressed miRNAs in the livers of offspring from dams fed a low
chromium diet. |
Table III
Significantly differentially
expressed miRNAs in the livers of offspring from dams fed a low
chromium diet.
| MicroRNA | Fold change | Regulation | P-value | Mature
sequences |
|---|
| mmu-miR-30f | 0.4549 | Down | 0.000241 |
GUAAACAUCCGACUGAAAGCUC |
|
mmu-miR-344b-5p | 0.4134 | Down |
3.56×10⁻⁵ |
AGUCAGGCUCCUGGCUAAAGUUC |
| mmu-miR-28b | 0.2847 | Down |
3.45×10⁻⁶ |
AGGAGCUCACAAUCUAUUUAG |
| mmu-miR-296-3p | 0.3765 | Down | 0.000718 |
GAGGGUUGGGUGGAGGCUCUCC |
|
mmu-miR-7062-3p | 0.4833 | Down | 0.001047 |
ACUAACUUCUCCUGGCCCCACAG |
|
mmu-miR-3090-5p | 0.4811 | Down | 0.000773 |
GUCUGGGUGGGGCCUGAGAUC |
| mmu-miR-122-3p | 3.0022 | Up | 0.000983 |
AAACGCCAUUAUCACACUAA |
| mmu-miR-6238 | 2.7639 | Up | 0.001775 |
UUAUUAGUCAGUGGAGGAAAUG |
|
mmu-miR-669a-3p | 2.1272 | Up | 0.007318 |
ACAUAACAUACACACACACGUAU |
| mmu-miR-691 | 2.4515 | Up |
8.43×10⁻⁵ |
AUUCCUGAAGAGAGGCAGAAAA |
| mmu-miR-223-3p | 2.5277 | Up | 0.000156 |
UGUCAGUUUGUCAAAUACCCCA |
| mmu-miR-327 | 2.9025 | Up | 0.000762 |
ACUUGAGGGGCAUGAGGAU |
| mmu-miR-207 | 2.2873 | Up | 0.000728 |
GCUUCUCCUGGCUCUCCUCCCUC |
|
mmu-miR-466f-3p | 2.1942 | Up |
1.06×10⁻⁵ |
CAUACACACACACAUACACAC |
miRNA target gene bioinformatics
analysis
miRTarBase database version 6.0 (released September,
2015; http://mirtarbase.mbc.nctu.edu.tw/) was used to
perform bioinformatics analysis of the differentially expressed
miRNAs and their validated target sequences (20).
miRNA target genes qPCR analysis
Total RNA extracted from the liver samples using the
mirVana™ RNA Isolation kit mentioned above was reverse-transcibed
by Superscript II (Invitrogen; Thermo Fisher Scientific, Inc.).
qPCR analysis of gene expression was performed using an ABI Prism
7500 system (Applied Biosystems; Thermo Fisher Scientific, Inc.).
The primers used were obtained from Applied Biosystems; Thermo
Fisher Scientific, Inc. (Table
II). Each PCR sample contained 20 ng reverse-transcribed RNA,
which was analyzed using SYBR-Green PCR Master Mix (Applied
Biosystems; Thermo Fisher Scientific, Inc.). The following reaction
conditions were used: 48°C for 30 min, 95°C for 15 min, 40 cycles
of 95°C for 15 sec, 55°C for 1 min. Target mRNA expression was
normalized to β-actin expression and are expressed as a relative
value using the cycle quantification (Cq) method
(2−ΔΔCq) (21).
| Table IIQuantitative polymerase chain
reaction primers. |
Table II
Quantitative polymerase chain
reaction primers.
| Gene symbol | ID | Forward | Reverse | Product length
(bp) |
|---|
| Akt1 | NM_009652 |
5′-CAGTTTGAGACCACACAT-3′ |
5′-GCGTCAGTCCTTAATAGTT-3′ | 75 |
| Pdpk1 | NM_011062 |
5′-GGAATTGAATAGTGAGGTT-3′ |
5′-AATGATGAATGTTGTATGTG-3′ | 114 |
| Pik3ca | NM_008839 |
5′-TGTGGCATCTGAGTATCT-3′ |
5′-TGTGGCATCTGAGTATCT-3′ | 132 |
| Pik3r1 | NM_001077495 |
5′-ATTAAGGTTCTGTGGATTC-3′ |
5′-GCTATGCTGTATCTATCTG-3′ | 80 |
| Pik3r3 | NM_181585 |
5′-ATTGGAATACCTGTGACT-3′ |
5′-TGACTTACTTGGAAGAGAT-3′ | 148 |
| Slc2a4 | NM_009204 |
5′-TATGTTGCGGATGCTATG-3′ |
5′-TTAGGAAGGTGAAGATGAAG-3′ | 82 |
miRNA target genes pathway analysis
To fully clarify the biological functions of the
target genes of differentially expressed miRNAs, Gene Ontology (GO)
classifications and Kyoto Encyclopedia of Genes and Genomes (KEGG)
pathways were determined, using Database for Annotation,
Visualization and Integrated Discovery software (http://david.abcc.ncifcrf. gov/) (22). Interactions between miRNAs and
mRNAs were analyzed by Cytoscape (http://www.cytoscape.org) (23).
Cell culture and treatments
HepG2 human liver cancer cells (American Type
Culture Collection, Manassas, VA, USA) were maintained in
Dulbecco's modified Eagle's medium supplemented with 10% fetal
bovine serum, 1% pencillin-strepomycin, 2 mM glutamine (all from
Lonza Group, Ltd., Basel, Switzerland) and 25 mM HEPES
(Sigma-Aldrich; Merck KGaA, Darmstadt, Germany) in a humidified
incubator containing 5% CO2 at 37°C. HepG2 cells
(2×10⁵ cells/ml) were transfected with miR-327,
miR-223-3p, miR-446f-3p (mature sequences in Table III; 10 μM; Ambion; Thermo
Fisher Scientific, Inc.) or negative control oligo-duplex (Ambion)
using transfection reagent (Lipofectamine® RNAiMAX;
Invitrogen; Thermo Fisher Scientific, Inc.) for 12 h at 37°C. After
24 h, cells were harvested for RNA preparation, and to measure the
relative expression levels of miR-327, miR-223-3p, miR-446f-3p,
thymoma viral proto-oncogene 1 (Akt1), 3-phosphoinositide
dependent protein kinase 1 (Pdpk1), phosphatidylinositol
3-kinase, catalytic, α polypeptide (Pik3ca),
phosphatidylinositol 3-kinase, regulatory subunit, polypeptide
(Pik3r1), phosphatidylinositol 3-kinase, regulatory subunit,
polypeptide 3 (Pik3r3) and solute carrier family 2 member 4
[Slc2a4, also known as glucose transporter 4
(Glut4)].
Data statistical analysis
All numerical results are expressed as the means ±
standard deviation of the indicated number of experiments.
Student's t-test was used to compare unpaired samples, and One-way
analysis of variance followed by post hoc Tukey test was used for
multiple comparisons. GraphPad Prism software version 5.0 (GraphPad
Software, Inc., La Jolla, CA, USA) was used to analyze the data.
P<0.05 was considered to indicate a statistically significant
difference.
Results
Dams
Serum Cr concentrations were lower in the LC group
compared with in the CON group (0.36±0.03 vs. 0.74±0.14 ng/ml,
P<0.01). Body weight, fasting blood glucose, blood glucose
levels, AUC of glucose concentration during OGTT, serum insulin
levels and HOMA-IR index in LC dams were similar to CON dams at the
end of lactation (data not shown).
Offspring
Effect of maternal LC diet on serum Cr
in offspring
At 16 weeks of age, serum Cr in the LC/LC (0.31±0.02
ng/ml) and CON/LC groups (0.27±0.01 ng/ml) was significantly
reduced compared with in the CON/CON (0.69 ±0.03 ng/ml) and LC/CON
groups (0.72±0.09 ng/ml, P<0.01).
Effects of maternal LC diet on body
weight of offspring
At birth, 3 and 16 weeks of age, body weight of male
pups was not markedly different among the various groups.
Effects of maternal LC diet on fasting
blood glucose in offspring
At week 3, no significant differences in fasting
blood glucose were noted among all groups. At week 16, fasting
blood glucose in the CON/LC (8.32±0.72 mmol/l), LC/CON (8.19±0.92
mmol/l) and LC/LC groups (8.52±0.73 mmol/l) was significantly
higher compared with in the CON/CON group (5.83±0.07 mmol/l,
P<0.05).
Effects of maternal LC diet on glucose
tolerance in offspring
To determine whether maternal LC diet disturbs
glucose tolerance in offspring, an OGTT was conducted at 16 weeks
of age. After a bolus of oral glucose, blood glucose levels were
significantly increased in the offspring of the CON/LC, LC/LC and
LC/CON groups compared with in the CON/CON group at 30, 60 and 120
min (P<0.05 or P<0.01). AUC of blood glucose concentration
was increased in the CON/LC (51.43±4.38 mmol/l/h), LC/LC
(53.18±4.83 mmol/l/h) and LC/CON groups (48.85±5.28 mmol/l/h)
compared with in the CON/CON group (26.23±3.14 mmol/l/h,
P<0.01).
Effects of maternal LC diet on serum
insulin and HOMA-IR index in offspring
Serum fasting insulin levels were significantly
increased in the CON/LC (11.8±1.84 μIU/ml) and LC/LC groups
(13.2±1.8 μIU/ml) compared with in the CON/CON group
(6.4±0.53 μIU/ml, P<0.05). HOMA-IR index in the LC/CON
(3.8±0.37), CON/LC (3.1±0.24) and LC/LC groups (3.8±0.26) was
higher than that in the CON/CON group (2.1±0.13, P<0.01) (data
not shown).
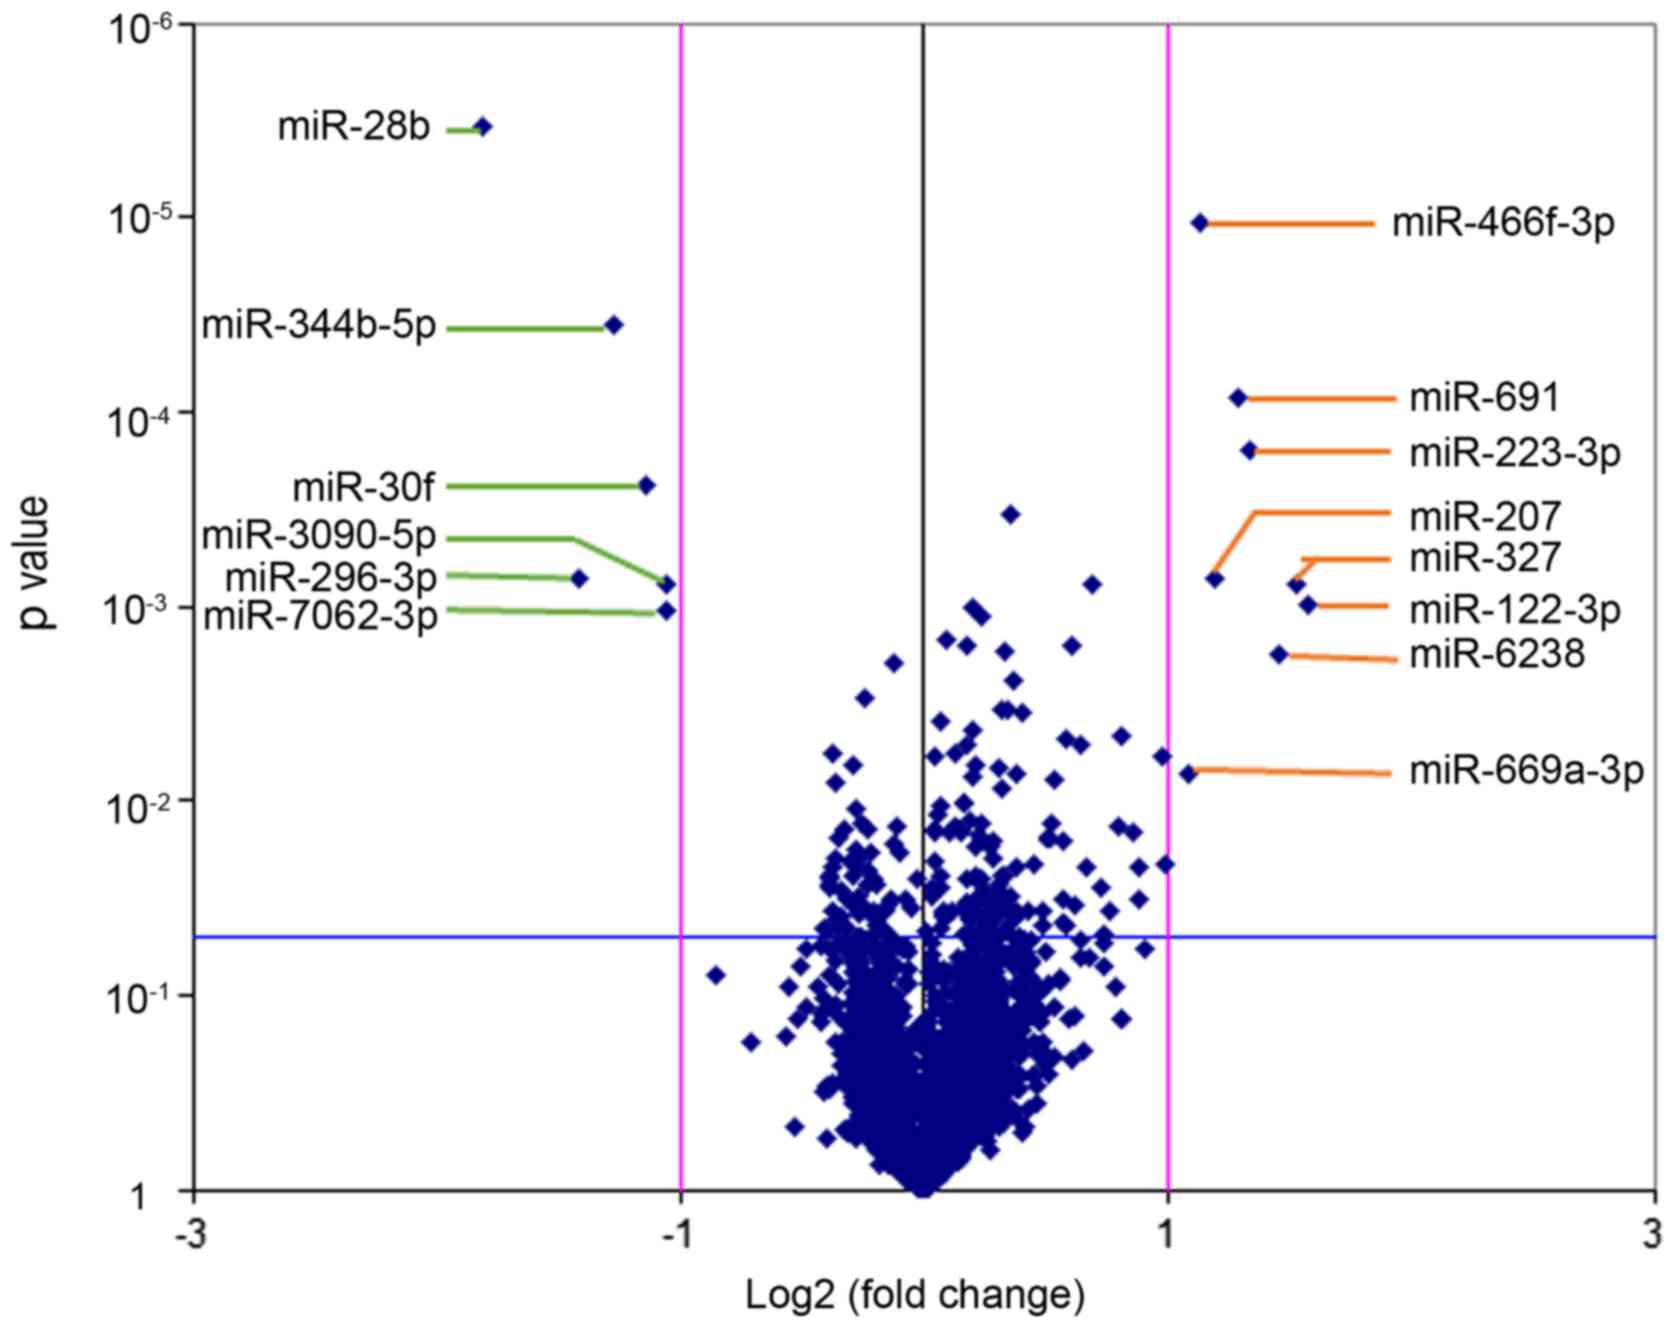
miRNA array
Affymetrix miRNA 4.0 array contains all known mouse
and rat miRNA annotated in the miRBase 20.0 sequence database. A
volcano plot was generated to identify differential expression
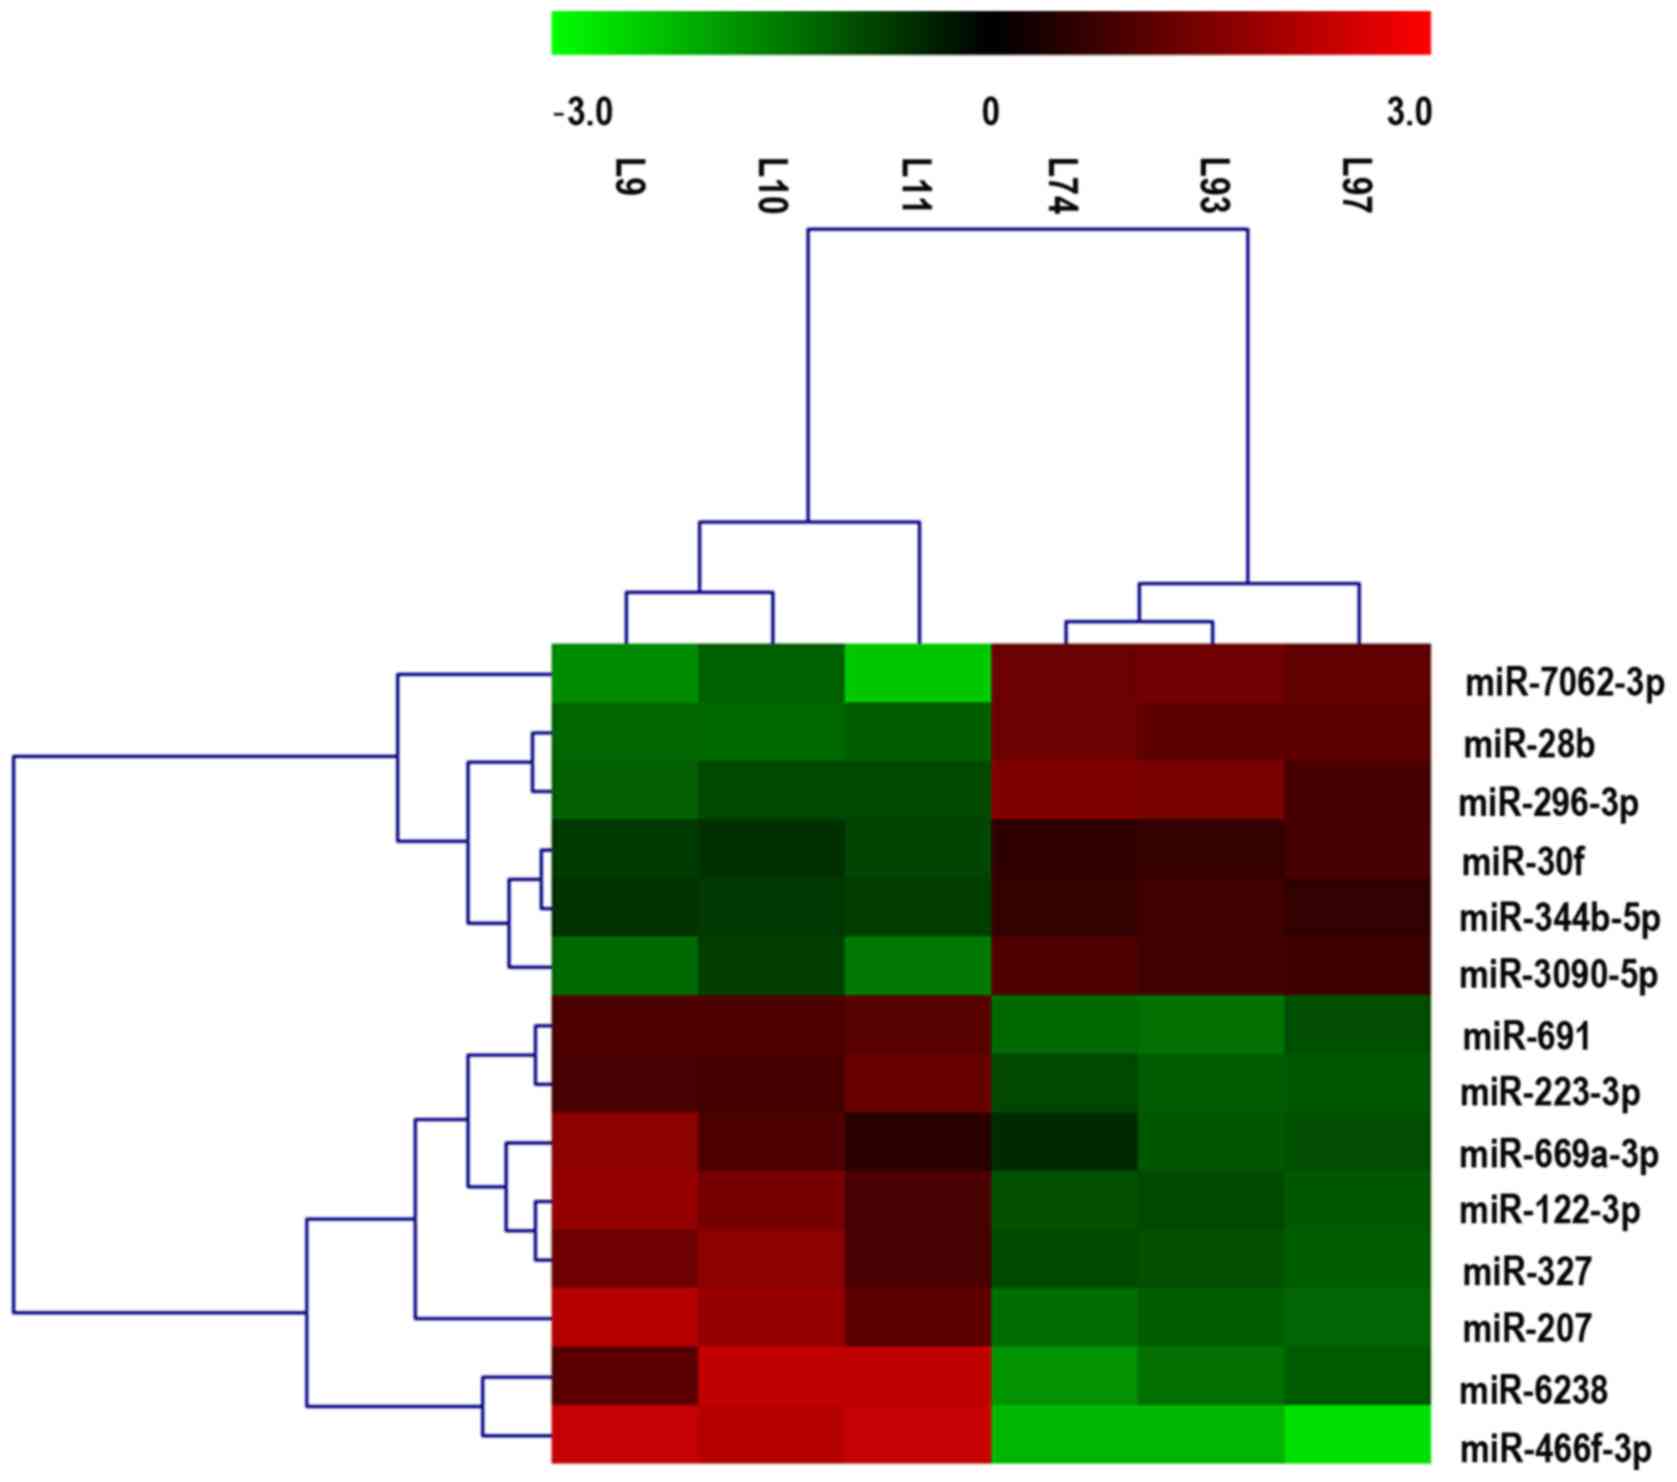
between the LC/CON and CON/CON groups, as shown in Fig. 2. The cluster and heat maps of all
detected differentially expressed miRNAs were plotted to better
demonstrate differential miRNA expression between the two groups
(Fig. 3). The miRNA array yielded
14 significantly differentially expressed miRNAs (Table III). Among the 14 significantly
differentially expressed miRNAs, 8 miRNAs were upregulated
(mmu-miR-122-3p, mmu-miR-6238, mmu-miR-669a-3p, mmu-miR-691,
mmu-miR-223-3p, mmu-miR-327, mmu-miR-207 and mmu-miR-466f-3p), and
6 miRNAs were downregulated (mmu-miR-30f, mmu-miR-344b-5p,
mmu-miR-28b, mmu-miR-296-3p, mmu-miR-7062-3p and mmu-miR-3090-5p).
Differentially expressed miRNAs were defined by a fold change ≥2,
up- or downregulated and P<0.05.
qPCR
qPCR was used to confirm differential miRNA
expression and to detect the target genes of differentially
expressed miRNAs (Fig. 4). The
differential expression of miRNAs was confirmed by RT-qPCR; the
results were consistent with the array analysis (Fig. 4A).
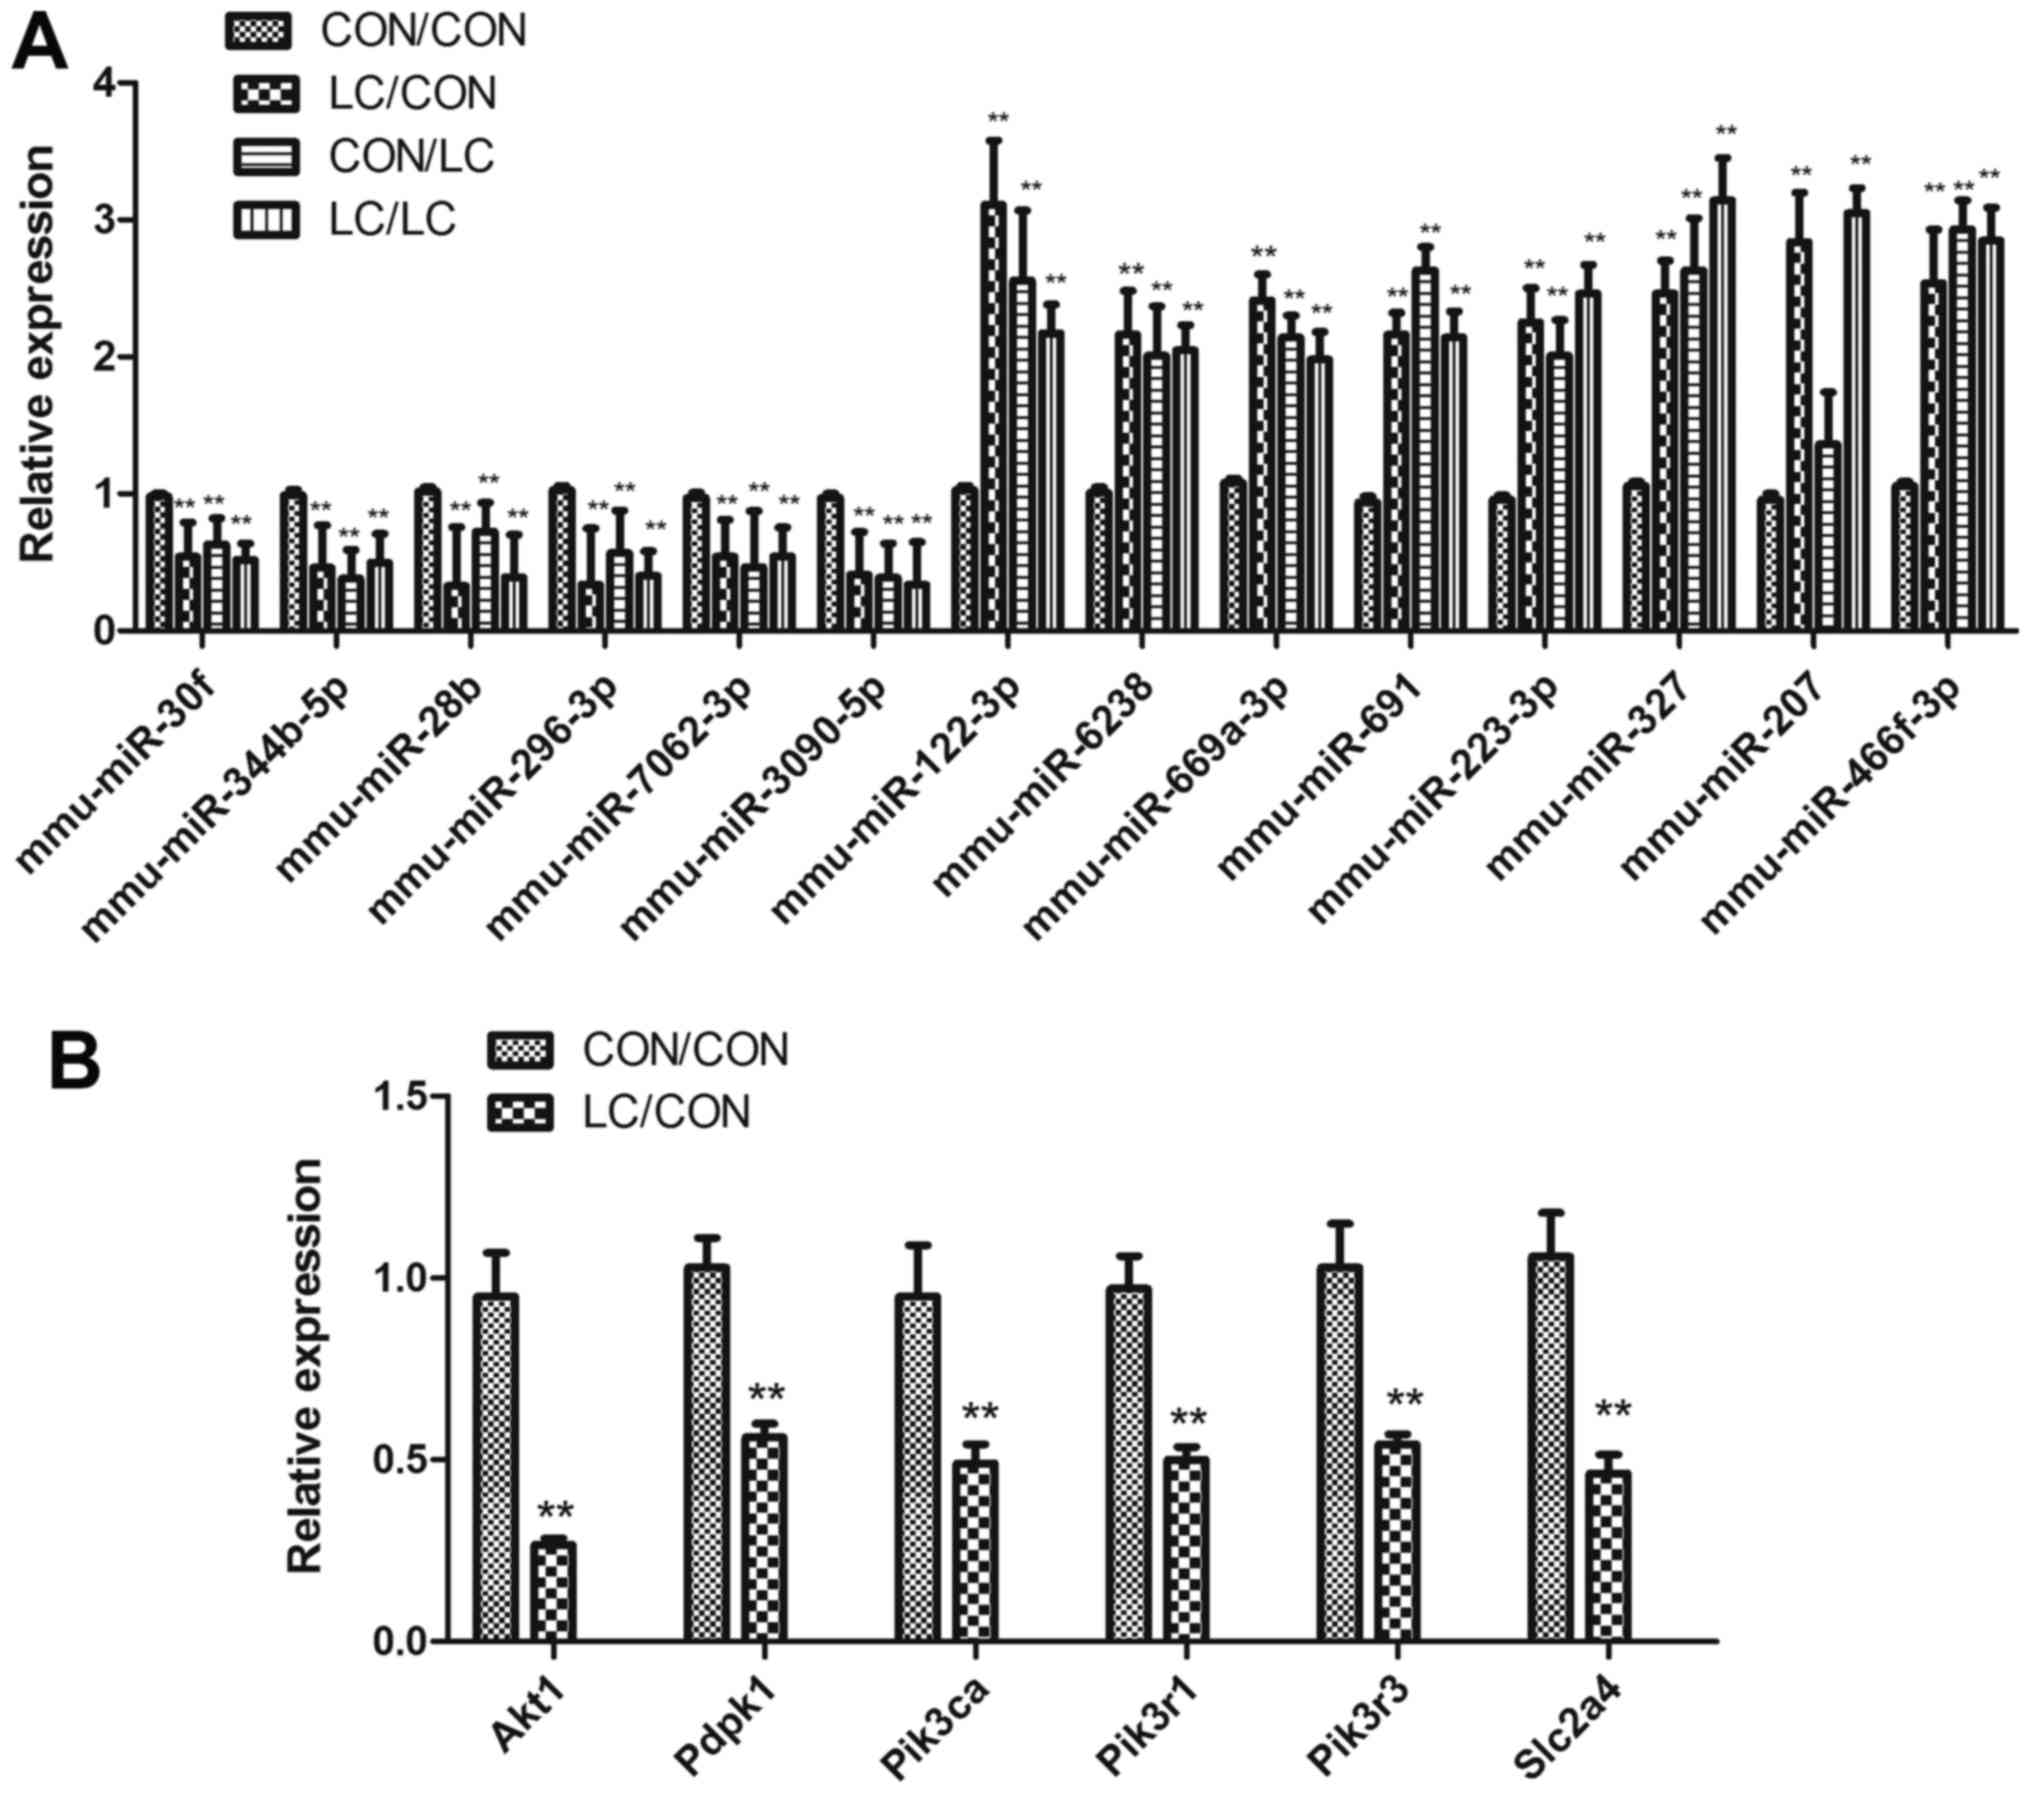 | Figure 4Differential miRNA expression
underwent (A) qPCR validation and (B) target genes of the
differentially expressed miRNAs were detected by qPCR. Data are
presented as the means ± standard deviation, n=8.
**P<0.01 vs. the CON/CON group. Akt1, thymoma
viral proto-oncogene 1; CON, control; LC, low chromium; miR/miRNA,
microRNA; Pdpk1, 3-phosphoinositide dependent protein kinase
1; Pik3ca, phosphatidylinositol 3-kinase, catalytic, α
polypeptide; Pik3r1, phosphatidylinositol 3-kinase,
regulatory subunit, polypeptide (p85 α); Pik3r3,
phosphatidylinositol 3-kinase, regulatory subunit, polypeptide 3
(p55); qPCR, quantitative polymerase chain reaction; Slc2a4,
solute carrier family 2 member 4. |
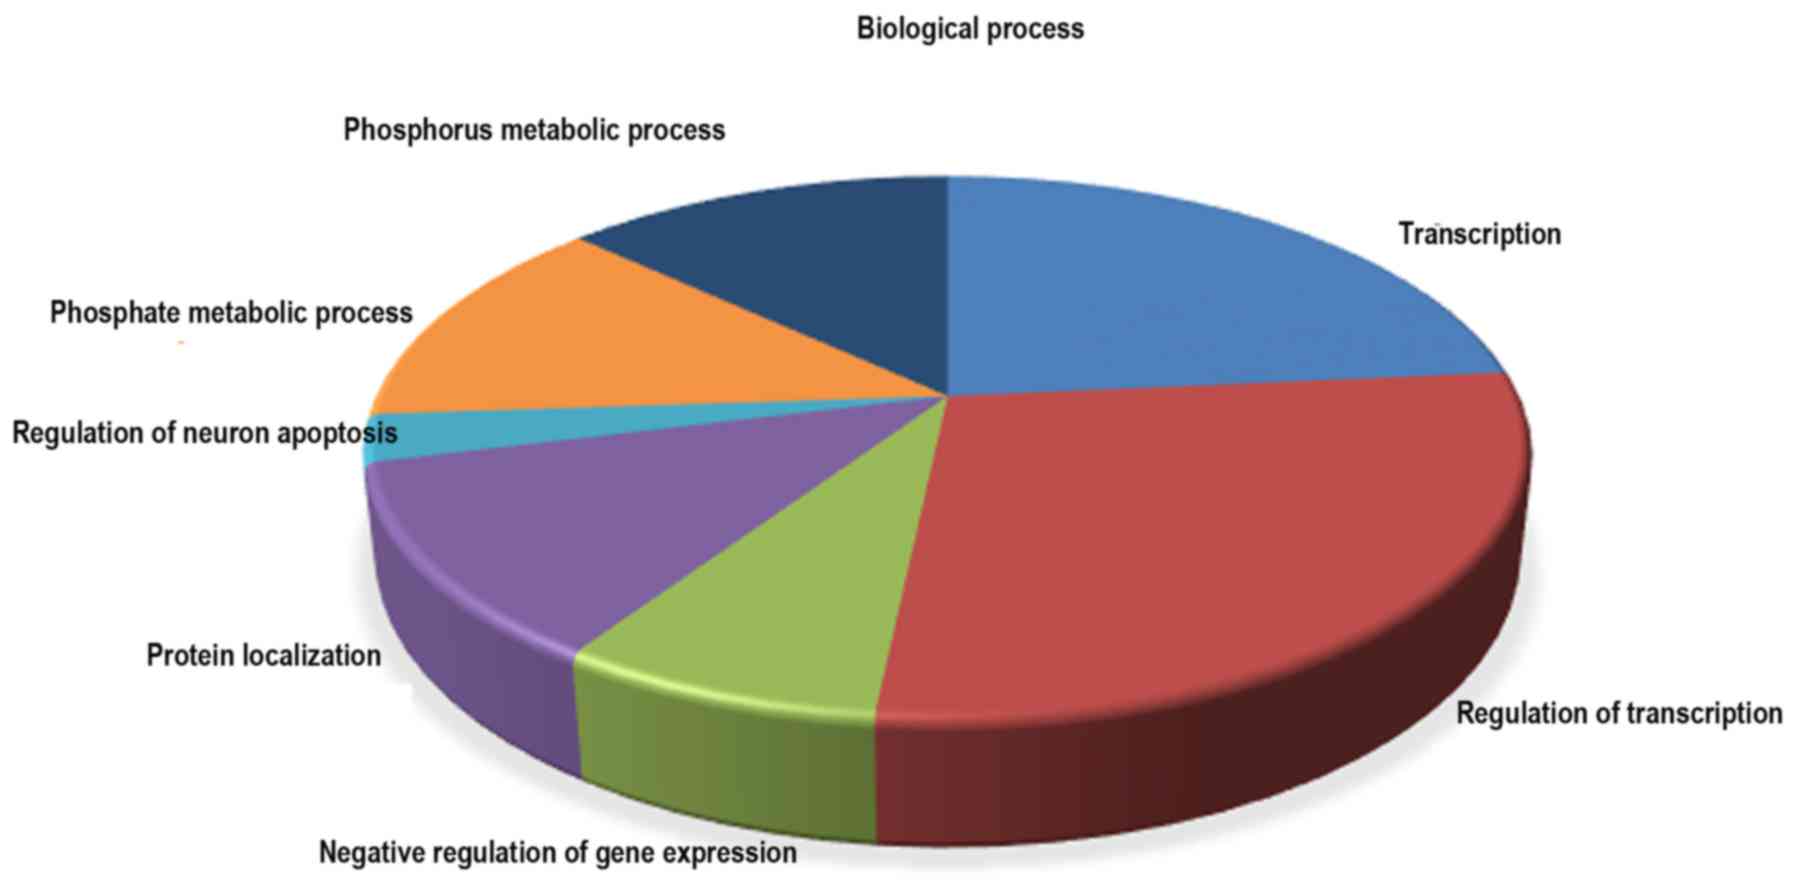
Bioinformatics analysis
Based on the data from miRTar-Base databases, 8 of
the 14 dysregulated miRNAs have 732 validated target genes
(Table IV). The significantly
over-represented biological process, cellular component and
molecular function GO terms (P<0.001) in the differentially
expressed miRNA targets are presented in Table V. In biological process, the GO
terms were involved with transcription, regulation of
transcription, negative regulation of gene expression, protein
localization, regulation of neuron apoptosis, phosphate metabolic
process and phosphorus metabolic process (Fig. 5). A pathway analysis was conducted
using the 8 differentially expressed miRNA targets; pathway title
and the P-value of the significant pathways (P<0.0001), are
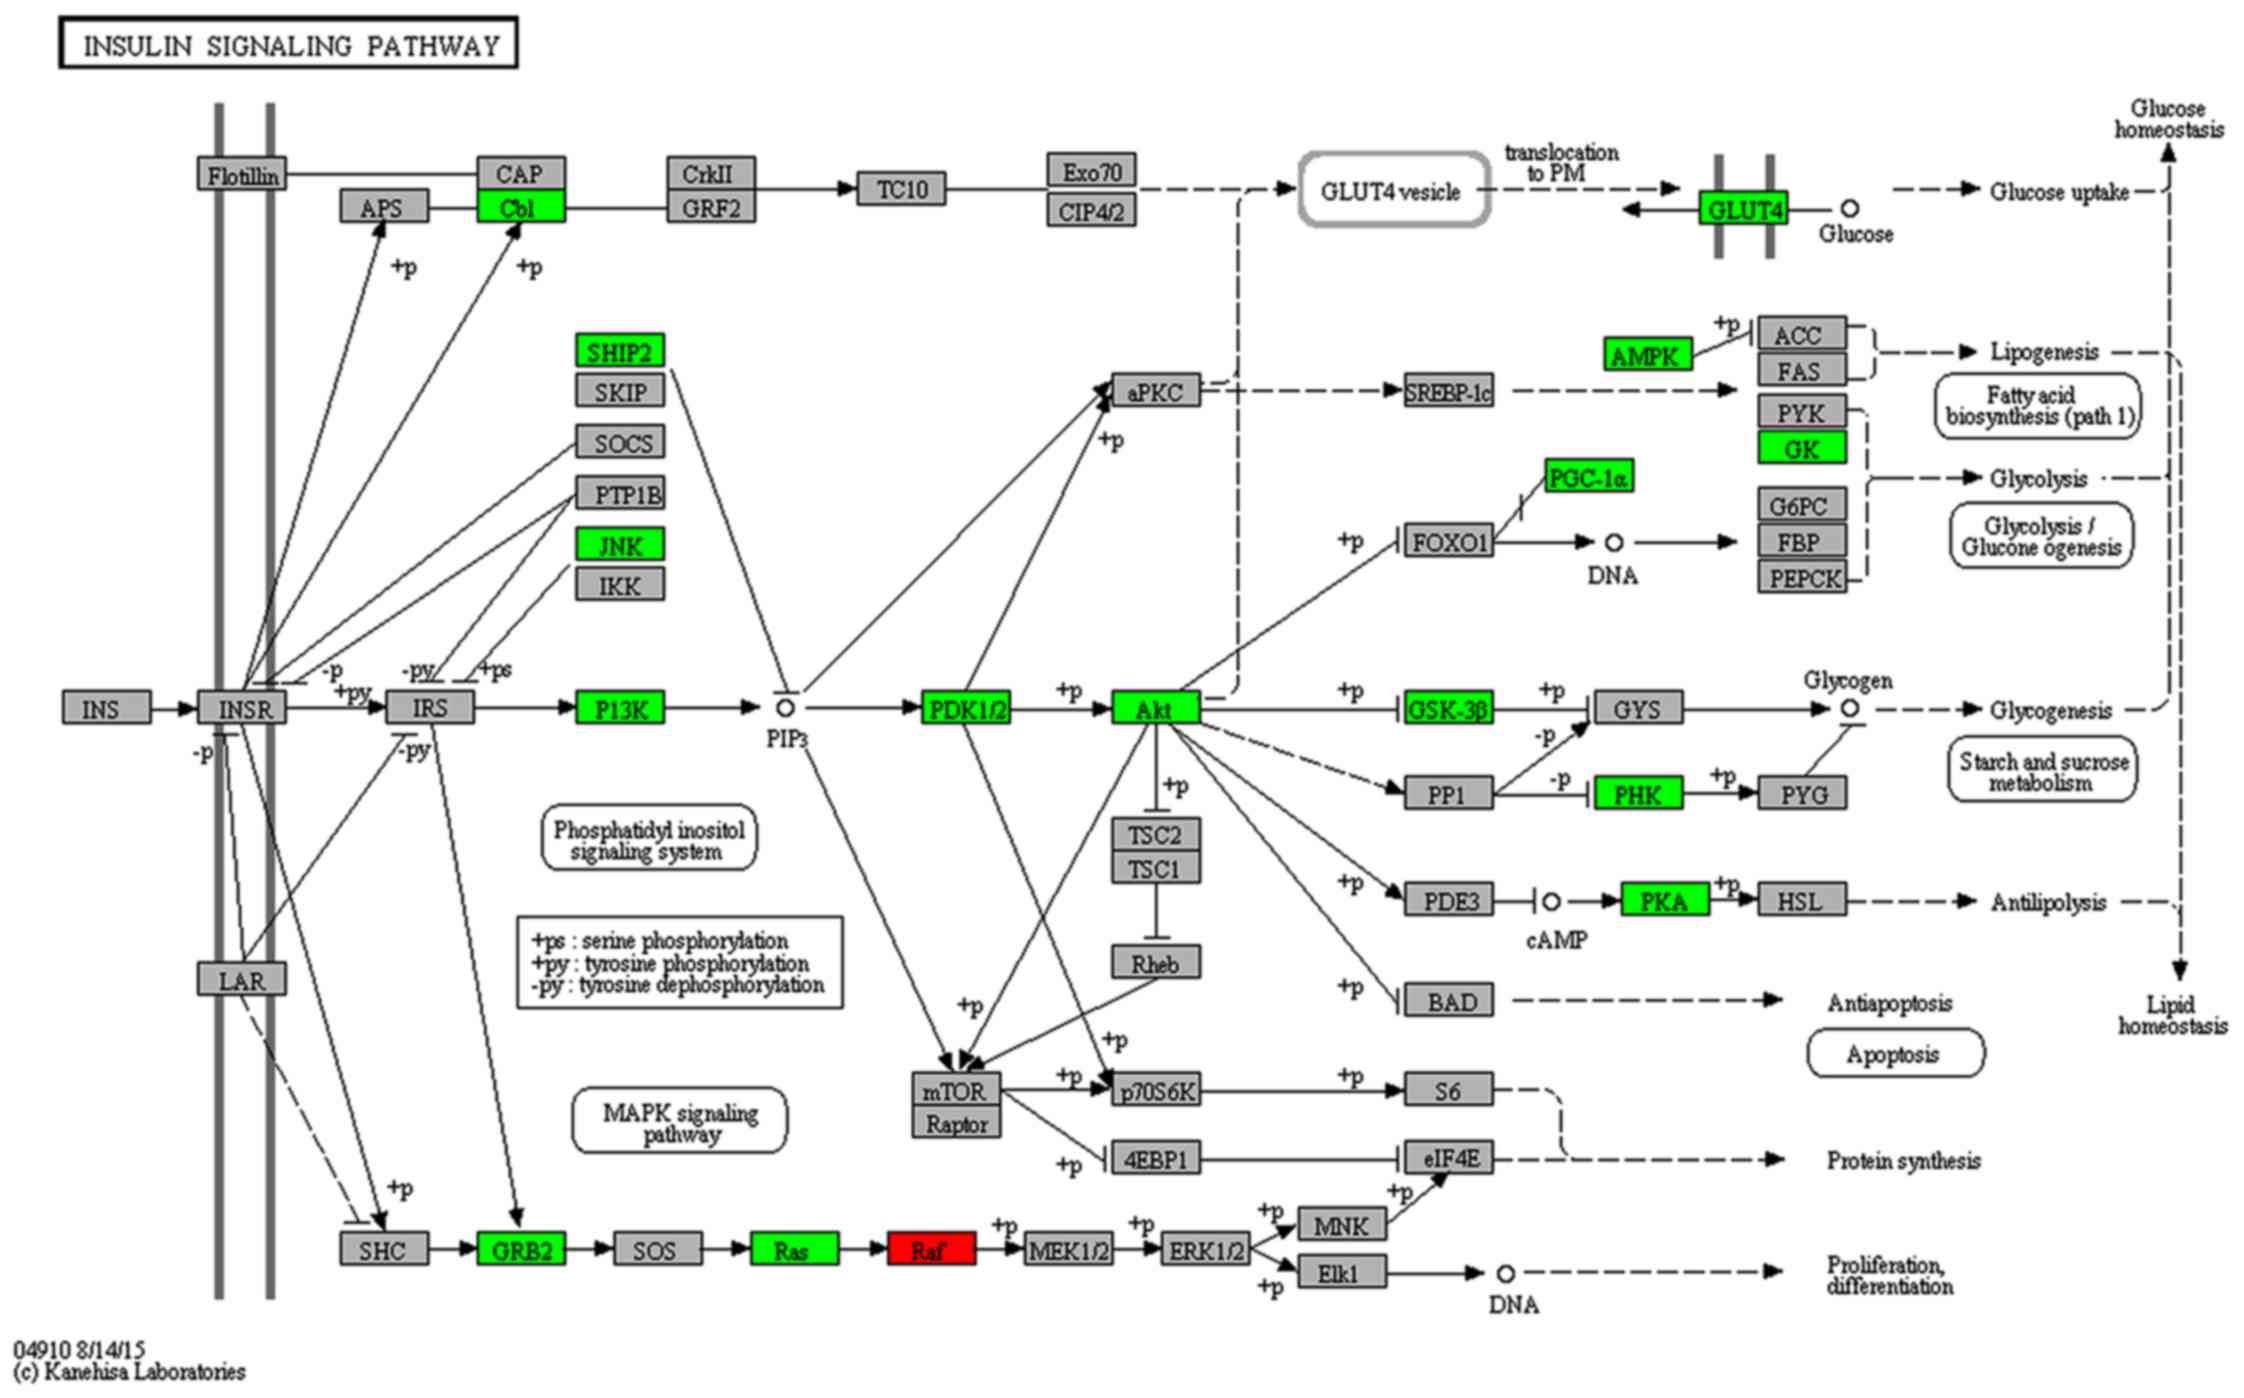
presented in Table VI. KEGG
pathway analysis showed that the target genes of differential
expression miRNAs in LC/CON mice were mainly focused on insulin
signaling pathway (Fig. 6).
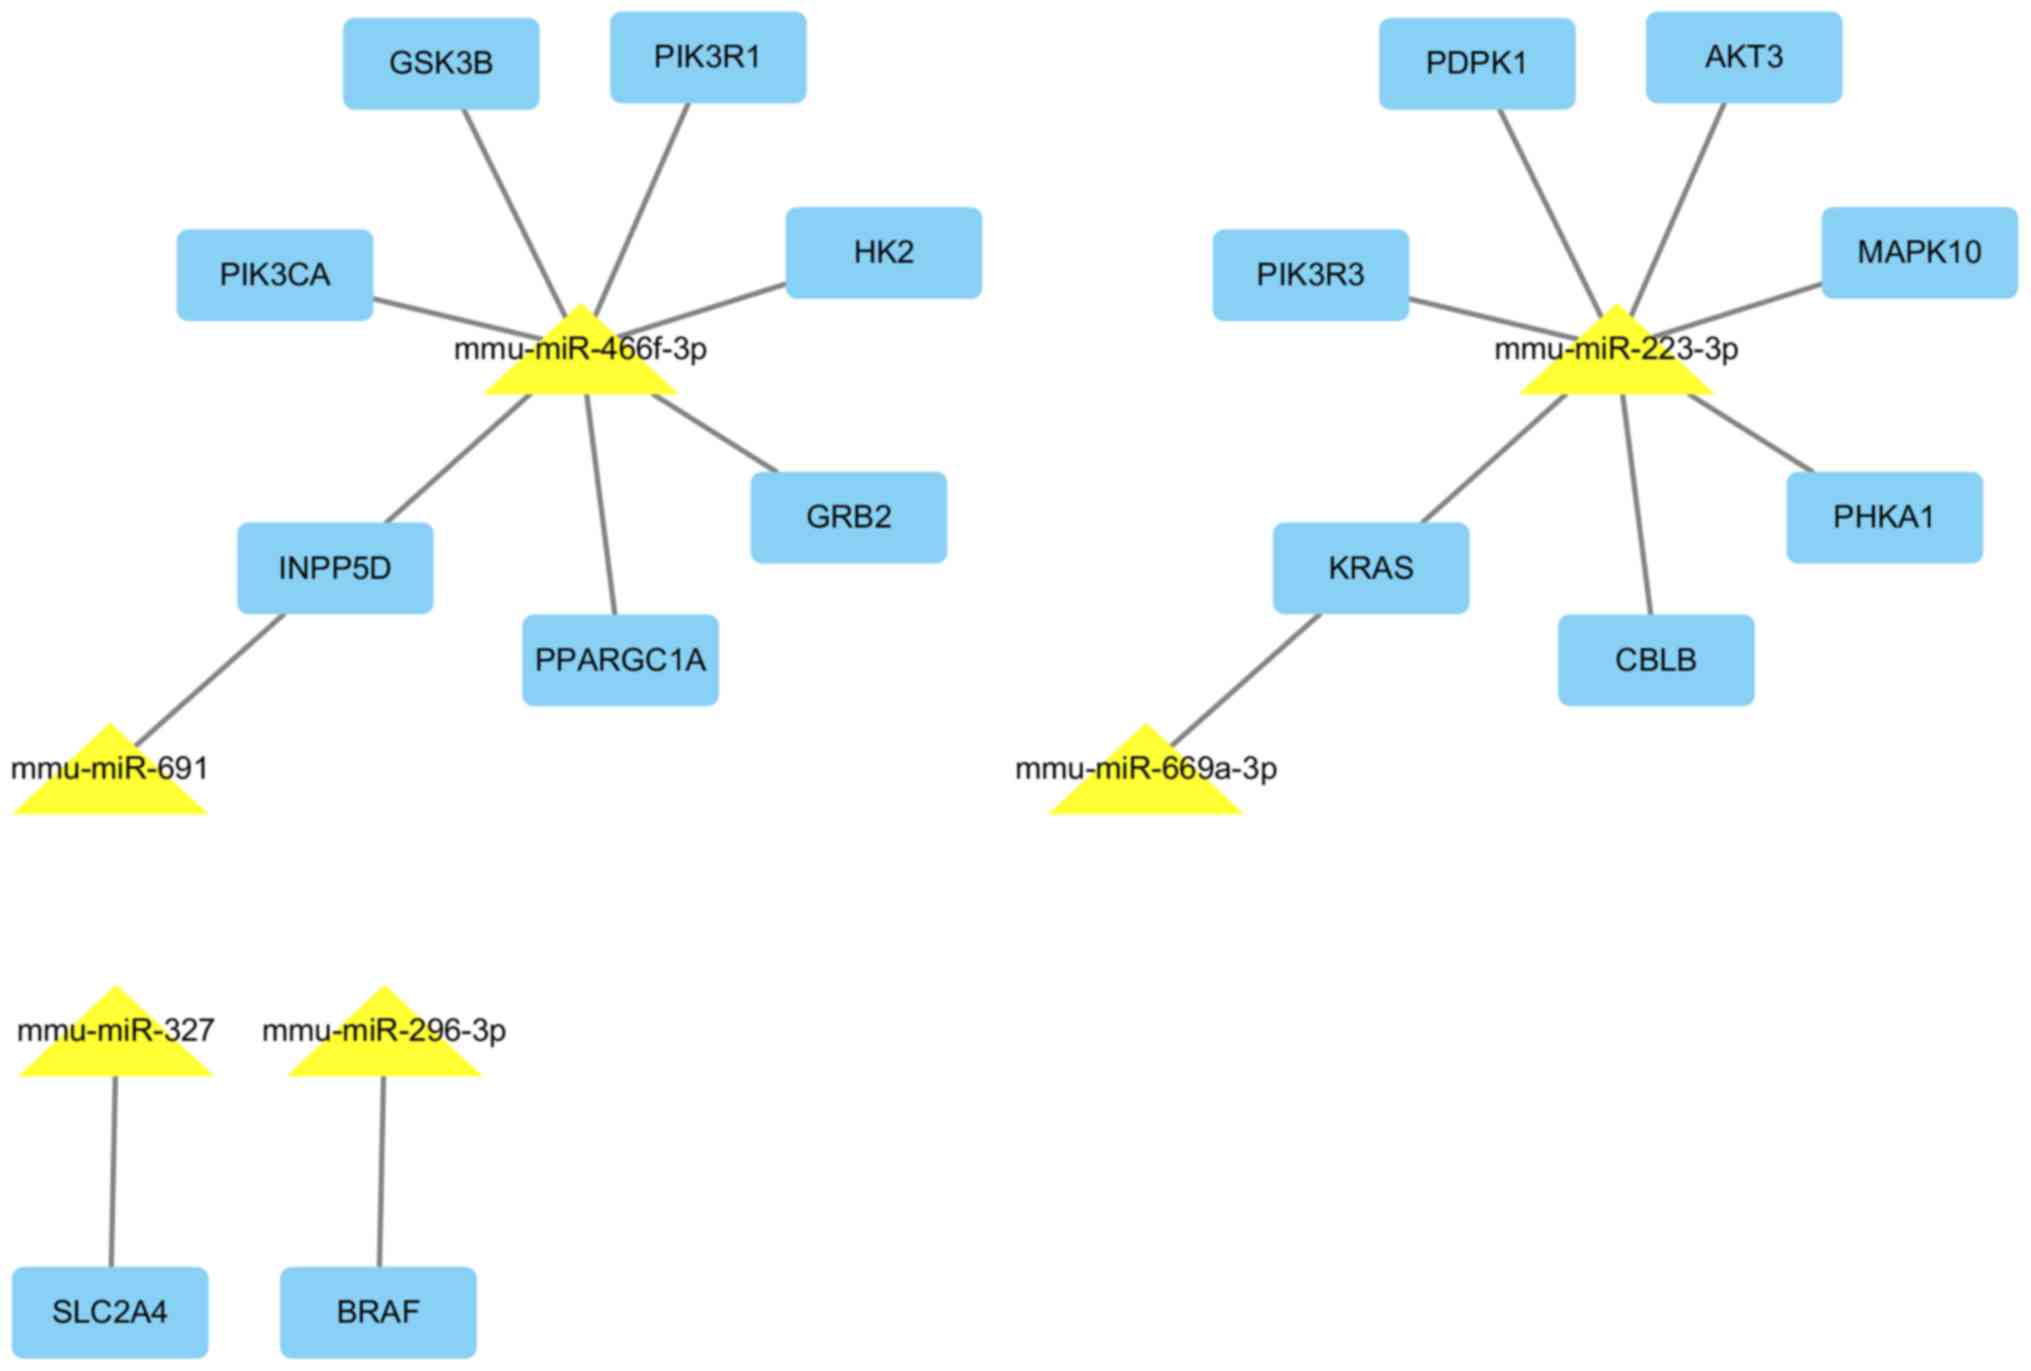
miRNAs and their target interactions are presented in Fig. 7.
| Table IVValidated target genes of 8
differentially expressed miRNAsa. |
Table IV
Validated target genes of 8
differentially expressed miRNAsa.
| miRNA | Regulation | Target genes |
|---|
| mmu-miR-28b | Down | Slc7a2, Nr3c1,
Timm17b, Timm17b, 2010109I03Rik, Tars2, Sl×1b, Tns4, Prss43, Pld5,
Ccdc78, Tmppe |
| mmu-miR-296-3p | Down | Ctla2a, Gna14,
Igf1r, Dusp8, Tfam, Tnf, Cxcl11, Car5b, Nsa2, Clvs1, Phf14, Phf14,
Braf, Mcmdc2, Prss43 |
|
mmu-miR-669a-3p | Up | Cry2, Cd47, Kras,
Shh, Zfp37, Rnf11, Ccdc82, 2610002M06Rik, Wdfy3, 1700019G17Rik,
Fam159b, Cml2, Arrdc3, Sipa1l1, Csde1, Gm4944, Gm7616 |
| mmu-miR-691 | Up | Cbln2, Cdk7,
Inpp5d, Ndrg1, Sp4, Pcgf2, Scd3, Arl6ip1, Wtap, Atp2b1,
1700025G04Rik, Sik3, Dapl1, Adamtsl1, Utp23, Cnnm1, Hlcs |
| mmu-miR-223-3p | Up | Abca1, Slc33a1,
Macf1, Ank3, Prdx6, Aplp2, Atp9a, Atrn, Pcdh15, Casp9, Cbx5, Cckbr,
Cdkn1b, Celf1, Dag1, Ddn, Enc1, Eps15, Ercc3, F2r, F3, Fmn1,
Srgap2, Fut9, Gabra6, Gabrg1, Gria2, Grin2b, Trip12, Gzmb, Sdc2,
Igf1r, Itgb1, F11r, Kcnj10, Kcnj3, Kif1b, Klf12, Kpna1, Kras, Ktn1,
Ldlr, Zbtb7a, Smad5, Mecp2, Mef2c, Mt2, Map1b, Myo1c, Napb, Nf1,
Nfib, Ntrk2, Dusp8, Pdgfra, Enpp1, Pdpk1, Pea15a, Peg3, Pgr, Phka1,
Pik3r3, Prkcb, Pkia, Plod1, Plxna2, Prkar2b, Prnp, Ptpru, Pvt1,
Rest, Rgs2, Xpr1, Rtn3, Scd1, Scn8a, Sdpr, Sept8, Serf1, Sox6,
Stat3, Syn1, Syp, Syt4, Tnfaip1, Utrn, Vim, Xpc, Ywhaz, Zfp26,
Akt3, Apc2, Ets1, Gm16515, Gnpda1, Mapk10, B3galt1, B3galnt1, Syn3,
Trp53bp1, Amot, Nrep, Ubfd1, Mga, Rnf11, Fbxw7, Tmod2, Mfhas1,
Tmx4, Sgsm1, Pgrmc1, Stk39, Vti1a, Gria3, Rragc, Ptbp2, Ak3, Ptpn9,
Dbn1, Socs5, Foxo3, Rnf14, Mbnl1, Jph3, Extl2, Fam13a, Usp14,
Gprc5b, Txndc12, Tmem57, Cyb5b, Rnf220, Asf1b, Ddx17, Slc25a46,
Polr3g, Gpatch2, Tmem33, Camsap2, Atp2b1, Tmem178, Ndnf, Ankra2,
Pdrg1, 1190002N15Rik, Abhd13, Zfp467, Sec62, Ttc9, Zfp619, Afap1,
Gcc2, Draxin, Spag9, Fmnl2, Ap2b1, Klhl5, March8, Pdia6, Antxr2,
Zcchc24, Dusp11, Slc37a3, Fbxl20, Usp36, Ttc4, Mvb12b, Dnajc6,
Tppp, Ccnt2, 3110043O21Rik, Gpbp1, 1700012B15Rik, Lonrf3, Arl5a,
Rap2a, Car12, Paqr4, Clasp2, Usp42, Golga1, Atg16l1, Kidins220,
Myh10, Yipf6, Trappc6b, Mvp, Acap2, Ankrd17, Cacng7, Smarcd2,
Pard6g, Vangl2, Trim9, Gopc, Dgcr8, Cadm3, Pds5b, Tbc1d14, Akap9,
Inpp5f, Bbs4, Dnm3, Arrdc3, Epdr1, Ypel1, Tm9sf3, Grm7, Foxp1,
Dnajc9, Jmjd1c, Fam73b, Ank2, Zfp91, Shroom2, Hlcs, Derl2, Fam57a,
Ube3b, Hpcal4, Mtmr4, Zfp704, Glcci1, Mlc1, Cd99l2, Prpf8, Phf21a,
Mical3, C2cd2, Rsrc2, Cblb, Daam1, Cpeb3, Prrt3, Kbtbd2, Dennd6a,
Kmt2a, Gnptg, L3mbtl2, Rhbdl1, Vezt, Tom1l2, Hlf, 4933426M11Rik,
Pacs2, Rasa1, Srek1, Spata13, Xkr6, Pcdh17, Golgb1, Cep120, Fam78b,
Cdc42bpa, Ino80d, Camk1d, Sestd1, Zmynd8, 4932438A13Rik, Tnrc18,
Vopp1, Eva1a, Mob1a, Ppp4r2, Luzp2, Arglu1, Psd3, Atg4d, Ago1,
Nxt2, Eml6, Usp32, Pnma2, Phf20l1, Mb21d2, Gpr158, Rbm45, Lrrc55,
Tspyl3, Podn, Wasf2, Stard13, Kat6a, Mllt6, Lgi2, Lsamp, Robo2,
Caskin1, Luzp1, Nceh1, Zbtb39, Mdga2, Zhx3, Pitpnm3, Fnip2, Tmem67,
Slc5a6, Dock1, Ksr2, Pcdhac1, Nefh, Lonrf2, Rbm33, Znrf3, Adcy1,
Bdp1, Tnik |
| mmu-miR-327 | Up | Clk4, Mef2c, Ptprb,
Slc2a4, Cntnap2, Fam168b, Cep68, Evi2b, Zmym5, Rasal2, Rab39,
Pld5 |
| mmu-miR-207 | Up | Adcy6, Cplx2, Emp2,
Gda, Itgam, Lpl, Nab1, Nrl, Pigr, Prlr, Slc22a12, Ubtf, Txnl4a,
Preb, Sh3bgrl, Rab3c, Ascl4, Prr5l, Steap2, Crebrf, BC021785,
Plcl1, Ntm, Gm4944, Prkag3, Dzank1, Oacyl |
|
mmu-miR-466f-3p | Up | Adam9, Adcyap1r1,
Akap2, Ap1g1, Xiap, Arf3, Zfhx3, Atf2, Atp7a, Pcdh15, Chic1, Bsn,
Chek1, Cnr1, Cpd, Cry2, Drp2, E2f1, Efnb2, Eif2s1, Dmtn, Epha4,
Ereg, Eya1, Fech, Gnb4, Grb2, Grik3, Hist1h1d, Foxq1, Hiat1, Hk2,
Id2, Ids, Il17ra, Inpp5d, Jag2, Kcna4, Klra2, Hivep3, Loxl3, Mef2a,
Mmp12, Mmp11, Mtf1, Nck2, Nfatc2, Nodal, Ints6, Npy1r, Slc11a2,
Nrf1, Nrg3, Nrp2, Pappa, Piga, Pik3ca, Pik3r1, Prkcb, Plau, Prrx1,
Ppargc1a, Pter, Ptp4a2, Ptprk, Rai1, Rgl1, Msr1, Cxcl5, Sin3a,
Slc12a2, Smarca4, Spta1, Tcf4, Tcf7l2, Tcte1, Tll1, Tlr4,
Tnfrsf11a, Trhr, Unc5c, Uty, Vegfa, Wfs1, Xk, Pcgf2, Zbtb7b, Ikzf2,
Gtf2h2, Dnajb6, Rnasel, Sept3, Taf7, Ldb3, Cops7b, Azi2, Sytl4,
Csnk1e, Prl5a1, Vps26a, Fbxl17, Sept11, Hif3a, B3gnt2, Diap2,
Usp27×, Pitpnb, Pias1, Gsk3b, Akap10, Plag1, Gmeb1, Tbx20, Piwil2,
Usp29, Cd200r1, Pard6b, Fign, Ms4a4b, Wtap, Ms4a4c, Gpr85, Mrps24,
Dimt1, Haus2, Ccdc82, Atg10, Slc16a9, Slc25a46, Klhl13, Zfp169,
Nacc2, Pdf, Golt1a, Rraga, Fndc1, Anln, Synpo2l, Phtf2, Casz1,
Sash1, Mllt3, Tbc1d13, Rufy2, Prss22, Pgm2l1, Foxn3, Tmem25, Smug1,
Mtfr2, Nup93, Cyb5r1, Ccpg1, Slc16a10, Ints8, Zfp444, Tmem161b,
Zfp839, Appl1, Insig2, Larp1, Ddit4l, Rap2b, Ehhadh, Ubap2l,
Ifitm7, Mdga1, Uhrf1bp1l, Dusp18, Arhgap12, Fam227a, Dcaf17, Sl×1b,
Ppp1r14c, Abca6, Rtf1, Fam101b, B3gat1, Bcas1, Crebrf, Csrnp3,
Cdk19, Clca2, Tbl1xr1, Tfcp2l1, Tdrd1, Pde4dip, Tas1r3, Mcam,
Spock2, Arid4b, Hecw1, Ubac1, Lrrc19, Zfand2a, Zfp518b, Fbxl14,
Adamts9, Dennd4a, Slc6a8, Dnm3, Unc5a, Ssr1, Mylk, Ston2, Trmt10a,
Fam212b, Prr5, Lmx1a, Scn2a1, Erc1, Slc28a3, Rasa2, Pofut1, Asb13,
Bbc3, Edaradd, Rwdd4a, Ash1l, Wfdc12, Ell2, Bzrap1, Prrg3, Ido2,
Mkx, Alkbh1, Fam46a, Gabpb2, Armc2, Arhgef11, Tnrc6b, Tet2,
Fam168b, BC003965, Tmprss13, Phactr2, Kctd11, Spag7, Evi2b, Rnf157,
Nploc4, Stxbp6, Cep170b, Gxylt1, Tbc1d24, Cep76, Plcl1, Rabgap1,
Cytip, Atp5g3, Mavs, Hnrnpa3, Bcl2l15, Slc6a17, Strip1, Cdc14a,
Tmem201, Lin54, Oas1e, BC030336, Fus, Tpte, Psd3, Ankle1, Fhod1,
Stard8, Ofd1, Zc3h12d, C2cd4c, Ric8b, Btnl9, Pfas, Fam160b2, Apol8,
Rtp1, 9930021J03Rik, Zbtb34, Zbtb6, Lzts3, Dzank1, Zfp462, Klhl21,
Rsbn1l, Ugt2b35, Ppm1k, Lonrf1, Cwf19l2, Zscan4c, Tbx22, Klf8,
Atxn7, Oas3, Srgap3, Alkbh5, Greb1, Fam107a, Ctif, Nbeal1, Ss18l1,
Lhfpl4, Fat3, Bpifc, Trim12c, Fndc3a, Hif1an, Itpripl2,
A630001G21Rik, Zbtb39, Adrbk2, Hook3, Rnf152, Hist4h4, Ubn2,
Fam169a, Sycp2, Ccdc169, Arl4c, Xpnpep3, Slfn5, Gfod1, Mast4,
Skint7, Zfp516, Acot11, Taok3, Opcml, Gpd1l, Jhdm1d, Lin28b,
Gm1587, Tbc1d22b, Arl14epl, Gse1, Mtx3, Zfp874b, Gm13476, Ociad2,
Tmem178b, Fam169b, Scrt2, Zscan4d, Mast3, Zfp872, Zfp963, Zfp827,
I830012O16Rik, AK010878 |
| Table VGene Ontology terms significantly
over-represented in the differentially expressed miRNA target genes
in three separate domains (P<0.001). |
Table V
Gene Ontology terms significantly
over-represented in the differentially expressed miRNA target genes
in three separate domains (P<0.001).
| Term | DE Count | Fold
enrichment | P-value | Ontology |
|---|
| Transcription | 92 | 1.4456 |
2.06×10⁻⁴ | Biological
Process |
| Regulation of
transcription | 110 | 1.3753 |
2.80×10⁻⁴ | Biological
Process |
| Negative regulation
of gene expression | 30 | 2.0373 |
3.87×10⁻⁴ | Biological
Process |
| Protein
localization | 46 | 1.7009 |
5.17×10⁻⁴ | Biological
Process |
| Regulation of
neuron apoptosis | 11 | 3.8285 |
5.53×10⁻⁴ | Biological
Process |
| Phosphate metabolic
process | 51 | 1.6397 |
5.66×10⁻⁴ | Biological
Process |
| Phosphorus
metabolic process | 51 | 1.6397 |
5.66×10⁻⁴ | Biological
Process |
| Transcription | 92 | 1.4456 |
2.06×10⁻⁴ | Biological
Process |
| Plasma
membrane | 140 | 1.3912 |
9.85×10⁻⁶ | Cellular
Component |
| Cell fraction | 41 | 1.9865 |
4.33×10⁻⁵ | Cellular
Component |
| Plasma membrane
part | 86 | 1.5208 |
5.55×10⁻⁵ | Cellular
Component |
| Insoluble
fraction | 37 | 2.0236 |
7.68×10⁻⁵ | Cellular
Component |
| Membrane
fraction | 36 | 2.0384 |
8.46×10⁻⁵ | Cellular
Component |
| Synapse | 24 | 2.1726 |
7.18×10⁻⁴ | Cellular
Component |
| Neuron
projection | 20 | 2.3573 |
8.54×10⁻⁴ | Cellular
Component |
| Cell junction | 31 | 1.9046 |
9.00×10⁻⁴ | Cellular
Component |
| Clathrin-coated
vesicle | 12 | 3.3320 |
9.14×10⁻⁴ | Cellular
Component |
| GTPase regulator
activity | 30 | 2.3798 |
2.57×10⁻⁵ | Molecular
Function |
|
Nucleoside-triphosphatase regulator
activity | 30 | 2.3409 |
3.49×10⁻⁵ | Molecular
Function |
| Transition metal
ion binding | 126 | 1.3835 |
5.71×10⁻⁵ | Molecular
Function |
| Metal ion
binding | 173 | 1.2868 |
6.86×10⁻⁵ | Molecular
Function |
| Ion binding | 176 | 1.2812 |
7.24×10⁻⁵ | Molecular
Function |
| Cation binding | 173 | 1.2752 |
1.15×10⁻⁴ | Molecular
Function |
| GTPase activator
activity | 19 | 2.8339 |
1.33×10⁻⁴ | Molecular
Function |
| Protein tyrosine
phosphatase activity | 13 | 3.6860 |
1.99×10⁻⁴ | Molecular
Function |
| Zinc ion
binding | 103 | 1.4012 |
2.31×10⁻⁴ | Molecular
Function |
| Cytoskeletal
protein binding | 30 | 2.0752 |
2.87×10⁻⁴ | Molecular
Function |
| DNA binding | 89 | 1.4310 |
3.63×10⁻⁴ | Molecular
Function |
| Table VISignificant pathways of the
dysregulated miRNA target genes (P<0.0001). |
Table VI
Significant pathways of the
dysregulated miRNA target genes (P<0.0001).
| Pathway | Count | Fold
enrichment | P-value |
|---|
| Endometrial
cancer | 13 | 7.5104 |
7.94×10⁻⁸ |
| Colorectal
cancer | 15 | 5.2398 |
6.60×10⁻⁷ |
| ErbB signaling
pathway | 15 | 5.1796 |
7.64×10⁻⁷ |
| Non-small cell lung
cancer | 12 | 6.6759 |
1.08×10⁻⁶ |
| Prostate
cancer | 15 | 5.0069 |
1.17×10⁻⁶ |
| Insulin signaling
pathway | 18 | 3.9185 |
2.41×10⁻⁶ |
| Glioma | 11 | 5.1634 |
3.99×10⁻⁵ |
miRNA target genes qPCR
Akt1, Pdpk1, Pik3ca,
Pik3r1, Pik3r3 and Slc2a4 (Glut4) were
downregulated in the LC/CON group compared with in the CON/CON
group, as demonstrated by RT-qPCR (Fig. 4B).
miR-327, miR-223-3p and miR-466f-3p
target the insulin signaling pathway in HepG2 cells
To determine whether miR-327, miR-223-3p and
miR-466f-3p negatively regulate the insulin signaling pathway in
vitro, HepG2 cells were transfected with miR-327, miR-223-3p
and miR-466f-3p mimics. Slc2a4 expression was significantly
downregulated in miR-327-transfected HepG2 cells (P<0.01;
Fig. 8A). In
miR-466f-3p-transfected HepG2 cells, Pik3ca and
Pik3r1 were significantly downregulated (P<0.01; Fig. 8B). In miR-223-3p-transfected HepG2
cells, Akt1, Pdpk1 and Pik3r3 were
significantly downregulated (P<0.01; Fig. 8C).
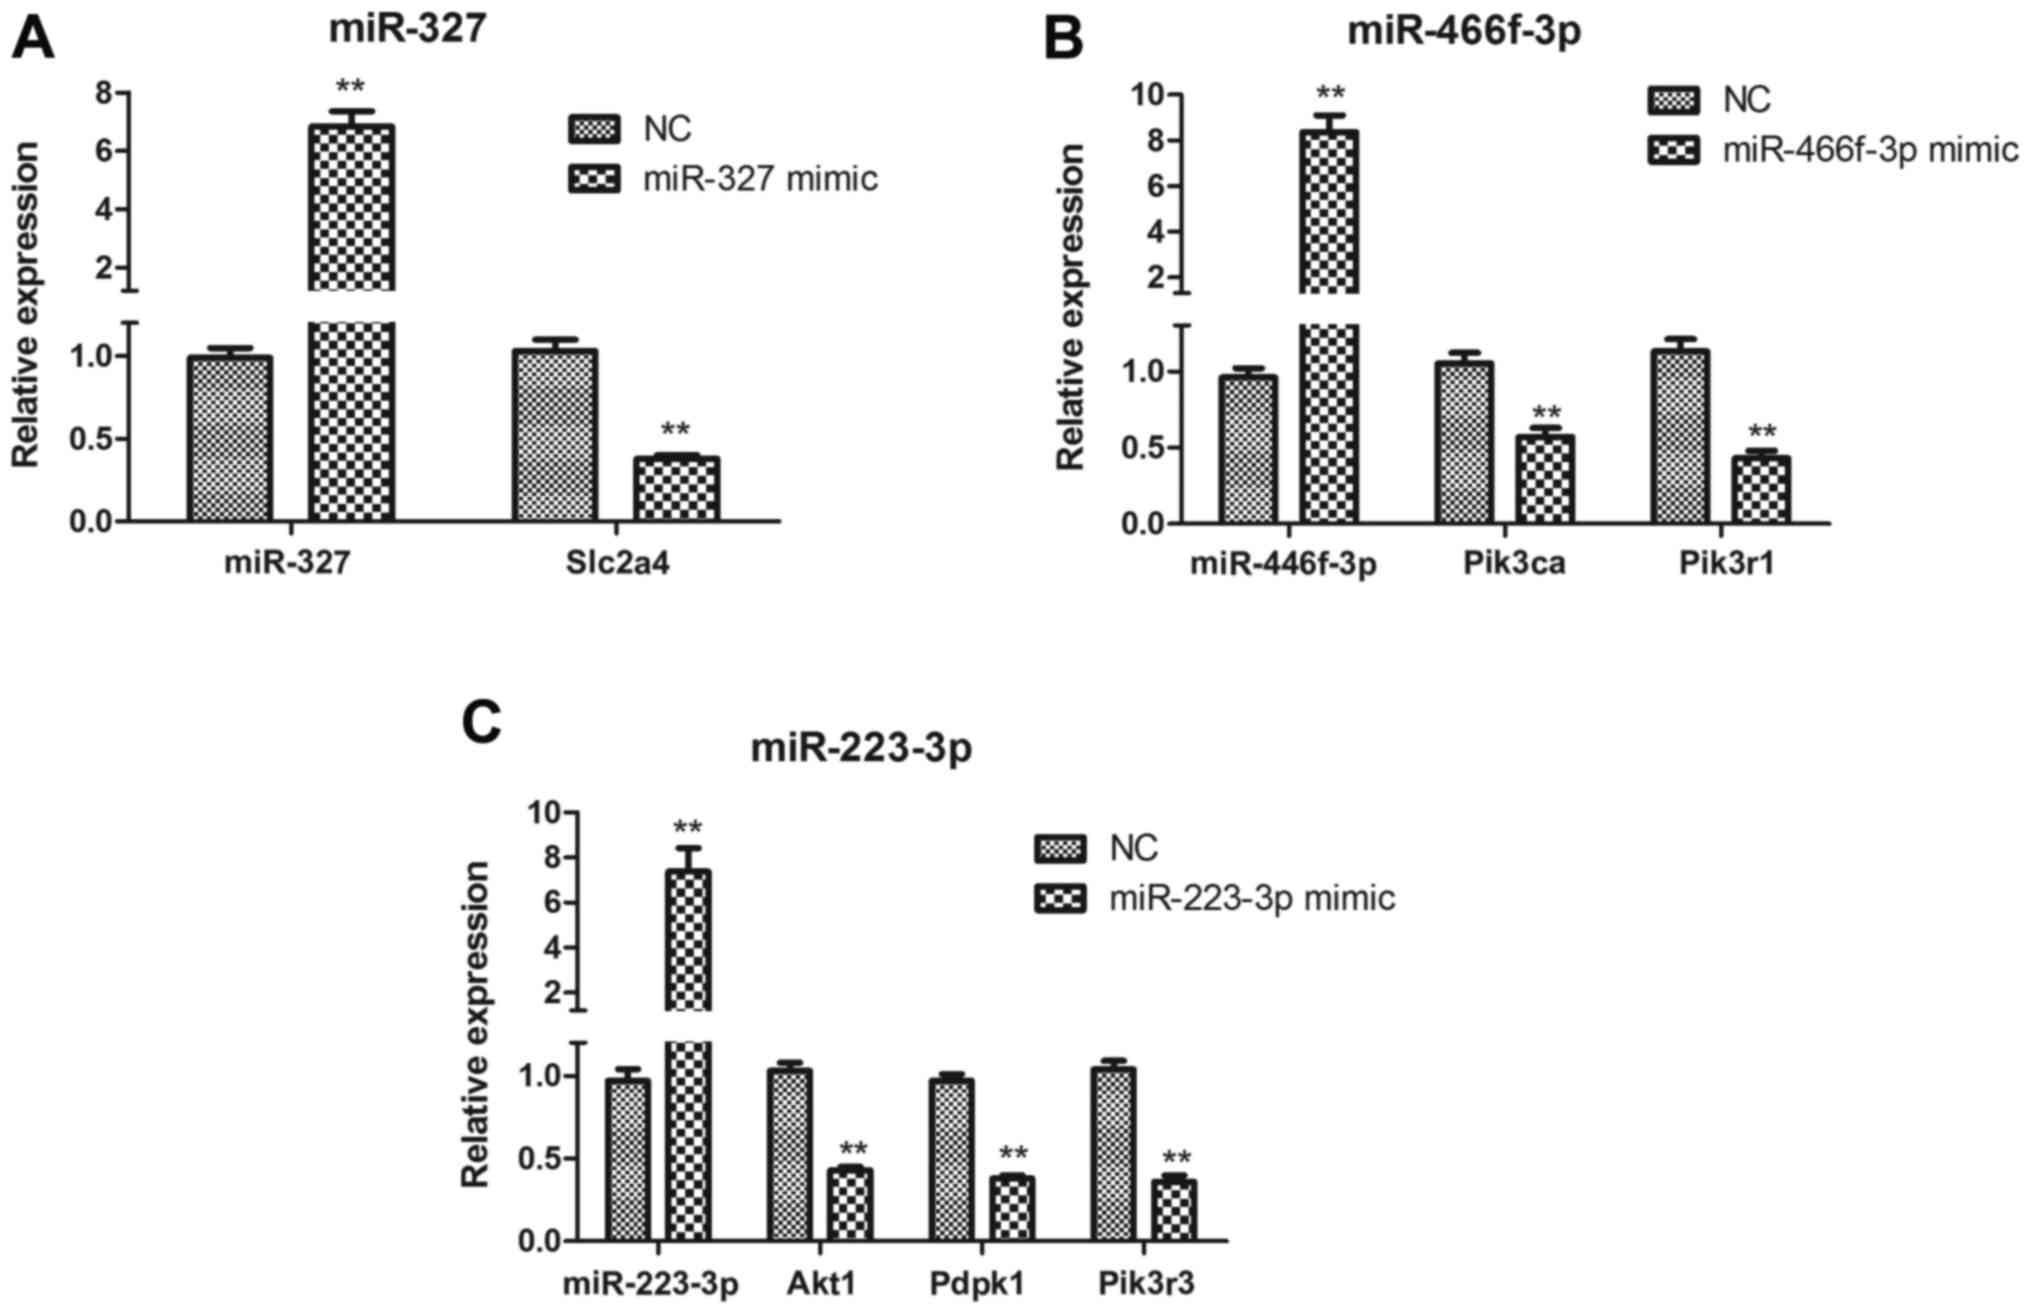 | Figure 8(A–C) Quantitative polymerase chain
reaction analysis of miR-327, miR-466f-3p, miR-223-3p, Akt1,
Pdpk1, Pik3ca, Pik3r1, Pik3r3 and
Slc2a4 expression in miR-327-, miR-466f-3p- and
miR-223-3p-transfected HepG2 cells. Data are presented as the means
± standard deviation, n=3. **P<0.01 vs. the NC group.
Akt1, thymoma viral proto-oncogene 1; miR/miRNA, microRNA;
NC, negative control; Pdpk1, 3-phosphoinositide dependent
protein kinase 1; Pik3ca, phosphatidylinositol 3-kinase,
catalytic, α polypeptide; Pik3r1, phosphatidylinositol
3-kinase, regulatory subunit, polypeptide (p85 α); Pik3r3,
phos-phatidylinositol 3-kinase, regulatory subunit, polypeptide 3
(p55); Slc2a4, solute carrier family 2 member 4. |
Discussion
In the present study, a 13-week LC diet led to
impaired fasting blood glucose and glucose tolerance, and IR in
male mice. Previous studies revealed the key role of Cr in
regulating blood glucose (24,25). In addition, Cr supplementation has
been reported to improve glucose metabolism in diabetic rats and
patients (26–28).
Notably, the present study demonstrated that male
offspring from dams fed a LC diet had comparable birth weight to
the CON group up to 16 weeks. A maternal LC diet did not change
fasting blood glucose levels in offspring at 3 weeks of age;
however, offspring from dams fed a LC diet exhibited impaired
fasting blood glucose and glucose tolerance at 16 weeks of age.
Mice in the LC/CON group had normal serum Cr levels; however, this
could not correct the glucose intolerance. Padmavathi et al
indicated that maternal Cr restriction increased fasting plasma
glucose (from 9 months) and the AUC of glucose concentration during
OGTT (from 15 months) in the offspring (9). In addition, growth-restricted rats
exhibited glucose intolerance from 6 months of age (29). Pups from magnesium-restricted
dams, which were shifted to a control diet, exhibited glucose
intolerance at 180 days of age (30). A low-protein diet increased
fasting blood glucose in offspring at 3 months (31). The results of the present study
detected glucose intolerance in offspring earlier than Padmavathi
et al (9), this may be
partly because the Cr-restricted diet used in the present study was
88% Cr restriction compared with 67% Cr restriction.
The present study also demonstrated that serum
insulin levels and HOMA-IR index were markedly increased in the
offspring of dams fed a LC diet at 16 weeks of age. Padmavathi
et al reported that maternal Cr restriction increased
fasting insulin (from 15 months) and HOMA-IR index (from 9 months),
whereas rehabilitation could not correct this effect (9). In a previous study, pups from
pregnant rats fed a calcium-deficient diet exhibited increased
insulin levels and HOMA-IR index at day 200 (32). Furthermore, at 12 months of age,
offspring from vitamin B12-restricted dams had higher fasting blood
insulin levels and HOMA-IR index (31).
Using a miRNA array and qPCR, the present study
indicated that a maternal LC diet downregulated miR-334b-5p
expression in the liver of male offspring. Zeng et al
revealed that miR-344-3p was downregulated in islets from diabetic
GK rats (33). Furthermore, in
the present study, a maternal LC diet downregulated miR-296-3p
expression in the liver of male offspring. In the pancreatic β-cell
line, MIN6, miR-296 was significantly downregulated by high glucose
treatment (34). In addition, a
maternal LC diet upregulated miR-122-3p expression in the liver of
male offspring; miR-122 is highly expressed in the liver and is
highly conserved in sequence (35). Serum miR-122 levels are markedly
increased in newly diagnosed diabetic cats (36). A maternal LC diet also upregulated
miR-327 expression in the liver of male offspring. miR-327 has been
revealed to be upregulated in myocardial microvascular endothelial
cells from GK rats compared with Wistar rats (36).
In the present study, further bioinformatics
analysis aided in the interpretation of the biological function of
the differentially expressed miRNAs in glucose metabolism
regulation. According to the KEGG pathway enrichment analysis, the
significantly differentially expressed miRNAs (miR-327, miR-223-3p
and miR-466f-3p) in the LC/CON group served important roles in the
insulin signaling pathway.
In the insulin signaling pathway, Pik3r1 and
Pik3ca are target genes of miR-466f-3p (37–39). In addition, Akt1 and
Pik3r3 are target genes of miR-223-3p (40). One target of miR-327 is
Slc2a4 (Glut4) (39). In a previous study, Cr malate
improved Glut4 and Akt levels in the liver tissues of
T2D rats (26). In C2C12 skeletal
muscle cells, oligomannuronate Cr complexes may enhance GLUT4 and
the phosphatidylinositol 3-kinase (PI3K)/AKT signaling pathway
(25). Therefore, it may be
hypothesized that a maternal LC diet upregulates miR-327,
miR-466f-3p and miR-223-3p expression, thus inhibiting insulin
signaling (Fig. 9).
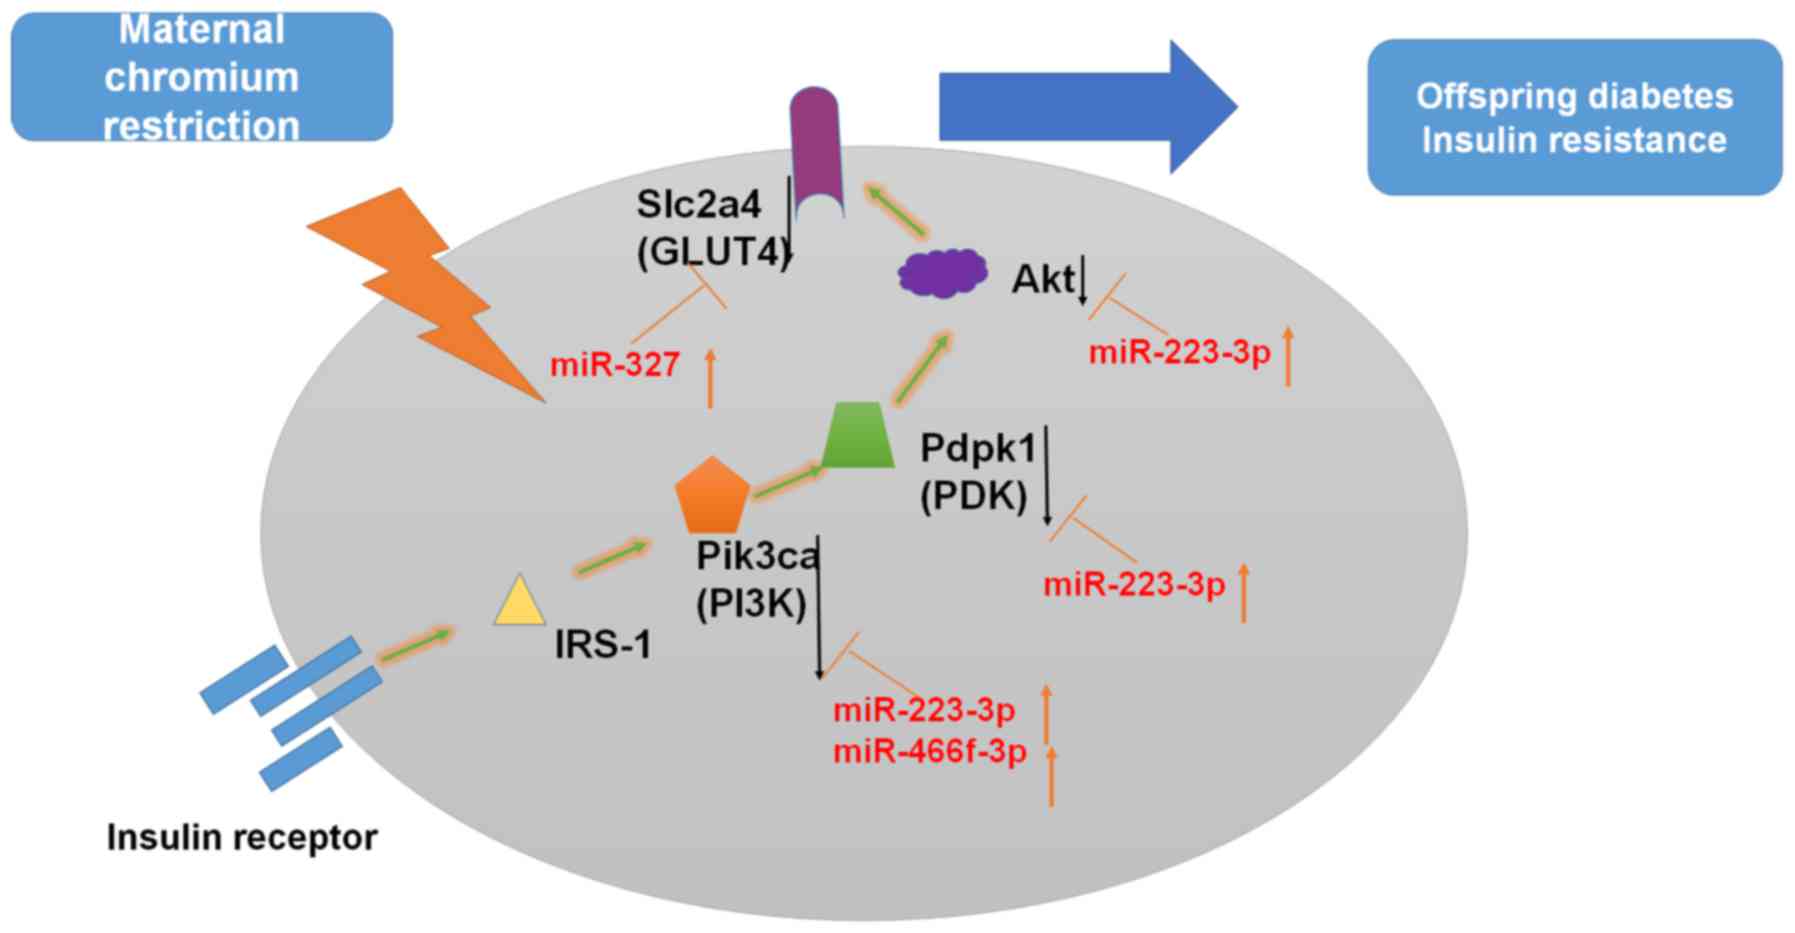 | Figure 9Possible underlying mechanism of
miRNA-regulatory networks. Insulin binding to its receptor induces
receptor tyrosine autophosphorylation and activation of
IRSs/PI3K/Akt signaling pathways. Modulation of gene expression is
indicated by black arrows. Akt, protein kinase B; Akt1,
thymoma viral proto-oncogene 1; GLUT4, glucose transporter 4; IRS,
insulin receptor substrate; miR/miRNA, microRNA; Pdpk1,
3-phosphoinositide dependent protein kinase 1; PI3K,
phosphatidylinositol 3-kinase; Pik3ca, phosphatidylinositol
3-kinase, catalytic, α polypeptide; Slc2a4, solute carrier
family 2 member 4. |
The PI3K/AKT signaling pathway is a classical
pathway that regulates insulin in glucose metabolism. This pathway
serves a role in glucose uptake by the liver, skeletal muscles and
adipose tissues (41,42). The insulin receptor signaling
pathway contributes to the development of diabetes. The
IRS-1/PI3K/Akt axis has an important role in the insulin receptor
signaling pathway through cascade phosphorylation (43,44). Inhibiting or blocking this pathway
may reduce the physiological effects of insulin, which lead to IR.
Ye et al demonstrated that hepatocytes in intrauterine
growth retardation rats with catch-up growth exhibited decreased
IRS1 and PI3K expression (45).
In addition, the PI3K p110β subunit, Akt1 proteins and
phosphorylated-Akt Ser473 are reduced in the offspring of low
protein-fed dams (46). A
previous study also reported that maternal protein restriction
leads a decrease in Akt1 (Ser473) phosphorylation in the livers of
offspring at postnatal day 130 (47). Catch-up growth following
intrauterine growth restriction reduces the expression of the PI3K
p110β subunit at 22 days old, and Akt phosphorylation and Akt-2
protein levels at 3 months in adipose tissue (48). In addition, maternal diabetes has
been revealed to decrease GLUT4 in the adipose and muscle tissues
of 10-week-old male offspring (49).
In conclusion, the present study confirmed that a
maternal LC diet caused glucose intolerance and IR in male
offspring. The present study is the first, to the best of our
knowledge, to demonstrate that a maternal LC diet induces miRNA
dysfunction in the liver samples of offspring. In particular, a
maternal LC diet may upregulate the expression of miR-327,
miR-466f-3p and miR-223-3p, thus inhibiting the insulin signaling
pathway in male offspring. In the future, scientists should aim to
identify interventions for maternal Cr restriction to affect
glucose metabolism in offspring. This treatment will benefit
mothers and the next generation.
Glossary
Abbreviations
Abbreviations:
|
Akt1
|
thymoma viral proto-oncogene 1
|
|
AUC
|
area under the curve
|
|
CON
|
control
|
|
Cr
|
chromium
|
|
GK
|
Goto-Kakizaki
|
|
Glut4
|
glucose transporter 4
|
|
GO
|
Gene Ontology
|
|
HOMA-IR
|
homeostasis model assessment of
insulin resistance
|
|
IR
|
insulin resistance
|
|
IRS1
|
insulin receptor substrate 1
|
|
KEGG
|
Kyoto Encyclopedia of Genes and
Genomes
|
|
LC
|
low chromium
|
|
miRNA
|
microRNA
|
|
NC
|
negative control
|
|
OGTT
|
oral glucose tolerance test
|
|
Pdpk1
|
3-phosphoinositide dependent protein
kinase 1
|
|
Pik3ca
|
phosphatidylinositol 3-kinase,
catalytic, α polypeptide
|
|
Pik3r1
|
phosphatidylinositol 3-kinase,
regulatory subunit, polypeptide
|
|
Pik3r3
|
phosphatidylinositol 3-kinase,
regulatory subunit, polypeptide 3
|
|
PKB
|
protein kinase B
|
|
Slc2a4
|
solute carrier family 2 member 4
|
|
T2D
|
type 2 diabetes
|
Acknowledgments
The present study was supported by the National
Natural Science Foundation of China (grant nos. 81170736 and
81570715), the National Natural Science Foundation for Young
Scholars of China (grant no. 81300649), the China Scholarship
Council foundation (grant no. 201308110443), the PUMC Youth Fund
(grant no. 33320140022), the Fundamental Research Funds for the
Central Universities, and the Scientific Activities Foundation for
Selected Returned Overseas Professionals of Human Resources and
Social Security Ministry. The authors would like to thank Beijing
Compass Biotechnology Company for technical assistance with the
miRNA microarray experiments.
The normalized data and raw 'cel' files from the
miRNA array are available at the NCBI GEO website under the series
record GSE82026 (http://www.ncbi.nlm.nih.gov/geo/query/acc.cgi?token=upsxikamhpgvbmn&acc=GSE82026;
private website only for reviewers).
References
|
1
|
Diabetes Atlas IDF. 7th edition.
International Diabetes Federation; 2015
|
|
2
|
Hales CN, Barker DJ, Clark PM, Cox LJ,
Fall C, Osmond C and Winter PD: Fetal and infant growth and
impaired glucose tolerance at age 64. BMJ. 303:1019–1022. 1991.
View Article : Google Scholar : PubMed/NCBI
|
|
3
|
Hales CN and Barker DJ: Type 2
(non-insulin-dependent) diabetes mellitus: The thrifty phenotype
hypothesis. Diabetologia. 35:595–601. 1992. View Article : Google Scholar : PubMed/NCBI
|
|
4
|
de Rooij SR, Painter RC, Phillips DI,
Osmond C, Michels RP, Godsland IF, Bossuyt PM, Bleker OP and
Roseboom TJ: Impaired insulin secretion after prenatal exposure to
the Dutch famine. Diabetes Care. 29:1897–1901. 2006. View Article : Google Scholar : PubMed/NCBI
|
|
5
|
Food and Nutrition Board Recommended
Dietary Allowances. National Research Council, National Academy of
Sciences; Washington DC: 2000
|
|
6
|
Jeejeebhoy KN, Chu RC, Marliss EB,
Greenberg GR and Bruce-Robertson A: Chromium deficiency, glucose
intolerance, and neuropathy reversed by chromium supplementation,
in a patient receiving long-term total parenteral nutrition. Am J
Clin Nutr. 30:531–538. 1977. View Article : Google Scholar : PubMed/NCBI
|
|
7
|
Anderson RA: Chromium, glucose intolerance
and diabetes. J Am Coll Nutr. 17:548–555. 1998. View Article : Google Scholar : PubMed/NCBI
|
|
8
|
Freund H, Atamian S and Fischer JE:
Chromium deficiency during total parenteral nutrition. JAMA.
241:496–498. 1979. View Article : Google Scholar : PubMed/NCBI
|
|
9
|
Padmavathi IJ, Rao KR and Raghunath M:
Impact of maternal chromium restriction on glucose tolerance,
plasma insulin and oxidative stress in WNIN rat offspring. J Mol
Endocrinol. 47:261–271. 2011. View Article : Google Scholar : PubMed/NCBI
|
|
10
|
Waterland RA and Jirtle RL: Early
nutrition, epigenetic changes at transposons and imprinted genes,
and enhanced susceptibility to adult chronic diseases. Nutrition.
20:63–68. 2004. View Article : Google Scholar
|
|
11
|
Zhang Q, Xiao XH, Zheng J, Li M, Yu M,
Ping F, Wang Z, Qi C, Wang T and Wang X: Maternal chromium
restriction modulates miRNA profiles related to lipid metabolism
disorder in mice offspring. Exp Biol Med (Maywood). 242:1444–1452.
2017. View Article : Google Scholar
|
|
12
|
Herrera BM, Lockstone HE, Taylor JM, Wills
QF, Kaisaki PJ, Barrett A, Camps C, Fernandez C, Ragoussis J,
Gauguier D, et al: MicroRNA-125a is over-expressed in insulin
target tissues in a spontaneous rat model of Type 2 Diabetes. BMC
Med Genomics. 2:542009. View Article : Google Scholar : PubMed/NCBI
|
|
13
|
Jordan SD, Krüger M, Willmes DM, Redemann
N, Wunderlich FT, Brönneke HS, Merkwirth C, Kashkar H, Olkkonen VM,
Böttger T, et al: Obesity-induced overexpression of miRNA-143
inhibits insulin-stimulated AKT activation and impairs glucose
metabolism. Nat Cell Biol. 13:434–446. 2011. View Article : Google Scholar : PubMed/NCBI
|
|
14
|
Zhou B, Li C, Qi W, Zhang Y, Zhang F, Wu
JX, Hu YN, Wu DM, Liu Y, Yan TT, et al: Downregulation of miR-181a
upregulates sirtuin-1 (SIRT1) and improves hepatic insulin
sensitivity. Diabetologia. 55:2032–2043. 2012. View Article : Google Scholar : PubMed/NCBI
|
|
15
|
Ryu HS, Park SY, Ma D, Zhang J and Lee W:
The induction of microRNA targeting IRS-1 is involved in the
development of insulin resistance under conditions of mitochondrial
dysfunction in hepatocytes. PLoS One. 6:e173432011. View Article : Google Scholar : PubMed/NCBI
|
|
16
|
Jeong HJ, Park SY, Yang WM and Lee W: The
induction of miR-96 by mitochondrial dysfunction causes impaired
glycogen synthesis through translational repression of IRS-1 in
SK-Hep1 cells. Biochem Biophys Res Commun. 434:503–508. 2013.
View Article : Google Scholar : PubMed/NCBI
|
|
17
|
Dou L, Zhao T, Wang L, Huang X, Jiao J,
Gao D, Zhang H, Shen T, Man Y, Wang S, et al: miR-200s contribute
to interleukin-6 (IL-6)-induced insulin resistance in hepatocytes.
J Biol Chem. 288:22596–22606. 2013. View Article : Google Scholar : PubMed/NCBI
|
|
18
|
National Research Council Committee for
the Update of the Guide for the C and Use of Laboratory A: The
National Academies Collection: Reports funded by National
Institutes of Health Guide for the Care and Use of Laboratory
Animals. 8th (ed). National Academies Press (US) National Academy
of Sciences; Washington (DC): 2011
|
|
19
|
Yokomizo H, Inoguchi T, Sonoda N, Sakaki
Y, Maeda Y, Inoue T, Hirata E, Takei R, Ikeda N, Fujii M, et al:
Maternal high-fat diet induces insulin resistance and deterioration
of pancreatic β-cell function in adult offspring with sex
differences in mice. Am J Physiol Endocrinol Metab.
306:E1163–E1175. 2014. View Article : Google Scholar : PubMed/NCBI
|
|
20
|
Chou CH, Chang NW, Shrestha S, Hsu SD, Lin
YL, Lee WH, Yang CD, Hong HC, Wei TY, Tu SJ, et al: miRTarBase
2016: Updates to the experimentally validated miRNA-target
interactions database. Nucleic Acids Res. 44:D239–D247. 2016.
View Article : Google Scholar :
|
|
21
|
Livak KJ and Schmittgen TD: Analysis of
relative gene expression data using real-time quantitative PCR and
the 2(-Delta Delta C(T)) Method. Methods. 25:402–408. 2001.
View Article : Google Scholar
|
|
22
|
Dennis G Jr, Sherman BT, Hosack DA, Yang
J, Gao W, Lane HC and Lempicki RA: DAVID: Database for annotation,
visualization, and integrated discovery. Genome Biol. 4:32003.
View Article : Google Scholar
|
|
23
|
Shannon P, Markiel A, Ozier O, Baliga NS,
Wang JT, Ramage D, Amin N, Schwikowski B and Ideker T: Cytoscape: A
software environment for integrated models of biomolecular
interaction networks. Genome Res. 13:2498–2504. 2003. View Article : Google Scholar : PubMed/NCBI
|
|
24
|
Król E and Krejpcio Z: Chromium(III)
propionate complex supplementation improves carbohydrate metabolism
in insulin-resistance rat model. Food Chem Toxicol. 48:2791–2796.
2010. View Article : Google Scholar : PubMed/NCBI
|
|
25
|
Hao C, Hao J, Wang W, Han Z, Li G, Zhang
L, Zhao X and Yu G: Insulin sensitizing effects of
oligomannuronate-chromium (III) complexes in C2C12 skeletal muscle
cells. PLoS One. 6:e245982011. View Article : Google Scholar : PubMed/NCBI
|
|
26
|
Feng W, Zhao T, Mao G, Wang W, Feng Y, Li
F, Zheng D, Wu H, Jin D, Yang L, et al: Type 2 diabetic rats on
diet supplemented with chromium malate show improved
glycometabolism, glycometabolism-related enzyme levels and lipid
metabolism. PLoS One. 10:e01259522015. View Article : Google Scholar : PubMed/NCBI
|
|
27
|
Feng W, Mao G, Li Q, Wang W, Chen Y, Zhao
T, Li F, Zou Y, Wu H, Yang L, et al: Effects of chromium malate on
glycometabolism, glycometabolism-related enzyme levels and lipid
metabolism in type 2 diabetic rats: A dose-response and curative
effects study. J Diabetes Investig. 6:396–407. 2015. View Article : Google Scholar : PubMed/NCBI
|
|
28
|
Racek J, Sindberg CD, Moesgaard S, Mainz
J, Fabry J, Müller L and Rácová K: Effect of chromium-enriched
yeast on fasting plasma glucose, glycated haemoglobin and serum
lipid levels in patients with type 2 diabetes mellitus treated with
insulin. Biol Trace Elem Res. 155:1–4. 2013. View Article : Google Scholar : PubMed/NCBI
|
|
29
|
Intapad S, Dasinger JH, Brown AD, Fahling
JM, Esters J and Alexander BT: Glucose intolerance develops prior
to increased adiposity and accelerated cessation of estrous
cyclicity in female growth-restricted rats. Pediatr Res.
79:962–970. 2016. View Article : Google Scholar : PubMed/NCBI
|
|
30
|
Venu L, Kishore YD and Raghunath M:
Maternal and perinatal magnesium restriction predisposes rat pups
to insulin resistance and glucose intolerance. J Nutr.
135:1353–1358. 2005. View Article : Google Scholar : PubMed/NCBI
|
|
31
|
Bringhenti I, Schultz A, Rachid T, Bomfim
MA, Mandarim- de-Lacerda CA and Aguila MB: An early fish
oil-enriched diet reverses biochemical, liver and adipose tissue
alterations in male offspring from maternal protein restriction in
mice. J Nutr Biochem. 22:1009–1014. 2011. View Article : Google Scholar
|
|
32
|
Takaya J, Yamanouchi S and Kaneko K: A
calcium-deficient diet in rat dams during gestation and nursing
affects hepatic 11β-hydroxysteroid dehydrogenase-1 expression in
the offspring. PLoS One. 9:e841252014. View Article : Google Scholar
|
|
33
|
Zeng LQ, Wei SB, Sun YM, Qin WY, Cheng J,
Mitchelson K and Xie L: Systematic profiling of mRNA and miRNA
expression in the pancreatic islets of spontaneously diabetic
Goto-Kakizaki rats. Mol Med Rep. 11:67–74. 2015. View Article : Google Scholar
|
|
34
|
Tang X, Muniappan L, Tang G and Ozcan S:
Identification of glucose-regulated miRNAs from pancreatic {beta}
cells reveals a role for miR-30d in insulin transcription. RNA.
15:287–293. 2009. View Article : Google Scholar :
|
|
35
|
Tsai WC, Hsu SD, Hsu CS, Lai TC, Chen SJ,
Shen R, Huang Y, Chen HC, Lee CH, Tsai TF, et al: MicroRNA-122
plays a critical role in liver homeostasis and
hepatocarcinogenesis. J Clin Invest. 122:2884–2897. 2012.
View Article : Google Scholar : PubMed/NCBI
|
|
36
|
Fleischhacker SN, Bauersachs S, Wehner A,
Hartmann K and Weber K: Differential expression of circulating
microRNAs in diabetic and healthy lean cats. Vet J. 197:688–693.
2013. View Article : Google Scholar : PubMed/NCBI
|
|
37
|
Zhang X, Zuo X, Yang B, Li Z, Xue Y, Zhou
Y, Huang J, Zhao X, Zhou J, Yan Y, et al: MicroRNA directly
enhances mitochondrial translation during muscle differentiation.
Cell. 158:607–619. 2014. View Article : Google Scholar : PubMed/NCBI
|
|
38
|
Loeb GB, Khan AA, Canner D, Hiatt JB,
Shendure J, Darnell RB, Leslie CS and Rudensky AY:
Transcriptome-wide miR-155 binding map reveals widespread
noncanonical microRNA targeting. Mol Cell. 48:760–770. 2012.
View Article : Google Scholar : PubMed/NCBI
|
|
39
|
Leung AK, Young AG, Bhutkar A, Zheng GX,
Bosson AD, Nielsen CB and Sharp PA: Genome-wide identification of
Ago2 binding sites from mouse embryonic stem cells with and without
mature microRNAs. Nat Struct Mol Biol. 18:237–244. 2011. View Article : Google Scholar : PubMed/NCBI
|
|
40
|
Chi SW, Zang JB, Mele A and Darnell RB:
Argonaute HITS-CLIP decodes microRNA-mRNA interaction maps. Nature.
460:479–486. 2009. View Article : Google Scholar : PubMed/NCBI
|
|
41
|
Cantley LC: The phosphoinositide 3-kinase
pathway. Science. 296:1655–1657. 2002. View Article : Google Scholar : PubMed/NCBI
|
|
42
|
Cusi K, Maezono K, Osman A, Pendergrass M,
Patti ME, Pratipanawatr T, DeFronzo RA, Kahn CR and Mandarino LJ:
Insulin resistance differentially affects the PI 3-kinase- and MAP
kinase-mediated signaling in human muscle. J Clin Invest.
105:311–320. 2000. View Article : Google Scholar : PubMed/NCBI
|
|
43
|
Aguirre V, Werner ED, Giraud J, Lee YH,
Shoelson SE and White MF: Phosphorylation of Ser307 in insulin
receptor substrate-1 blocks interactions with the insulin receptor
and inhibits insulin action. J Biol Chem. 277:1531–1537. 2002.
View Article : Google Scholar
|
|
44
|
Yamauchi T, Kaburagi Y, Ueki K, Tsuji Y,
Stark GR, Kerr IM, Tsushima T, Akanuma Y, Komuro I, Tobe K, et al:
Growth hormone and prolactin stimulate tyrosine phosphorylation of
insulin receptor substrate-1, -2, and -3, their association with
p85 phosphatidylinositol 3-kinase (PI3-kinase), and concomitantly
PI3-kinase activation via JAK2 kinase. J Biol Chem.
273:15719–15726. 1998. View Article : Google Scholar : PubMed/NCBI
|
|
45
|
Ye J, Zheng R, Wang Q, Liao L, Ying Y, Lu
H, Cianflone K, Ning Q and Luo X: Downregulating SOCS3 with siRNA
ameliorates insulin signaling and glucose metabolism in hepatocytes
of IUGR rats with catch-up growth. Pediatr Res. 72:550–559. 2012.
View Article : Google Scholar : PubMed/NCBI
|
|
46
|
Martin-Gronert MS, Fernandez-Twinn DS,
Bushell M, Siddle K and Ozanne SE: Cell-autonomous programming of
rat adipose tissue insulin signalling proteins by maternal
nutrition. Diabetologia. 59:1266–1275. 2016. View Article : Google Scholar : PubMed/NCBI
|
|
47
|
Sohi G, Revesz A and Hardy DB: Nutritional
mismatch in postnatal life of low birth weight rat offspring leads
to increased phosphorylation of hepatic eukaryotic initiation
factor 2α in adulthood. Metabolism. 62:1367–1374. 2013. View Article : Google Scholar : PubMed/NCBI
|
|
48
|
Berends LM, Fernandez-Twinn DS,
Martin-Gronert MS, Cripps RL and Ozanne SE: Catch-up growth
following intra-uterine growth-restriction programmes an
insulin-resistant phenotype in adipose tissue. Int J Obes.
37:1051–1057. 2013. View Article : Google Scholar
|
|
49
|
Kamel MA, Helmy MH, Hanafi MY, Mahmoud SA
and Abo Elfetooh H: Impaired peripheral glucose sensing in F1
offspring of diabetic pregnancy. J Physiol Biochem. 70:685–699.
2014. View Article : Google Scholar : PubMed/NCBI
|
|
50
|
Reeves PG: Components of the AIN-93 Diets
as improvements in the AIN-96A diet. J Nutr. 127:838S–841S.
1997.
|