Introduction
Hypertrophic scar (HS), a pathological response to
skin wound healing, is characterized by the abnormal proliferation
of fibroblasts and the excessive deposition of collagen (1). The formation of HS may seriously
affect the bodily function and/or appearance of patients (2). A thorough understanding of the
pathophysiology and clinical characteristics of HS may help
determine the most appropriate treatment strategy, but at present,
there is no consensus in terms of a generally accepted treatment
regimen (3). Therefore, a more
in-depth understanding of the pathophysiological process in the
formation of HS may improve the selection process of appropriate
treatments. Studies on long noncoding (lncRNA) have been emerging,
based on which it may be hypothesized that lncRNAs have a key role
in the development and outcome of HS (4).
lncRNAs are non-protein-coding transcripts of
>200 nucleotides in length (5). According to their genomic position
relative to protein-coding genes, lncRNAs may be divided into six
categories: Exon sense-overlapping, intron-sense overlapping,
natural antisense, bidirectional, intronic anti-sense and
intergenic (6). Aggravating
evidence indicates that lncRNAs regulate gene expression at the
transcriptional and post-transcriptional level, and participate in
various biological processes, including chromatin modification, DNA
synthesis, cell proliferation, differentiation and apoptosis
(7). In addition, the
dysregulation of lncRNAs is closely associated with various human
diseases, including cancer, as well as neurological and
cardiovascular diseases (8). Wang
et al (9) indicated that
several lncRNAs, including HOXA distal transcript antisense
RNA-005, RP11-567G11.1 and metastasis-associated lung
adenocarcinoma transcript 1 (MALAT1), are differentially expressed
in pancreatic cancer tissues compared with those in healthy
controls, implying their potential as diagnostic or prognostic
biomarkers in pancreatic cancer. It has been reported that the
perturbation of the expression of certain lncRNAs, including MALAT1
(10), HOX transcript anti-sense
RNA (11) and hypoxia-inducible
factor 1α-antisense RNA 2 (12),
is pivotally involved in central nervous system pathologies,
including glioblastoma. Li et al (13) reported that lncRNA8975-1 affected
HS by inhibiting the proliferation of fibroblasts, which reduced
the expression of α-smooth muscle actin (SMA) and collagens. It has
been demonstrated that miRNA-21 and miRNA200b regulate the
formation of HS by participating in the transforming growth factor
β (TGF-β)/Smad protein signalling pathway (14). Furthermore, overexpression of
miR-29b was reported to significantly reduce the expression levels
of collagen type I α1 chain (COL1A1) and α-SMA, as well as to
inhibit myofibroblast-like cell proliferation and induce apoptosis,
suggesting that miR-29b may be involved in scarring and has a
significant anti-fibrosis effect (15). An extensive network of
interactions involving competing endogenous RNAs (ceRNAs) has been
identified, among which lncRNAs control the repressive effect of
miRNA on mRNA through competitively binding to the miRNA's binding
sites (16). However, the roles
of lncRNAs in HS remain largely elusive. In the present study,
lncRNA and mRNA expression profiles in fibroblasts derived from HS
and normal skin tissues were compared by using an Arraystar Human
LncRNA Microarray v4.0 (Arraystar Inc., Rockville, MD, USA). The
significant differential expression of representative mRNAs and
lncRNAs was further confirmed using reverse
transcription-quantitative polymerase chain reaction (RT-qPCR).
Gene Ontology (GO) enrichment and Kyoto Encyclopedia of Genes and
Genomes (KEGG) pathway analyses were then performed. The University
of California Santa Cruz (UCSC) Genome Browser (www.genome.ucsc.edu) and the basic local alignment
search tool (BLAST; https://blast.ncbi.nlm.nih.gov/Blast.cgi) were then
used to identify the indirect association of lncRNAs and proteins
as well as possible homologous sequences, and Targetscan
(targetscan.org) was then used to identify miRNAs
that may bind to these homologous sequences in order to further
verify the correlation using an lncRNA-mRNA coexpression network.
The present study assessed the possible roles of ceRNAs in HS and
the underlying mechanism, and provided a novel way of thinking and
theoretical basis to further elucidate the pathological mechanisms
of the formation of HS, which may provide approaches for their
prevention.
Materials and methods
Fibroblast isolation and cell
culture
The present study was approved by Ethics Committee
of the First Affiliated Hospital of Nanchang University (Nanchang,
China). All patients provided written informed consent in advance.
HS and corresponding normal skin tissues were obtained from 3 male
patients (1–26 years old) who received surgery at the First
Affiliated Hospital of Nanchang University (Nanchang, China) from
January 2017 to June 2017. Each patient demonstrated extensive
areas of hypertrophic scar, which manifested as raised,
erythematous, pruritic and thickened scars restricted to the injury
site. Individuals with keloids, open wounds and/or infected skin
were excluded from the present study. None of the patients had
received any previous treatment for HS. During the surgery, the HS
was completely excised and normal skin tissue was obtained after
trimming.
HS tissue and normal skin specimens were
individually rinsed with PBS and the subcutaneous tissue and part
of the dermis were cut off with ophthalmic scissors. Tissues were
placed in a culture dish and digested in 0.25% trypsin-EDTA (Gibco;
Thermo Fisher Scientific, Inc., Waltham, MA, USA) at 4°C for 10–12
h. The epidermis was completely removed with tweezers and the
remaining dermis was cut into 1×1 mm pieces with ophthalmic
scissors. Dermal tissue pieces were attached to a Petri dish,
followed by addition of DMEM with 10% fetal bovine serum (GE
Healthcare Life Sciences, Logan, UT, USA) and incubation at 37°C in
a humidified atmosphere containing 5% CO2. Upon
confluency, cells were digested with 0.25% trypsin-EDTA and
subsequently passaged. The fibroblasts at passage 3 (P3) were used
for the experiments. The fibroblasts derived from HS tissue were
labeled as 'BH' in the experimental group and the fibroblasts
derived from normal skin were labeled as 'ZC' as the control
group.
RNA extraction and quality control
When the third passage of cells had been cultured
for 48 h, total RNA was extracted with TRIzol (Life Sciences;
Thermo Fisher Scientific, Inc.). The absorbance of the RNA at 260,
280 and 230 nm (A260, A280 and A230, respectively) was determined
using a NanoDrop 1000 spectrophotometer (Thermo Fisher Scientific,
Inc.). The A260/A280 and A260/A230 ratios were calculated to
determine the concentration and evaluate the purity. The purity and
integrity of total RNA in the two groups was confirmed using
formaldehyde-denatured gel electrophoresis.
Microarray analysis
Following the above procedure, the total RNA samples
were pooled and submitted to the Kang Cheng Bio-Tech Inc.
(Shanghai, China) where they were assessed using the Arraystar
human LncRNA chip (v4.0). This method is able to detect 40,173
lncRNAs, including 7,506 lncRNAs whose function has been
comprehensively assessed and 32,667 frequently screened, highly
reliable lncRNAs. The above lncRNAs were selected based on public
transcriptome databases, including Refseq (https://www.ncbi.nlm.nih.gov/refseq/), UCSC Genome
Browser (genome.ucsc.edu) and Ensembl (https://www.ensembl.org/index.html), and high
impact factor papers. Also included were 20,730 protein transcripts
derived from Universal Protein Resource (http://www.uniprot.org/). Each transcript is
represented by a specific exon or splice probe, which is accurately
detected by the probe. The chip also includes positive probes
(housekeeping genes) and negative probes for hybridization quality
monitoring. The ribosomal RNA was first removed from 1 µg
total RNA according to the experimental procedure of the mRNA-ONLY™
Eukaryotic mRNA Isolation Kit (Epicentre, Madison, WI, USA) and
then expanded using a double-stranced complementary DNA synthesis
kit provided by Qiagen (Hilden, Germany) for RT. An Agilent
Monochromatic DNA labeling kit (Agilent Technologies, Inc., Santa
Clara, CA, USA) was used for fluorescent labelling and Agilent
hybridization kit (Agilent Technologies, Inc.) was used for chip
hybridization. A spectrophotometer was used to detect the
efficiency of fluorescent labeling to ensure the reliability of the
experimental results of the chip. The chips were hybridized and
rinsed, and then scanned on an Agilent G2565BA scanner (Agilent
Technologies, Inc.). The raw data were processed by Agilent Feature
Extraction v11.0.1.1 software and analyzed using AgilentGeneSpring
GX v12.1 software (Agilent Technologies, Inc.).
GO analysis
A list of upregulated and downregulated
differentially expressed genes was prepared and imported into the
GO database (geneontology.org), and calculation
for human species was selected. The P-values for the enrichment of
GO terms were calculated by the default statistical algorithm of
the GO analysis database. The smaller the P-value, the more
significant is the role of the GO term, and the terms with P≤0.05
were considered to be statistically significant. The negative base
10 logarithm of the P-value resembled the enrichment score, which
signifies the probability that the differentially expressed mRNA is
enriched in the term entry. The higher the enrichment score the
more important is the entry. Significantly enriched features were
sorted in a descending order, and the GO enrichment histogram was
plotted.
Pathway analysis
The data were imported into the Kyoto Encyclopedia
of Genes and Genomes (KEGG) database (genome.jp/kegg/), and the
human species was selected for calculation. The significance score
of differential gene enrichment in each pathway entry was
calculated by the system default statistical test to obtain
significant P-values. Biological pathways with P≤0.05 were
identified as being significant, and the smaller the P-value, the
more significant the biological pathway. Enrichment score were
calculated as above and had an equivalent meaning within the
system-derived specific signaling pathways and data. Pathways were
ranked in an ascending order according to their P-values, and the
Log P histogram of KEGG pathways was plotted.
Reverse transcription-quantitative
polymerase chain reaction (RT-qPCR)
RT-qPCR analysis was performed to validate selected
differently expressed lncRNAs and mRNAs identified by microarray
analysis. The sequences of PCR primers are listed in Table I, which was designed by Primer 5.0
(Premier Biosoft International, Palo Alto, CA, USA) Firstly, cDNA
was synthesized by using a Gene Amp PCR system 9700 (Applied
Biosystems; Thermo Fisher Scientific, Inc.). RT was performed in a
20 µl reaction containing 200 ng total RNA, 0.3 µl 1
µM RT primer, 2 µl 2.5 mM dNTP (HyTest Ltd., Turku,
Finland), 2 µl 10× RT buffer (Epicentre; Illumina, Inc., San
Diego, CA, USA), 1 µl 50 U/µl RT enzyme (Epicentre;
Illumina, Inc.), 0.3 µl 40 U/µl RNase inhibitor
(Epicentre; Illumina, Inc.), 20 µl nuclease free water and
0.2 µl MMLV High Performance Reverse Transcriptase
(Epicentre; Illumina, Inc.). The stem-loop RT reaction was
performed at 16°C for 30 min, followed by 42°C for 30 min and 85°C
for 5 min. Then, RT-qPCR was performed using the SYBR Green I
RT-PCR kit (Life Sciences; Thermo Fisher Scientific, Inc.) and
GAPDH was used as an internal control, with the following reaction
profile: Predenaturation at 95°C for 10 sec, followed by 40 cycles
of 95°C for 10 sec and 60°C for 1 min. The melting curve analysis
was used to determine the reaction specificity. The selected
lncRNAs and mRNAs were normalized to GAPDH as the internal control
using the 2−ΔΔCq method (17).
 | Table IPrimers used for polymerase chain
reaction. |
Table I
Primers used for polymerase chain
reaction.
| GenBank ID | Gene name | Sequence | Annealing
temperature (°C) | Length (bp) |
|---|
| GAPDH | F:
5′-GGGAAACTGTGGCGTGAT-3′ | 60 | 299 |
| R:
5′-GAGTGGGTGTCGCTGTTGA-3′ | | |
| NM_198721 | COL25A1 | F:
5′-CCTACACCACCCATTGAAAC-3′ | 60 | 184 |
| R:
5′-TCTCCGCCACCTTATCTCT-3′ | | |
| NM_020987 | ANK3 | F:
5′-TTTATCAGCCAGTCCCAGTT-3′ | 60 | 62 |
| R:
5′-TTGTTCATCGTCCACTTCC-3′ | | |
| NR_046402 | POLD1 | F:
5′-TTCATTCCAGTCCAAGCAGA-3′ | 60 | 127 |
| R:
5′-GGCATTGAGCGTGTAGGAG-3′ | | |
| NM_024719 | GRTP1 | F:
5′-CCAACTTTCACTGCTTTCCT-3′ | 60 | 198 |
| R:
5′-ACAAACCCACACTCACATTTT-3′ | | |
| NR_046583 | COL4A2-AS1 | F:
5′-CCTTTTGTGACTGGCTTCTT-3′ | 60 | 104 |
| R:
5′-CCAGCCTTTATTCGGTCTT-3′ | | |
| NM_000689 | ALDH1A1 | F:
5′-ATTTCCCGTTGGTTATGCT-3′ | 60 | 86 |
| R:
5′-AGTTTGCTCTGCTGGTTTG-3′ | | |
|
ENST00000559026 | RP11-59H7.3 | F:
5′-TCAAAAGGCTAGAAATTGTGC-3′ | 60 | 131 |
| R:
5′-CTCCAAAACTGCTGAAACTACA-3′ | | |
| NR_125715 | TGFB2-OT1 | F:
5′-CTCATGCTGGGGTTAATAGAA-3′ | 60 | 114 |
| R:
5′-GCTGCTCTTTAGGTGAAACTG-3′ | | |
Analysis of lncRNA subgroups and
sequences
LncRNA may be divided into different subclasses,
including antisense lncRNAs, lncRNA with enhancer function, large
intermediate noncoding RNA and exon overlap lncRNA. As lncRNA
sequences and transcription sites may affect the mode of action,
online software, including UCSC and BLAST, were used to further
analyze the lncRNA sequences and their adjacent genes in order to
elucidate the mode of action of these lncRNAs. Among different
types of lncRNA, antisense lncRNA has been studied most
extensively, with >30% of annotated human transcripts having
been assigned corresponding antisense lncRNAs, the interaction of
which may occur at the level of complementary base pairing
mechanisms or post-transcriptional regulation of the corresponding
target mRNA, and thus having a biological function.
miRNA target prediction of NR_125715 and
NR_046402
The abovementioned BLAST analysis indicated that
NR_125715 and TGF-β2 (TGFB2), as well as NR_046402 and DNA
polymerase δ1, catalytic subunit (POLD1) had 100% similarity with a
homologous gene base sequence, and certain studies have indicated
that specific lncRNAs compete with certain mRNAs to bind to the
same miRNA, which regulates gene expression levels. In order to
further analyze the underlying mechanism of action, TargetScan
online software was used to predict the possible binding of
NR_125715 and NR_046402 miRNAs. The binding site of the miRNA for
the target gene is located at its 5′ end encompassing nucleotides
2–8 (2–8 nt), i.e., the 'seed sequence' consisting of 7
nucleotides. The complementarity of the miRNA seed sequence and the
target gene is the major mechanism for regulating gene expression,
i.e., if the two are completely complementary, the target gene is
degraded; if there are one or two base mismatches, the degree of
complementarity is low and the translation of the target mRNA is
inhibited. In TargetScan, the pairing of seed regions is divided
into six types: The 8mer is fully aligned with the target gene at
2–8 nt, and the additional target gene corresponds to the first
nucleotide of the miRNA at the A; 7mer-1a refers to the pair of the
first 2–7 nt of the miRNA and the complementary target gene, plus
the target gene corresponding to the first nucleotide of the miRNA
at the A; the 7mer-m8 is the 2–8 nt of the miRNA completely
matching with the target gene; the 6mer is the 2–7 nt of the miRNA
exactly matching the target gene; the offset 6mer is the 3–8 nt of
the miRNA fully matched with the target gene; and 'imperfect'
refers to the 2–7 nt of the miRNA with the G:U pair being
mismatched or deleted. The order of the binding according to the
reliability score is as follows: 8mer > 7mer-m8 > 7mer-A1
> 6mer > offset 6mer > imperfect, where the 8mer is more
site-specific than the 6mer, which is used to search for target
genes with higher sensitivity, but which corresponds with a decline
in specificity (18). The
context++ model was more predictive than any published model and at
least as predictive as the most informative in vivo
crosslinking approaches. As the engine powering the latest version
of TargetScan (v7.0; targetscan.org), this model provides a valuable
resource for placing the miRNAs of human, mouse, zebrafish, and
other vertebrate species into their respective gene-regulatory
networks (19).
Construction of the coding-noncoding
co-expression (CNC) network
In order to obtain more credible biological
functions, the lncRNA-mRNA co-expression network of two important
lncRNAs, including NR_125715 and NR_046402, was built. The CNC
network was constructed based on the Pearson correlation analysis.
LncRNAs and mRNAs with an absolute value of the Pearson correlation
coefficient of >0.90 were selected to construct the network
using Cytoscape software (http://www.cytoscape.org/).
Statistical analysis
Student's t-test was used for statistical analysis
to compare the microarray data between the two groups. The fold
changes were calculated and subjected to Student's t-tests to
analyze the statistical significance of differences in expression.
The false discovery rate was calculated to correct the P-values.
Differential expression of lncRNAs and mRNAs was defined by setting
the threshold for fold changes as >2.0 and <0.5, as well as
P<0.05. P<0.05 was considered to indicate a statistically
significant difference. Statistical analyzes were performed using
SPSS version 13 software (SPSS, Inc., Chicago, IL, USA).
Results
Biological characteristics of the
fibroblasts
The fibroblasts were subjected to primary tissue
culture in petri dishes via the tissue adherence method and the
cells used in the experiment were of P3. The cells from the two
groups were observed under an inverted phase contrast microscope.
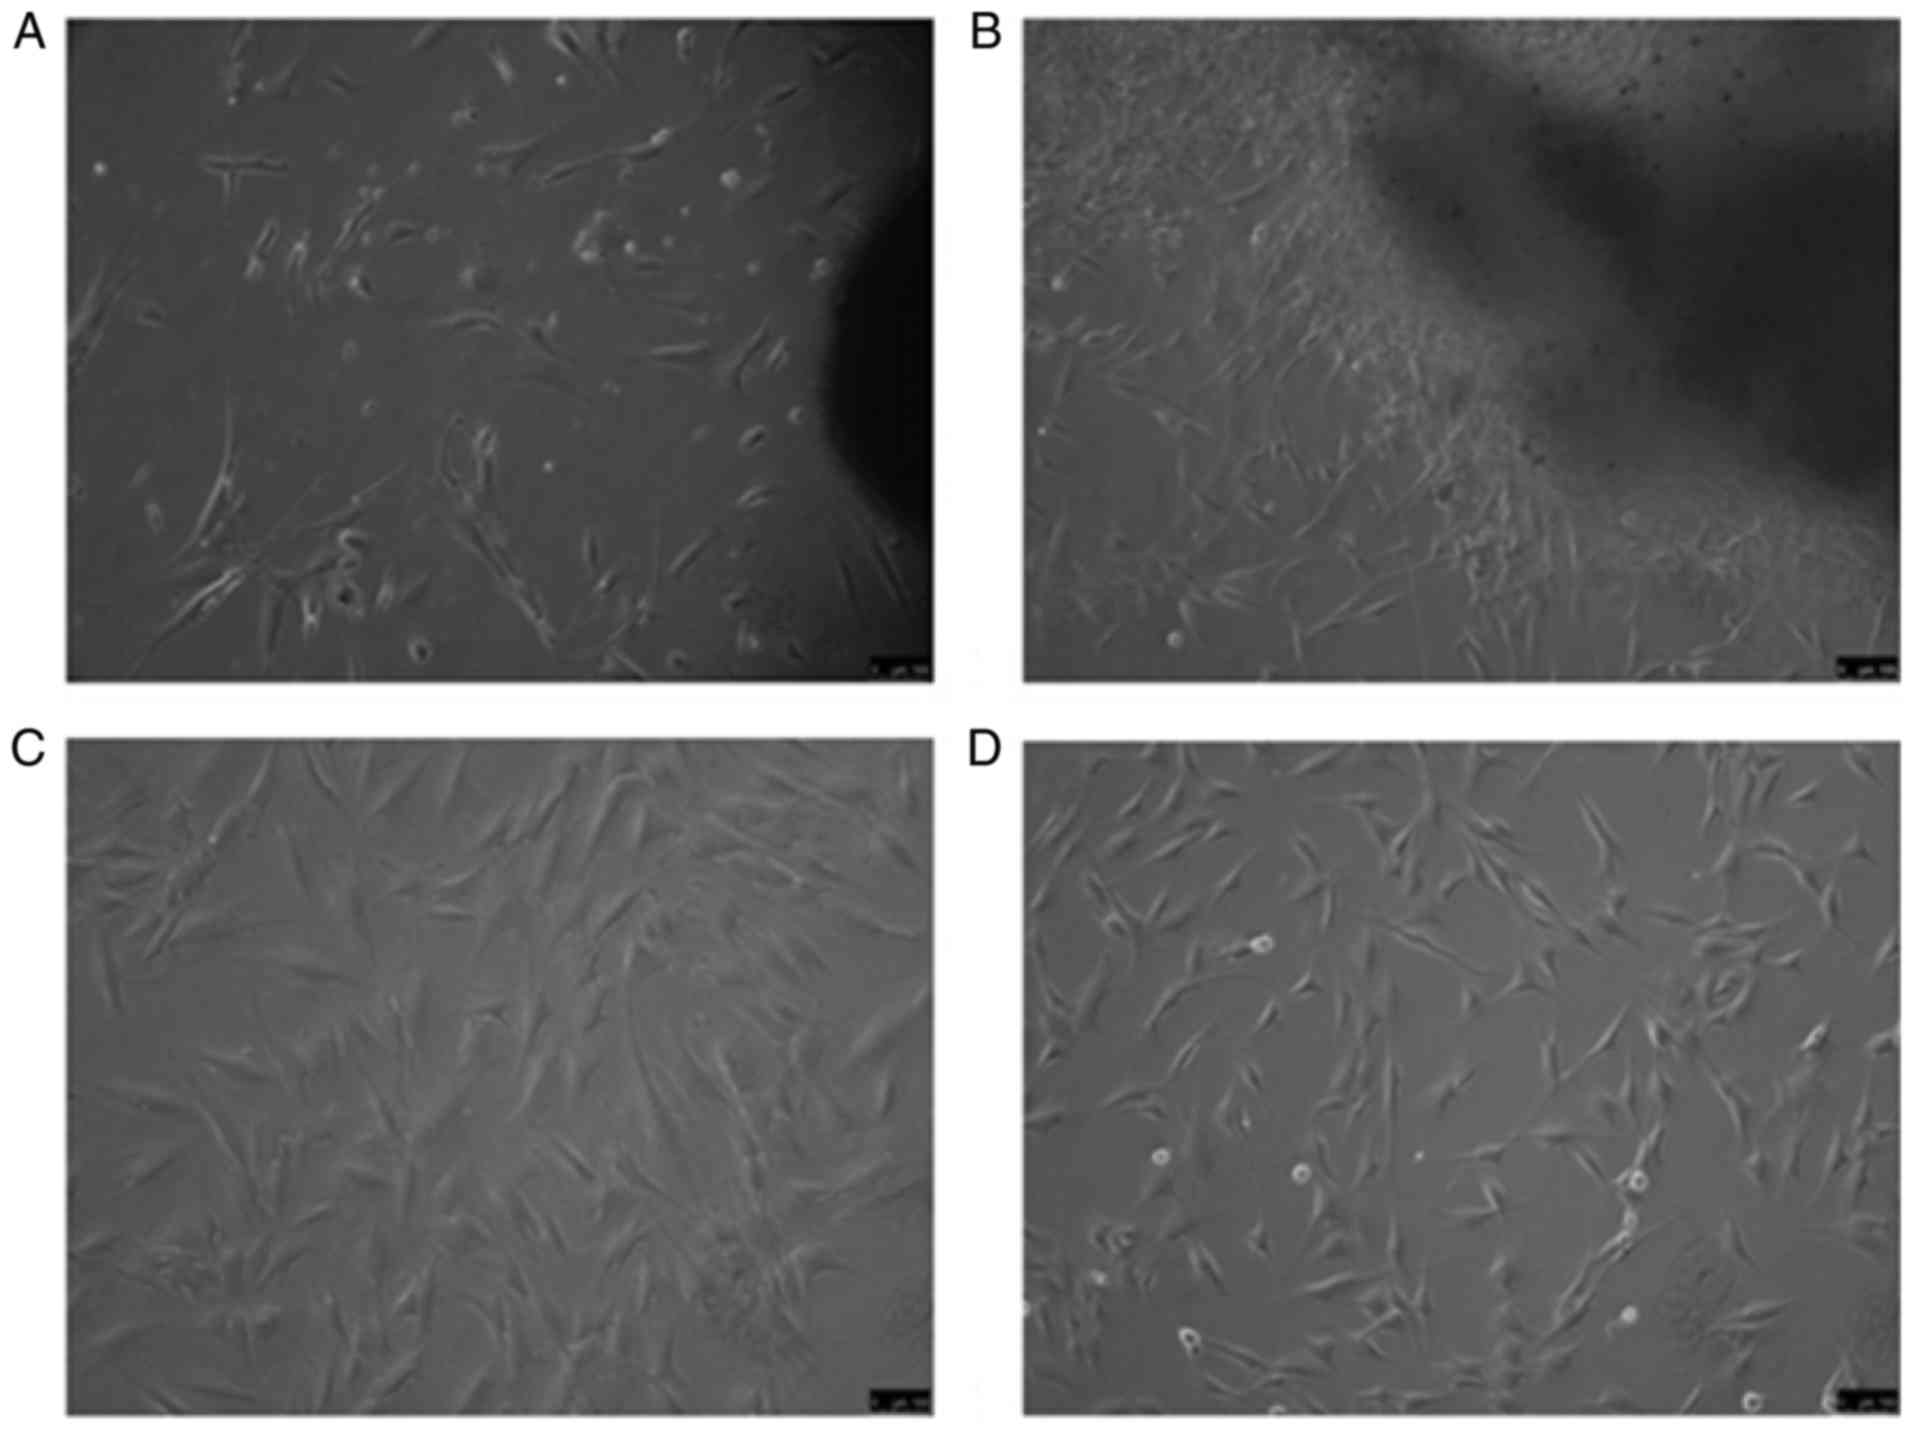
Fig. 1A diplays fibroblasts from
HS tissue after 7 days of culture and Fig. 1B presents fibroblasts from normal
skin after 7 days, which exhibited a long spindle- or star-shaped
morphology. P3 fibroblasts from HS and normal skin tissues at the
same time points are displayed in Fig. 1C and D, respectively.
Quality control of total RNA
The A260/A280 ratios of RNA extracted from the two
groups were 1.86 and 1.92, respectively, which was within the
required range of 1.8–2.0, indicating no degradation and protein or
DNA contamination. The A260/A230 ratios were 2.35 and 2.40,
respectively, indicating no organic solvent contamination. Agarose
gel electrophoresis produced clear 18 and 28 S bands for the total
RNA, indicating that the sample was of good quality and suitable
for use in the subsequent lncRNA and mRNA analyses.
Overview of lncRNA and mRNA microarray
analysis
In the scanner the high-quality cRNA probe was
distributed uniformly. Subsequently, through sample labeling and
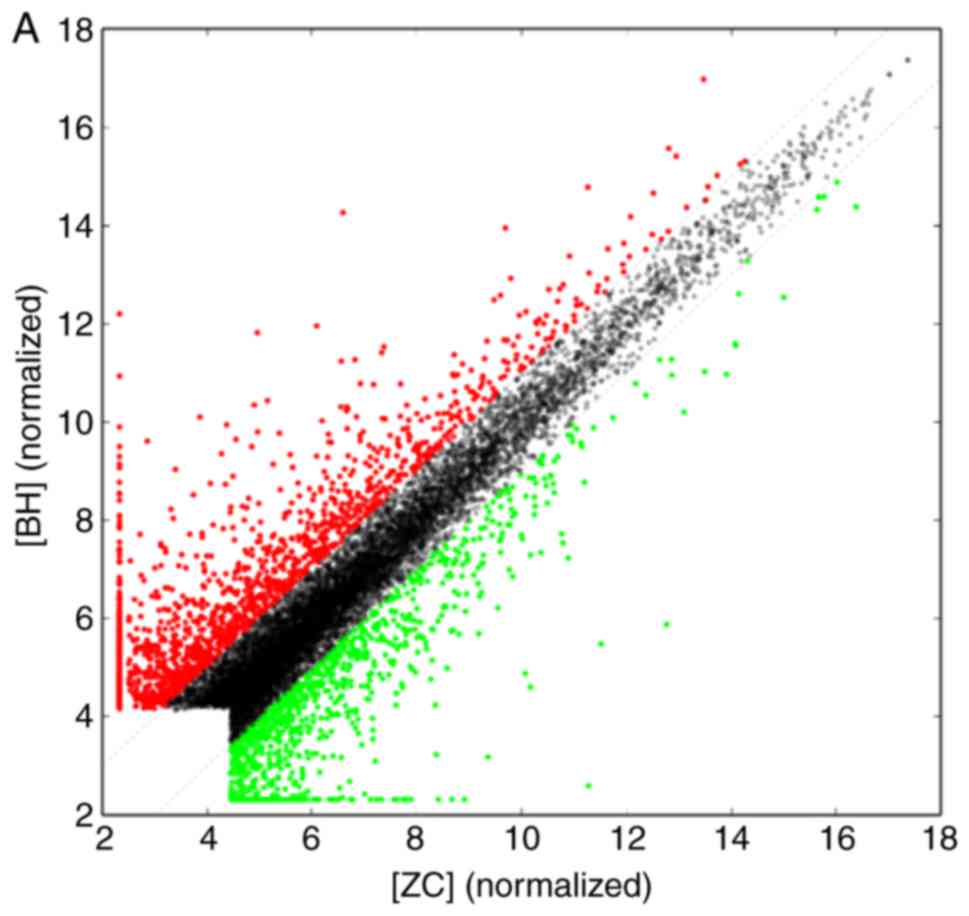
array hybridization, and scatter plot (Fig. 2) were obtained. The scatter plot
provided an overall indication of sample similarity between
individual transcripts. For a systematic comparison of lncRNA
expression between HS and normal skin, hierarchical clustering
analysis was performed and samples were arranged into groups based
on their expression levels. Taken together, these results suggested
a significant difference in lncRNA expression between HS and normal
skin.
Using microarray analysis, a total if 6,104 lncRNAs
and 2,952 mRNAs were identified to be differentially expressed in
fibroblasts derived from HS compared with those from normal skin
(|fold change| ≥2.0, P<0.05 and false discocery rate <0.05).
Among these, 3,709 lncRNAs and 1,424 mRNAs were upregulated in the
HS group, while 2,935 lncRNAs and 1,528 mRNAs were downregulated
(Table II), and various RNAs
were changed >20-fold (Tables
III and IV).
| Table IINumber of differentially expressed
RNAs between hypertrophic scar and normal skin fibroblasts. |
Table II
Number of differentially expressed
RNAs between hypertrophic scar and normal skin fibroblasts.
A, Long noncoding
RNA
|
|---|
| Aberrant RNAs
(n) | Fold change
|
|---|
| 2–10 | 10–20 | ≥20 |
|---|
| 6104 | | | |
| 3709
upregulated | 3368 | 244 | 97 |
| 2935
downregulated | 2293 | 63 | 39 |
B, mRNA
|
|---|
| Aberrant RNAs
(n) | Fold change
|
|---|
| 2–10 | 10–20 | ≥20 |
|---|
| 2952 | | | |
| 1424
upregulated | 1247 | 97 | 80 |
| 1528
downregulated | 1411 | 72 | 45 |
| Table IIImRNAs with >20 fold change. |
Table III
mRNAs with >20 fold change.
| GenBank ID | Gene name | Fold change |
|---|
| NM_014391 | ANKRD1 | +148.2 |
| NM_001165 | BIRC3 | +22.0 |
| NM_006894 | FMO3 | +57.606484 |
| NM_001147 | ANGPT2 | +154.5 |
| NM_005302 | GPR37 | −30.4 |
| NM_013381 | TRHDE | −104.6 |
| NM_003220 | TFAP2A | −41.4 |
| NM_000689 | ALDH1A1 | −219.6 |
| Table IVLong noncoding RNAs with >20-fold
change. |
Table IV
Long noncoding RNAs with >20-fold
change.
| ID | Gene name | Fold change | Mode of action |
|---|
| T348237 | G082118 | +87.2 | Intergenic |
| NR_121621 | LINC01605 | +24.9 | Intergenic |
| NR_024376 | FAM225B | +25.6 | Intergenic |
|
ENST00000522281 | RP11-44D19.1 | +107.7 | Intergenic |
| NR_040244 | LINC00547 | +21.3 | Intergenic |
| T331643 | G077712 | +20.5 | Intronic
antisense |
| NR_034138 | EPHA5-AS1 | +22.8 | Natural
antisense |
| T283696 | G066125 | −23.8 | Natural
antisense |
| NR_122071 | LOC399886 | −410.5 | Intergenic |
| NR_002161 | FAM224A | −81.7 | Intergenic |
|
ENST00000578967 | RP11-676J15.1 | −21.4 | Intergenic |
|
ENST00000587099 | RP11-384O8.1 | −32.2 | Intergenic |
|
ENST00000554032 | RP6-65G23.3 | −35.3 | Bidirectional |
| NR_024360 | ZFHX4-AS1 | −37.9 | Intronic
antisense |
|
ENST00000511165 | RP11-114H21.2 | −42.6 | Intergenic |
| NR_026836 | TRHDE-AS1 | −72.4 | Natural
antisense |
| NR_131213 | XLOC-007697 | −47.5 | Natural
antisense |
RT-qPCR validation results
Based on the characteristics of the differentially
expressed lncRNA, including fold changes, loci, nearby coding
genes, several candidate lncRNAs (including NR_125715, NR_046402,
NR_046583 and ENST00000559026) and mRNAs (including NM_19872,
NM_020987, NM_024719 and NM_000689) were selected for further
analysis to verify the results of the microarray analysis. As
presented in Table V, the RT-qPCR
results were consistent with the microarray data, which means that
the results of the microarray analysis were reliable and
stable.
| Table VHypertrophic scar vs. normal skin
fibroblasts expression ratios determined by microarray analysis and
RT-qPCR analysis. |
Table V
Hypertrophic scar vs. normal skin
fibroblasts expression ratios determined by microarray analysis and
RT-qPCR analysis.
| Experiment | COL25A1 | ANK3 | POLD1 | GRTP1 | COL4A2-AS1 | ALDH1A1 | RP11-59H7.3 | TGFB2-OT1 |
|---|
| Microarray | 15.23 | 118.72 | −2.76 | −28.83 | 3.91 | −219.65 | 2.22 | 8.07 |
| RT-qPCR | 53.86 | −59.87 | 0.15 | 0.10 | 6.80 | 0.00 | 9.54 | 7.72 |
GO and pathway analysis
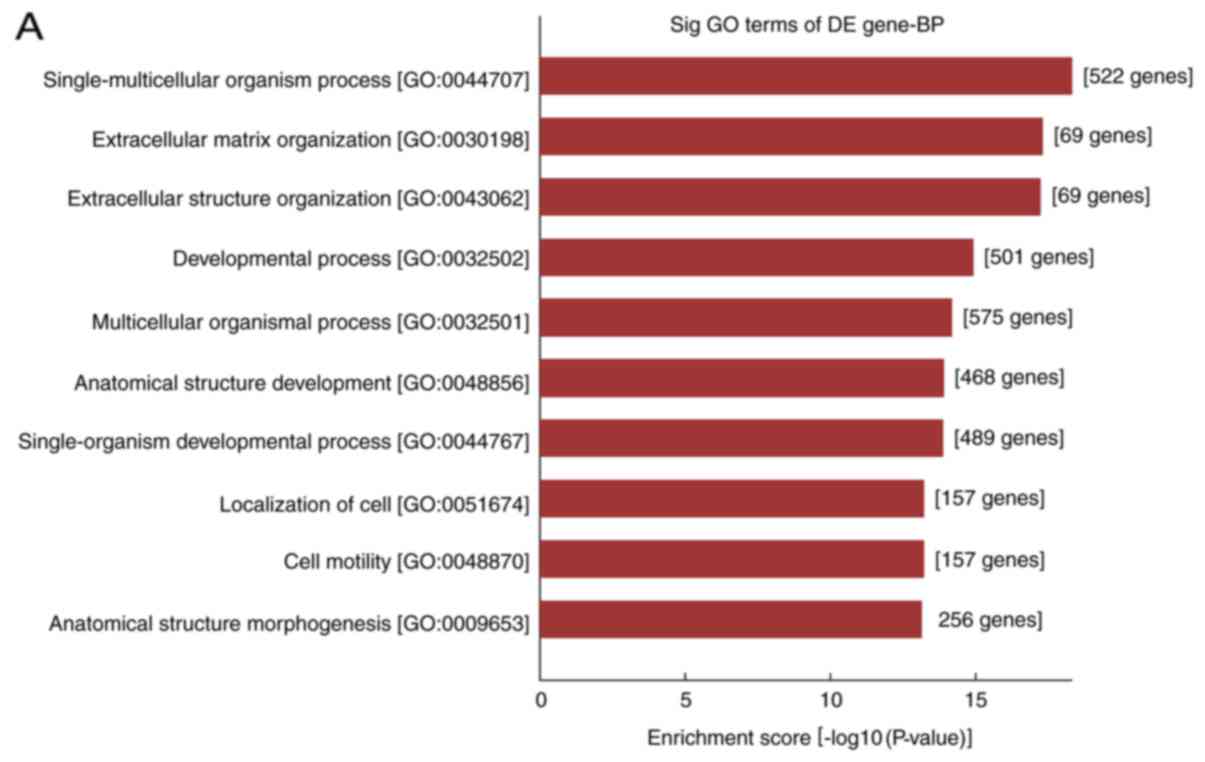
In the present study, the differentially expressed
mRNAs were subjected to GO analysis and enriched genes in the
categories biological processes (BP), molecular function and
cellular component were identified. GO analysis indicated that the
differentially expressed mRNA was involved in 2,704 GO entries, of
which 2,256 were BP, including 1,042 upregulated GO terms and 1,214
downregulated GO terms accounting for 83.4%. According to this
analysis, the majority of differentially expressed mRNAs in HS were
implicated in BP, and the top ten GO terms in the BP category in
which the upregulated and downregulated mRNAs were enriched are
displayed in Fig. 3A and B,
respectively. The genes that were significantly upregulated were
mainly involved in cell growth and development, movement,
localization, extracellular matrix (ECM) composition and tissue
reconstruction, while the significantly downregulated ones were
involved in cell mitotic cycle, nuclear division, organelle
fission, as well as chromosome composition and segregation.
Analysis of the differentially expressed genes using
the KEGG regulatory network database indicated that 56 upregulated
and 19 downregulated genes were significantly enriched in KEGG
pathways. Fig. 3C and D displays
the top 10 KEGG pathways in which upregulated and downregulated
mRNAs, respectively, were enriched. For the upregulated mRNAs, the
KEGG pathways with the highest enrichment were ECM receptor
interactions, advanced glycation end products (AGE)-receptor of AGE
signaling pathway in diabetic complications, tumor necrosis factor
signaling pathway and cell adhesion, while downregulated mRNAs were
significantly enriched in pathways including the cell cycle, DNA
replication and cancer-associated signaling.
Classification and subgroup analysis of
lncRNA
Antisense lncRNAs of their sense mRNAs were
identified according to the previous literature in the PubMed
database. (ncbi.nlm.nih.gov/geo/). A total of 166 differentially
expressed antisense lncRNAs were identified by microarray analysis.
Antisense lncRNA was transcribed from the antisense strand of DNA
double-stranded, which may associate with the sense protein-coding
strand. By pairing through a certain base complementarity and
sequence overlap, these antisense lncRNAs may control the
corresponding target mRNA, thus affecting their functions. In the
present study, a total of 236 differentially expressed exon chain
lncRNAs were detected in HS, while the exon-positive chain-type
lncRNA had a similar nucleotide sequence to that of the
corresponding mRNA homologous gene. These similar base sequences
may regulate the characteristics of HS by competitive endogenous
mechanisms, and it is therefore important to further assess whether
the corresponding mRNA is differentially expressed. By sequence
alignment and chromosomal localization using BLAST, lncRNAs and
their associated mRNA were analysed in the present study in order
to identify the function and mechanisms of action of lncRNAs. This
analysis revealed significant differences in the expression of
partially differentially expressed exon chain lncRNA and its
homology mRNA, including NR_125715 and its homologous gene TGFB2,
and their sequences were 100% similar. NR_046402 and POLD1 were
also homologous genes, and their sequences were 100% similar
(Table VI). Through these
methods, it was identified that certain adjacent protein-coding
genes of the lncRNAs may regulate processes and functions including
the cell cycle and ECM composition, which may be involved in the
development of HS (Table
VII).
| Table VISimilarity between parts of exon
sense-overlapping lncRNAs and nearby mRNAs. |
Table VI
Similarity between parts of exon
sense-overlapping lncRNAs and nearby mRNAs.
| Name of lncRNA | Chr | Strand | Nearby gene ID | Nearby gene
name | Similarity (%) |
|---|
| NR_125715 | 1 | + | NM_003238 | TGFB2 | 100 |
| NR_046402 | 19 | + | NM_002691 | POLD1 | 100 |
| Table VIIPosition between parts of lncRNAs and
nearby mRNA. |
Table VII
Position between parts of lncRNAs and
nearby mRNA.
| lncRNA ID | Chr | Strand | Interaction | Nearby gene ID | Nearby gene
name | Strand (mRNA) |
|---|
| NR_125958 | 1 | − | Intron
sense-overlapping | NM_152281 | GORAB | + |
| NR_125715 | 10 | − | Exon
sense-overlapping | NM_003238 | TGFB2 | + |
|
ENST00000606280 | 1 | − | Intron
sense-overlapping | NM_024848 | MORN1 | − |
| NR_123723 | 12 | + | Natural
antisense | NM_022468 | MMP25 | − |
| NR_037635 | 1 | − | Exon
sense-overlapping | NM_012333 | MYCBP | − |
| NR_046402 | 19 | + | Exon
sense-overlapping | NM_002691 | POLD1 | + |
miRNA-target sites in NR_125715 and
NR_046402
In order to identify the mechanisms associated with
homology lncRNAs, two lncRNAs, NR-125715 and NR-046402, were
selected, which were distinctly differentially expressed in HS, and
were further analyzed using Targetscan to match highly
complementary miRNAs forming an 8mer, 7mer-m8 or 7mer-A1. A total
of 1,067 complementary miRNAs forming pairs with NR-125715 were
identified, among which 16 miRNAs were highly complementary and
relatively conserved. These were miR-145-5p,
miR-130-3p/301-3p/454-3p, miR-141-5p, miR-141-3p/200a-3p,
miR-148-3p/152-3p, miR-29-3p, miR-133a-3p.2/133b, miR-21-5p/590-5p
miR-193-3p, miR-25-3p/32-5p/92-3p/363-3p/367-3p, miR-142-3p.1,
miR-153-3p, miR-23-3p, miR-203a-3p.1, miR-142-5p and miR-489-3p. It
was therefore confirmed that certain members of the miR family may
form complementary pairs with NR-125715 (Table VIII). NR-046402 was identified
to be highly complementary to 26 miRNAs, but these did not have any
highly conserved sites; these were miR-3189-5p, miR-7108-3p,
miR-7108-3p, miR-4258, miR-4281, miR-133a-3p, miR-7152-3p,
miR-4308, miR-6791-5p, miR-7113-3p, miR-6867-3p, miR-4658-3p,
miR-4287, miR-4469, miR-629-3p, miR-5571-5p, miR-4477a, miR-198,
miR-6507-3p, miR-548g-5p, miR-5p, miR-548f-5p, miR-548aj-5p and
miR-548p (Table IX).
Furthermore, according to the abovementioned BLAST analysis,
NR_125715 and TGFB2, as well as and NR_046402 and POLD1 are
homologous genes, with a base sequence similarity of 100%, based on
which it may be speculated that these mRNAs and their corresponding
lncRNA have the same miRNA response elements (MRE).
| Table VIIImiRNA families binding to
NR_125715. |
Table VIII
miRNA families binding to
NR_125715.
| miRNA family | Conserved sites
| Poorly conserved
sites
| 6mer sites | Cumulative weighted
context++ score | Total context++
scorea | Aggregate PCT |
|---|
| Total | 8mer | 7mer-m8 | 7mer-A1 | Total | 8mer | 7mer-m8 | 7mer-A1 |
|---|
| miR-145-5p | 2 | 1 | 0 | 1 | 0 | 0 | 0 | 0 | 0 | −0. 28 | −0.40 | 0.97 |
|
miR-130-3p/301-3p/454-3p | 1 | 1 | 0 | 0 | 0 | 1 | 0 | 0 | 1 | −0.18 | −0.37 | 0.94 |
| miR-199-5p | 1 | 1 | 0 | 0 | 0 | 0 | 0 | 0 | 1 | −0.58 | −0.61 | 0.93 |
|
miR-141-3p/200a-3p | 2 | 1 | 0 | 1 | 0 | 0 | 0 | 0 | 0 | −0.52 | −0.52 | 0.90 |
|
miR-148-3p/152-3p | 1 | 1 | 0 | 0 | 0 | 0 | 0 | 0 | 0 | −0.24 | −0.51 | 0.89 |
| miR-29-3p | 1 | 0 | 1 | 0 | 0 | 0 | 0 | 0 | 0 | −0.16 | −0.32 | 0.88 |
|
miR-133a-3p.2/133b | 1 | 0 | 0 | 1 | 1 | 0 | 0 | 1 | 1 | −0.32 | −0.34 | 0.86 |
|
miR-21-5p/590-5p | 1 | 1 | 0 | 0 | 0 | 0 | 0 | 0 | 0 | −0.09 | −0.19 | 0.79 |
| miR-193-3p | 1 | 1 | 0 | 0 | 0 | 0 | 0 | 0 | 0 | −0.24 | −0.49 | 0.77 |
|
miR-25-3p/32-5p/92-3p/363-3p/367-3p | 1 | 0 | 0 | 1 | 1 | 0 | 0 | 1 | 0 | −0.15 | −0.16 | 0.72 |
| miR-142-3p.1 | 1 | 0 | 0 | 1 | 0 | 0 | 0 | 0 | 0 | −0.09 | −0.17 | 0.54 |
| miR-153-3p | 1 | 1 | 0 | 0 | 1 | 0 | 0 | 1 | 0 | −0.27 | −0.28 | 0.32 |
| miR-23-3p | 1 | 0 | 0 | 1 | 0 | 0 | 0 | 0 | 0 | −0.06 | −0.06 | 0.27 |
| miR-203a-3p.1 | 1 | 1 | 0 | 0 | 0 | 0 | 0 | 0 | 0 | −0.16 | −0.16 | 0.24 |
| miR-142-5p | 1 | 0 | 1 | 0 | 2 | 0 | 0 | 0 | 2 | −0.01 | −0.02 | 0.22 |
| miR-489-3p | 0 | 0 | 0 | 0 | 1 | 0 | 0 | 1 | 1 | −0.01 | −0.02 | 0.15 |
| Table IXmiRNA families binding to
NR_046402. |
Table IX
miRNA families binding to
NR_046402.
| miRNA family | Conserved sites
| Poorly conserved
sites
| 6mer sites | Cumulative weighted
context++ score | Total context++
scorea | Aggregate PCT |
|---|
| Total | 8mer | 7mer-m8 | 7mer-A1 | Total | 8mer | 7mer-m8 | 7mer-A1 |
|---|
| miR-133a-3p.1 | 0 | 0 | 0 | 0 | 1 | 0 | 1 | 0 | 0 | −0.16 | −0.16 | <0.1 |
| miR-3189-5p | 0 | 0 | 0 | 0 | 1 | 0 | 1 | 0 | 0 | −0.20 | −0.20 | N/A |
| miR-7108-3p | 0 | 0 | 0 | 0 | 1 | 0 | 1 | 0 | 0 | −0.33 | −0.33 | N/A |
| miR-7108-3p | 0 | 0 | 0 | 0 | 1 | 1 | 0 | 0 | 0 | −0.78 | −0.78 | N/A |
| miR-4258 | 0 | 0 | 0 | 0 | 1 | 0 | 0 | 1 | 0 | −0.32 | −0.32 | N/A |
| miR-4281 | 0 | 0 | 0 | 0 | 1 | 1 | 0 | 0 | 0 | −0.39 | −0.39 | N/A |
| miR-7152-3p | 0 | 0 | 0 | 0 | 1 | 0 | 1 | 0 | 0 | −0.12 | −0.12 | N/A |
| miR-4308 | 0 | 0 | 0 | 0 | 1 | 0 | 0 | 1 | 0 | −0.16 | −0.16 | N/A |
| miR-6791-5p | 0 | 0 | 0 | 0 | 1 | 0 | 0 | 1 | 0 | −0.17 | −0.17 | N/A |
| miR-7113-3p | 0 | 0 | 0 | 0 | 1 | 1 | 0 | 0 | 0 | −0.52 | −0.52 | N/A |
| miR-133a-3p.1 | 0 | 0 | 0 | 0 | 1 | 0 | 1 | 0 | 0 | −0.16 | −0.16 | <0.1 |
| miR-3189-5p | 0 | 0 | 0 | 0 | 1 | 0 | 1 | 0 | 0 | −0.20 | −0.20 | N/A |
| miR-7108-3p | 0 | 0 | 0 | 0 | 1 | 0 | 1 | 0 | 0 | −0.33 | −0.33 | N/A |
| miR-7108-3p | 0 | 0 | 0 | 0 | 1 | 1 | 0 | 0 | 0 | −0.78 | −0.78 | N/A |
Construction of lncRNA-mRNA co-expression
network
The CNC network contained 19 pairs of co-expressed
lncRNAs and mRNAs, comprising 19 mRNAs and 2 lncRNAs, in which the
expression changes of lncRNAs and their associated mRNA were in the
same or opposite direction. lncRNA NR_125715 and NR_046402 were
positively associated with TGFB2 and POLD1, respectively (Fig. 4). Thus, it was speculated that
lncRNA NR_125715 and NR_046402 may regulate the expression of TGFB2
and POLD1 mRNA by a competing endogenous RNA regulation mechanism.
TGFB2 and POLD1 are involved in multiple BPs, including cell cycle,
DNA replication, ECM-receptor interaction and the TGF-β signaling
pathway.
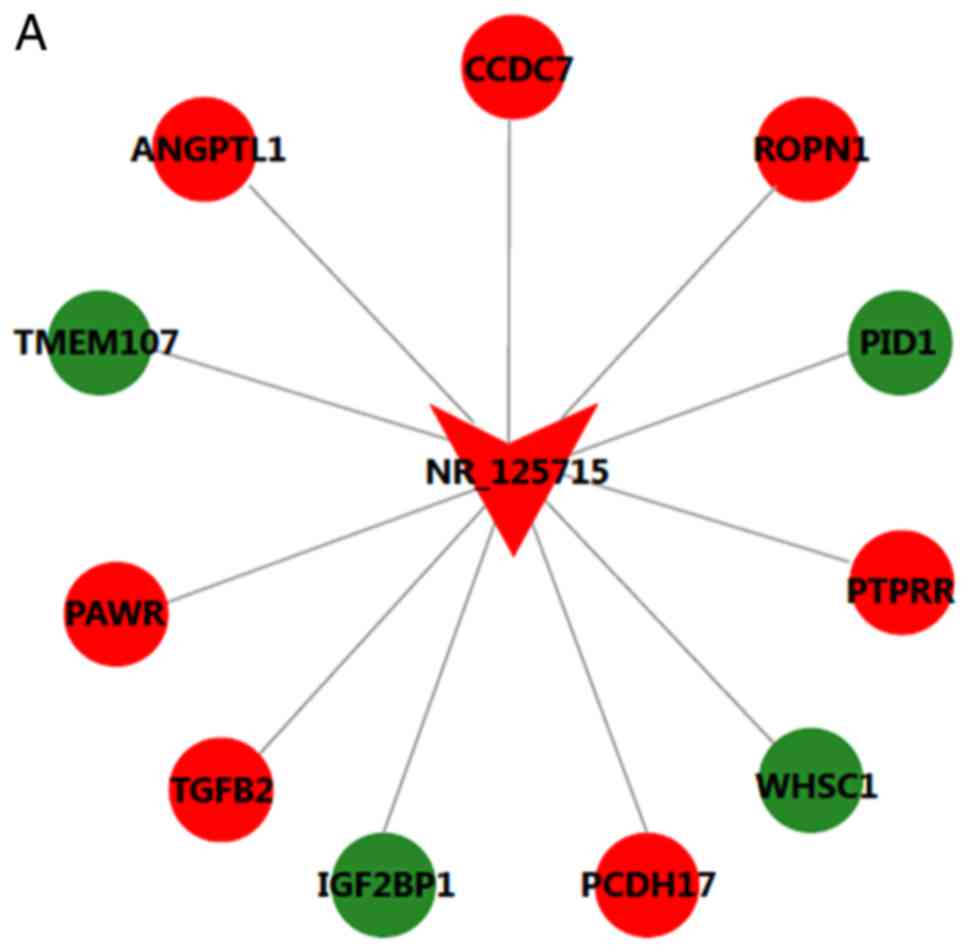 | Figure 4Long noncoding RNA-mRNA co-expression
network for (A) NR_125715 and (B) NR_046401. Red represents
upregulation and green represents downregulation. ANGPTL1,
angiopoietin like 1; CCDC7, coiled-coil domain containing 7; ROPN1,
rhophilin associated tail protein 1; PID1, phosphotyrosine
interaction domain containing 1; PTPRR, protein tyrosine
phosphatase, receptor type R; WHSC1, Wolf-Hirschhorn syndrome
candidate 1; PCDH17, protocadherin 17; IGF2BP1, insulin like growth
factor 2 mRNA binding protein 1; TGFB2, transforming growth factor
β2; PAWR, pro-apoptotic WT1 regulator; TMEM107, transmembrane
protein 107; GOLGA3, golgin A3; CTD-2545M3.6, coats
disease-2545M3.6; TTC30B, tetratricopeptide repeat domain 30B;
TNFAIP3, TNF-α induced protein 3; POLD1, DNA polymerase δ1; TET3,
tet methylcytosine dioxygenase 3. |
Discussion
HS formation is a skin condition that may cause
severe functional and aesthetic defects. HS mainly arises from
excessive proliferation of fibroblasts and the accumulation of ECM
(20). A thorough understanding
of the pathophysiology and clinical characteristics of HS may
facilitate the selection of the most appropriate treatment
strategy. Numerous studies have reported that ncRNAs, including
miRNAs and lncRNAs, participate in a variety of basic cellular
processes, including ectopic regulation of gene expression, cell
proliferation and differentiation, metabolism and apoptosis. With
the development of microarray techniques, it has been demonstrated
that ncRNAs have a key role in HS (21).
The microarray performed in the present study
indicated that 6,104 lncRNAs and 2,952 mRNAs were differentially
expressed in fibroblasts derived from HS compared with those from
normal skin. The RT-qPCR results validated that the expression of
certain lncRNAs and mRNAs was consistent with the microarray data,
which suggests that the results of the microarray are credible. GO
and KEEG pathway enrichment analyses of the differentially
expressed mRNAs suggested their involvement in multiple BPs and
pathways, including the cell cycle, DNA replication, ECM-receptor
interaction and the TGF-β signaling pathway. A previous study has
indicated that lncRNAs are associated with their neighboring
protein-coding genes (22). Thus,
correlation analysis between lncRNAs and their neighboring mRNAs
may elucidate the functions of lncRNAs in the development of HS.
Indeed, thousands of differentially expressed lncRNAs were
identified in the present microarray analysis. However, a review of
the available literature indicated that the function of most of the
differentially expressed lncRNAs remains to be elucidated. The
results of the present chip microarray analysis identified that
TGFB2 was upregulated, while POLD1 was downregulated. It has been
reported that TGFB2 is closely associated with ECM-receptor
interaction, while POLD1 is involved in DNA replication and has a
key role in the development of HS. By gene sequence alignment, the
present study identified that NR_125715 and NR_046402 have the same
miRNA binding sequence as TGFB2 and POLD1, respectively, and their
direction of change was consistent. Therefore, these genes were
selected for PCR validation. The results of the present study
indicated that NR_125715 and NR_046402 may participate in the
development of HS and the prognosis of affected patients by
controlling the endogenous mechanisms of miRNAs and regulating the
expression of TGFB2 and POLD1, respectively. The present study
therefore provides a theoretical basis for further clarifying the
mechanisms of HS and offers a novel approach for its prevention and
treatment.
The present study indicated that lncRNA NR_125715
was upregulated in HS, and the associated mRNA TGFB2, which has an
identical miRNA binding sequence, exhibited the same trend of
upregulation. The TGFB2 gene encodes a secreted ligand of the TGF-β
superfamily of proteins. Ligands of this family bind to various
TGF-β receptors, leading to the recruitment and activation of Smad
family transcription factors that regulate gene expression. The
encoded pre-proprotein is proteolytically processed to generate a
latency-associated peptide (LAP) and a mature peptide, and occurs
in either a latent form composed of a mature peptide homodimer, a
LAP homodimer and a latent TGF-β binding protein, or in an active
form consisting solely of the mature peptide homodimer. The mature
peptide may also form heterodimers with other TGF-β family members.
Disruption of the TGF-β/Smad pathway has been implicated in a
variety of human cancer types. TGF-β and cell signaling pathways
mediated by it are thought to have an important role in scar
formation, they promote collagen synthesis and induce fibroblasts
to transform into myofibroblasts (23). Studies have also demonstrated that
after cataract surgery, TGF-β is released from the residual lens
epithelium through the TGF-β-mediated Smad signaling pathway to
promote epithelial mesenchymal transition (EMT), resulting in
posterior capsule opaque (24,25). Numerous studies have confirmed the
role of TGF-β in HS, such that TGF-β induces the expression of
smooth muscle actin (SMA), fibronectin, as well as type I and type
III collagen, and reduces the expression of vimentin, Snail1/2 and
E-cadherin, which are characteristic indicators of EMT (26). Thus, TGF-β has a leading role
during the formation of HS (27).
The prsent microarray analysis revealed that the
lncRNA NR_046402 was downregulated in HS, and the associated mRNA
POLD1 was also downregulated, which changed in the same direction.
The POLD1 gene is located on chromosome 19 at q13.3-q13.4 and is
~34 kb long (28). The high
fidelity of DNA replication maintains the integrity of DNA and is
essential for the survival of cells and organisms. DNA polymerase
in the eukaryotic cell replication process is absolutely necessary
(29). POLD has a crucial role in
genome maintenance by participating in replicative DNA synthesis
and multiple synthetic repair processes (30). It has intrinsic 3′-5′
exon-nuclease activity, which is the basis for the function of this
enzyme, and the interaction of POLD1 with proliferating cell
nuclear antigen allows it to gradually replicate DNA (31). Human POLD is a complex consisting
of four subunits: p125, p68, p50 and p12 (32), among which the p125 subunit has
been identified as a catalytic subunit, encoded by the POLD1 gene
in humans, bearing the POLD and 3′-5′ exonuclease activity sites
(33). POLD1 has an important
biological role in cell cycle regulation and DNA damage repair
(34).
LncRNA has a variety of functions involved in the
regulation of mRNA transcription and translation. ceRNA is a
recently reported functional lncRNA type that has miRNA recognition
sequences in common with mRNA and may compete for miRNA binding,
thereby affecting the regulation and function of target mRNA
(35,36). In the present study, the two exon
sense-overlapping lncRNAs NR_125715 and NR_046402 were identified
to have 100% sequence homology with TGFB2 and POLD1 mRNA,
respectively. Given that these lncRNAs are highly homologous to
these mRNAs, they may have common MREs and influence expression
levels by competing for shared miRNAs. Thus, it was suggested that
certain lncRNAs may act as ceRNAs by attaching to miRNAs that are
part of transcriptional networks involved in the formation of
HS.
In the present study, TargetScan and miRanda
database analyses were performed to identify miRNAs with
complementarity ro NR_125715; these included miR-145-5p,
miR-130-3p/301-3p/454-3p, miR-199-5p, miR-141-3p/200a-3p,
miR-148-3p/152-3p, miR-29-3p, miR-133a-3p.2/133b, miR-21-5p/590-5p,
miR-193-3p, miR-25-3p/32-5p/92-3p/363-3p//367-3p, miR-142-3p.1,
miR-153-3p, miR-23-3p, miR-203a-3p.1, miR-142-5p and miR-489-3p.
The binding site of miRNAs to their target genes is located at its
5′ end, the 'seed sequence' consisting of 7 nucleotides (37). The complementarity of the miRNA
seed sequence and the target gene is the major mechanism for
regulating gene expression, i.e., if the two are completely
complementary, the target gene is degraded. If the degree of
complementarity is low and there are one or two base mismatches,
the target gene expression is depressed (38). It has been indicated that
overexpression of miR-29b significantly reduces the expression
levels of COL1A1 and α-SMA, inhibits myofibroblast-like cell
proliferation and induces apoptosis, suggesting that miR-29b may
convey significant resistance to HS fibrosis (15). Consistently with this, Bi et
al (39) reported that the
miR-29 family has a role in the scar by regulating the translation
of ECM mRNA. In addition, miR-200b, miR-181b, miR-145, miR-143-3p,
miR-31 and miR-21 have been reported to be involved in HS formation
(40). miR-200b, a member of the
miR-200 family, has been associated with abnormal proliferation of
fibroblasts (41). In addition,
miR-200b affects HS formation by influencing collagen type I and
III synthesis, fibronectin expression and TGFB1/α-SMA signaling by
modulating cell proliferation and apoptosis in human HS fibroblasts
(42). In previous studies, the
expression of miR-143-3p in HS tissue was significantly reduced. In
addition, the protein expression of Col I, Col III and α-SMA in HS
fibroblasts transfected with miR-143-3p targeting connective tissue
growth factor was reduced, indicating that miR-143-3p acted as an
anti-fibrosis factor in HS formation (43). Another study indicated that miR-31
was highly expressed during wound healing, whereas transgenic mouse
models with elevated miR-31 levels exhibited abnormal wound healing
(44). Kwan et al
(45) reported that miR-181b was
involved in the aberrant expression of membrane proteoglycans in
skin and wound healing, and transfection with miR-181b reversed
TGFB1-induced downregulation of proteomic proteins and prevented
the transformation of fibroblast to myofibroblasts in HS. Zhou
et al (14) indicated that
miR-200b and miR-21b expression may be involved in HS formation by
activating the TGF-β/Smad signaling pathways.
The miRNAs identified to exhibit the strongest
binding with NR_046402 included miR-3189-5p, miR-7108-3p,
miR-7108-3p, miR-4258, miR-4281, miR-133a-3p.1, miR-7152-3p,
miR-4308, miR-4292, miR-6791-5p, miR-7113-3p, miR-6867-3p,
miR-4685-3p, miR-4287, miR-4469, miR-629-3p, miR-4713-5p,
miR-5571-5p, miR-4477a, miR-198, miR-6507-3p, miR-548g-5p,
miR-548x-5p, miR-548f-5p, miR-548aj-5p and miR-548p. It has been
reported that miR-133a is closely associated with ECM fibrosis
(46). miR-133a inhibits the
mitogen-activated protein kinase kinase/extracellular
signal-regulated protein kinase pathway to enhance radiosensitivity
and promote cell apoptosis (47).
NR_125715 and NR_046402 are likely to compete with the miRNA pool
to regulate the expression of TGFB2 and POLD1 participating in HS
formation. In addition, The CNC network analysis indicated that
lncRNAs NR_125715 and NR_046402 were positively associated with
TGFB2 and POLD1, respectively. Thus, it was spectulated that
NR_125715 and NR_046402 may regulate the expression of TGFB2 and
POLD1 mRNA via a ceRNA regulatory mechanism.
In conclusion, the present study identified lncRNAs
that were differentially expressed in fibroblasts derived from HS
compared with those in normal skin, predicted their function by
constructing a network of associated mRNAs and ceRNAs. NR_125715
and NR_046402 compete with the miRNA pool to regulate the
expression of TGFB2 and POLD1, which are involved in cell cycle,
DNA replication, ECM-receptor interactions and the TGF-β signaling
pathway, which have an important role in the development of HS. A
more in-depth understanding of lncRNAs in further functional
studies may lead to novel theories regarding the pathogenesis and
treatment of HS.
Acknowledgments
The present study was supported by the National
Natural Science Foundation of China (grant nos. 81060323 and
81460293).
Notes
[1] Competing
interests
The authors declare there is no competing
interest.
References
|
1
|
Rabello FB, Souza CD and Farina Júnior JA:
Update on hypertrophic scar treatment. Clinics. 69:565–573. 2014.
View Article : Google Scholar : PubMed/NCBI
|
|
2
|
Sorkin M, Cholok D and Levi B: Scar
management of the burned hand. Hand Clin. 33:305–315. 2017.
View Article : Google Scholar : PubMed/NCBI
|
|
3
|
Mokos ZB, Jović A, Grgurević L, Dumić-Čule
I, Kostović K, Čeović R and Marinović B: Current therapeutic
approach to hypertrophic scars. Front Med. 4:832017. View Article : Google Scholar
|
|
4
|
Wan DC and Wang KC: Long noncoding RNA:
Significance and potential in skin biology. Cold Spring Harb
Perspect Med. 4:pii: a0154042014. View Article : Google Scholar
|
|
5
|
Kung JT, Colognori D and Lee JT: Long
noncoding RNAs: Past, present, and future. Genetics. 193:651–669.
2013. View Article : Google Scholar : PubMed/NCBI
|
|
6
|
Engreitz JM, Haines JE, Perez EM, Munson
G, Chen J, Kane M, McDonel PE, Guttman M and Lander ES: Local
regulation of gene expression by lncRNA promoters, transcription
and splicing. Nature. 539:452–455. 2016. View Article : Google Scholar : PubMed/NCBI
|
|
7
|
Lee JT: Epigenetic regulation by long
noncoding RNAs. Science. 338:1435–1439. 2012. View Article : Google Scholar : PubMed/NCBI
|
|
8
|
Gao J, Xu W, Wang J, Wang K and Li P: The
role and molecular mechanism of non-coding RNAs in pathological
cardiac remodeling. Int J Mol Sci. 18:pii: E6082017. View Article : Google Scholar
|
|
9
|
Wang Y, Li Z, Zheng S, Zhou Y, Zhao L, Ye
H, Zhao X, Gao W, Fu Z, Zhou Q, et al: Expression profile of long
non-coding RNAs in pancreatic cancer and their clinical
significance as biomarkers. Oncotarget. 6:35684–35698.
2015.PubMed/NCBI
|
|
10
|
Vassallo I, Zinn P, Lai M, Rajakannu P,
Hamou MF and Hegi ME: WIF1 re-expression in glioblastoma inhibits
migration through attenuation of non-canonical WNT signaling by
downregulating the lncRNA MALAT1. Oncogene. 35:12–21. 2016.
View Article : Google Scholar
|
|
11
|
Pastori C, Kapranov P, Penas C, Peschansky
V, Volmar CH, Sarkaria JN, Bregy A, Komotar R, Laurent G St, Ayad
NG and Wahlestedt C: The bromodomain protein BRD4 controls HOTAIR,
a long noncoding RNA essential for glioblastoma proliferation. Proc
Natl Acad Sci USA. 112:8326–8331. 2015. View Article : Google Scholar : PubMed/NCBI
|
|
12
|
Mineo M, Ricklefs F, Rooj AK, Lyons SM,
Ivanov P, Ansari KI, Nakano I, Chiocca EA, Godlewski J and Bronisz
A: The long non-coding RNA HIF1A-AS2 facilitates the maintenance of
mesenchymal glioblastoma stem-like cells in hypoxic niches. Cell
Rep. 15:2500–2509. 2016. View Article : Google Scholar : PubMed/NCBI
|
|
13
|
Li J, Chen L, Cao C, Yan H, Zhou B, Gao Y,
Li Q and Li J: The long non-coding RNA Lnc RNA8975-1 is upregulated
in hypertrophic scar fibroblasts and controls collagen expression.
Cell Physiol Biochem. 40:326–334. 2016. View Article : Google Scholar
|
|
14
|
Zhou R, Zhang Q, Zhang Y, Fu S and Wang C:
Aberrant miR-21 and miR-200b expression and its pro-fibrotic
potential in hypertrophic scars. Exp Cell Res. 339:360–366. 2015.
View Article : Google Scholar : PubMed/NCBI
|
|
15
|
Li J, Cen B, Chen S and He Y: MicroRNA-29b
inhibits TGF-β1-induced fibrosis via regulation of the TGF-β1/Smad
pathway in primary human endometrial stromal cells. Mol Med Rep.
13:4229–4237. 2016. View Article : Google Scholar : PubMed/NCBI
|
|
16
|
Thomson DW and Dinger ME: Endogenous
microRNA sponges: Evidence and controversy. Nat Rev Genet.
17:272–283. 2016. View Article : Google Scholar : PubMed/NCBI
|
|
17
|
Livak KJ and Schmittgen TD: Analysis of
relative gene expression data using real-time quantitative PCR and
the 2−ΔΔC T method. Methods. 25:402–408.
2001. View Article : Google Scholar
|
|
18
|
Ellwanger DC, Büttner FA, Mewes HW and
Stümpflen V: The sufficient minimal set of miRNA seed types.
Bioinformatics. 27:1346–1350. 2011. View Article : Google Scholar : PubMed/NCBI
|
|
19
|
Agarwal V, Bell GW, Nam JW and Bartel DP:
Predicting effective microRNA target sites in mammalian mRNAs.
Elife. 4:2015. View Article : Google Scholar
|
|
20
|
Zhang J, Li Y, Bai X, Li Y, Shi J and Hu
D: Recent advances in hypertrophic scar. Histol Histopathol.
33:27–39. 2018.
|
|
21
|
Chen L and Li J, Li Q, Yan H, Zhou B, Gao
Y and Li J: Non-coding RNAs: The new insight on hypertrophic scar.
J Cell Biochem. 118:1965–1968. 2017. View Article : Google Scholar : PubMed/NCBI
|
|
22
|
Ponjavic J, Oliver PL, Lunter G and
Ponting CP: Genomic and transcriptional co-localization of
protein-coding and long non-coding RNA pairs in the developing
brain. PLoS Genet. 5:e10006172009. View Article : Google Scholar : PubMed/NCBI
|
|
23
|
Zhu Z, Ding J, Shankowsky HA and Tredget
EE: The molecular mechanism of hypertrophic scar. J Cell Commun
Signal. 7:239–252. 2013. View Article : Google Scholar : PubMed/NCBI
|
|
24
|
Dawes LJ, Elliott RM, Reddan JR, Wormstone
YM and Wormstone IM: Oligonucleotide microarray analysis of human
lens epithelial cells: TGFbeta regulated gene expression. Mol Vis.
13:1181–1197. 2007.PubMed/NCBI
|
|
25
|
Eldred JA, Dawes LJ and Wormstone IM: The
lens as a model for fibrotic disease. Philos Trans R Soc Lond B
Biol Sci. 366:1301–1319. 2011. View Article : Google Scholar : PubMed/NCBI
|
|
26
|
Hahn JM, McFarland KL, Combs KA and Supp
DM: Partial epithelial-mesenchymal transition in keloid scars:
Regulation of keloid keratinocyte gene expression by transforming
growth factor-b1. Burns Trauma. 4:302016. View Article : Google Scholar
|
|
27
|
Sun Q, Guo S, Wang CC, Sun X, Wang D, Xu
N, Jin SF and Li KZ: Cross-talk between TGF-β/Smad pathway and
Wnt/β-catenin pathway in pathological scar formation. Int J Clin
Exp Pathol. 8:7631–7639. 2015.
|
|
28
|
Zhao H, Zhang S, Xu D, Lee MY, Zhang Z,
Lee EY and Darzynkiewicz Z: Expression of the p12 subunit of human
DNA polymerase δ (Pol δ), CDK inhibitor p21WAF1, Cdt1,
cyclin A, PCNA and Ki-67 in relation to DNA replication in
individual cells. Cell Cycle. 13:3529–3540. 2014. View Article : Google Scholar
|
|
29
|
Kang S, Kang MS, Ryu E and Myung K:
Eukaryotic DNA replication: Orchestrated action of multi-subunit
protein complexes. Mutat Res. May 1–2017.Epub ahead of print.
View Article : Google Scholar : PubMed/NCBI
|
|
30
|
Sekelsky J: DNA repair in drosophila:
Mutagens, models, and missing genes. Genetics. 205:471–490. 2017.
View Article : Google Scholar : PubMed/NCBI
|
|
31
|
Zhou Y, Meng X, Zhang S, Lee EY and Lee
MY: Characterization of human DNA polymerase delta and its
subassemblies reconstituted by expression in the MultiBac system.
PLoS One. 7:e391562012. View Article : Google Scholar : PubMed/NCBI
|
|
32
|
Lee MY, Zhang S, Lin SH, Wang X,
Darzynkiewicz Z, Zhang Z and Lee EY: The tail that wags the dog:
p12, the smallest subunit of DNA polymerase δ, is degraded by
ubiquitin ligases in response to DNA damage and during cell cycle
progression. Cell Cycle. 13:23–31. 2014. View Article : Google Scholar
|
|
33
|
Nicolas E, Golemis EA and Arora S: POLD1:
Central mediator of DNA replication and repair, and implication in
cancer and other pathologies. Gene. 590:128–141. 2016. View Article : Google Scholar : PubMed/NCBI
|
|
34
|
Song J, Hong P, Liu C, Zhang Y, Wang J and
Wang P: Human POLD1 modulates cell cycle progression and DNA damage
repair. BMC Biochem. 16:142015. View Article : Google Scholar : PubMed/NCBI
|
|
35
|
Wang Y, Yang T, Zhang Z, Lu M, Zhao W,
Zeng X and Zhang W: Long non-coding RNA TUG1 promotes migration and
invasion by acting as a ceRNA of miR-335-5p in osteosarcoma cells.
Cancer Sci. 108:859–867. 2017. View Article : Google Scholar : PubMed/NCBI
|
|
36
|
Jiang H, Ma R, Zou S, Wang Y, Li Z and Li
W: Reconstruction and analysis of the lncRNA-miRNA-mRNA network
based on competitive endogenous RNA reveal functional lncRNAs in
rheumatoid arthritis. Mol Biosyst. 13:1182–1192. 2017. View Article : Google Scholar : PubMed/NCBI
|
|
37
|
Fabian MR and Sonenberg N: The mechanics
of miRNA-mediated gene silencing: A look under the hood of miRISC.
Nat Struct Mol Biol. 19:586–593. 2012. View Article : Google Scholar : PubMed/NCBI
|
|
38
|
Ul Hussain M: Micro-RNAs (miRNAs): Genomic
organisation, biogenesis and mode of action. Cell Tissue Res.
349:405–413. 2012. View Article : Google Scholar : PubMed/NCBI
|
|
39
|
Bi S, Cao C, Chai LL, Li SR and Yang DY:
Regulatory mechanism of miR-29 over TGF-β1 and COL1 in scar cells.
Eur Rev Med Pharmacol Sci. 21:2512–2517. 2017.PubMed/NCBI
|
|
40
|
Babalola O, Mamalis A, Lev-Tov H and
Jagdeo J: The role of microRNAs in skin fibrosis. Arch Dermatol
Res. 305:763–776. 2013. View Article : Google Scholar : PubMed/NCBI
|
|
41
|
Kurashige J, Mima K, Sawada G, Takahashi
Y, Eguchi H, Sugimachi K, Mori M, Yanagihara K, Yashiro M, Hirakawa
K, et al: Epigenetic modulation and repression of miR-200b by
cancer-associated fibroblasts contribute to cancer invasion and
peritoneal dissemination in gastric cancer. Carcinogenesis.
36:133–141. 2015. View Article : Google Scholar
|
|
42
|
Li P, He QY and Luo CQ: Overexpression of
miR-200b inhibits the cell proliferation and promotes apoptosis of
human hypertro-phic scar fibroblasts in vitro. J Dermatol.
41:903–911. 2014. View Article : Google Scholar : PubMed/NCBI
|
|
43
|
Mu S, Kang B, Zeng W, Sun Y and Yang F:
MicroRNA-143-3p inhibits hyperplastic scar formation by targeting
connective tissue growth factor CTGF/CC N2 via the Akt/mTOR
pathway. Mol Cell Biochem. 416:99–108. 2016. View Article : Google Scholar : PubMed/NCBI
|
|
44
|
Li D, Li X, Wang A, Meisgen F, Pivarcsi A,
Sonkoly E, Ståhle M and Landén X: MicroRNA-31 promotes skin wound
healing by enhancing keratinocyte proliferation and migration. J
Invest Dermatol. 135:1676–1685. 2015. View Article : Google Scholar : PubMed/NCBI
|
|
45
|
Kwan P, Ding J and Tredget EE: MicroRNA
181b regulates decorin production by dermal fibroblasts and may be
a potential therapy for hypertrophic scar. PLoS One.
10:e1230542015. View Article : Google Scholar
|
|
46
|
Rubiś P, Totoń-Żurańska J,
Wiśniowska-Śmialek S, Holcman K, Kołton-Wróż M, Wołkow P, Wypasek
E, Natorska J, Rudnicka-Sosin L, Pawlak A, et al: Relations between
circulating microRNAs (miR-21, miR-26, miR-29, miR-30 and
miR-133a), extracellular matrix fibrosis and serum markers of
fibrosis in dilated cardiomyopathy. Int J Cardiol. 231:201–206.
2017. View Article : Google Scholar
|
|
47
|
Yang QS, Jiang LP, He CY, Tong YN and Liu
YY: Up-regulation of microRNA-133a inhibits the MEK/ERK signaling
pathway to promote cell apoptosis and enhance radio-sensitivity by
targeting EGFR in esophageal cancer in vivo and in vitro. J Cell
Biochem. 118:2625–2634. 2017. View Article : Google Scholar
|