Introduction
Melanoma is a highly malignant cutaneous neoplasm
that involves the uncontrolled proliferation and migration of
melanocytes (1). Under normal
conditions, melanocytes reside at the bottom layer of the
epidermis. Exposure to ultraviolet (UV) radiation triggers
melanogenesis, with the pigment melanin providing protective
effects against UV-induced damage (2). Although the causes of melanoma are
unknown, DNA damage due to UV exposure and genetic predisposition
may play a role in its pathogenesis. It has been estimated that
approximately 76,100 patients in the USA will be diagnosed with
melanoma in 2014, of which 9,710 will aquire malignant melanoma and
succumb to the disease (3).
Although localized melanoma can be treated by surgical resection,
patients with distant metastases have an extremely poor prognosis.
Therefore, the association between the pathogenesis of melanoma and
biological targets has long been the focus of melanoma
researchers.
The human insulin gene enhancer-binding protein
islet-1 (ISL1) is a LIM homeodomain transcription factor that is
encoded by the ISL1 gene (4). ISL1 plays an important role in
embryogenesis and the differentiation of insulin-producing
pancreatic β-cells within the islets of Langerhans (5). A previous study demonstrated that
ISL1 could be utilized as a marker of cardiac progenitor cell
lineage (6). Notably, in
diagnostic surgical pathology, ISL1 has emerged as a valuable
marker for well-differentiated pancreatic neuroendocrine tumors
(pancreatic NETs) and their metastasis, particularly those with a
small, round cell appearance, including small cell lung cancer,
poorly differentiated neuroblastoma and Merkel cell carcinoma
(7). In addition, some
researchers have also studied some well-differentiated
extrapancreatic neuroendocrine neoplasms, such as thyroid medullary
carcinomas and paragangliomas/pheochromocytomas, whose ISL1 status
is not well known (8). However,
to date, at least to the best of our knowledge, there is no stud
available showing that ISL1 plays a role in the proliferation and
invasion of melanoma.
Thus, the aim of the present study was to examine
the effects of ISL1 on the proliferation, invasion and apoptosis of
melanoma by infecting the ISL1 homeodomain overexpression
lentiviral vector (LV5-ISL1 homo) into human melanoma A375
cells.
Materials and methods
Cell lines and culture
The human melanoma cell line, A375, and the
packaging cell line, 293T, were purchased from the Cell Bank of
Chinese Academy of Sciences (Shanghai, China) and cultured in
RPMI-1640 and Dulbecco's modified Eagle's medium (DMEM) (both from
Gibco Life Technologies, Carlsbad, CA, USA) supplemented with 10%
fetal bovine serum (FBS) (Takara Biotechnology Co., Ltd., Dalian,
China) and 1% penicillin-streptomycin (100 µg/ml; Invitrogen
Life Technologies, Beijing, China) at 37°C with 5%
CO2.
In addition, the cells were treated with vascular
endothelial growth factor (VEGF) at 100 µl for 24 and 48 h,
or with the PI3K/Akt inhibitor, LY294002, at 100 µl for 24
and 48 h.
LV5-ISL1 homo construction and lentivirus
packaging
Specific primers were designed using Primer Express
software (Shenggong Biotech Co., Ltd., Shanghai, China), according
to the nucleotide sequences of human ISL LIM homeobox 1 gene
(Gene ID: 3670; https://www.ncbi.nlm.nih. gov/gene/3670). The primer
sequences were as follows: ISLN forward,
5′-GATATGGCGGCCGCGCCACCATGGGAGACATGGGAGATCCA-3′ and reverse,
5′-GCTATGGGATCCTCATGCCTCAATAGGACTGGCTACCATGC-3′. The CDS region of
the ISL1 gene was amplified using a PCR kit (Promega,
Madison, WI, USA), according to the manufacturer's instructions.
The target DNA gene fragment was subcloned into an LV5 lentiviral
vector (Axygen Co., Shanghai, China) to construct the ISL1 homo
overexpression lentiviral vector (LV5-ISL1 homo). The ISL1 fragment
was identified by PCR with double digestion using NotI and
BamHI and DNA sequencing.
Exponential 293T cells were seeded onto 10-cm cell
culture dishes with 2-2.5×10⁶ cells/dish. The lentiviral
vector packaged system of approximately 1,800 µl in volume
was added to the cells at density of 60-70%. After the supernatant
was collected, the high-concentration lentiviral concentrate was
used to infect the 293T cells. The ratio of positive cells was
determined by flow cytometry (FACSCanto II; BD Biosciences, San
Diego, CA, USA), and the viral titer was detected by using a double
dilution assay.
Lentiviral transfection of A375
cells
Exponential A375 cells were seeded onto 24-well
culture plates with 3-5×10⁴ cells/well. The viral
supernatant with the LV5-ISL1 homo and green fluorescent protein
(GFP) were added respectively to the cells at a density of 70-80%.
After 72 h, the transfection ratio was determined under a
fluorescence microscope (BMI 3000; Leica, Wetzlar, Germany). The
cell cultures with a transfection ratio of >80% were used as the
target cells and were identified by western blot analysis.
Three experimental groups were used in the present
study, which included the ISL1 homo overexpression group
(A375/ISL), empty vector group (A375/GFP), and control group
(A375). All experiments were performed in triplicate at
minimum.
3-(4,5-Dimethylthiazol-2-yl)-2,5-diphenytetrazolium bromide (MTT)
assay
Three groups of cells at a volume of 200
µl/well (approximate density, 1×10⁵ cells/ml)
were seeded onto 96-well plates. At the culture time points of 6,
12, 24, 48 and 56 h, 20 µl of MTT (working concentration, 5
mg/ml; Sigma-Aldrich, St. Louis, MO, USA) were added. The optical
density value (OD value) of the cells was determined by
spectrophotometry at a wavelength of 490 nm (GE Healthcare Life
Sciences, Uppsala, Sweden).
Apoptosis detection by flow cytometry and
TUNEL assay
At 48 h after transfection, cell apoptosis was
analyzed using a flow cytometer with Annexin V-PE and 7-AAD
staining. Annexin V-PE recognizes the externalization of
phosphatidylserine by apoptotic cells, which usually indicates both
early and late apoptosis. The cell-impermeant dye, 7-AAD, was also
used as an indicator of cell membrane integrity. Double-negative
staining cells were considered viable. Briefly, 100 µl of
the cell suspension collected from each sample was suspended in a
mixture of 100 µl Annexin V-PE and 7-AAD-binding buffer and
then incubated at room temperature for 20 min. The samples were
analyzed using a flow cytometer (Guava EasyCyte 8HT; Millipore,
Billerica, MA, USA). Apoptotic cells were visualized with 100
µl 3′3-Diaminobenzidine (DAB; Boster Bioengineering Co.,
Ltd., Wuhan, China), which showed brown color. The cell population
was separated into 3 groups: live cells with a low level of
fluorescence, apoptotic cells in the earlier period with violet
fluorescence, and the advanced-stage apoptotic cells with blue
fluorescence (9).
A TUNEL kit (Red TUNEL kit, Roche, Mannheim,
Germany) was used to detect cell apoptosis after 48 h, following
the manufacturer's instructions. Images were captured under a
fluorescence microscope, and the percentage of positive cells was
calculated using ImageJ software (National Institutes of Health,
Bethesda, MD, USA). Four fields were randomly selected from each
well of 12-well plates for the analysis. The index of apoptosis was
calculated as the ratio of apoptotic cells and the total cells.
Cell cycle analysis
Cell cycle distribution was analyzed by flow
cytometry. At 48 h after transfection, 1×10⁶ cells were
harvested by typsinization, rinsed with phosphate-buffered saline
(PBS), and fixed with cold 70% ethanol at 4°C overnight. The cells
were then washed twice with PBS and re-suspended in 1 ml of
staining solution (50 µg/ml propidium iodide (PI), 50
µg/ml RNase A, and 0.1% Triton X-100 in citrate buffer, pH
7.8), and incubated at room temperature for 30 min, as previously
described (10). The cells were
captured using a fluorescence microscope (BMI 3000; Leica) and the
percentage of cells at each stage of the cell cycle was analyzed by
flow cytometry (FACSCanto II; BD Biosciences).
Transwell® invasion assay
Transwell® filters (Corning Costar,
Cambridge, MA, USA) were coated with Matrigel® (3.9
µg/µl, 60-80 µl). Three groups of cells were
resuspended in 100 µl of serum-free RPMI-1640 medium and
added to the upper compartment of the chambers. The cells migrating
from the Matrigel® into the pores of the inserted filter
were fixed with 100% methanol and stained with hematoxylin. The
positive cells in 3 randomly selected visual fields were counted
using an inverted microscope (CKX41; Olympus, Tokyo, Japan).
Quantitative polymerase chain reaction
(q-PCR)
qPCR was used to quantify differences in matrix
metalloproteinase (MMP)-2 and MMP-9 mRNA expression levels among
the 3 groups. Total RNA was extracted using TRIzol reagent (Takara
Bio, Inc., Otsu, Japan), following the manufacturer's instructions.
In this procedure, we used the prepared cDNA, Power SYBR-Green
Master Mix (Applied Biosystems, Warrington, UK), and primers of the
human MMP-2, MMP-9, and β-actin genes
(1:1,000; Cell Signaling Technology, Inc., Danvers, MA, USA). All
the experiments were repeated 3 times. The primer sequences used in
the present study are listed in Table
I. Each PCR reaction contained 0.5 µl of SYBR-Green,
20.5 µl of molecular grade water, 2 µl of each
forward and reverse primer, and 2 µl of cDNA. Amplification
was performed using the following conditions: 94°C for 4 min, 94°C
for 20 sec, 60°C for 30 sec, and 35 cycles at 72°C for 30 sec.
These signals were determined at 72°C. qPCR was performed under
standard conditions, and all experiments were conducted in
triplicate. Relative MMP-2 and MMP-9 mRNA expression levels were
compared among the 3 groups. The qPCR data were analyzed using the
comparative cycle threshold (CT) method (11). A difference in CT (ΔCT) was
determined as the diversities of MMP-2 and MMP-9 mRNA expression
levels among different groups. ΔΔCT was calculated by calculating
the difference between A375/ISL group and the other 2 groups.
 | Table IPrimer sequences. |
Table I
Primer sequences.
| Gene name | Primer
sequence | Product size
(bp) |
|---|
| MMP-2 | F:
5′-TTTGACGGTAAGGACGGACTC-3′ | 146 |
| R:
5′-TACTCCCCATCGGCGTTC-3′ | |
| MMP-9 | F:
5′-CGAACTTTGACAGCGACAAGA-3′ | 214 |
| R:
5′-TCAGGGCGAGGACCATAGAG-3′ | |
| β-actin | F:
5′-TGACGTGGACATCCGCAAAG-3′ | 102 |
| R:
5′-CTGGAAGGTGGACAGCGAGG-3′ | |
Western blot analysis
Total protein was extracted from the 3 groups of
cells using 0.1 ml RIPA lysis buffer [50 mM Tris (pH 7.4), 150 mM
NaCl, 1% NP-40, 0.5% sodium deoxycholate]. Approximately 30
µg of protein was subjected to 10% SDS-PAGE and then
transferred onto nitrocellulose membranes (Whatman, Pittsburgh, PA,
USA). The membranes with electrophoresed proteins were incubated
with primary antibodies against MMP-2, MMP-9 and ISL1 (dilution
1:800; Cell Signaling Technology, Inc.) and against Akt and p-Akt
(Sigma-Aldrich). The secondary antibodies used were goat
anti-rabbit IgG HRP and goat anti-mouse IgG HRP (both from
Sigma-Aldrich). The antigen-antibody reaction was visualized by
using ultra-enhanced chemiluminescence western blotting detection
reagents (Sigma-Aldrich). Moreover, the protein expression levels
of Akt (1:1,000) and p-Akt (1:1,000) (both from Cell Signaling
Technology, Inc.) were measured at 24 and 48 h in the A375/ISL and
A375/GFP cells by western blot analysis. GAPDH (1:5,000; Abcam,
Cambridge, UK) was used as the internal reference. Gray value
ratios in the bar charts were quantified using the quantities of
western blot analysis.
Statistical analysis
The data were analyzed using SPSS software 11.5
(SPSS, Inc., Chicago, IL, USA). One-way analysis of variance
(ANOVA) was conducted to investigate differences within the groups
for quantitative variables with the Dunnett's post hoc test for
multiple comparisons. P-values <0.05 were considered
statistically significant, and P-values <0.01 were designated as
highly significant.
Results
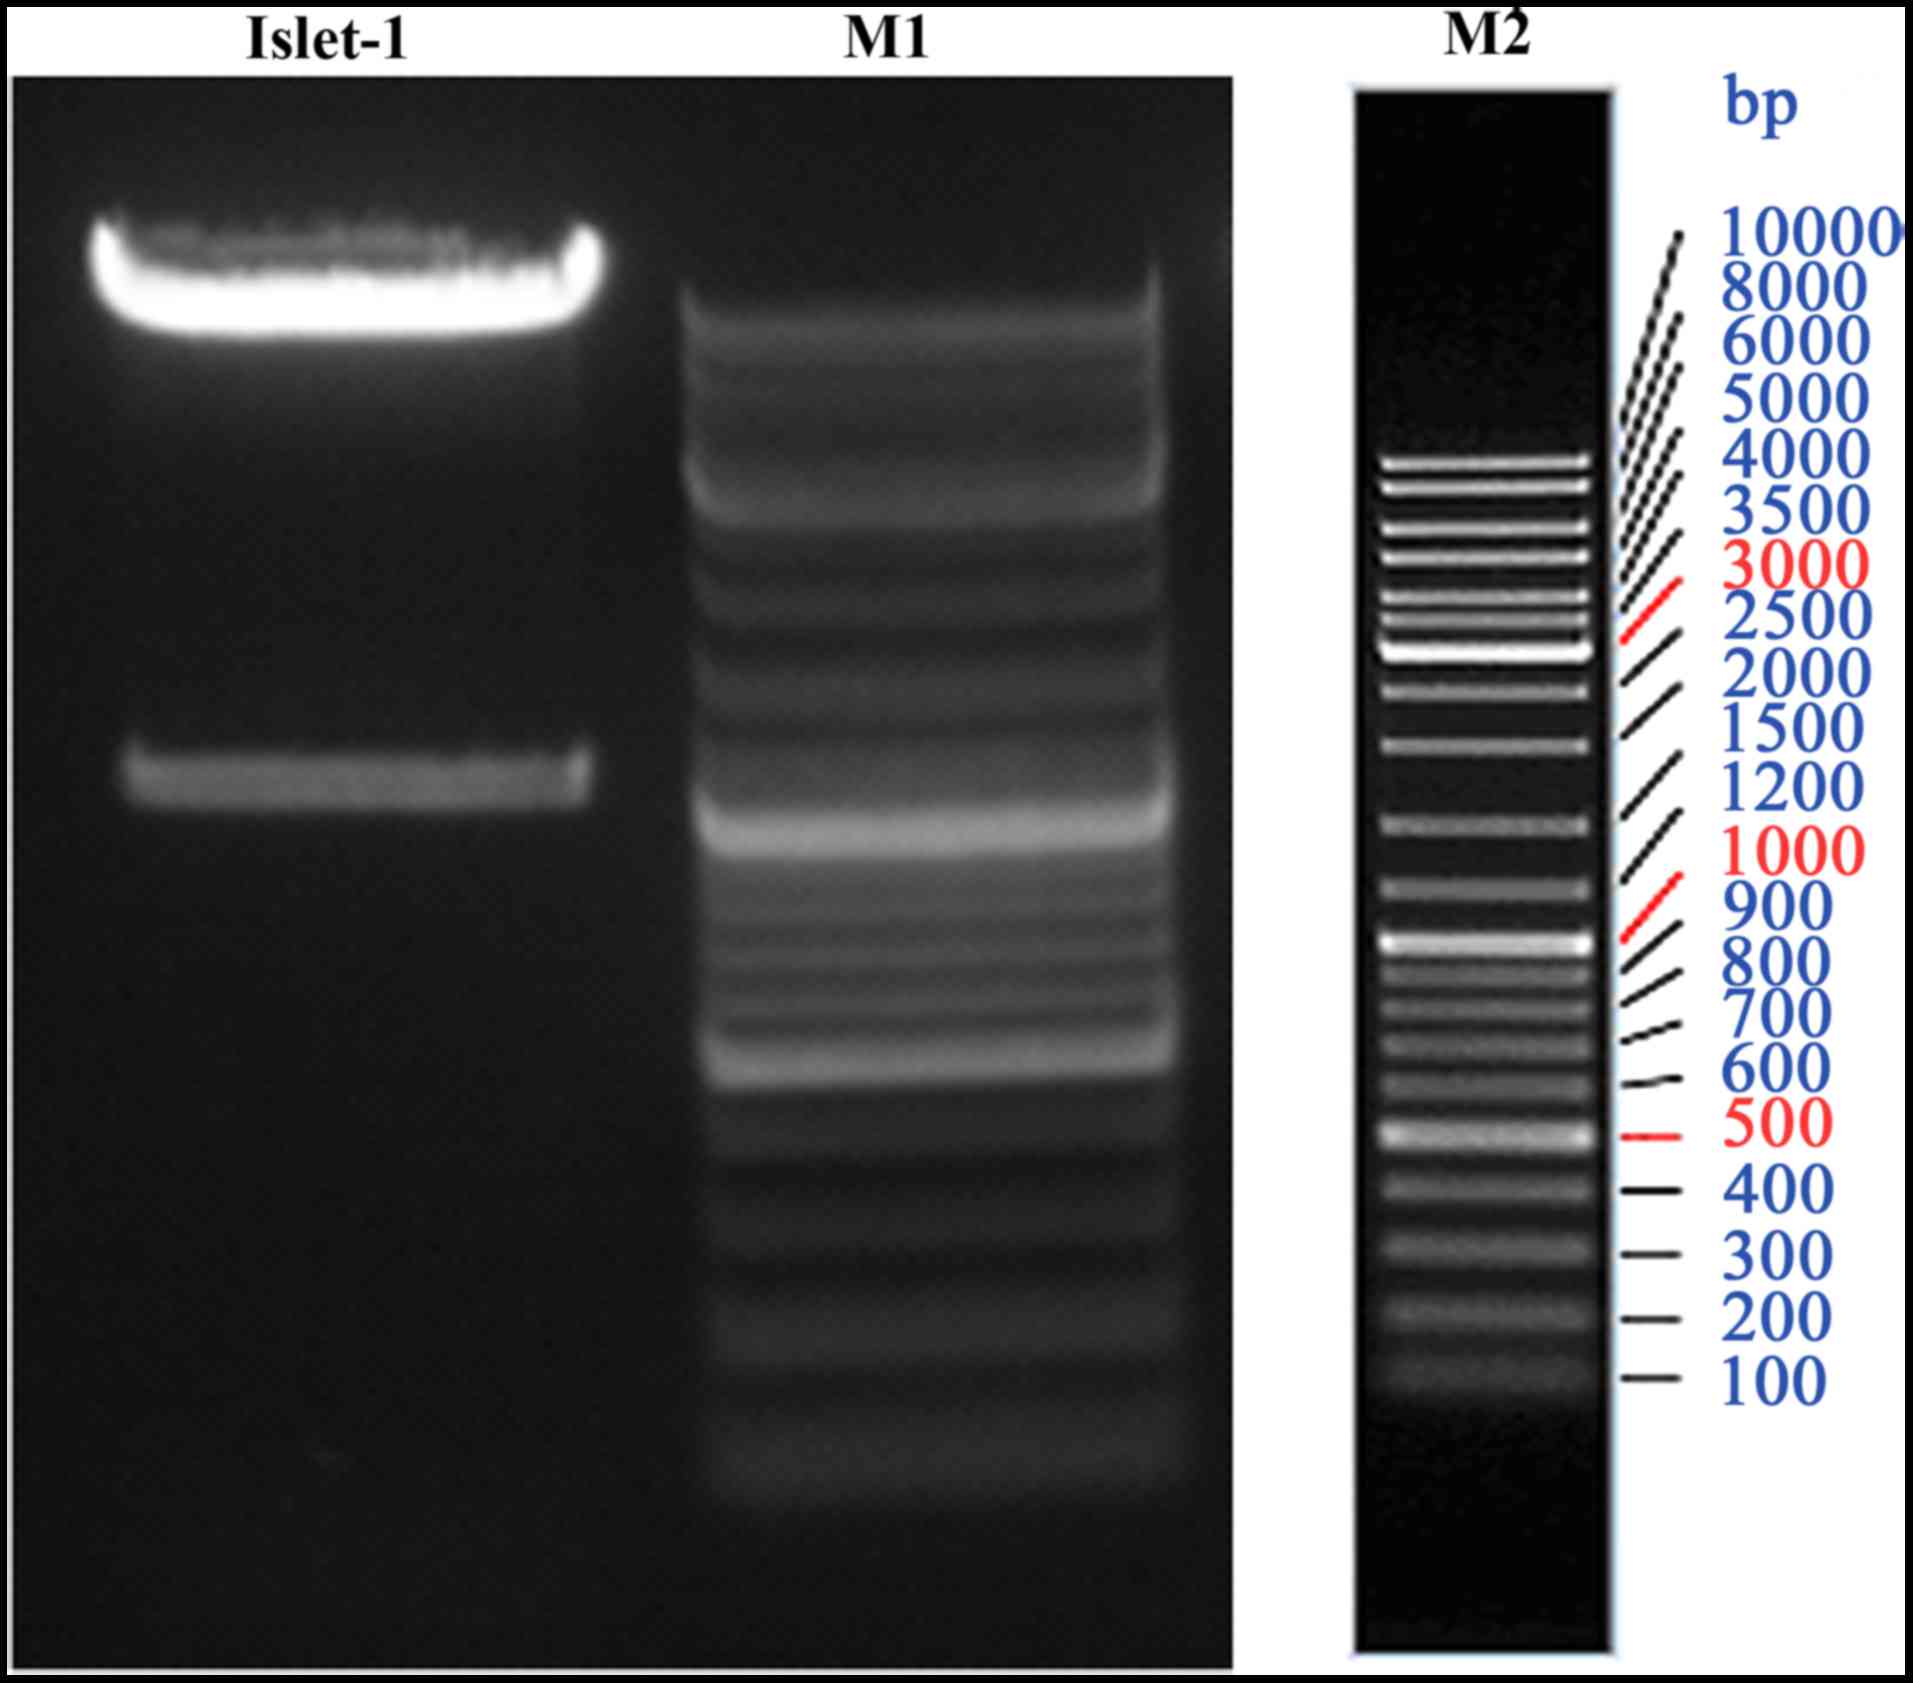
Construction of LV5-ISL1 homo and cell
transfection
The LV5-ISL1 homo vector was constructed and
identified by PCR and DNA sequencing. PCR analysis revealed a
single band of approximately 39 kDa in size in a 1% agarose gel
(Fig. 1). DNA sequencing
confirmed that the recombinant plasmid contained the ISL1 gene
fragment. The LV5-ISL1 homo with a viral titer of
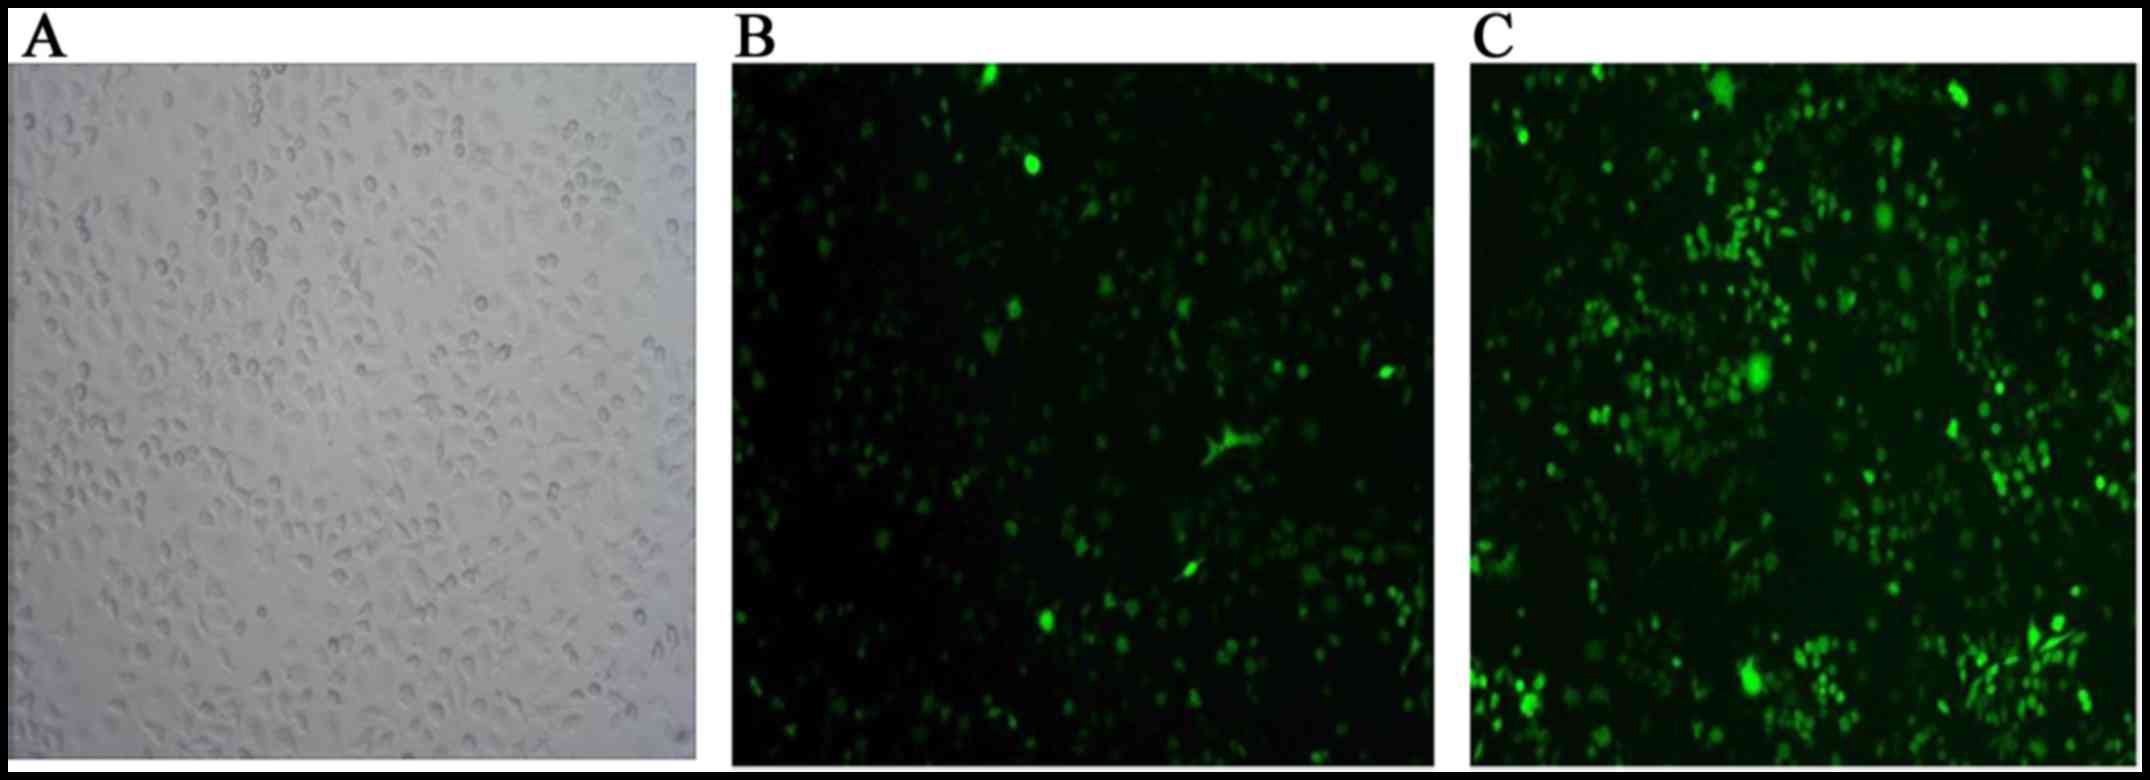
5.0×10⁸ TU/ml was used to transfect the human melanoma
A375 cells. Green fluorescence in the infected A375 cells, as
visualized under fluorescence optics indicated successful
transfection (Fig. 2). The
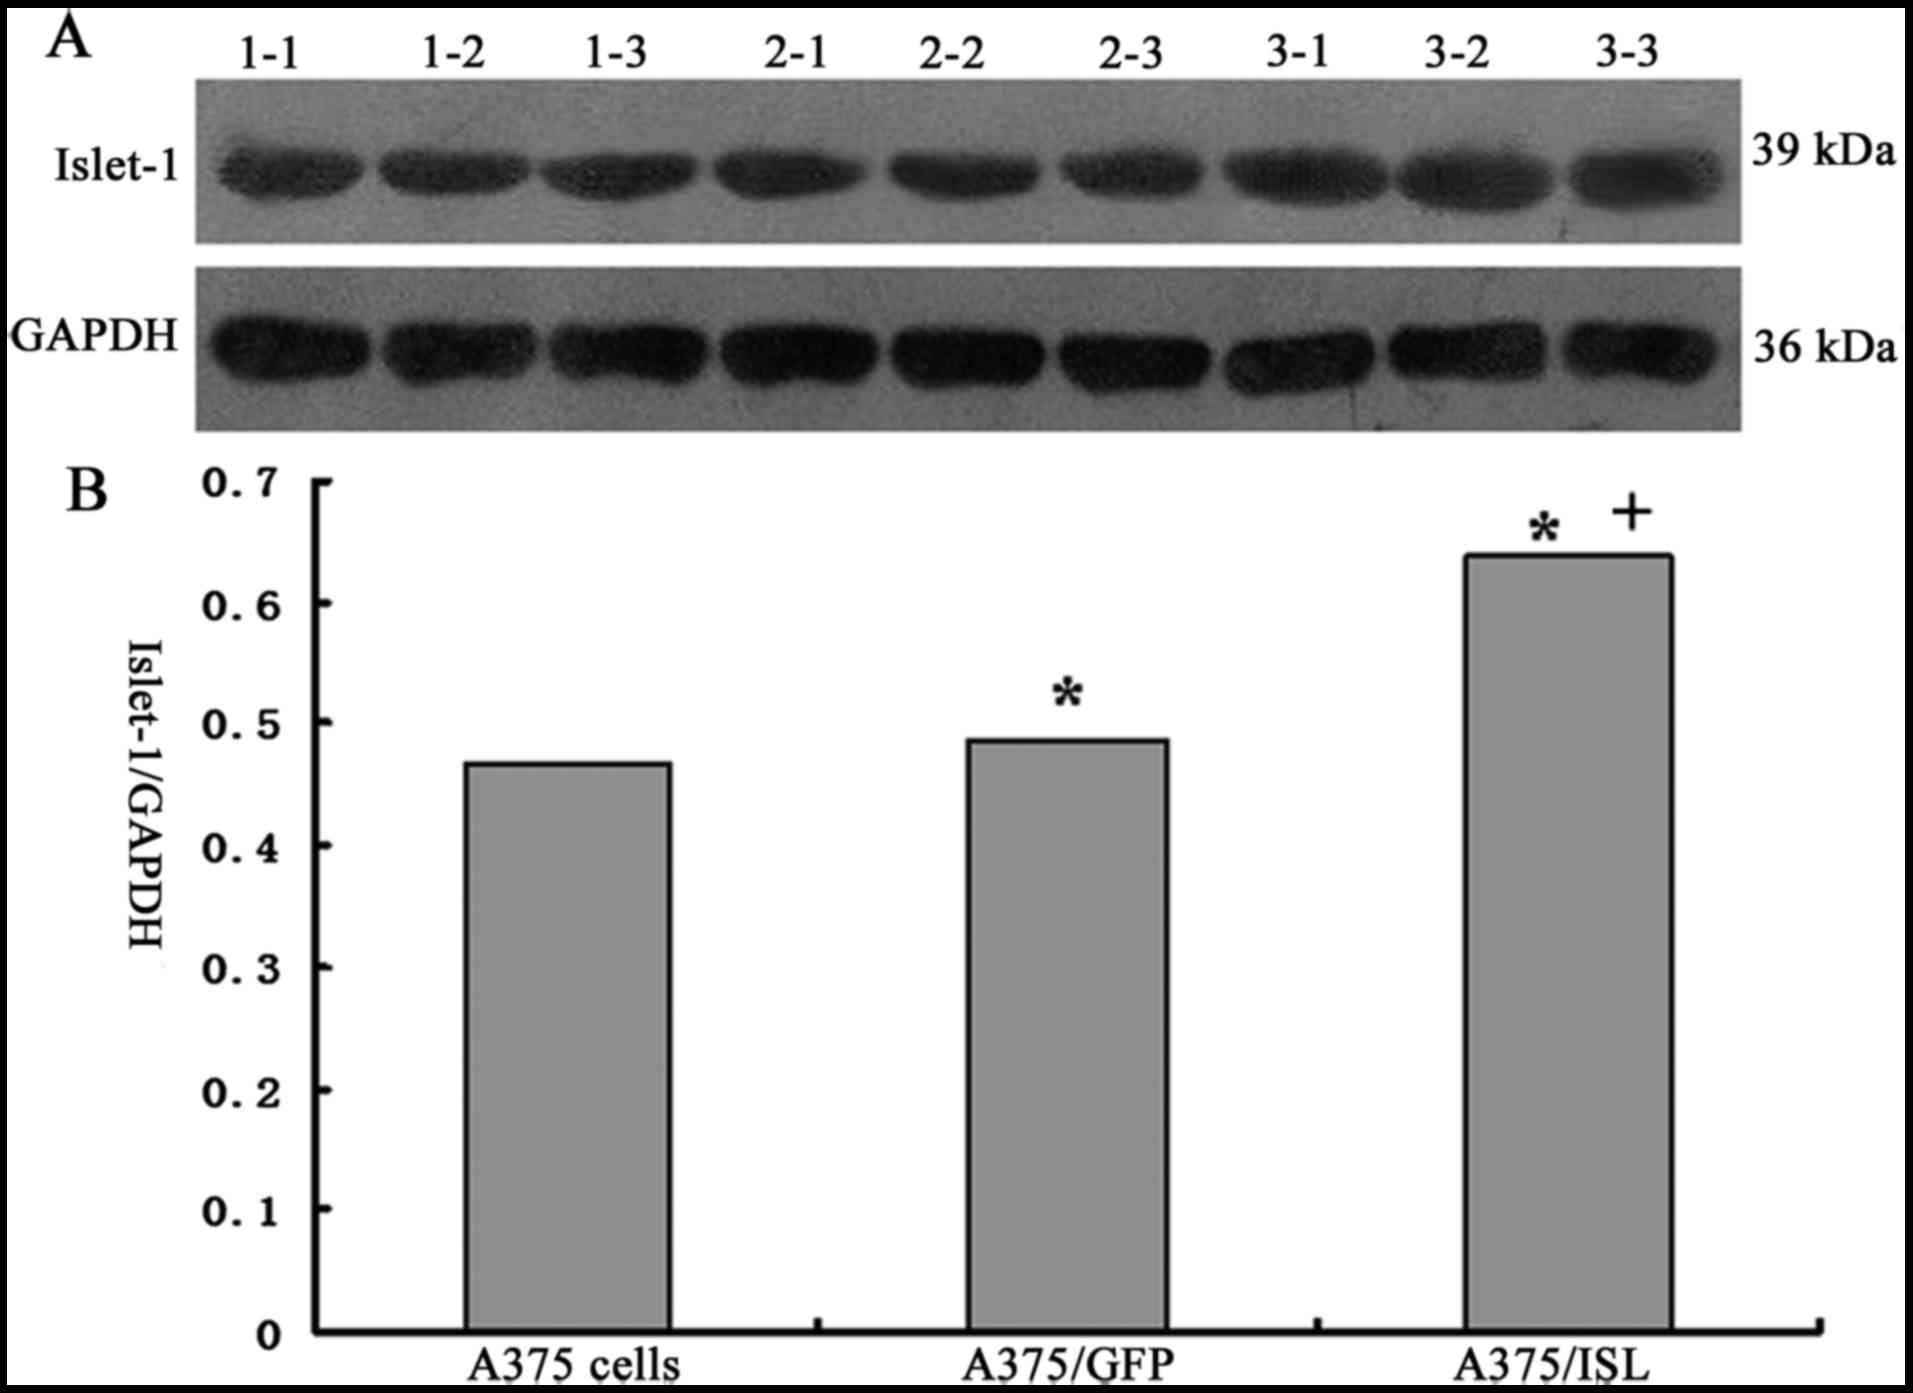
results of western blot analysis also revealed that ISL1 expression
was significantly increased in the A375/ISL cells compared with the
A375/GFP and A375 cells (Fig. 3A and
B).
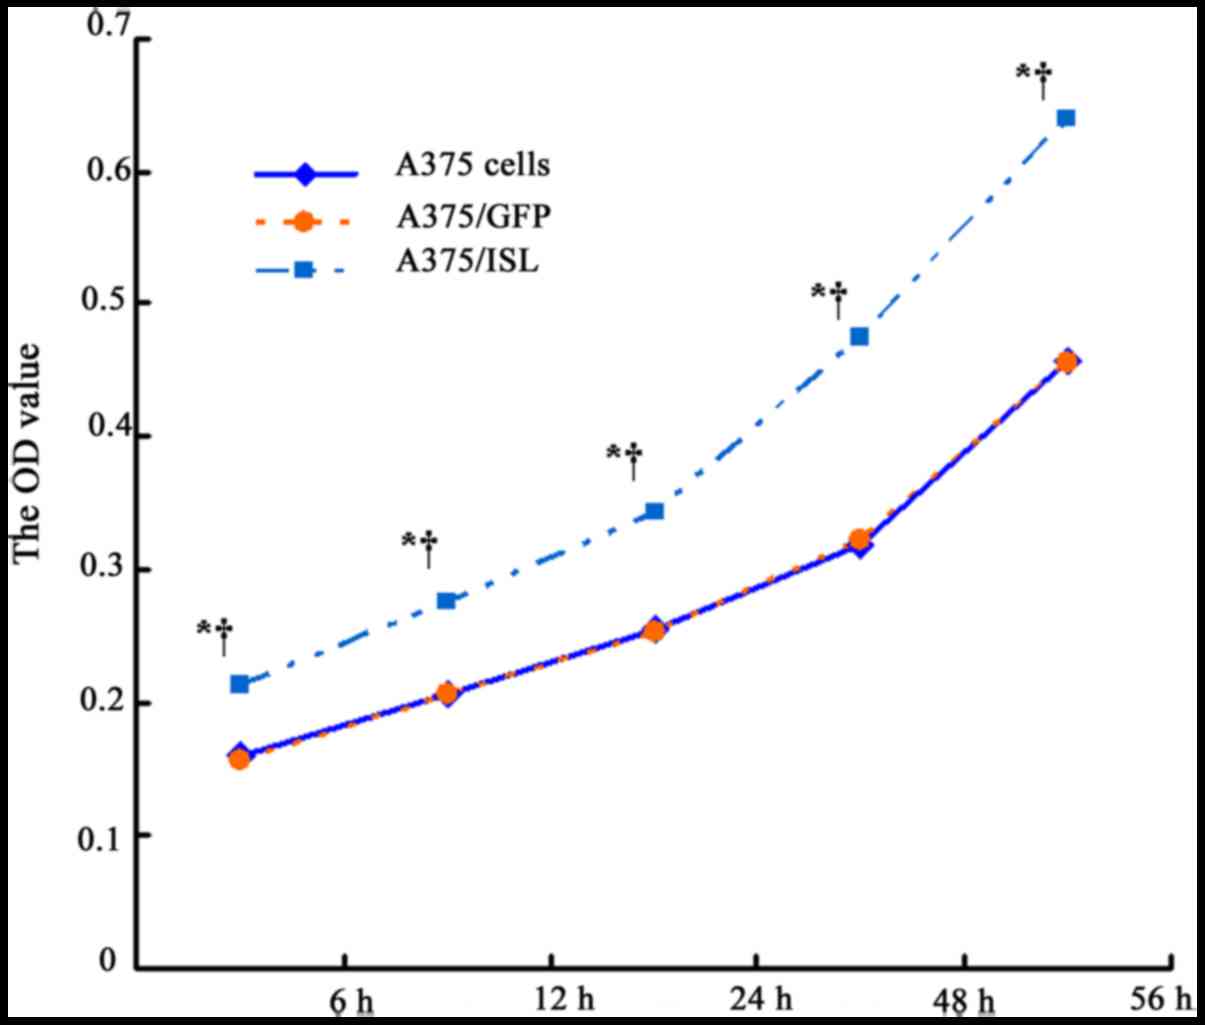
Promoting effects of ISL1 on the
proliferation of A375 cells
To examine the effects of ISL1 on the proliferation
of A375 cells, the viability of the transfected and untransfected
A375 cells was examined at 6, 12, 24, 48 and 56 h by MTT assay. As
shown in Fig. 4 and Table II, the OD value of the A375/ISL
cells was higher than that of the A375/GFP and A375 cells following
culture for 6 h (P<0.001), and the difference was more
conspicuous with a longer culture time (P<0.001 for 12, 24, 48
and 56 h). No statistical differences were observed at the various
time points between the A375/GFP and A375 cells (P>0.05). These
results suggested that ISL1 promotes the proliferation of A375
cells.
| Table IIOptical density of the 3 groups of
A375 cells following culture for 6, 12, 24, 48 and 56 h. |
Table II
Optical density of the 3 groups of
A375 cells following culture for 6, 12, 24, 48 and 56 h.
| Cells | Optical density
value at different time points
|
|---|
| 6 h | 12 h | 24 h | 48 h | 56 h |
|---|
| A375 | 0.1593±0.0010 | 0.2063±0.0047 | 0.2539±0.0034 | 0.3183±0.0030 | 0.4572±0.0091 |
| A375/GFP | 0.1556±0.0061 | 0.2054±0.0058 | 0.2526±0.0136 | 0.3221±0.0147 | 0.4565±0.0071 |
| A375/GSN | 0.2133±0.0033 | 0.2750±0.0065 | 0.3439±0.0097 | 0.4745±0.0087 | 0.6392±0.0022 |
| P1 | 0.480 | 0.975 | 0.979 | 0.861 | 0.986 |
| P2 | <0.001 | <0.001 | <0.001 | <0.001 | <0.001 |
| P3 | <0.001 | <0.001 | <0.001 | <0.001 | <0.001 |
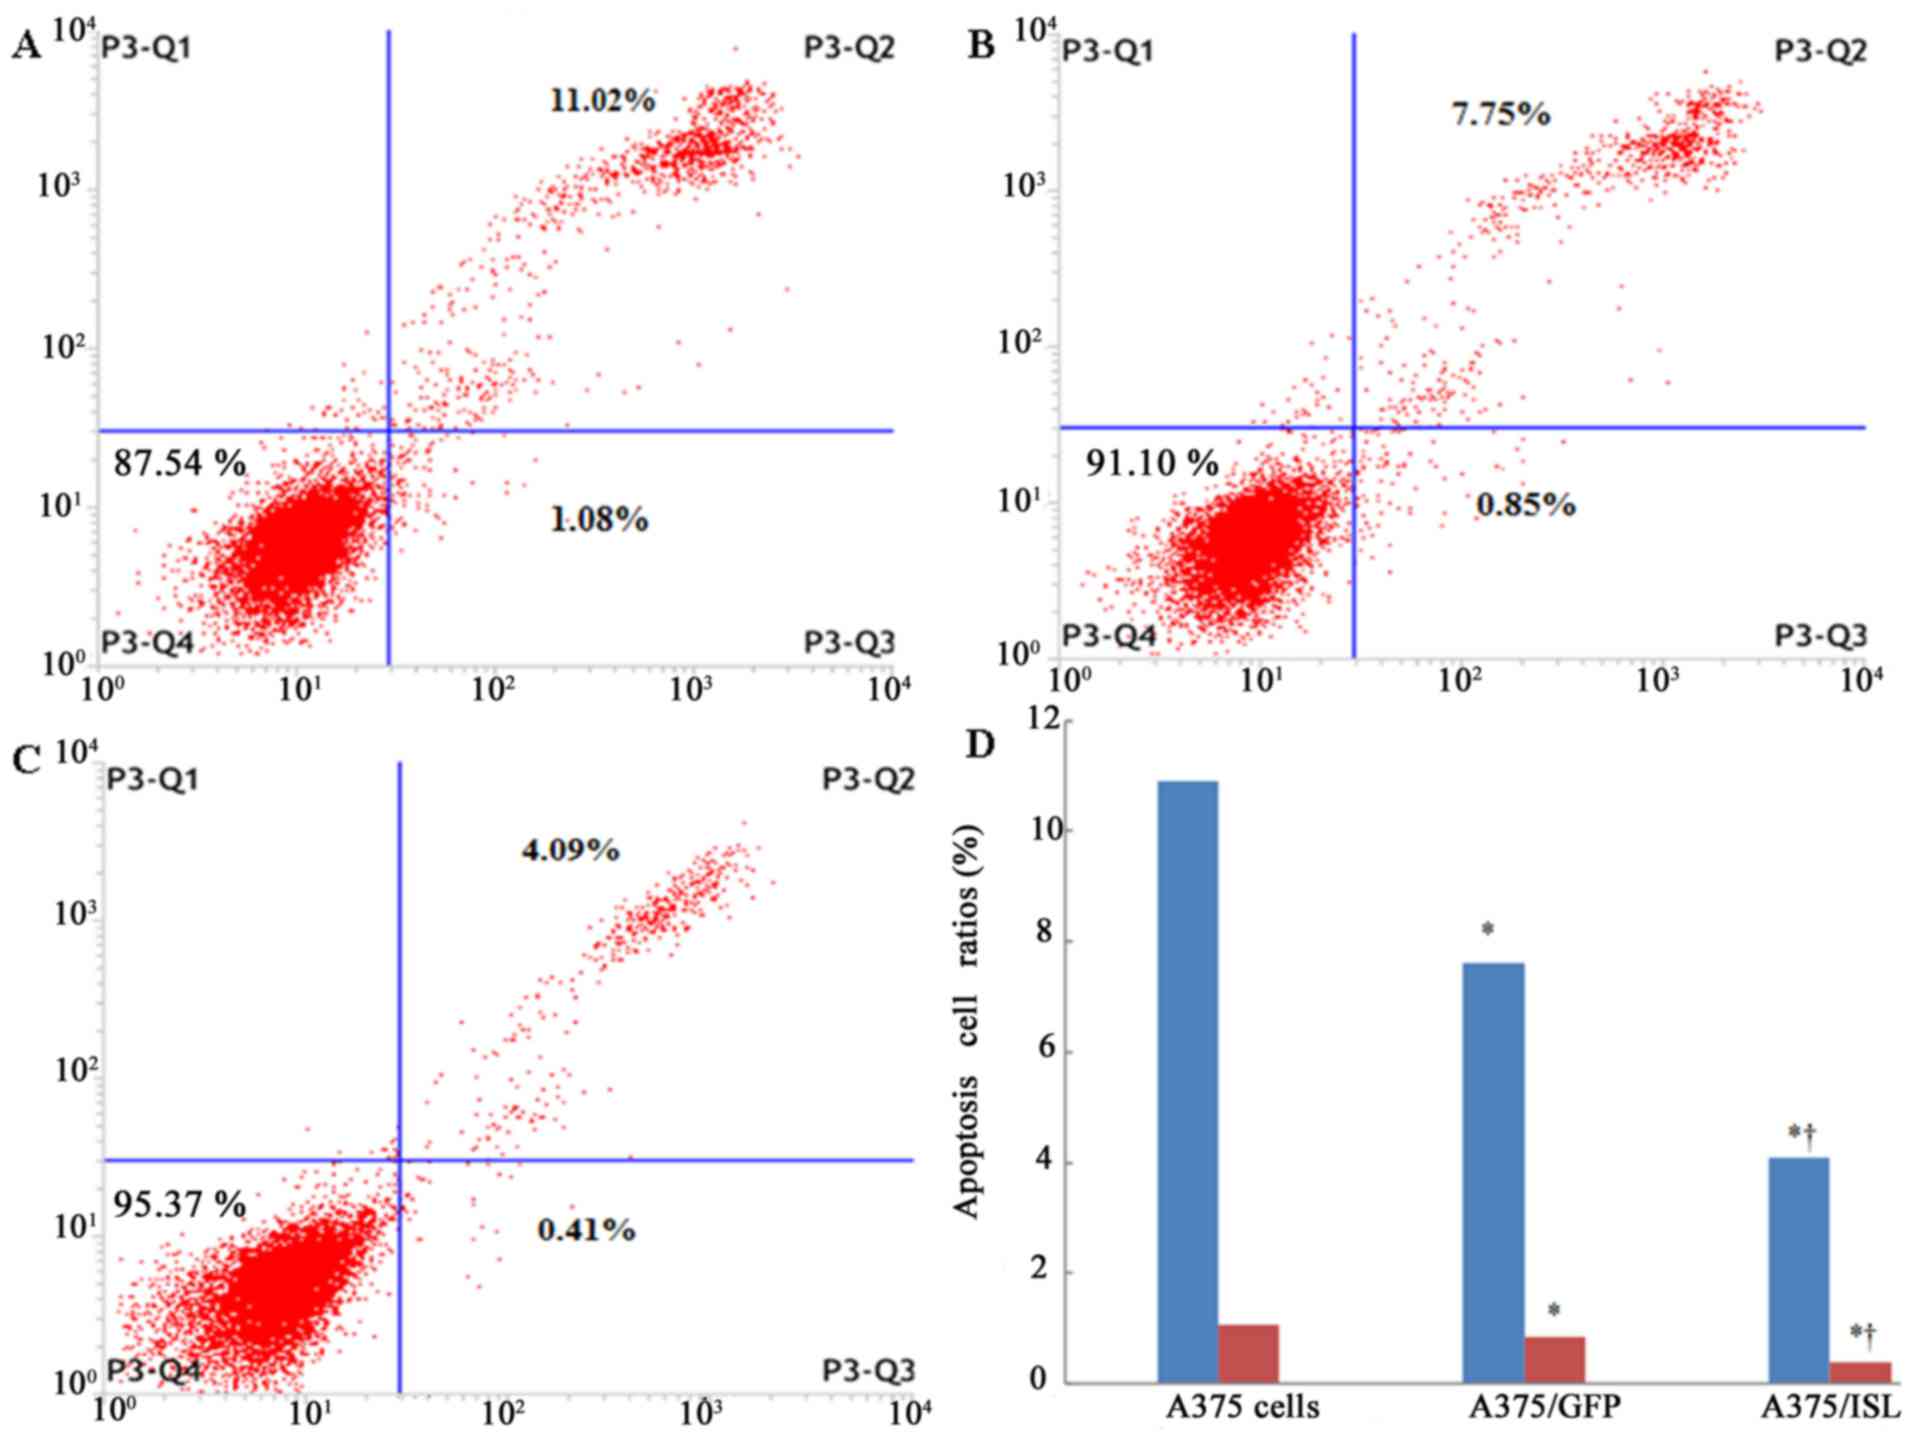
Effects of ISL1 on the apoptosis of A375
cells
Flow cytometry using Annexin V-PE and 7-AAD staining
was conducted to estimate cell apoptosis at 48 h following
transfection. As shown in Fig. 5,
the number of viable cells in the A375 and A375/GFP groups was
87.54 and 91.10%, respectively (Fig.
5A and B), whereas the A375/ISL cells exhibited an increase in
viability to 95.37% (Fig. 5C).
Moreover, the ratio of apoptotic cells in the A375/ISL group
(4.50%) was significantly lower than that in the A375/GFP (8.60%)
and A375 (12.10%) groups (Fig.
5D; P<0.001). No statistically significant difference in the
ratios between the A375/GFP and A375 cells was observed (P=0.066).
These findings suggested that ISL1 markedly inhibited the apoptosis
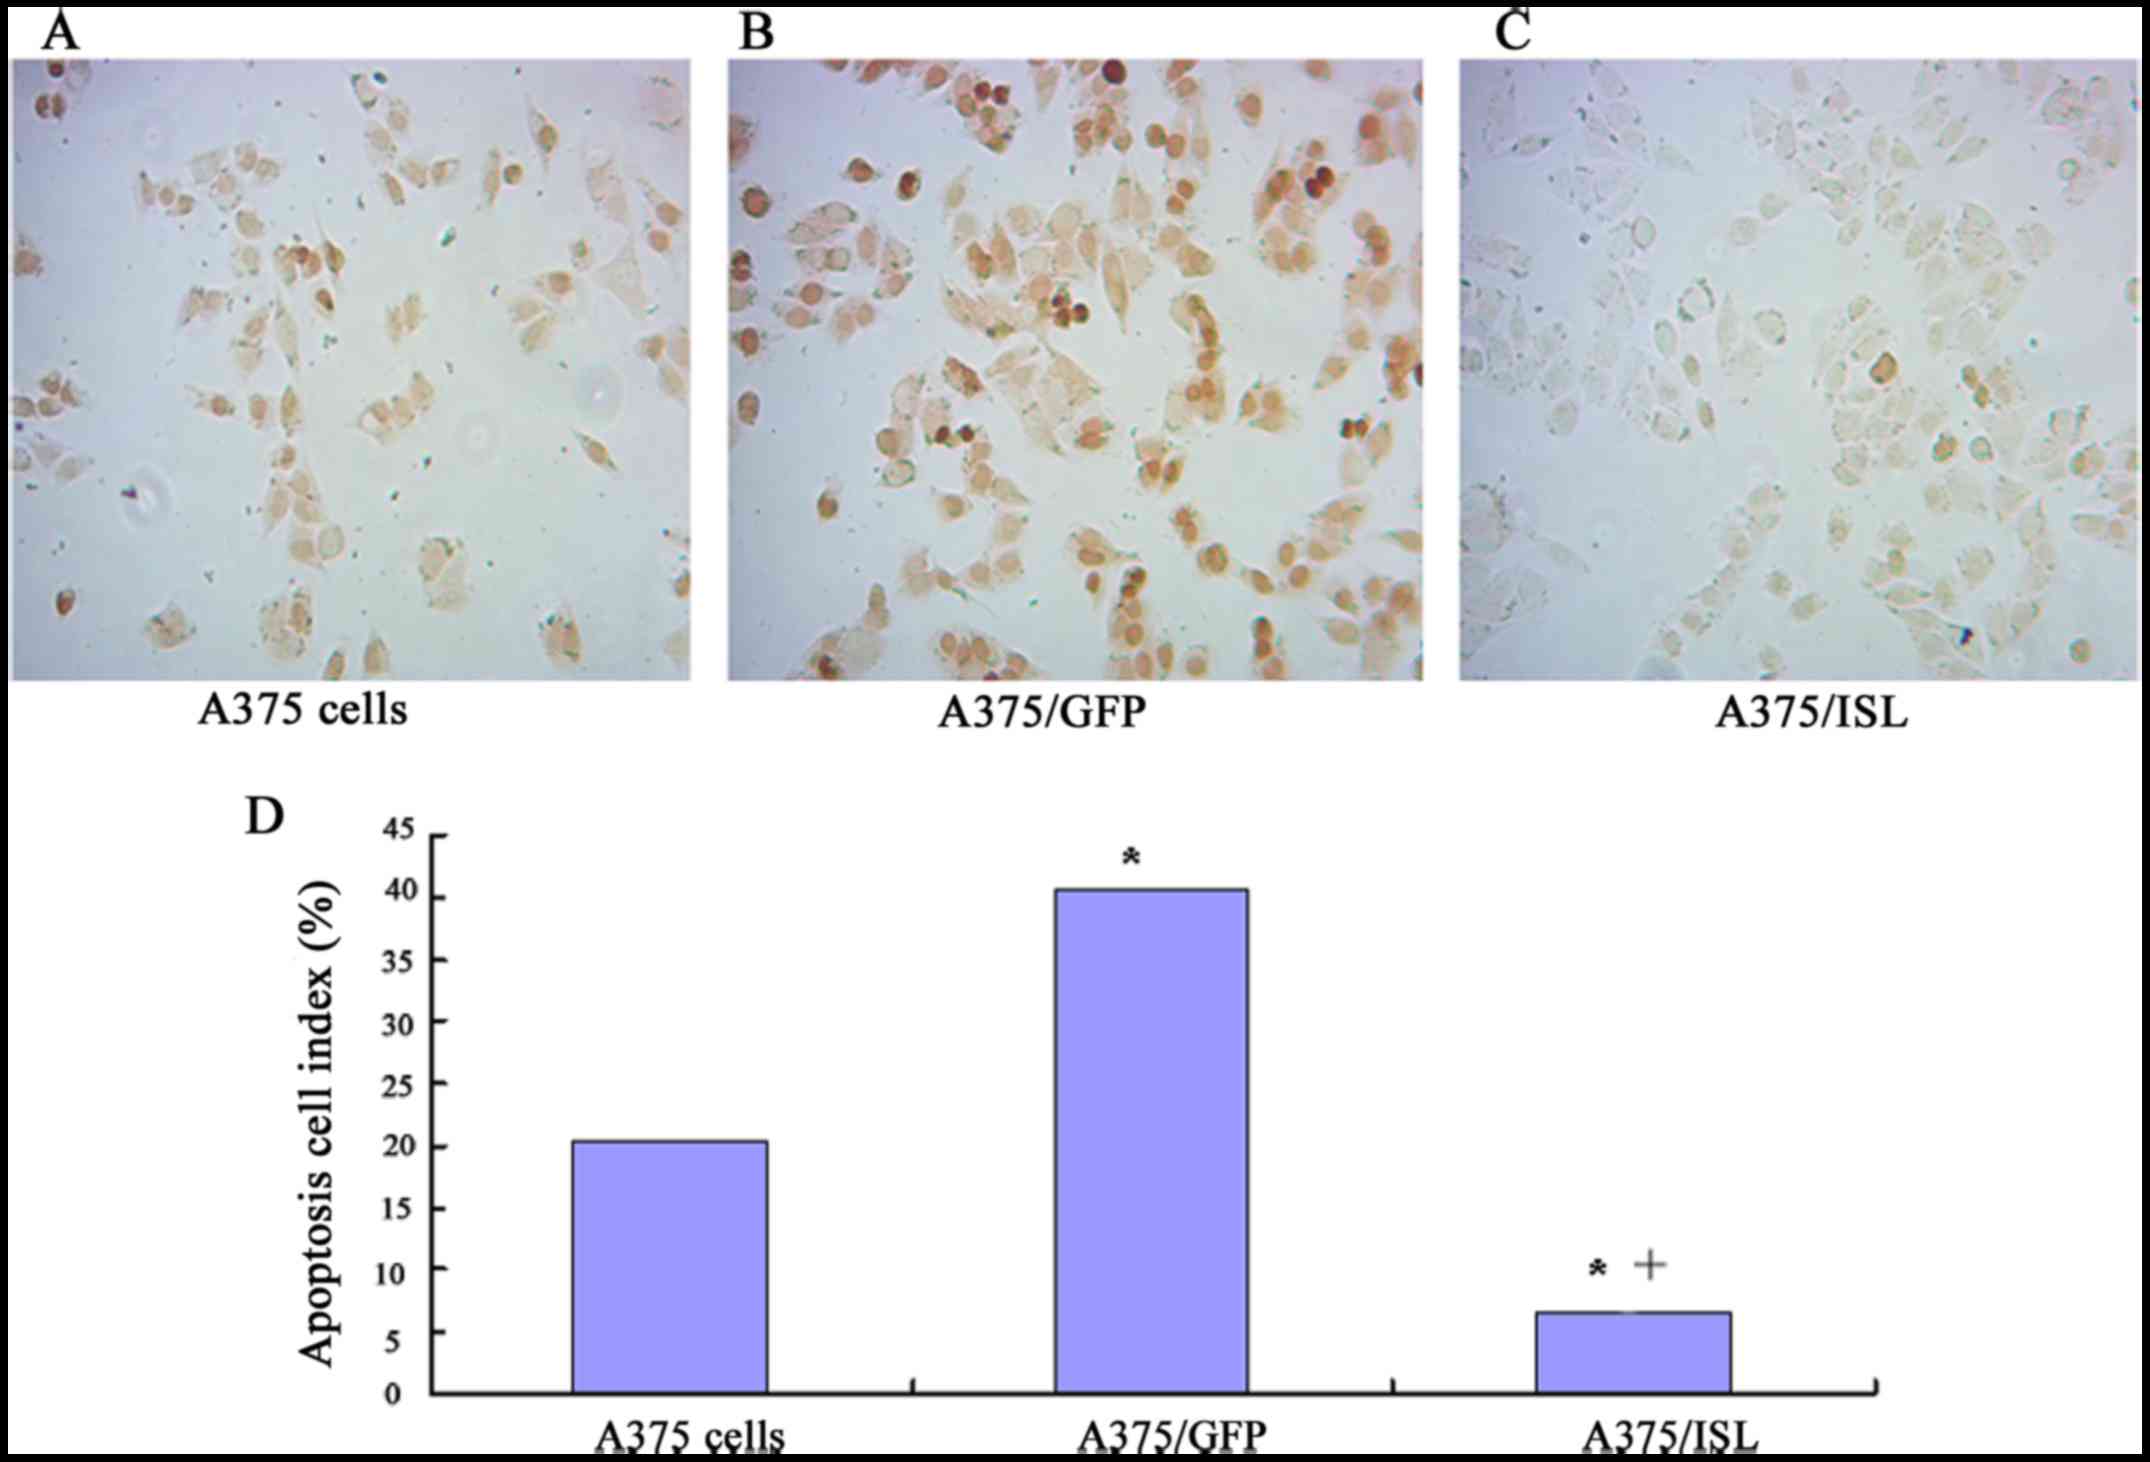
of the A375 cells. To verify this observation, we used the sections
of TUNEL staining with brown DAB (Boster Bioengineering Co., Ltd.).
As shown in Fig. 6, a small of
TUNEL-positive cells in the A375/ISL group were observed, whereas
several cells were stained brown in the A375/GFP and A375 groups
(Fig. 6A–C). Furthermore, the
number of TUNEL-positive cells was significantly lower in the
A375/ISL (6.67±2.31) group compared with the A375/GFP (40.67±4.73)
and A375 group s (20.33±6.66) (P<0.001). No statistically
significant difference in the ratios between the A375/GFP and A375
cells was observed (P=0.073; Fig.
6D).
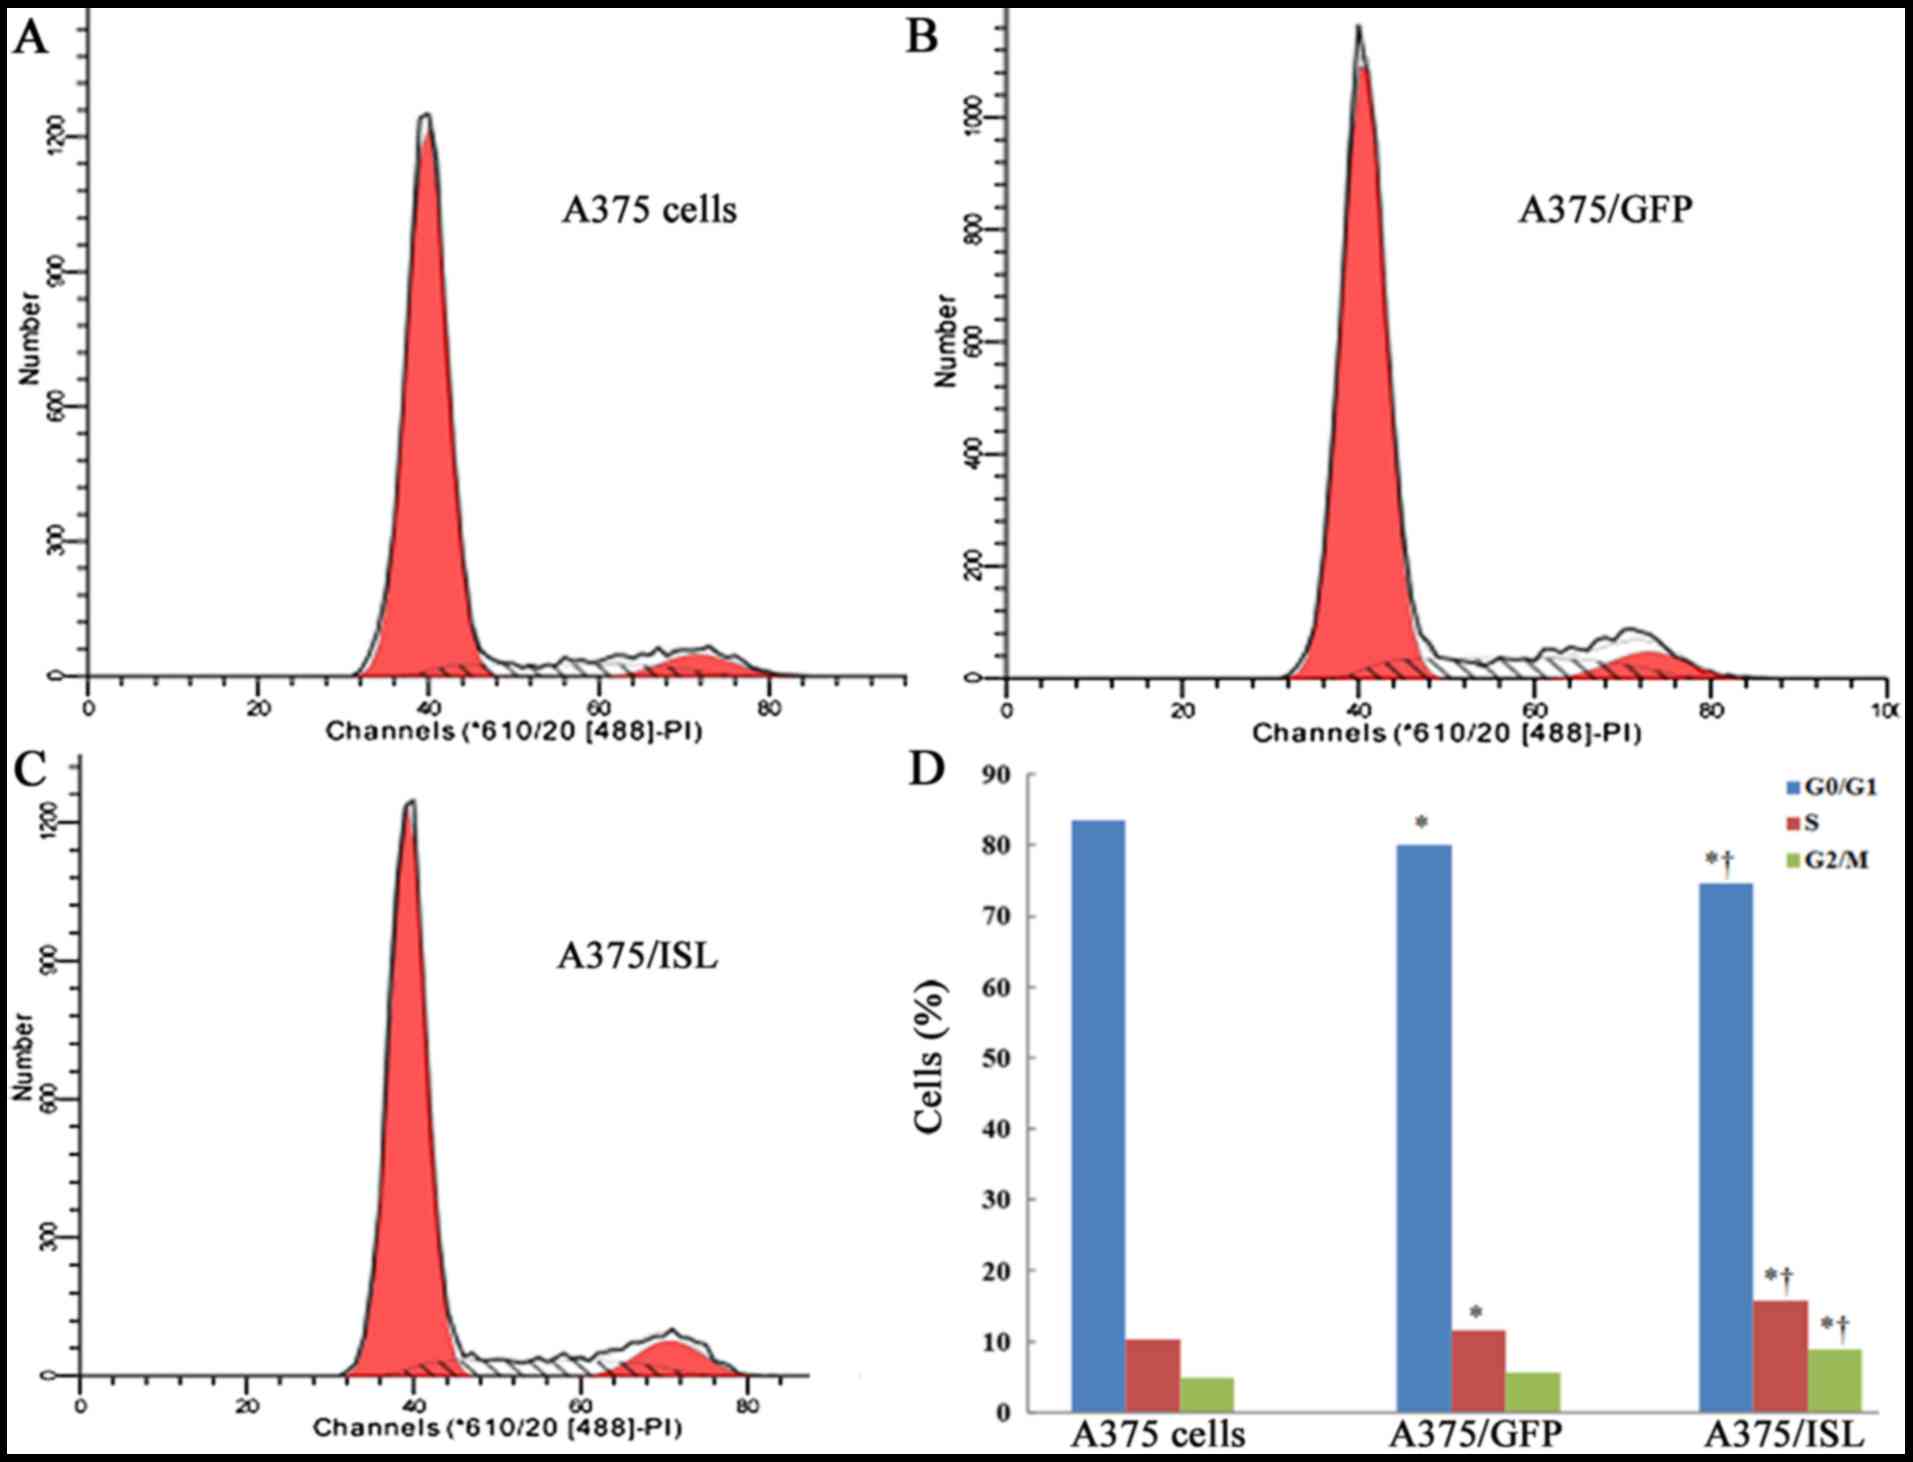
ISL1 induces G1 arrest in the A375
cells
To investigate the mechanisms responsible for the
inhibitory effects of ISL1 on the apoptosis of A375 cells, we first
examined its effects on cell cycle progression by flow cytometry.
The percentages of cells in the G0/G1, S and G2/M phases in the 3
groups of A375 cells at 48 h are shown in Fig. 7. Compared to the A375/GFP and A375
cells, the percentage of A375/ISL cells in S phase was
significantly increased, while that in the G0/G1 phase was
decreased (P<0.001; Fig. 7D).
These findings indicate that ISL1 may play a role in promoting the
proliferation of A375 cells.
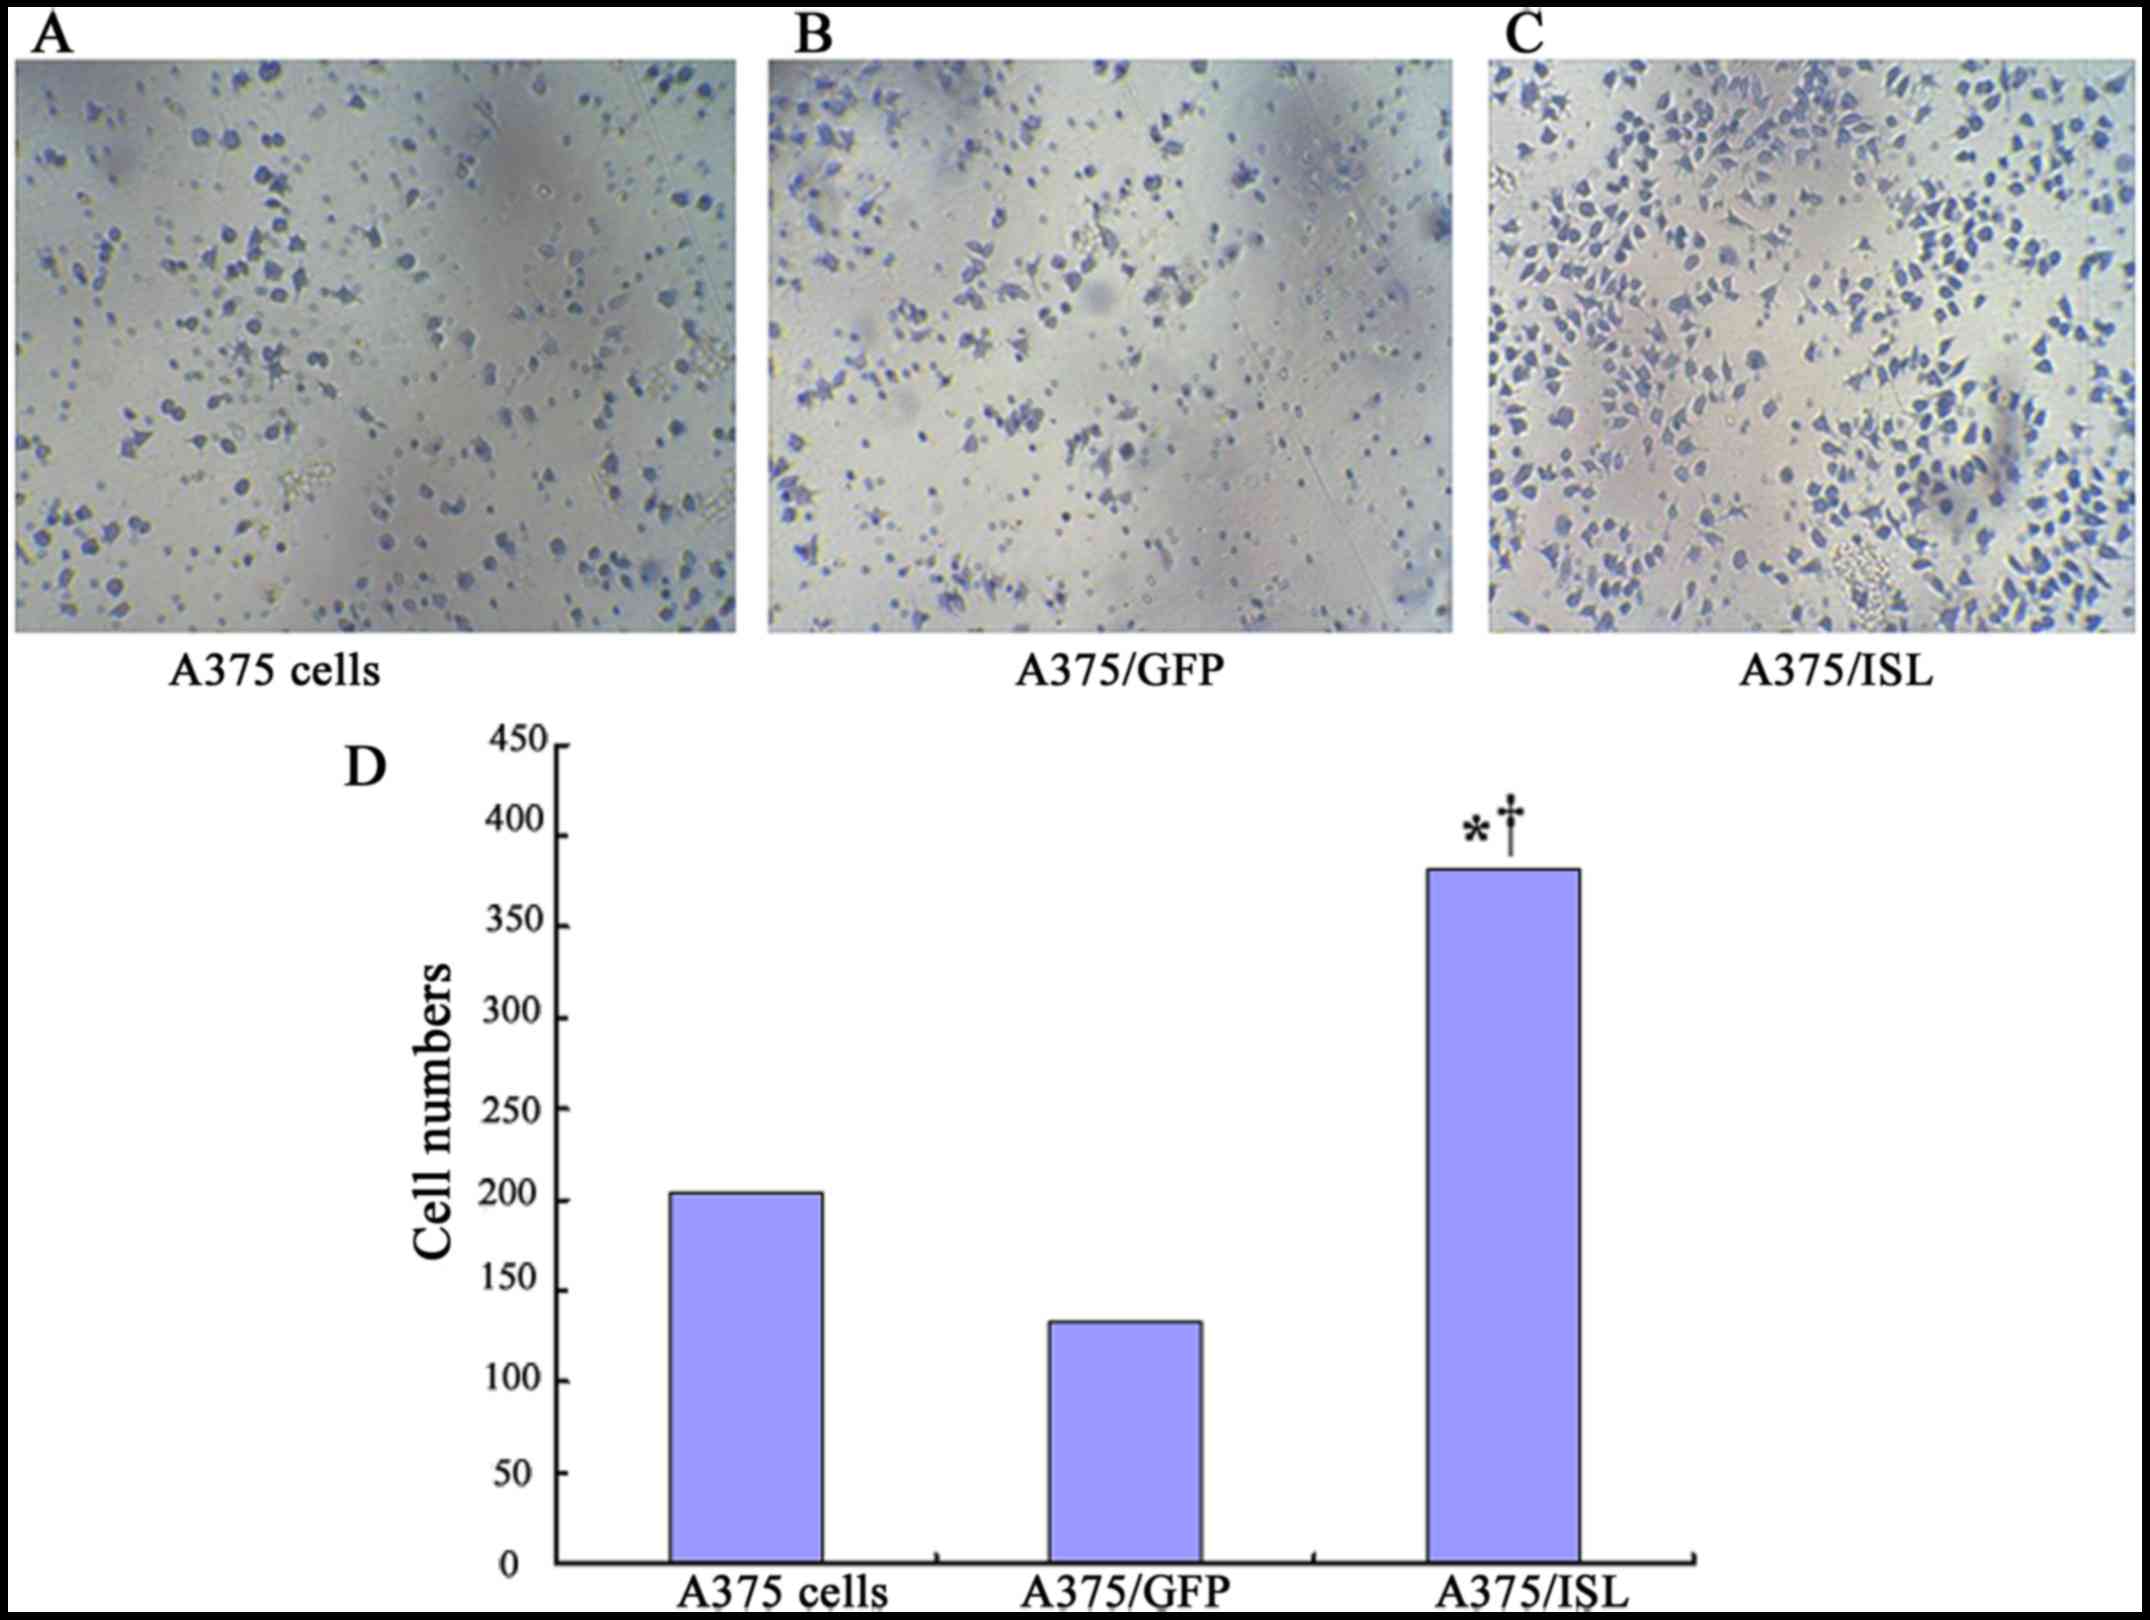
Effects of ISL1 on the invasive capacity
of A375 cells
We examined the effects of ISL1 on the capacity of
A375 cells to undergo invasion by using penetration experiments on
Transwell chambers coated with Matrigel. The cells exhibiting an
invasive ability will digest the Matrigel and penetrate the
8-µm pores on the polycarbonate membrane. In the present
study, a higher number of A375/ISL cells penetrated the Matrigel
compared to that observed with the A375/GFP and A375 cells
(Fig. 8). The average penetration
rate of the A375/ISL cells (381.50±21.98) was significantly higher
than that of the A375/GFP cells (134.00±37.07) and A375 cells
(204.75±62.74) (P=0.001; P<0.001, respectively). No
statistically significant differences in the average penetration
rate between the A375/GFP and A375 cells were observed (P=0.086;
Fig. 8D).
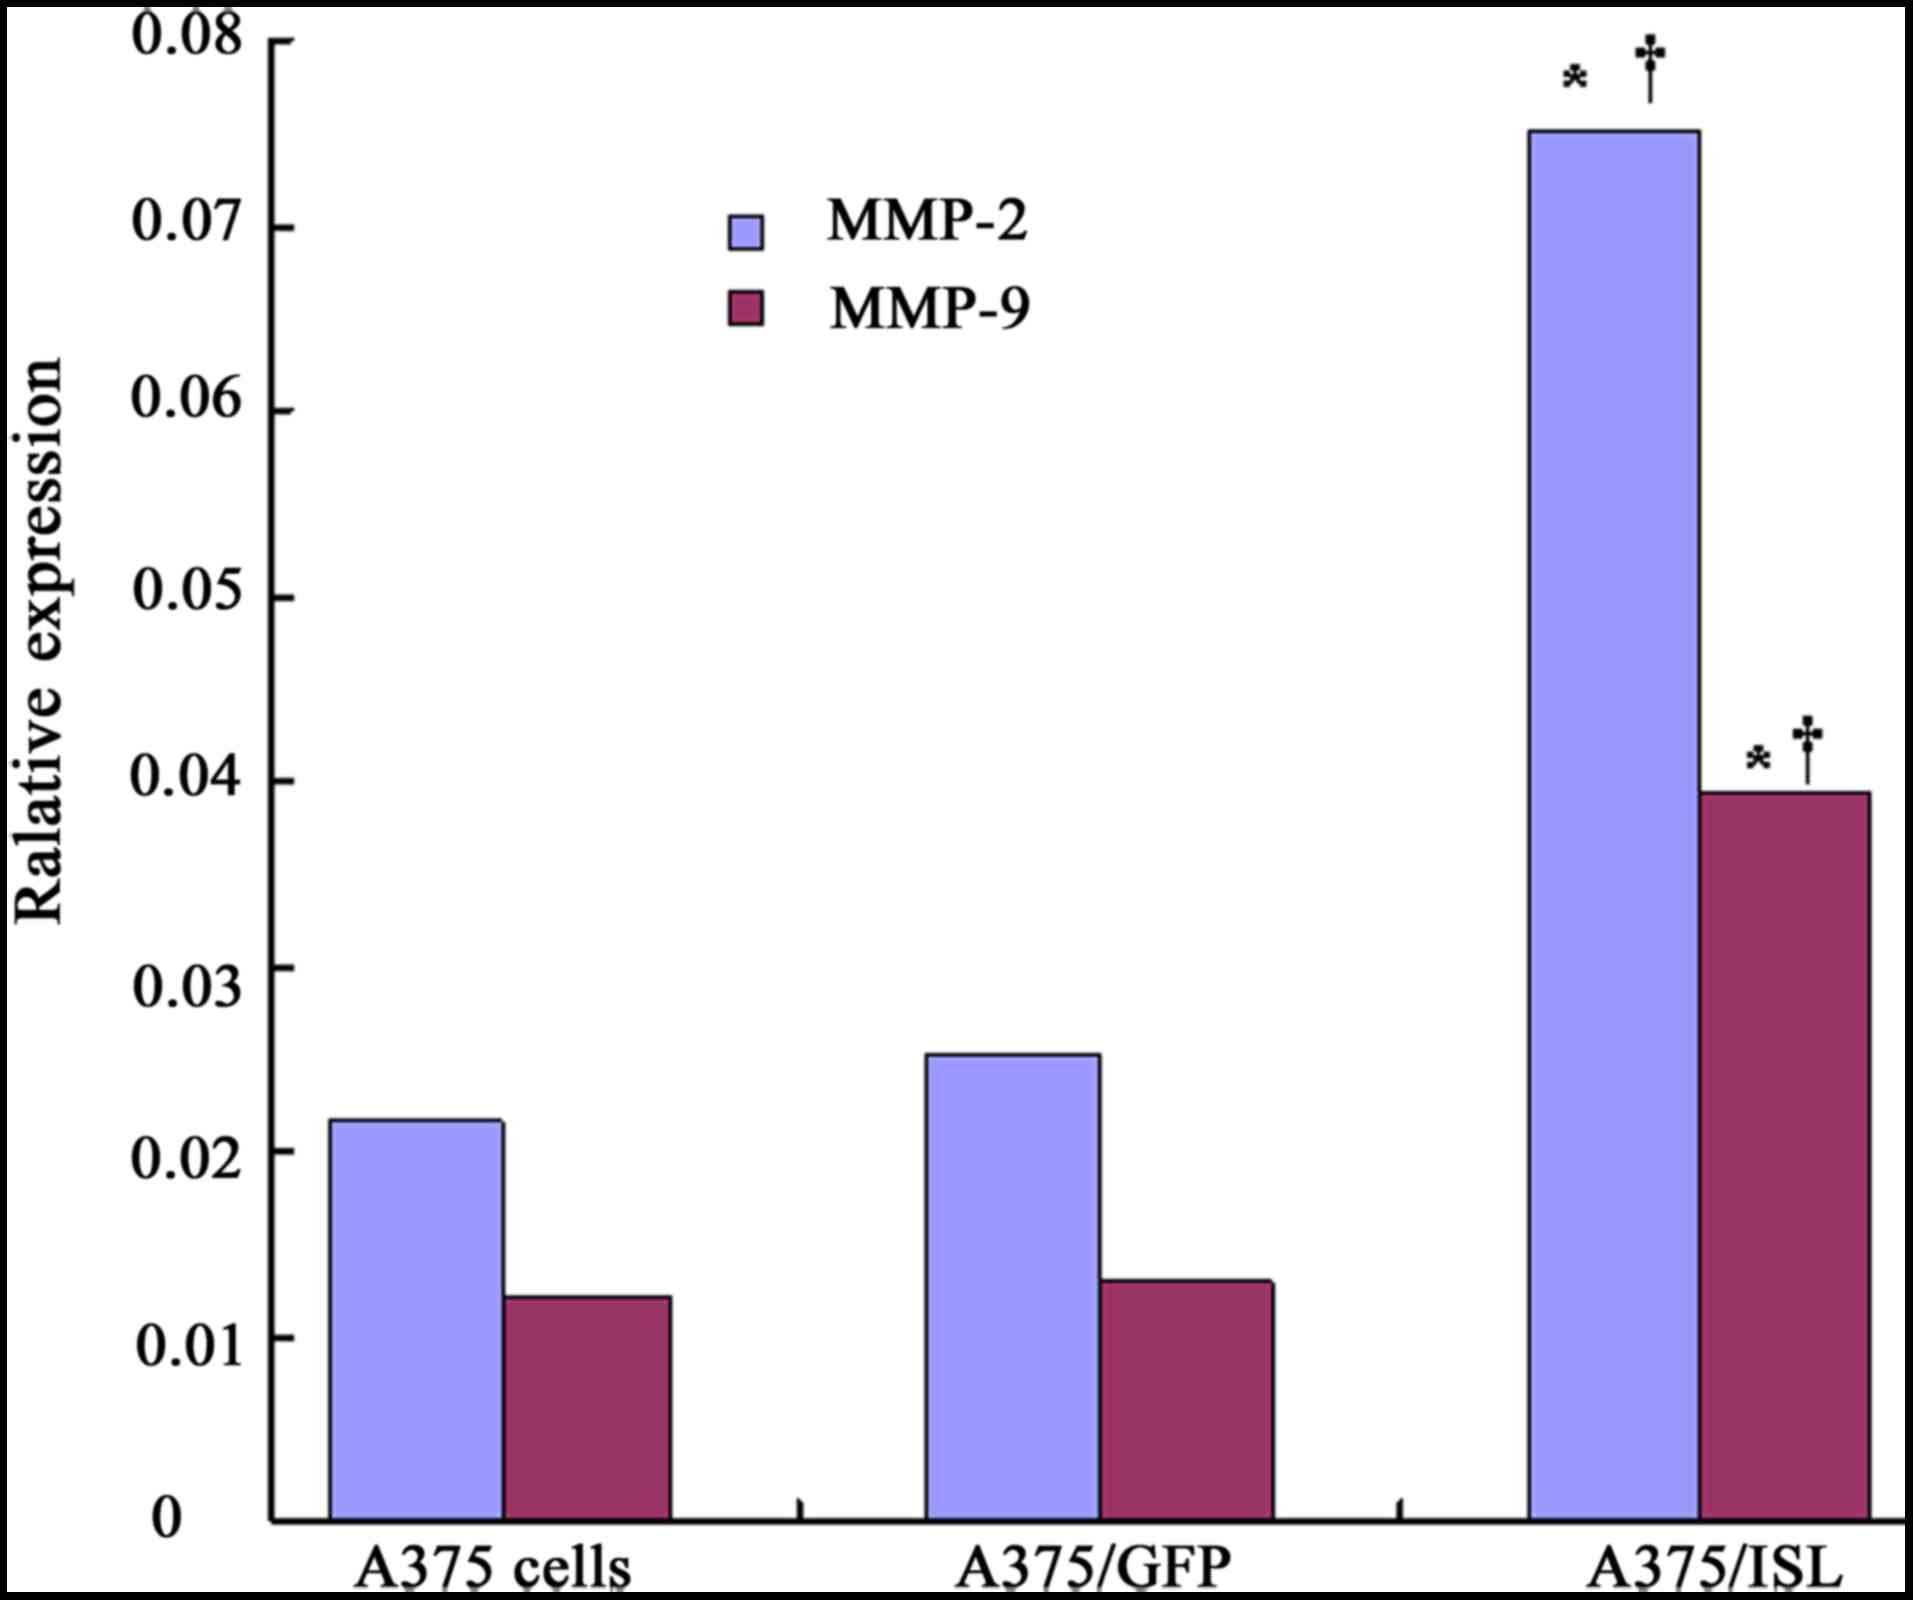
Effects of ISL1 on the expression levels
of MMP-2 and MMP-9
The mRNA expression levels of MMP-2 and MMP-9 were
found to increase in the transfected A375 cells compared with the
untransfected A375 cells, as indicated by qPCR analysis. As shown
in Fig. 9, the mRNA expression
levels of MMP-2 and MMP-9 significantly increased in the A375/ISL
cells (0.0750±0.0085 and 0.0394±0.0041), and these levels were
markedly higher than those in the A375/GFP cells (0.0251±0.0031 and
0.0129±0.0022, respectively) and the A375 cells (0.0215±0.0012 and
0.0121±0.0012, respectively) at 48 h after transfection, with a
significant difference observed between the A375/ISL and A375/GFP
cells (P<0.001) and between the A375/ISL and A375 cells
(P<0.001), as shown by one-way ANOVA. However, no statistically
significant differences were observed between the A375/GFP and A375
cells (Fig. 9; P>0.05).
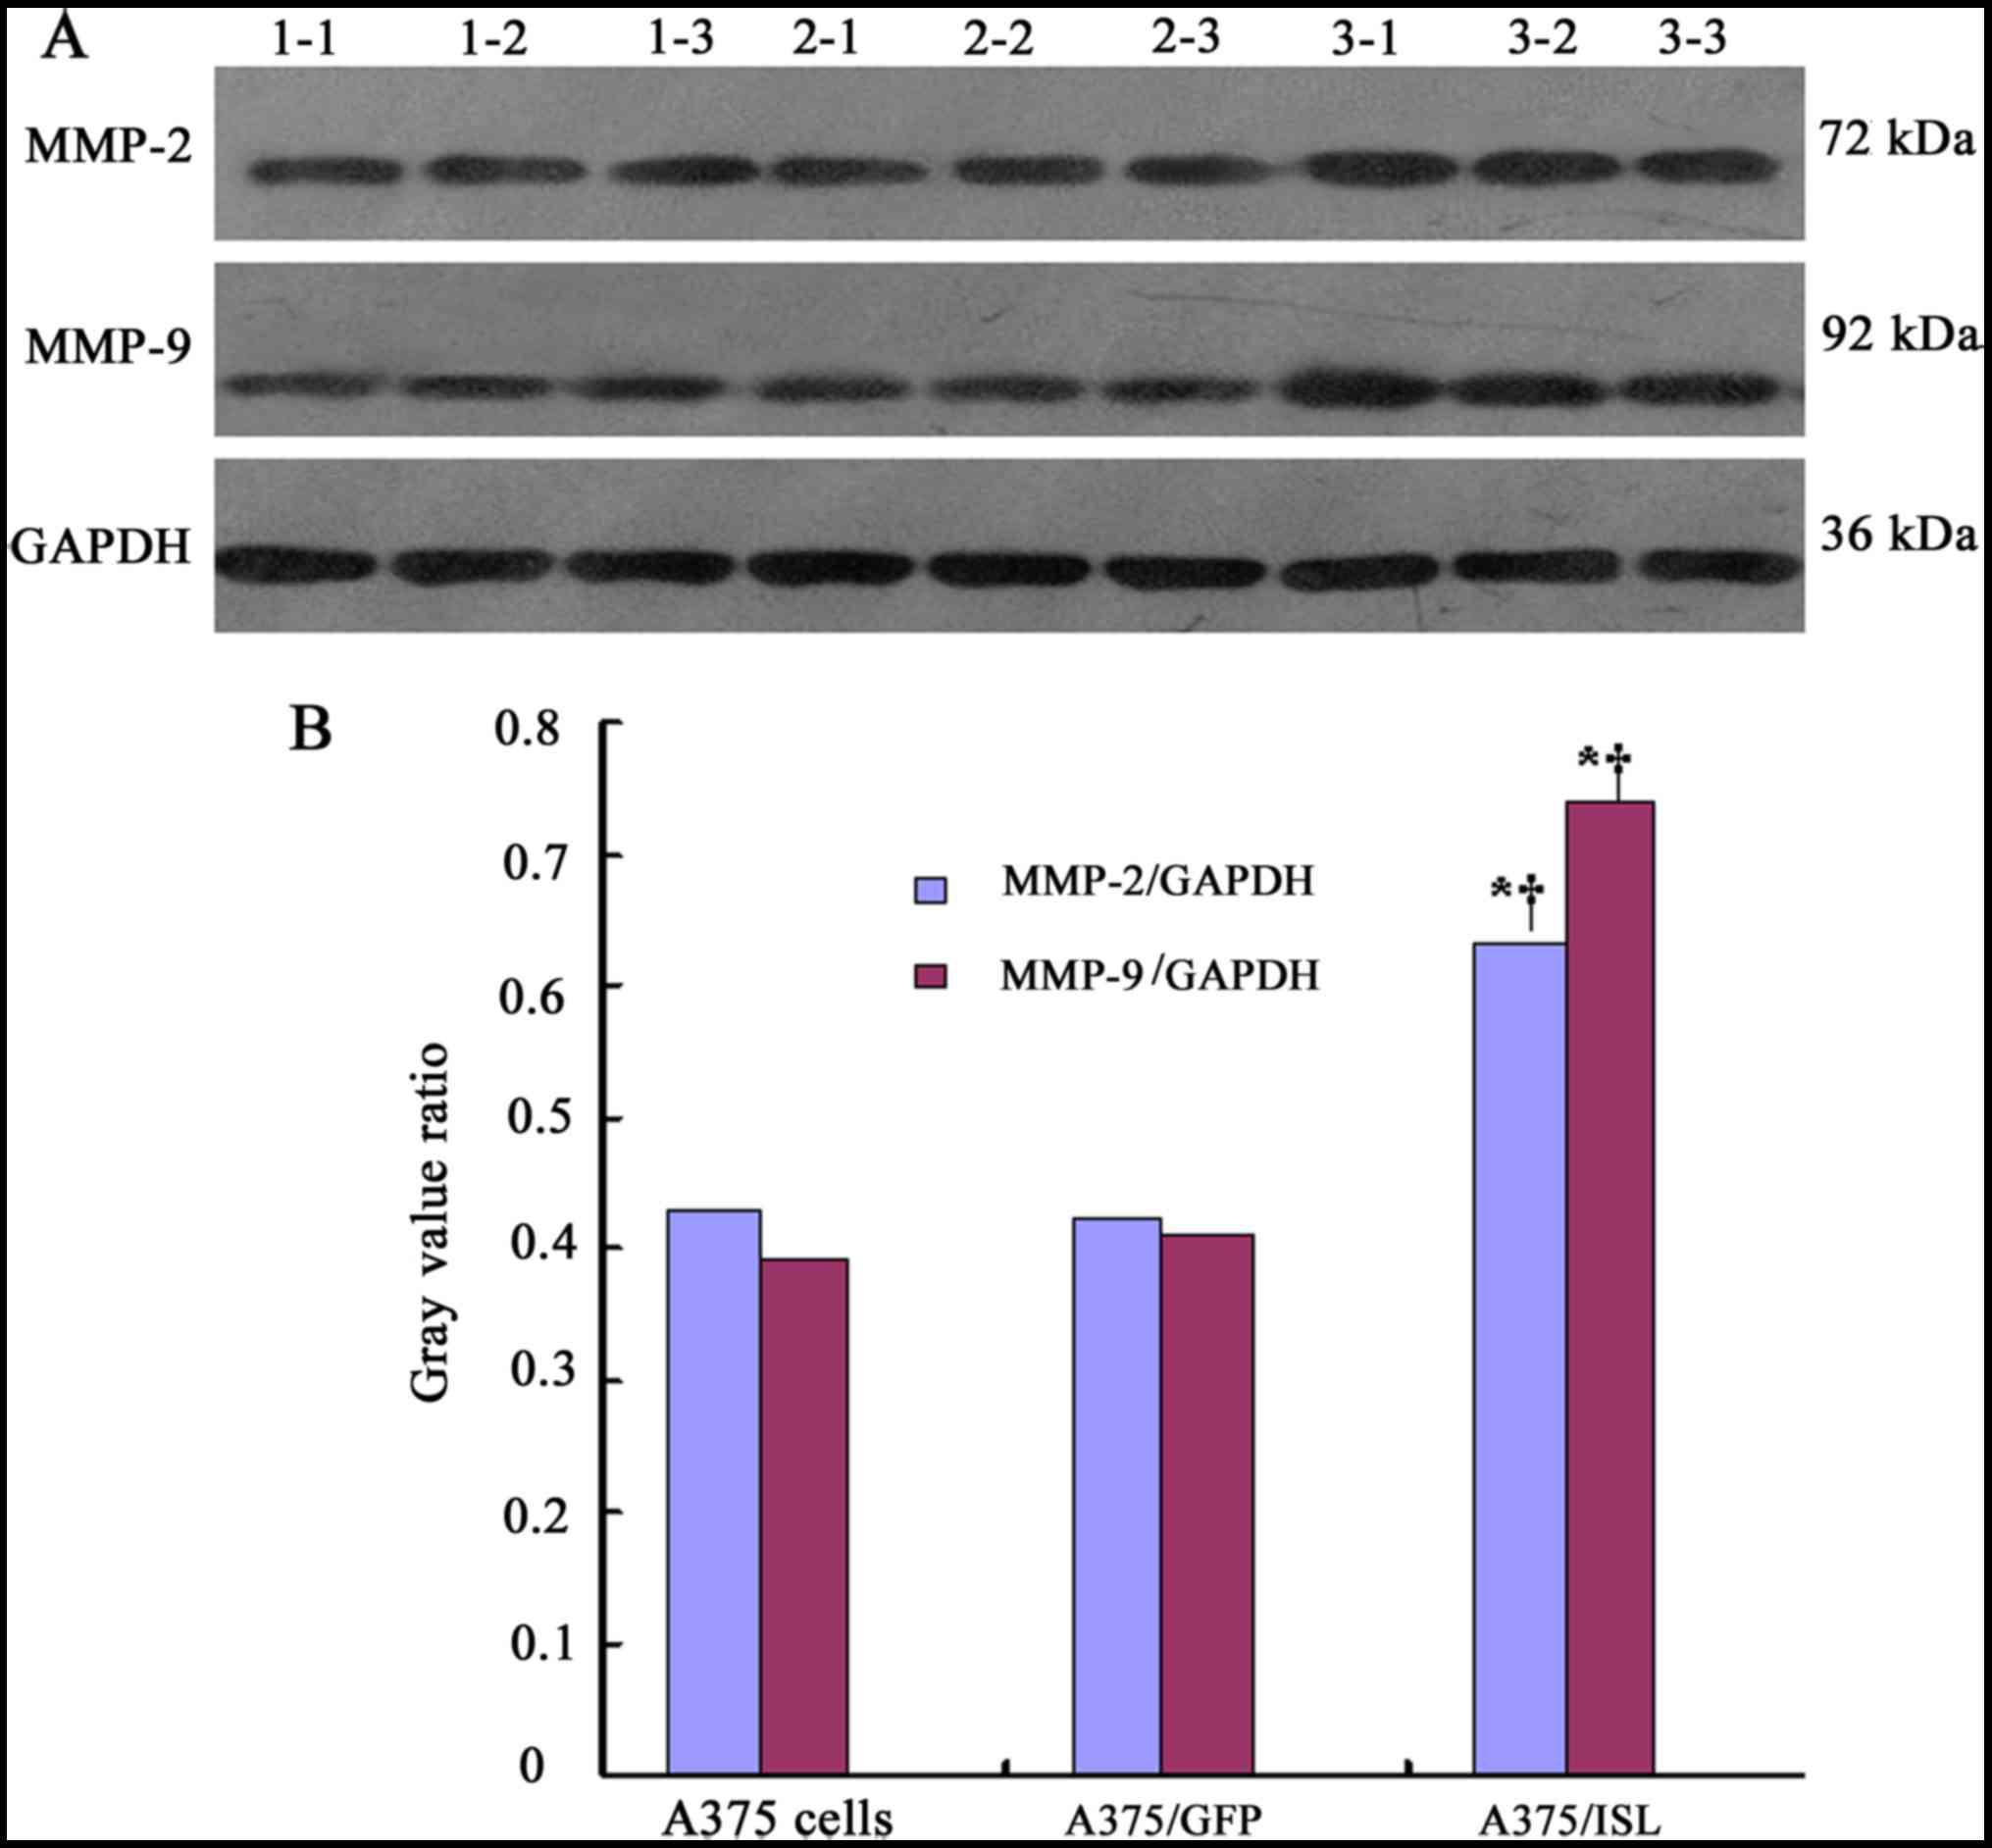
To further confirm the effects of ISL1 on the
protein expression of MMP-2 and MMP-9, western blot analysis was
performed (Fig. 10A). In the
A375/ISL cells, the protein expression levels of MMP-2 and MMP-9
were markedly increased. Significant differences were observed
between the A375/ISL cells and the other 2 groups (A375/ISL vs.
A375/GFP, P<0.001 for MMP-2 and P<0.001 for MMP-9; A375/ISL
vs. A375, P<0.001 for MMP-2 and P<0.001 for MMP-9). No
statistically significant differences were observed between the
A375/GFP and A375 cells (P=0.843 for MMP-2, P=0.452 for MMP-9;
Fig. 10B).
Effect of ISL1 on the activation of the
Akt pathway
We wished to determine whether ISL1 exerts its
effects on the A375 melanoma cells via the Akt pathway. Thus, we
examined the levels of Akt and p-Akt in the 3 groups of cells by
western blot analysis. The cells were also treated with VEGF or the
PI3K/Akt inhibitor, LY294002. As shown in Fig. 11, treatment of the A375/ISL cells
with VEGF for 48 h led to a significant increase in the levels of
Akt and p-Akt. The levels of Akt and p-Akt in the A375/ISL cells
treated with VEGF for 48 h were significantly higher compared with
those in the A375/GFP cells (Akt: A375/ISL cells, 0.7838±0.0243 vs.
A375/GFP cells, 0.6554±.0346, P<0.05; Fig. 11A; p-Akt: A375/ISL cells,
0.7975±0.0331, vs. A375/GFP cells, 0.5088±0.0437, P<0.001,
Fig. 11B). No statistically
significant differences were observed in the levels of Akt and
p-Akt between the A375/ISL and A375/GFP cells treated with VEGF for
24 h (P>0.05).
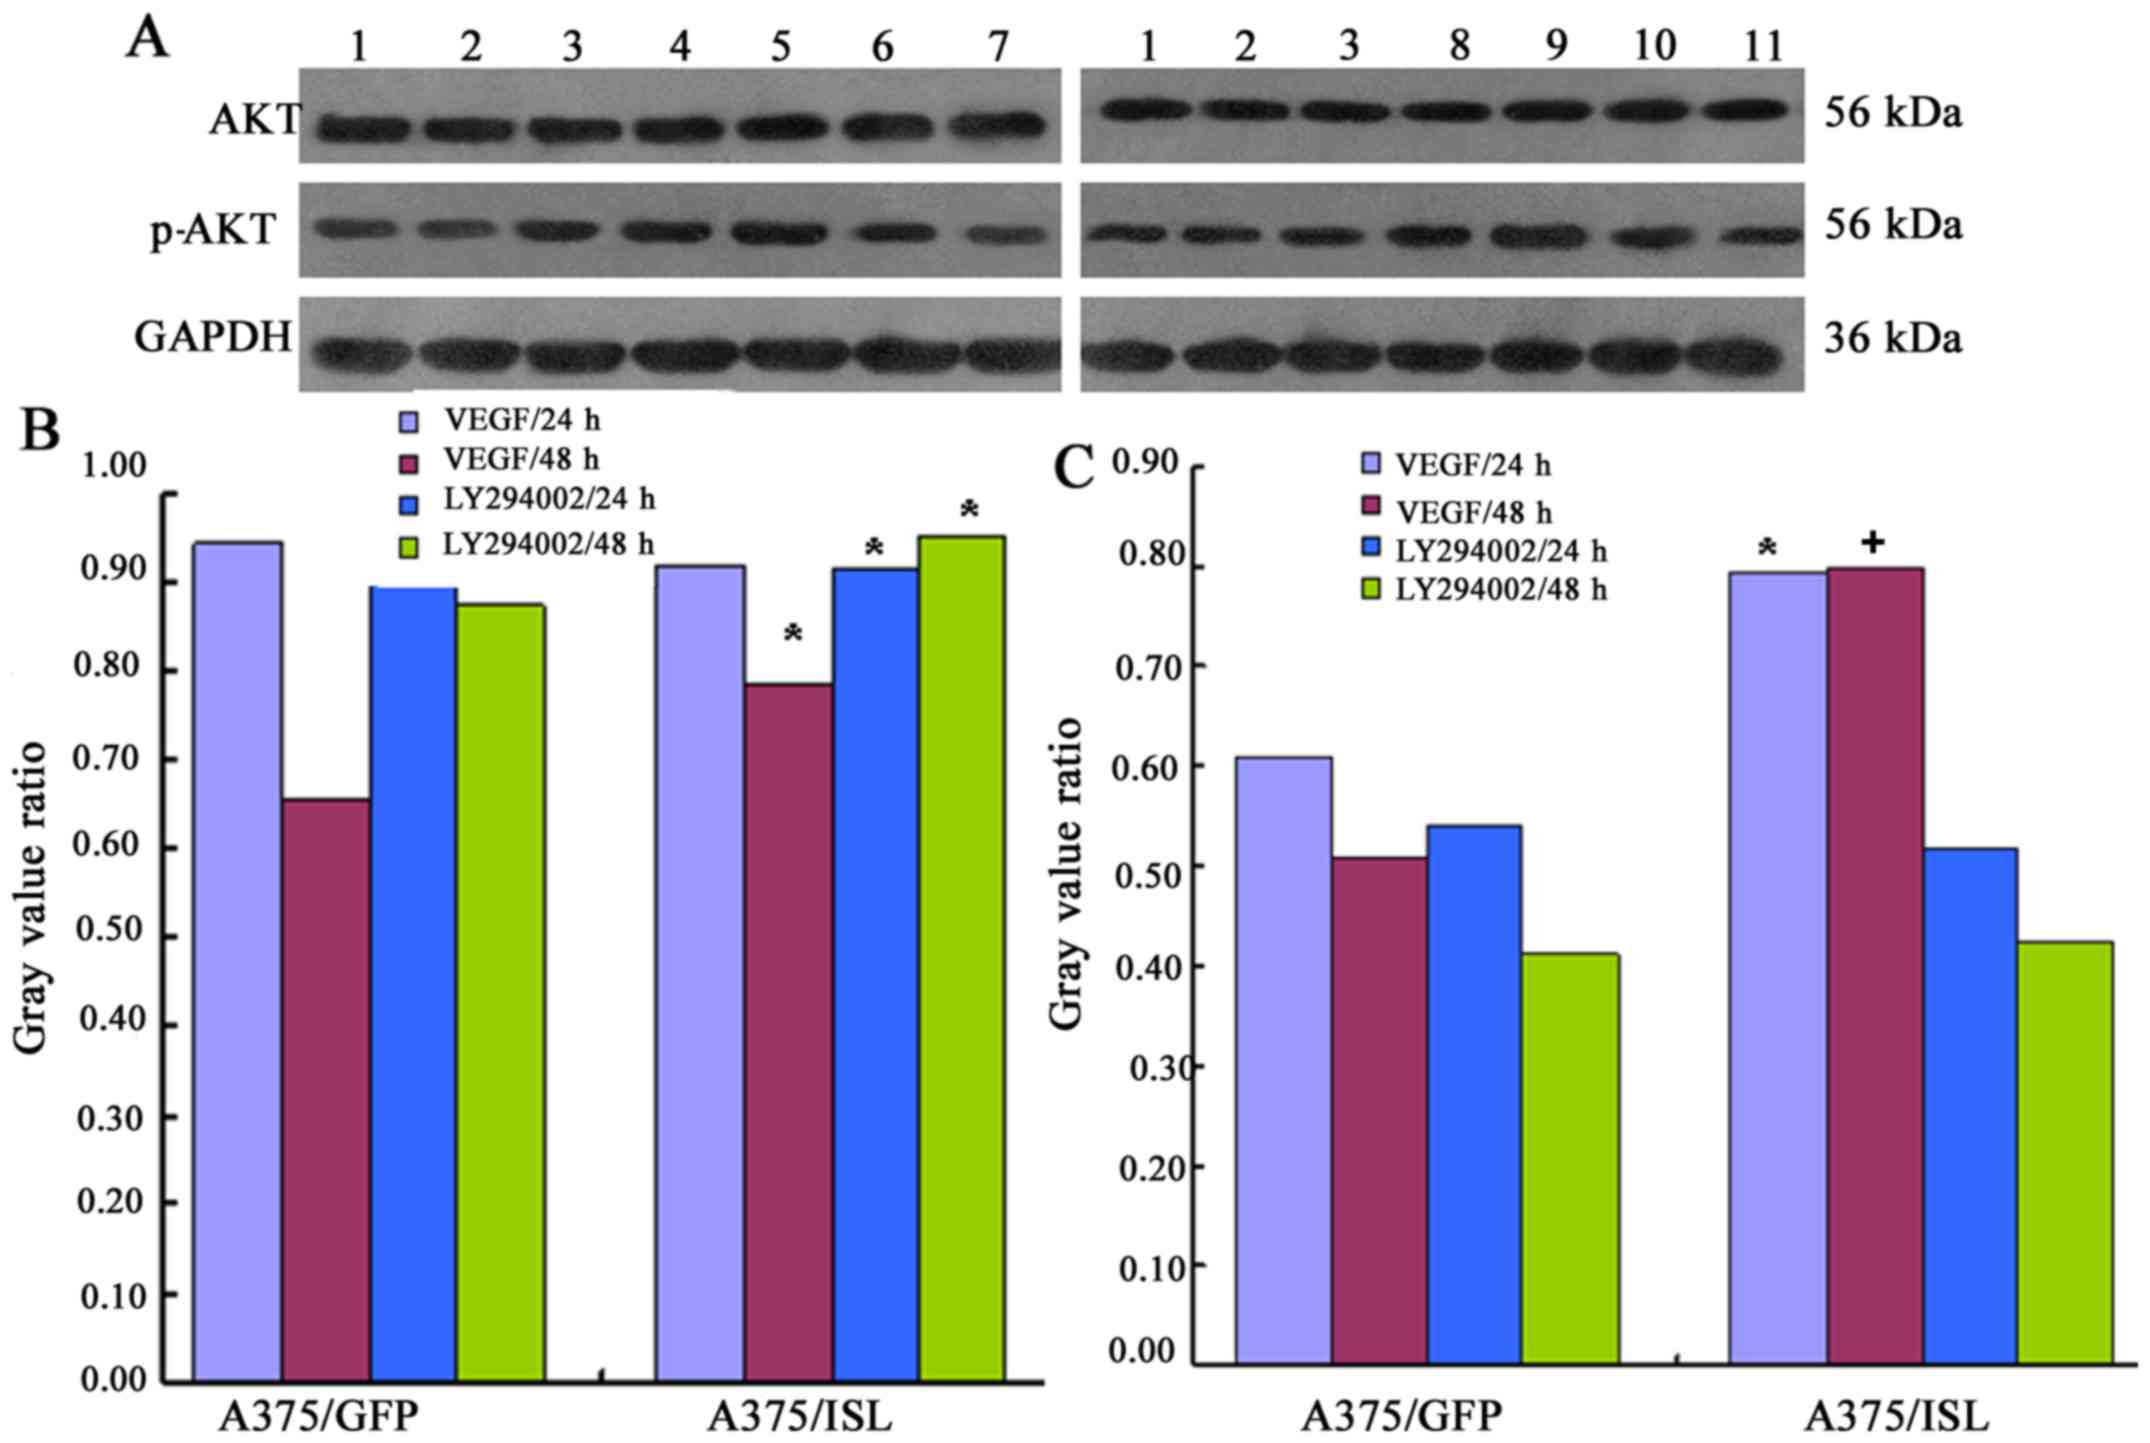 | Figure 11Expression of effect of insulin gene
enhancer-binding protein (ISL1) on the activation of the
phosphatidyliositol 3-kinase (PI3K)/Akt pathway. (A) The A375/ISL
cells (transfected with ISL1 overexpression vector) and control
cells (A375/GFP were treated with VEGF and the PI3K inhibitor,
LY294002 for 24 and 48 h, and the levels of Akt and p-Akt were then
determined by western blot analysis. The lanes are as follows: lane
1, A375 cells; lane 2, A375/GFP cells; lane 3, A375/ISL cells; lane
4, A375/ISL cells treated with VEGF for 24 h; lane 5, A375/ISL
cells treated with VEGF for 48 h; lane 6, A375/ISL cells treated
with LY294002 for 24 h; lane 7, A375/ISL cells treated with
LY294002 for 48 h; lane 8, A375/GFP cells treated with VEGF for 24
h; lane 9, A375/GFP cells treated with VEGF for 48 h; lane 10,
A375/GFP cells treated with LY294002 for 24 h; lane 11, A375/GFP
cells treated with LY294002 for 48 h. (B and C) Quantitative
analysis of the results shown in panel A. (A) Akt and (B) p-Akt
levels in the A375/ISL cells and A375/GFP cells treated with VEGF
and LY294002. The levels of Akt and p-Akt in the A375/ISL cells
treated with VEGF for 48 h were markedly higher than those in the
A375/GFP cells [(B) Akt: *P<0.05; (C) p-Akt:
+P<0.001]. The levels of Akt in the A375/ISL cells
treated with the LY294002 inhibitor for 24 and 48 h were also
significantly increased compared with those in the A375/GFP cells
(P<0.05). |
In addition, treatment of the A375/ISL cells with
the inhibitor, LY294002, for 24 and 48 h also significantly
increased the levels of Akt compared with the A375/GFP cells
(A375/ISL cells 24 h, 0.9127±0.0276 and 48 h, 0.9502±0.0290;
A375/GFP cells 24 h, 0.9088±0.0312 and 48 h, 0.8747±0.0265;
P<0.05, Fig. 11A).
Conversely, no statistically significant differences in the levels
of p-Akt were observed between the A375/ISL and A375/GFP cells
treated with LY294002 inhibitor for 24 and 48 h (P>0.05,
Fig. 11C).
Discussion
Cutaneous malignant melanoma (CMM) accounts for
approximately 3% of all human cancers and causes approximately 80%
of skin cancer-related deaths. The lifetime risk of developing
invasive CMM is currently estimated to be approxiamtely 1/50
(12). Melanomas with deep local
invasion or those that have spread to the lymph nodes may be
treated with surgery, immunotherapy, chemotherapy and/or radiation
therapy. However, melanoma is likely to spread to other parts of
the body. The 5- and 10-year relative survival rates for patients
melanoma are 91 and 89%, respectively (13). Patients with tumors that have
spread to the tumor-draining lymph nodes have a high risk of
recurrence following surgery. Thus, once melanoma metastasizes, the
prognosis is often poor and therapeutic options are limited.
Nevertheless, the prognosis of CMM is poor due to certain factors
that are strongly associated with tumor cell proliferation and
invasion. In recent years, special attention has been paid to the
ISL1 protein and its participation in the migration process of
cancer cells. Therefore, in the present study, ISL1 was selected as
a novel biological marker with an aim to explore its roles in the
proliferation, invasion, and apoptosis of melanoma cells.
First, we examined the effects of ISL1 on the
proliferation of A375 cells. The results of MTT assay revealed that
the OD value of A375/ISL cells was markedly higher than that of the
A375/GFP and A375 cells following culture for 12 h, and the
difference was more conspicuous with a longer culture time.
Furthermore, flow cytometry and TUNEL assay also revealed that ISL1
inhibited the apoptosis of the A375 cells. Importantly, ISL1
overexpression was associated with a decreased cell population in
the G0/G1 phase and an increased cell population in the S and G2/M
phases. These results suggest that ISL1 promotes the proliferation
of A375 cells. ISL1, which contains one DNA-binding site and two
LIM domains, is a subtype of the LIM-homeodomain transcription
factor subfamily and is mainly expressed in adult islet endocrine
cells (α, β, γ and ε), as well in the central nervous system
(4). Moreover, ISL1 is also a
transcription factor involved in pancreatic islet cell
embryogenesis, thus suggesting that it could be utilized as a
sensitive marker for pancreatic islet cells and their neoplasms
(14). However, it is not clear
whether ISL1 plays important roles in the regulation of endocrine
hormone secretion in post-natal pancreatic islets. It has been
demonstrated that ISL1 is required for the proliferation, migration
and survival of cardiac progenitor cells (15). It also promotes the proliferation
and repair of injured motor neurons (16). Furthermore, other researches have
indicated that ISL1 promotes the proliferation of mature pancreatic
islet cells and attenuates cell apoptosis against oxidative stress
by activating c-Myc and cyclin D1 transcription by directly binding
to its promoters (17).
Conversely, some researchers have observed that transgenic mice
overexpressing ISL1 in the endocrine pancreas exhibit an increased
β-cell function without enhanced β-cell proliferation and without
increased apoptosis (18). Others
have also determined that ISL1 cells and even pacemaking cells do
not exhibit proliferative activity at higher rates than those of
normal cardiac myocytes in the adult heart under normal conditions
(19).
In this study, we also examined the effects of ISL1
on the invasive ability of A375 cells by conducting penetration
experiments on Transwell chambers coated with Matrigel. We observed
that a higher number of A375/ISL cells penetrated the Matrigel
compared with that of A375/GFP and A375 cells. The average
penetration rate of A375/ISL cells was higher than that of the
A375/GFP and A375 cells. These findings indicated that the
overexpression of ISL1 promoted the invasion of A375 cells. It has
been previously demonstrated that ISL1 and penetratin peptides
efficiently internalize into human Bowes melanoma cells through the
translocation property of the cell-penetratin peptide and the
native Cys residue in the ISL1 sequence (20). Of note, some researchers have
suggested that ISL1 and PAX8 may be utilized as immunohistochemical
markers for pancreatic NETs to promote the formation of tumors
(21). Due to the limited number
of relevant studies on this topic, the mechanisms underlying its
pathogenesis remain unclear.
In this study, to explore the mechanisms underlying
the capacity of ISL1 to promote the invasion of A375 cells, the
expression levels of MMP-2 and MMP-9 were examined. The resutls of
qPCR and western blot analysis indicated that ISL1 upregulated the
mRNA and protein expression levels of MMP-2 and MMP-9 in the A375
cells. Several molecules are involved in tumor invasion, such as
MMPs. MMPs are a family of related enzymes that degrade the
extracellular matrix. The activation of these enzymes provides
tumor cells access to the vasculature, invade target organs, and
facilitate metastases. Although MMP-2 and MMP-9 are associated with
various types of cancer, the mechanisms underlying the upregulation
of MMP-2 and MMP-9 in the A375/ISL cells were not yet fully
elucidated.
Subsequently, we examined whether ISL1 exerts its
effects on the A375 cells via the Akt pathway by conducting western
blot analysis. Treatment of the cells with VEGF for 48 h
significantly increased the Akt and p-Akt levels in the A375/ISL
cells compared with the A375/GFP cells. In addition, treatment with
the LY294002 inhibitor for 24 and 48 h also significantly increased
the levels of Alt in the A375/ISL cells compared with the A375/GFP
cells. Our data suggest that the overexpression of ISL1 promotes
the proliferation of A375 melanoma cells via the Akt pathway. Some
researchers have supported the pro-angiogenic effects of ISL1
transduction by demonstrating an increase in the expression of the
pro-angiogenic cytokine, VEGF (22). The overexpression of ISL1 in
endothelial cells and mesenchymal stem cells promotes blood vessel
formation. Other studies have suggested that ISL1 promotes
post-natal angiogenesis and vasculogenesis by improving the
angiogenic properties of endothelial cells and mesenchymal stem
cells (23). However, studies
describing ISL1 in relation to LY294002 are limited. Several
studies have shown that the cultivation of human pancreatic cells
in a differentiation medium supplemented with LY294002 stimulates
the expression of insulin mRNA and protein, which in turn leads to
the enrichment of pancreatic stem cells that are capable of
self-renewal and endocrine differentiation (24). Therefore, we speculate that the
PI3K/Akt signaling pathway, in close association with ISL1, promote
the invasion of A375 cells, although the exact mechanisms involved
remain unclear.
The present study determined that ISL1 promotes the
proliferation and invasion, and inhibits the apoptosis of A375
cells, and these findings may be utilized in determining the
biological function in ISL1 in melanoma. In vivo experiments
examining the effects of ISL1 on patients with melanoma were not
included in the present study, which is therefore a limitation of
the present study. In the future, we aim to collect and examine
clinical samples to further explore the role of ISL1 in the
proliferation, invasion and apoptosis of melanoma. It may also be
helpful to determine whether ISL1 may be used as a novel molecular
target for the treatment of melanoma to improve the survival rate
of patients.
In conclusion, the data from the present study
demonstrated that the overexpression of ISL1 promoted the
proliferation and invasion of A375 cells. More importantly, the
overexpression of ISL1 inhibited the apoptosis of the A375 melanoma
cells, increased the number of cells in the S phase, and decreased
the number of cells in the G0/G1 phase of the cell cycle. Moreover,
ISL1 upregulated the mRNA and protein expression levels of MMP-2
and MMP-9 in the A375 cells, which in turn promoted cell invasion.
Thus, from the findings of the present study, it is suggested that
ISL1 plays an important role in A375 cells via the PI3K/Akt
signaling pathway.
Acknowledgments
The authors would like to thank the members of the
laboratory of Wei Si Teng Co. in Chongqing, China for their
assistance with conducting this research.
Abbreviations:
|
ISL1
|
islet-1
|
|
GFP
|
green fluorescent protein
|
|
MTT
|
3-(4,5-dimethylthiazol-2-yl)-2,5-diphenyltetrazolium bromide
|
Notes
[1]
Funding
The study was supported by a grant from the Health
and Family Planning Commission in Heilongjiang province in China
(No. 2017-204).
[2] Availability
of data and materials
The analyzed datasets generated during the study are
available from the corresponding author on reasonable request.
[3] Authors'
contributions
XZ performed the experiments and writing the
manuscirpt; QM designed the experiments and YL generated the
data.
[4] Ethics
approval and consent to participate
Not applicable.
[5] Consent for
publication
Not applicable.
[6] Competing
interests
The authors declare that they have no competing
interests.
References
|
1
|
Misu M, Ouji Y, Kawai N, Nishimura F,
Nakamura-Uchiyama F and Yoshikawa M: Effects of Wnt-10b on
proliferation and differentiation of murine melanoma cells. Biochem
Biophys Res Commun. 463:618–623. 2015. View Article : Google Scholar : PubMed/NCBI
|
|
2
|
Raghunath A, Sambarey A, Sharma N,
Mahadevan U and Chandra N: A molecular systems approach to
modelling human skin pigmentation: identifying underlying pathways
and critical components. BMC Res Notes. 8:1702015. View Article : Google Scholar : PubMed/NCBI
|
|
3
|
Siegel R, Ma J, Zou Z and Jemal A: Cancer
statistics, 2014. CA Cancer J Clin. 64:9–29. 2014. View Article : Google Scholar : PubMed/NCBI
|
|
4
|
Karlsson O, Thor S, Norberg T, Ohlsson H
and Edlund T: Insulin gene enhancer binding protein Isl-1 is a
member of a novel class of proteins containing both a homeo- and a
Cys-His domain. Nature. 344:879–882. 1990. View Article : Google Scholar : PubMed/NCBI
|
|
5
|
Nasif S, de Souza FS, González LE,
Yamashita M, Orquera DP, Low MJ and Rubinstein M: Islet 1 specifies
the identity of hypothalamic melanocortin neurons and is critical
for normal food intake and adiposity in adulthood. Proc Natl Acad
Sci USA. 112:E1861–E1870. 2015. View Article : Google Scholar : PubMed/NCBI
|
|
6
|
Cai CL, Liang X, Shi Y, Chu PH, Pfaff SL,
Chen J and Evans S: Isl1 identifies a cardiac progenitor population
that proliferates prior to differentiation and contributes a
majority of cells to the heart. Dev Cell. 5:877–889. 2003.
View Article : Google Scholar : PubMed/NCBI
|
|
7
|
Huber GF: Modern management of Merkel cell
carcinoma. Curr Opin Otolaryngol Head Neck Surg. 22:109–115. 2014.
View Article : Google Scholar : PubMed/NCBI
|
|
8
|
Agaimy A, Erlenbach-Wünsch K, Konukiewitz
B, Schmitt AM, Rieker RJ, Vieth M, Kiesewetter F, Hartmann A,
Zamboni G, Perren A, et al: ISL1 expression is not restricted to
pancreatic well-differentiated neuroendocrine neoplasms, but is
also commonly found in well and poorly differentiated
neuroendocrine neoplasms of extrapancreatic origin. Mod Pathol.
26:995–1003. 2013. View Article : Google Scholar : PubMed/NCBI
|
|
9
|
Su X, Wang P, Wang X, Cao B, Li L and Liu
Q: Apoptosis of U937 cells induced by hematoporphyrin monomethyl
ether-mediated sonodynamic action. Cancer Biother Radiopharm.
28:207–217. 2013. View Article : Google Scholar : PubMed/NCBI
|
|
10
|
Hao Q, Li W, Zhang C, Qin X, Xue X, Li M,
Shu Z, Xu T, Xu Y, Wang W, et al: TNFα induced FOXP3-NFκB
interaction dampens the tumor suppressor role of FOXP3 in gastric
cancer cells. Biochem Biophys Res Commun. 430:436–441. 2013.
View Article : Google Scholar
|
|
11
|
Livak KJ and Schmittgen TD: Analysis of
relative gene expression data using real-time quantitative PCR and
the 2(−Delta Delta C(T)) method. Methods. 25:402–408. 2001.
View Article : Google Scholar
|
|
12
|
Piérard-Franchimont C, Hermanns-Lê T,
Delvenne P and Piérard GE: Dormancy of growth-stunted malignant
melanoma: sustainable and smoldering patterns. Oncol Rev.
8:2522014. View Article : Google Scholar
|
|
13
|
Aris M and Barrio MM: Combining
immunotherapy with oncogene-targeted therapy: a new road for
melanoma treatment. Front Immunol. 6:462015. View Article : Google Scholar : PubMed/NCBI
|
|
14
|
Graham RP, Shrestha B, Caron BL, Smyrk TC,
Grogg KL, Lloyd RV and Zhang L: Islet-1 is a sensitive but not
entirely specific marker for pancreatic neuroendocrine neoplasms
and their metastases. Am J Surg Pathol. 37:399–405. 2013.
View Article : Google Scholar : PubMed/NCBI
|
|
15
|
Bu L, Jiang X, Martin-Puig S, Caron L, Zhu
S, Shao Y, Roberts DJ, Huang PL, Domian IJ and Chien KR: Human ISL1
heart progenitors generate diverse multipotent cardiovascular cell
lineages. Nature. 460:113–117. 2009. View Article : Google Scholar : PubMed/NCBI
|
|
16
|
Shi Y, Zhao S, Li J and Mao B: Islet-1 is
required for ventral neuron survival in Xenopus. Biochem Biophys
Res Commun. 388:506–510. 2009. View Article : Google Scholar : PubMed/NCBI
|
|
17
|
Guo T, Wang W, Zhang H, Liu Y, Chen P, Ma
K and Zhou C: ISL1 promotes pancreatic islet cell proliferation.
PLoS One. 6:e223872011. View Article : Google Scholar : PubMed/NCBI
|
|
18
|
Ediger BN, Du A, Liu J, Hunter CS, Walp
ER, Schug J, Kaestner KH, Stein R, Stoffers DA and May CL: Islet-1
is essential for pancreatic β-cell function. Diabetes.
63:4206–4217. 2014. View Article : Google Scholar : PubMed/NCBI
|
|
19
|
Weinberger F, Mehrkens D, Starbatty J,
Nicol P and Eschenhagen T: Assessment of DNA synthesis in
Islet-1+ cells in the adult murine heart. Biochem
Biophys Res Commun. 456:294–297. 2015. View Article : Google Scholar
|
|
20
|
Kilk K, Magzoub M, Pooga M, Eriksson LE,
Langel U and Gräslund A: Cellular internalization of a cargo
complex with a novel peptide derived from the third helix of the
islet-1 homeodomain. Comparison with the penetratin peptide.
Bioconjug Chem. 12:911–916. 2001. View Article : Google Scholar : PubMed/NCBI
|
|
21
|
Koo J, Mertens RB, Mirocha JM, Wang HL and
Dhall D: Value of Islet 1 and PAX8 in identifying metastatic
neuroendocrine tumors of pancreatic origin. Mod Pathol. 25:893–901.
2012. View Article : Google Scholar : PubMed/NCBI
|
|
22
|
Ferrara N, Carver-Moore K, Chen H, Dowd M,
Lu L, O'Shea KS, Powell-Braxton L, Hillan KJ and Moore MW:
Heterozygous embryonic lethality induced by targeted inactivation
of the VEGF gene. Nature. 380:439–442. 1996. View Article : Google Scholar : PubMed/NCBI
|
|
23
|
Barzelay A, Ben-Shoshan J, Entin-Meer M,
Maysel-Auslender S, Afek A, Barshack I, Keren G and George J: A
potential role for islet-1 in post-natal angiogenesis and
vasculogenesis. Thromb Haemost. 103:188–197. 2010. View Article : Google Scholar : PubMed/NCBI
|
|
24
|
Linning KD, Tai MH, Madhukar BV, Chang CC,
Reed DN Jr, Ferber S, Trosko JE and Olson LK: Redox-mediated
enrichment of self-renewing adult human pancreatic cells that
possess endocrine differentiation potential. Pancreas. 29:e64–e76.
2004. View Article : Google Scholar : PubMed/NCBI
|