Introduction
Uveitis, which affects the iris, ciliary body and
choroid, is an intraocular inflammatory disease and an important
cause of visual impairment, even blindness (1). Based on the anatomical localization
of inflammation, uveitis may be classified as anterior, posterior
and panuveitis (2). Anterior
uveitis (AU) is the most prevalent type of uveitis.
HLA-B27-associated acute AU (AAU) was originally described in 1973
and remains the most common type of AAU. The
arthrogenic/uveitogenic peptide hypothesis (3) and the HLA-B27 misfolding hypothesis
have been proposed to explain the role of HLA-B27 in AAU. There is
also evidence that innate immunity may be involved, in addition to
the role of adaptive immunity, in the pathogenesis of
HLA-B27-related disease. Since elements of both innate and adaptive
immune reactions are observed, HLA-B27-related disease should be
placed in the spectrum between autoimmune and autoinflammatory
disease (4).
The basic concept of arthrogenic/uveitogenic peptide
hypothesis is that HLA-B27 molecules present antigens that share
sequence homology with self-peptides to HLA-B27-restricted
CD8+ T cells, which are autoreactive (5). These activated T cells induce
inflammation as a result of a cross-reactivity with peptides in the
eye (3). HLA-B27 heavy chains
have a tendency to misfold, and it has been suggested that such
misfolding may lead to the development of HLA-B27-related disease
(6,7).
Extensive clinical and laboratory research has
provided evidence that Gram-negative bacteria and their
lipopolysaccharides (LPS) are associated with AAU (8). According to recent studies, the
earliest responders to bacterial infection are mononuclear cells
(9). Once activated, mononuclear
cells produced a series of inflammatory cytokines and chemokines
that cause marked amplification of the inflammatory process.
Although the pathogenesis is not clear, evidence shows that both
adaptive and innate immune responses may be involved in the
occurrence of uveitis (10,11). To explore the pathogenetic
mechanism of AAU, this study group found prominent differences
between the monocytes of HLA-B27-positive AAU patients and
HLA-B27-negative healthy controls. In response to LPS stimulation,
1,105 and 25 genes were upregulated in the HLA-B27-positive AAU
patients and HLA-B27-negative healthy controls, respectively. Gene
Ontology (GO) and pathway analysis illustrated that these genes
participated in protein transport and folding, which are key to the
inflammatory process (12). In
the present study, we compared the gene expression profiles of
monocytes from HLA-B27 AAU susceptible families before and after
LPS stimulation using Affymetrix microarrays. According to
Signal-Net, Gene Relation Network (Gene-Rel-Net), GO and Kyoto
Encyclopedia of Genes and Genomes (KEGG) analysis, we also
demonstrated the role of these different genes in inflammation.
Currently, one of the major challenges is to identify key genes
involved in HLA-B27 AAU and to design more effective targeted
anti-inflammatory therapeutic strategies.
Materials and methods
Study population
Patients who suffered from HLA-B27-associated AAU
without systemic immune disease were diagnosed and classified
according to the International Uveitis Study Group Standards
(13) and were recruited to the
Eye Clinic of Beijing Chao-Yang Hospital, between September 2013
and March 2014. Four patients who fulfilled these criteria and
their immediate HLA-B27-positive healthy (without AAU or systemic
immune disease) family members as controls were included in the
study. All the subjects had received flow cytometric HLA-B27
testing at Beijing Chao-Yang Hospital prior to enrollment. All
candidates provided written informed consent and the clinical
research protocol was approved by the Ethics Committee of Beijing
Chao-Yang Hospital, Capital Medical University. The eligible
subjects included 3 men and 5 women aged 32–55 years (mean age, 42
years). All the patients were in the convalescence stage, with no
signs or symptoms, and were only adminsitered topical eye drops,
without systemic immune inhibitors.
Isolation and identification of
monocytes
Peripheral blood (16 ml) from HLA-B27-positive AAU
patients and healthy blood relatives was collected into heparinized
tubes and immediately processed in order to separate peripheral
blood mononuclear cells (PBMC) with the Ficoll-Hypaque method. The
cell viability was ≥95% as determined with trypan blue staining.
Each cell suspension was then distributed to chambers of 12-well
culture plates with a mean concentration of 1×10⁶
cells/ml/well. The plates were incubated in a humidified incubator
with 5% CO2 at 37°C for 4 h to ensure that the monocytes
adhered to the plates. Non-adherent cells were removed by washing
with Hank's Balanced Salt Solution. The monocytes of
HLA-B27-positive AAU patients were randomly divided into two
groups: Stimulation group (A2) and non-stimulation group (A1).
Similarly, the two groups of monocytes from HLA-B27-positive
controls were labeled as stimulation group (B2) and non-stimulation
group (B1). LPS (1 µg/ml, final concentration) was added to
each stimulation group (A2 and B2) and an equal volume of
phosphate-buffered saline was added to the non-stimulation groups
(A1 and B1). The monocytes were tested with CD14 immunofluorescence
stain.
Enzyme-linked immunosorbent assays
(ELISA)
Samples of culture supernatants were harvested at
different time-points (4, 8, 12 and 24 h) following stimulation
with LPS and stored in microtubes at −80°C. The levels of tumor
necrosis factor (TNF)-α, interleukin (IL)-10 and IL-6 in cell
culture supernatant samples were measured with a standard
quantifiable sandwich enzyme immunoassay. ELISA was performed
according to the manufacturer's instructions. Measurements were
obtained with an automated microplate reader (Multiskan MK3; Thermo
Fisher Scientific, Inc., Waltham, MA, USA) at an optical absorbance
value of 450 nm.
Total RNA extraction and microarray
assay
Total RNA was extracted from 24-h cultured monocytes
by using TRIzol reagent (Invitrogen; Thermo Fisher Scientific,
Carlsbad, CA, USA) and an RNeasy mini kit (Qiagen, valencia, CA,
USA) according to the manufacturer's protocol. After verifying the
integrity, concentration and purity of RNA, cDNA was generated by
using a One-Cycle Target Labeling and Control reagent kit
(Affymetrix, Santa Clara, CA, USA). Biotinylated and amplified cRNA
was generated from the total RNA samples with a GeneChip IvT
labeling kit and then hybridized at 45°C to Affymetrix GeneChip
Human Gene 1.0 ST arrays (both from Affymetrix) for 16 h. The
abovementioned procedure was repeated in triplicate. Data were
analyzed by GeneChip operating software.
Data analysis
Gene expression patterns from groups A2, B2, A1 and
B1 were analyzed to identify differentially expressed genes. We
focused on those DEGs that were acquired following comparison
between the A2 and B2 groups, but were not present in those
acquired from the A1 and B1 groups, eventually narrowing down the
key candidate genes. These candidate DEGs were selected after
performing a paired t-test, and the threshold of significance was
defined by P-value and false discovery rate (FDR) analysis
(14–16). The FDR was calculated to correct
the P-value, with a smaller FDR indicating a smaller error in the
estimated P-value (17). DEGs
were identified to be up- or downregulated with a P-value of
<0.05. GO analysis was used to analyze the main function of the
DEGs. GO separated genes into categories, and gene regulatory
networks were discovered based on biological processes, which is
the key functional classification of the National Center for
Biotechnology Information (18,19). Pathway analysis was applied to
uncover a significant pathway of the differential genes according
to KEGG. Gene-gene interaction network (Signal-Net) was constructed
on the basis of the data of DEGs to show the core genes that played
a critical role in this network (20–22). The genes were described as
indegree, outdegree, or degree. A higher degree indicated that the
genes were more strongly correlated with others, and suggested a
more important role in the signaling network. In addition, the
number of source genes of a gene is referred to as the indegree of
the gene and the number of target genes of a gene is its outdegree.
Gene-Rel-Net was built according to the normalized signal intensity
of specific expression genes (23). For each pair of genes, we
calculated the Pearson's correlation and selected the significant
correlation pairs to construct the network to locate core
regulatory genes (24). Core
regulatory factors connected more adjacent genes and had higher
degrees. The regulation difference of each gene was compared in
different networks. ABS represents the absolute value of the
difference of the relative degree; a higher ABS indicated that the
genes have a more significant regulatory ability and play a more
important role in the networks.
Reverse transcription-quantitative
polymerase chain reaction (RT-qPCR) analysis
A total of 18 candidate genes were selected to
perform RT-qPCR analysis using the same sample of the total RNAs
that was isolated using an RNeasy kit (Qiagen) according to the
manufacturer's protocol. M-MLv reverse transcriptase (Promega,
Madison, WI, USA) was used to synthesize cDNA. qPCR analysis and
data collection were performed on the ABI 7500 qPCR system. The raw
quantifications were normalized to the β-actin values for each
sample and fold changes are shown as mean ± standard deviation (SD)
of three independent experiments.
Statistical analysis
Each experiment was performed independently at least
three times. The results are expressed as mean ± SD. The
differentially expressed genes were analyzed using paired Student's
t-test. The RT-qPCR and ELISA results were analyzed with t-test.
P<0.05 was considered to indicate statistically significant
differences.
Results
Mononuclear cell separation and
identification
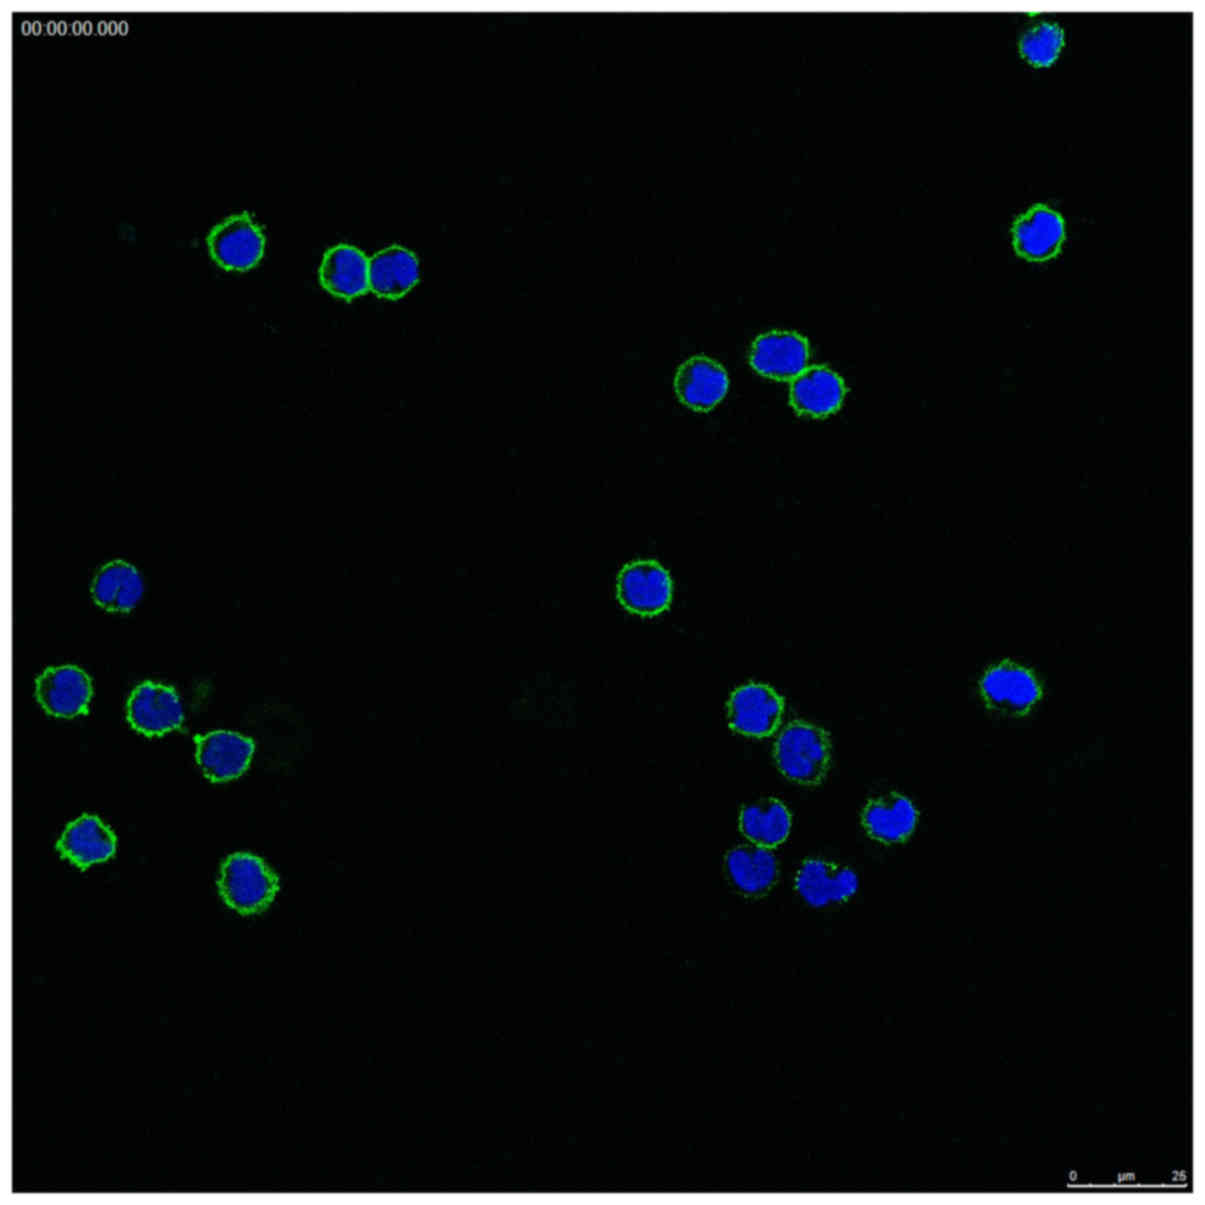
The monocytes were tested with CD14
immunofluorescence stain. The isolated mononuclear cells were
round, kidney-shaped or irregular, with intact nuclei. The results
of the immunofluorescence revealed that the monocytes were positive
for the cell membrane marker CD14 (Fig. 1).
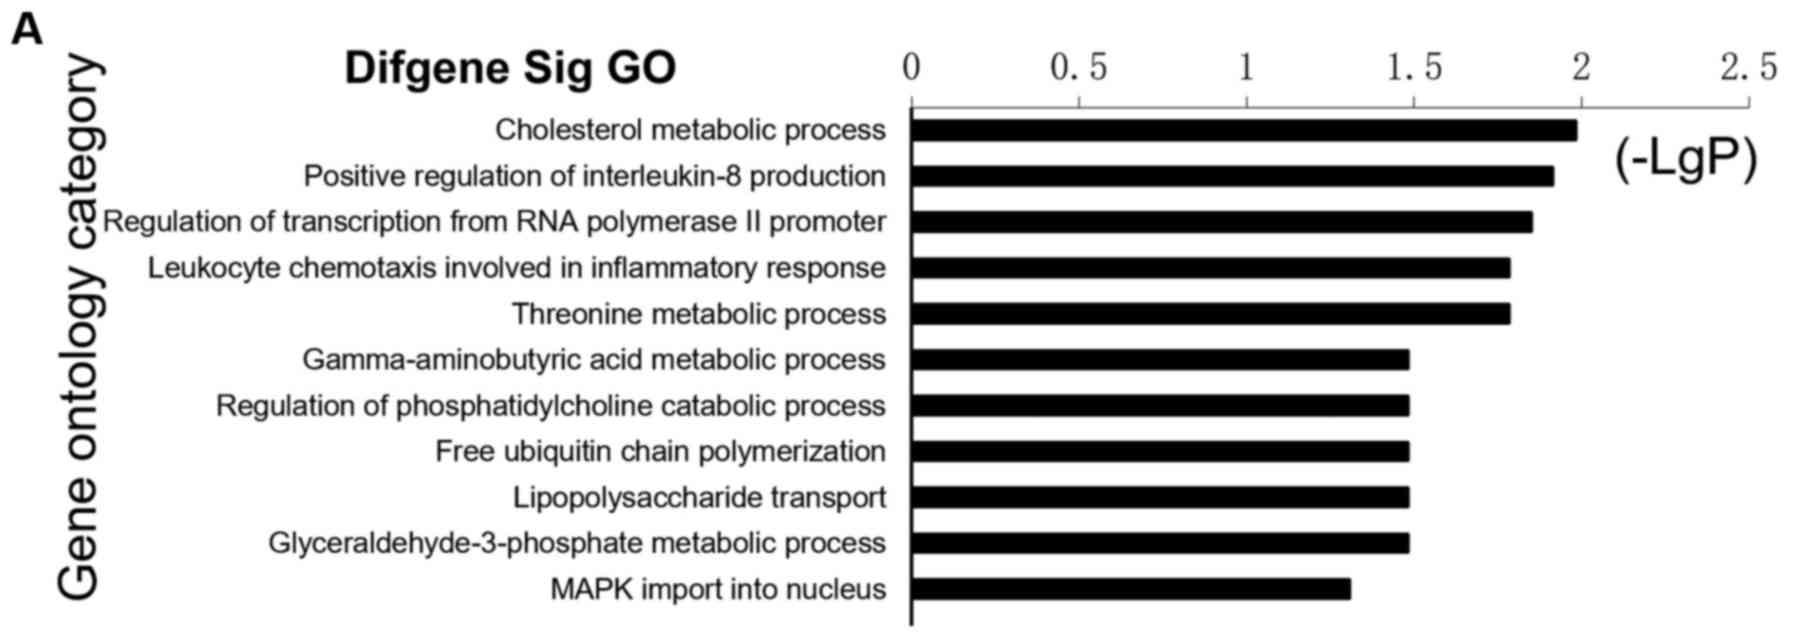
Differentially expressed genes
A gene chip study was performed by using the
Affymetrix probe data set. Paired Student's t-test was performed to
identify genes that were expressed separately and differentially.
As a result, genes that had a P-value <0.05 were considered to
be significantly differentially expressed. Of the 801
differentially expressed genes that were initially identified, 349
were upregulated and 452 downregulated. A large negative logarithm
of the P-value (-LgP-value) correlated with greater significance of
the GO category. As shown in Fig.
2A, some of the upregulated GOs (up-GOs) included metabolic
metabolites (cholesterol, threonine, γ-aminobutyric acid and
glyceraldehyde-3-phosphate), regulation of transcription from RNA
polymerase II promoter, leukocyte chemotaxis involved in
inflammatory response, free ubiquitin chain polymerization, LPS
transport and mitogen-activated protein kinase (MAPK) import into
nucleus. By contrast, some of the top downregulated GOs (down-GOs;
Fig. 2B) included immune
(adaptive and innate) and inflammatory response, cell
communication, positive regulation of I-κB kinase̸nuclear factor
(NF)-κB cascade, signal transduction, small-molecule metabolic
processes and transport. Within these GOs, a number of important
functions, such as cell communication, NF-κB cascade, signal
transduction, leukocyte chemotaxis and transport, were involved in
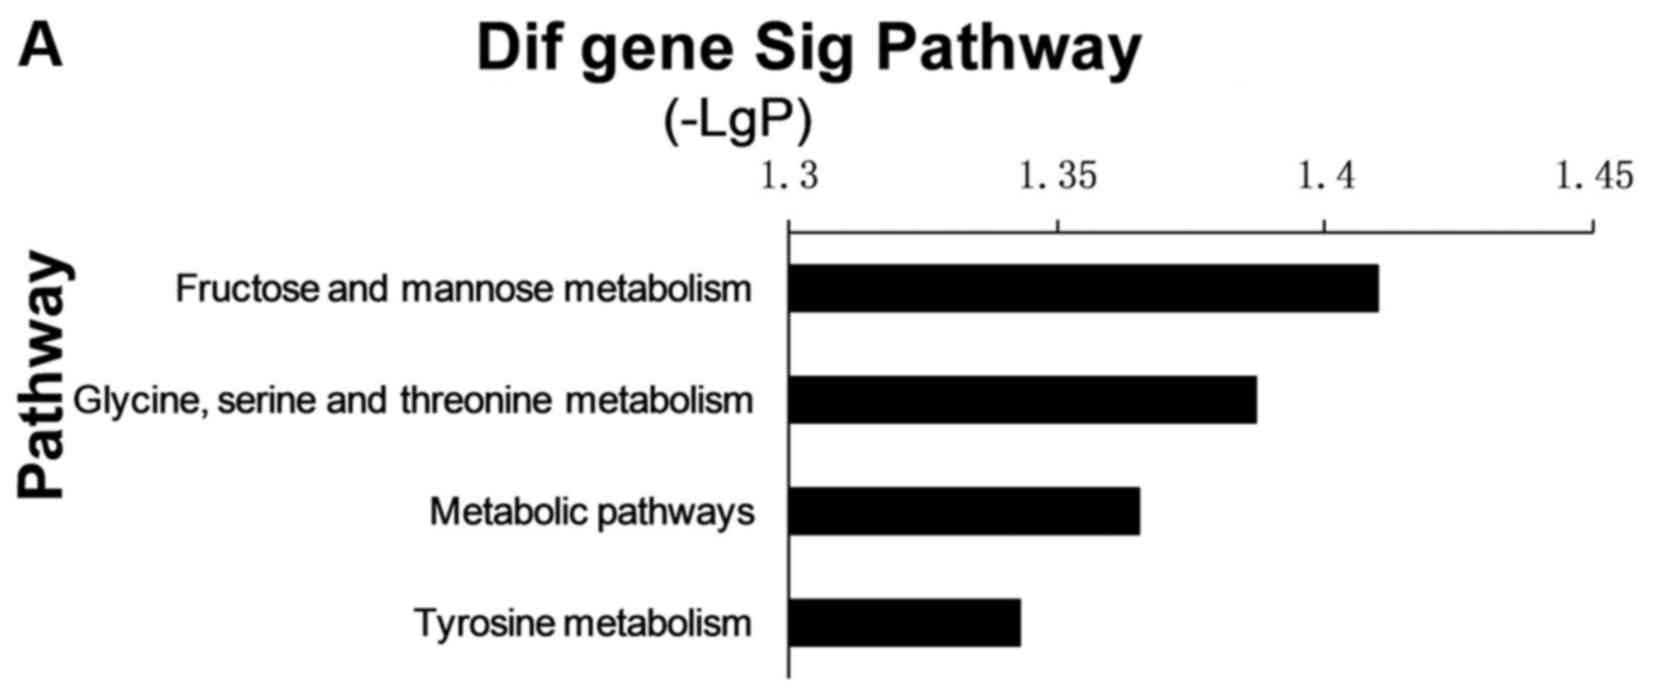
the regulation of this immune-related disorder. Pathway analysis
was used to identify the significant pathway of the differential
genes according to KEGG. The Fisher's exact test and χ2
test were used to select the significant pathway, and the threshold
of significance was defined by the P-value. The x-axis is the
negative logarithm of the P-value. The longer the bar, the smaller
the P-value, so that pathway is more significant. As shown in
Fig. 3, there were some important
pathways, including Staphylococcus aureus infection,
chemokine signaling pathway, cytokine-to-cytokine receptor
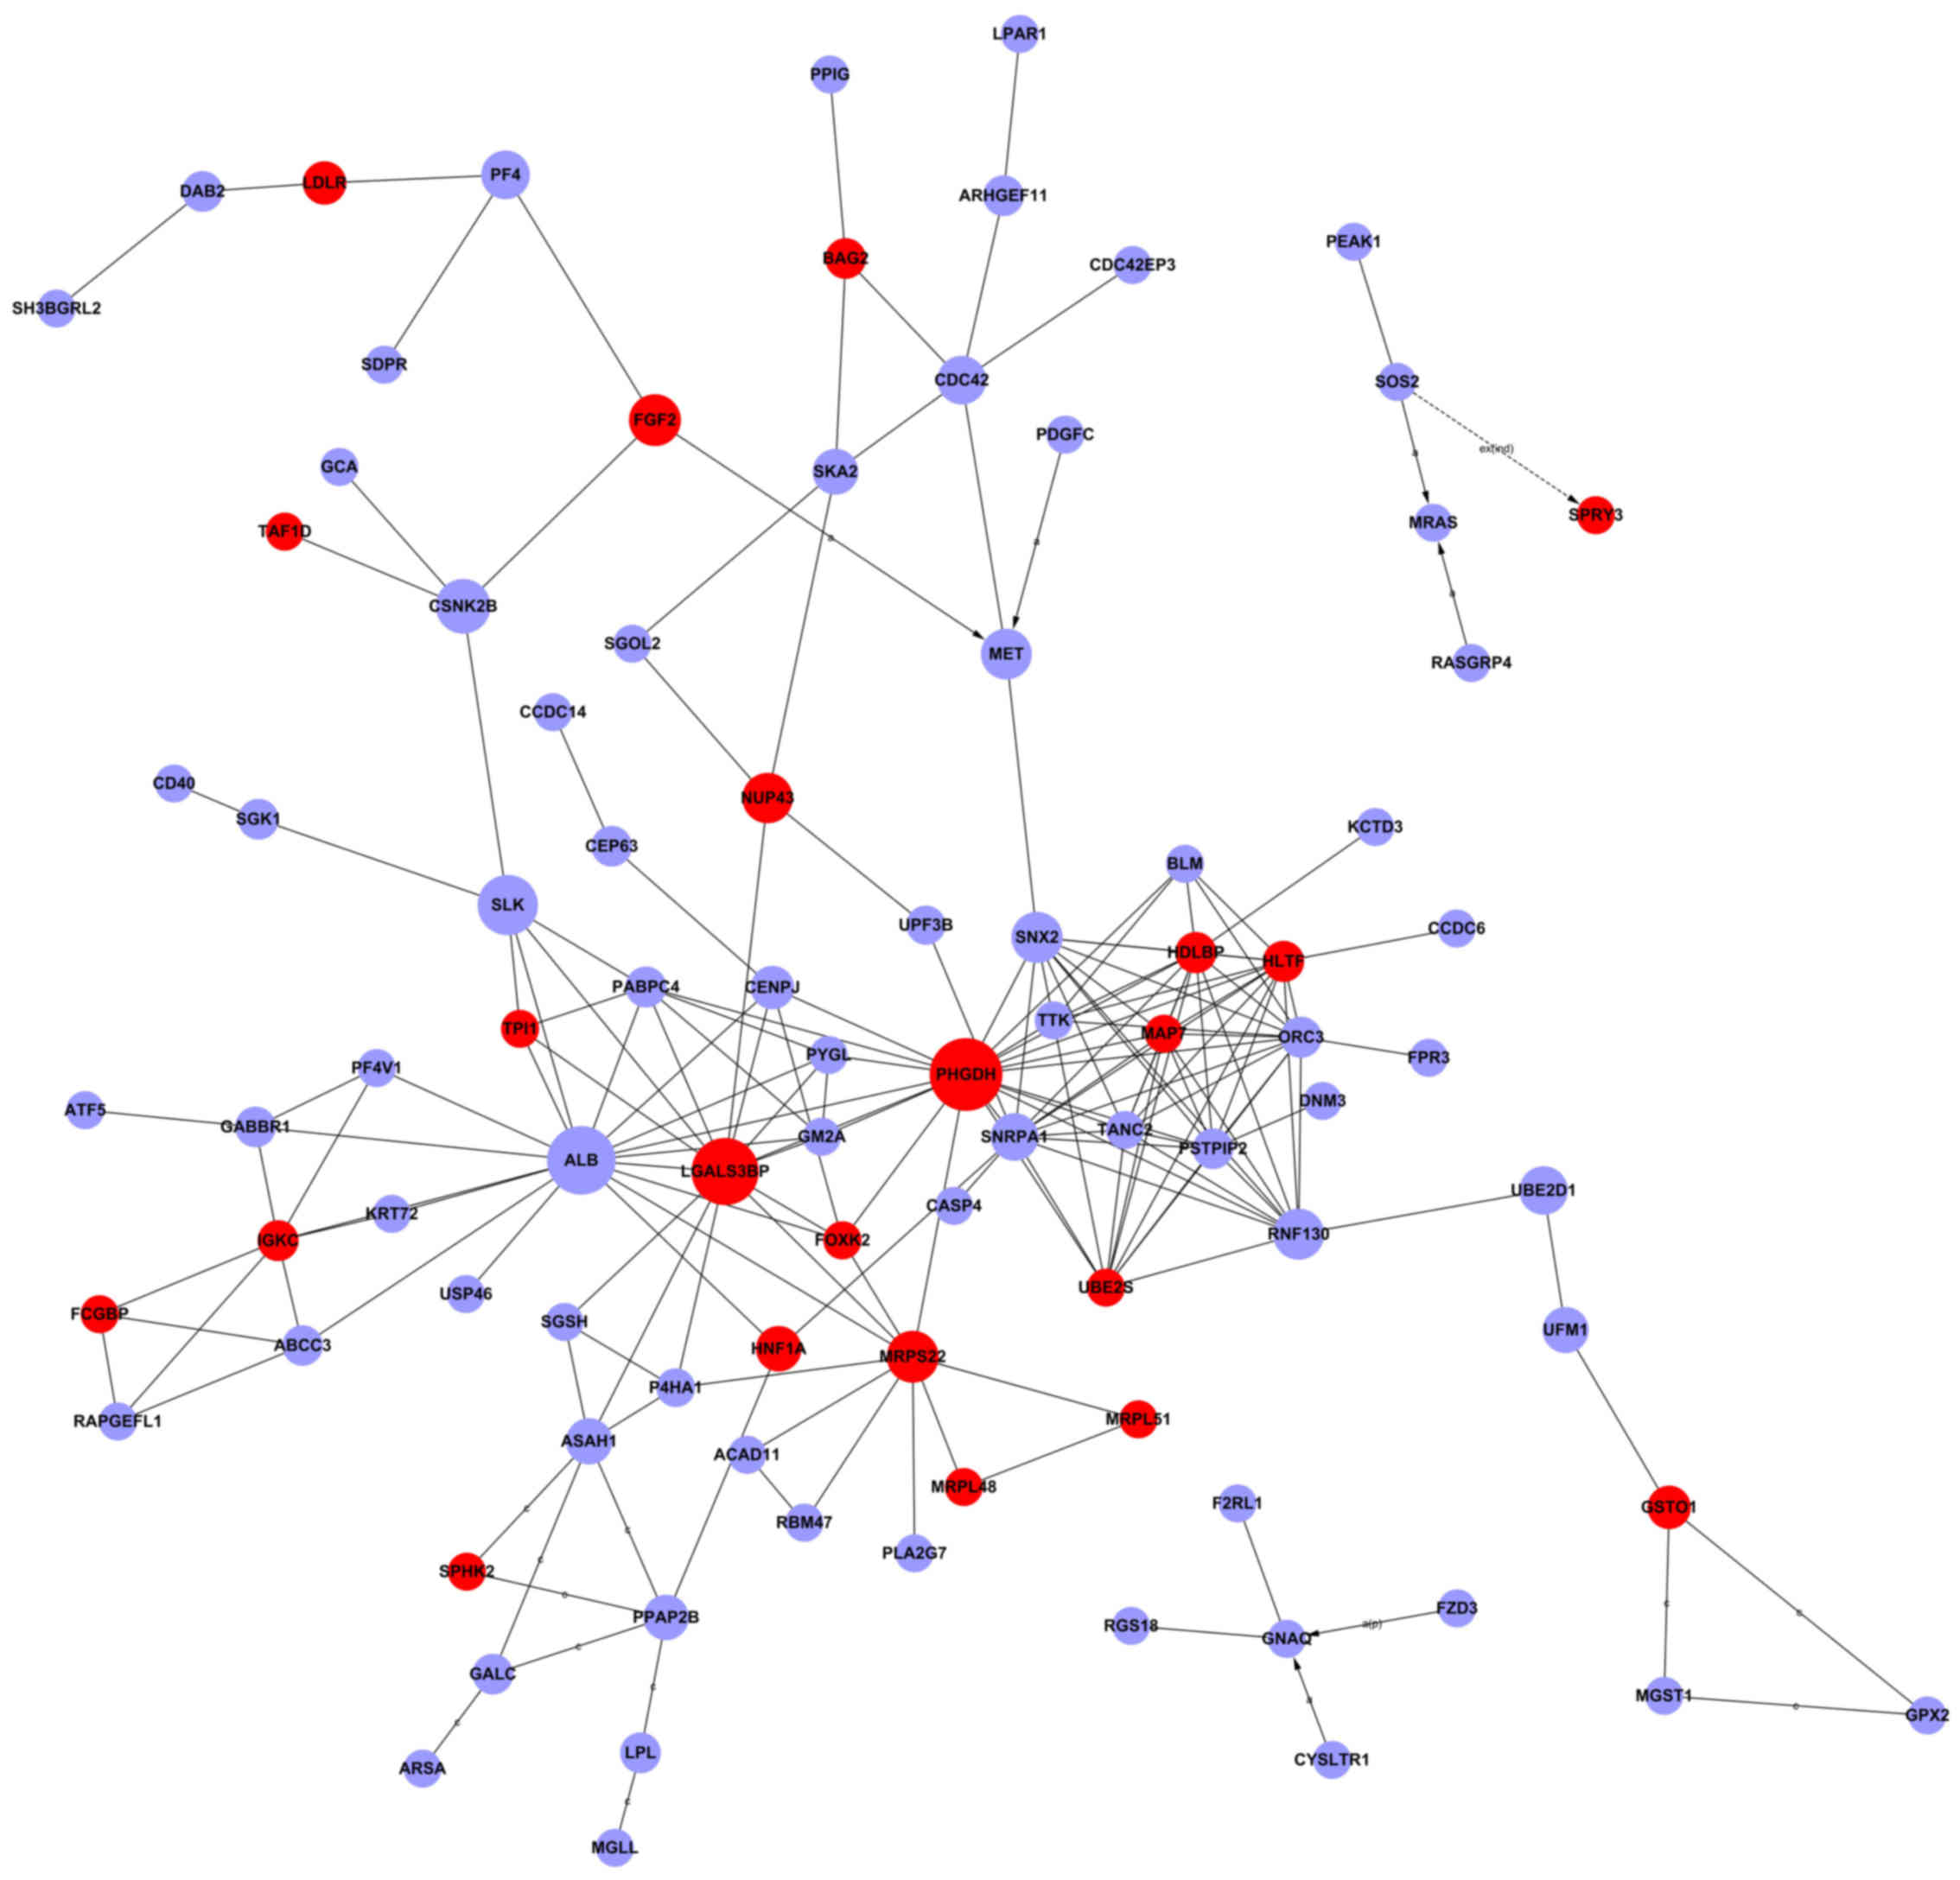
interaction and metabolic pathways. To screen for the important
candidate genes among the declared 801 genes, we selected
Signal-Net analysis and Gene-Rel-Net, and subsequently identified
18 genes. Signal-Net demonstrated the intensity of association
between the differentially expressed genes and adjacent genes. This
indicated that the genes were phosphoglycerate dehydrogenase
(PHGDH), albumin (ALB), helicase-like transcription
factor (HLTF), ring finger protein 130 (RNF130), and
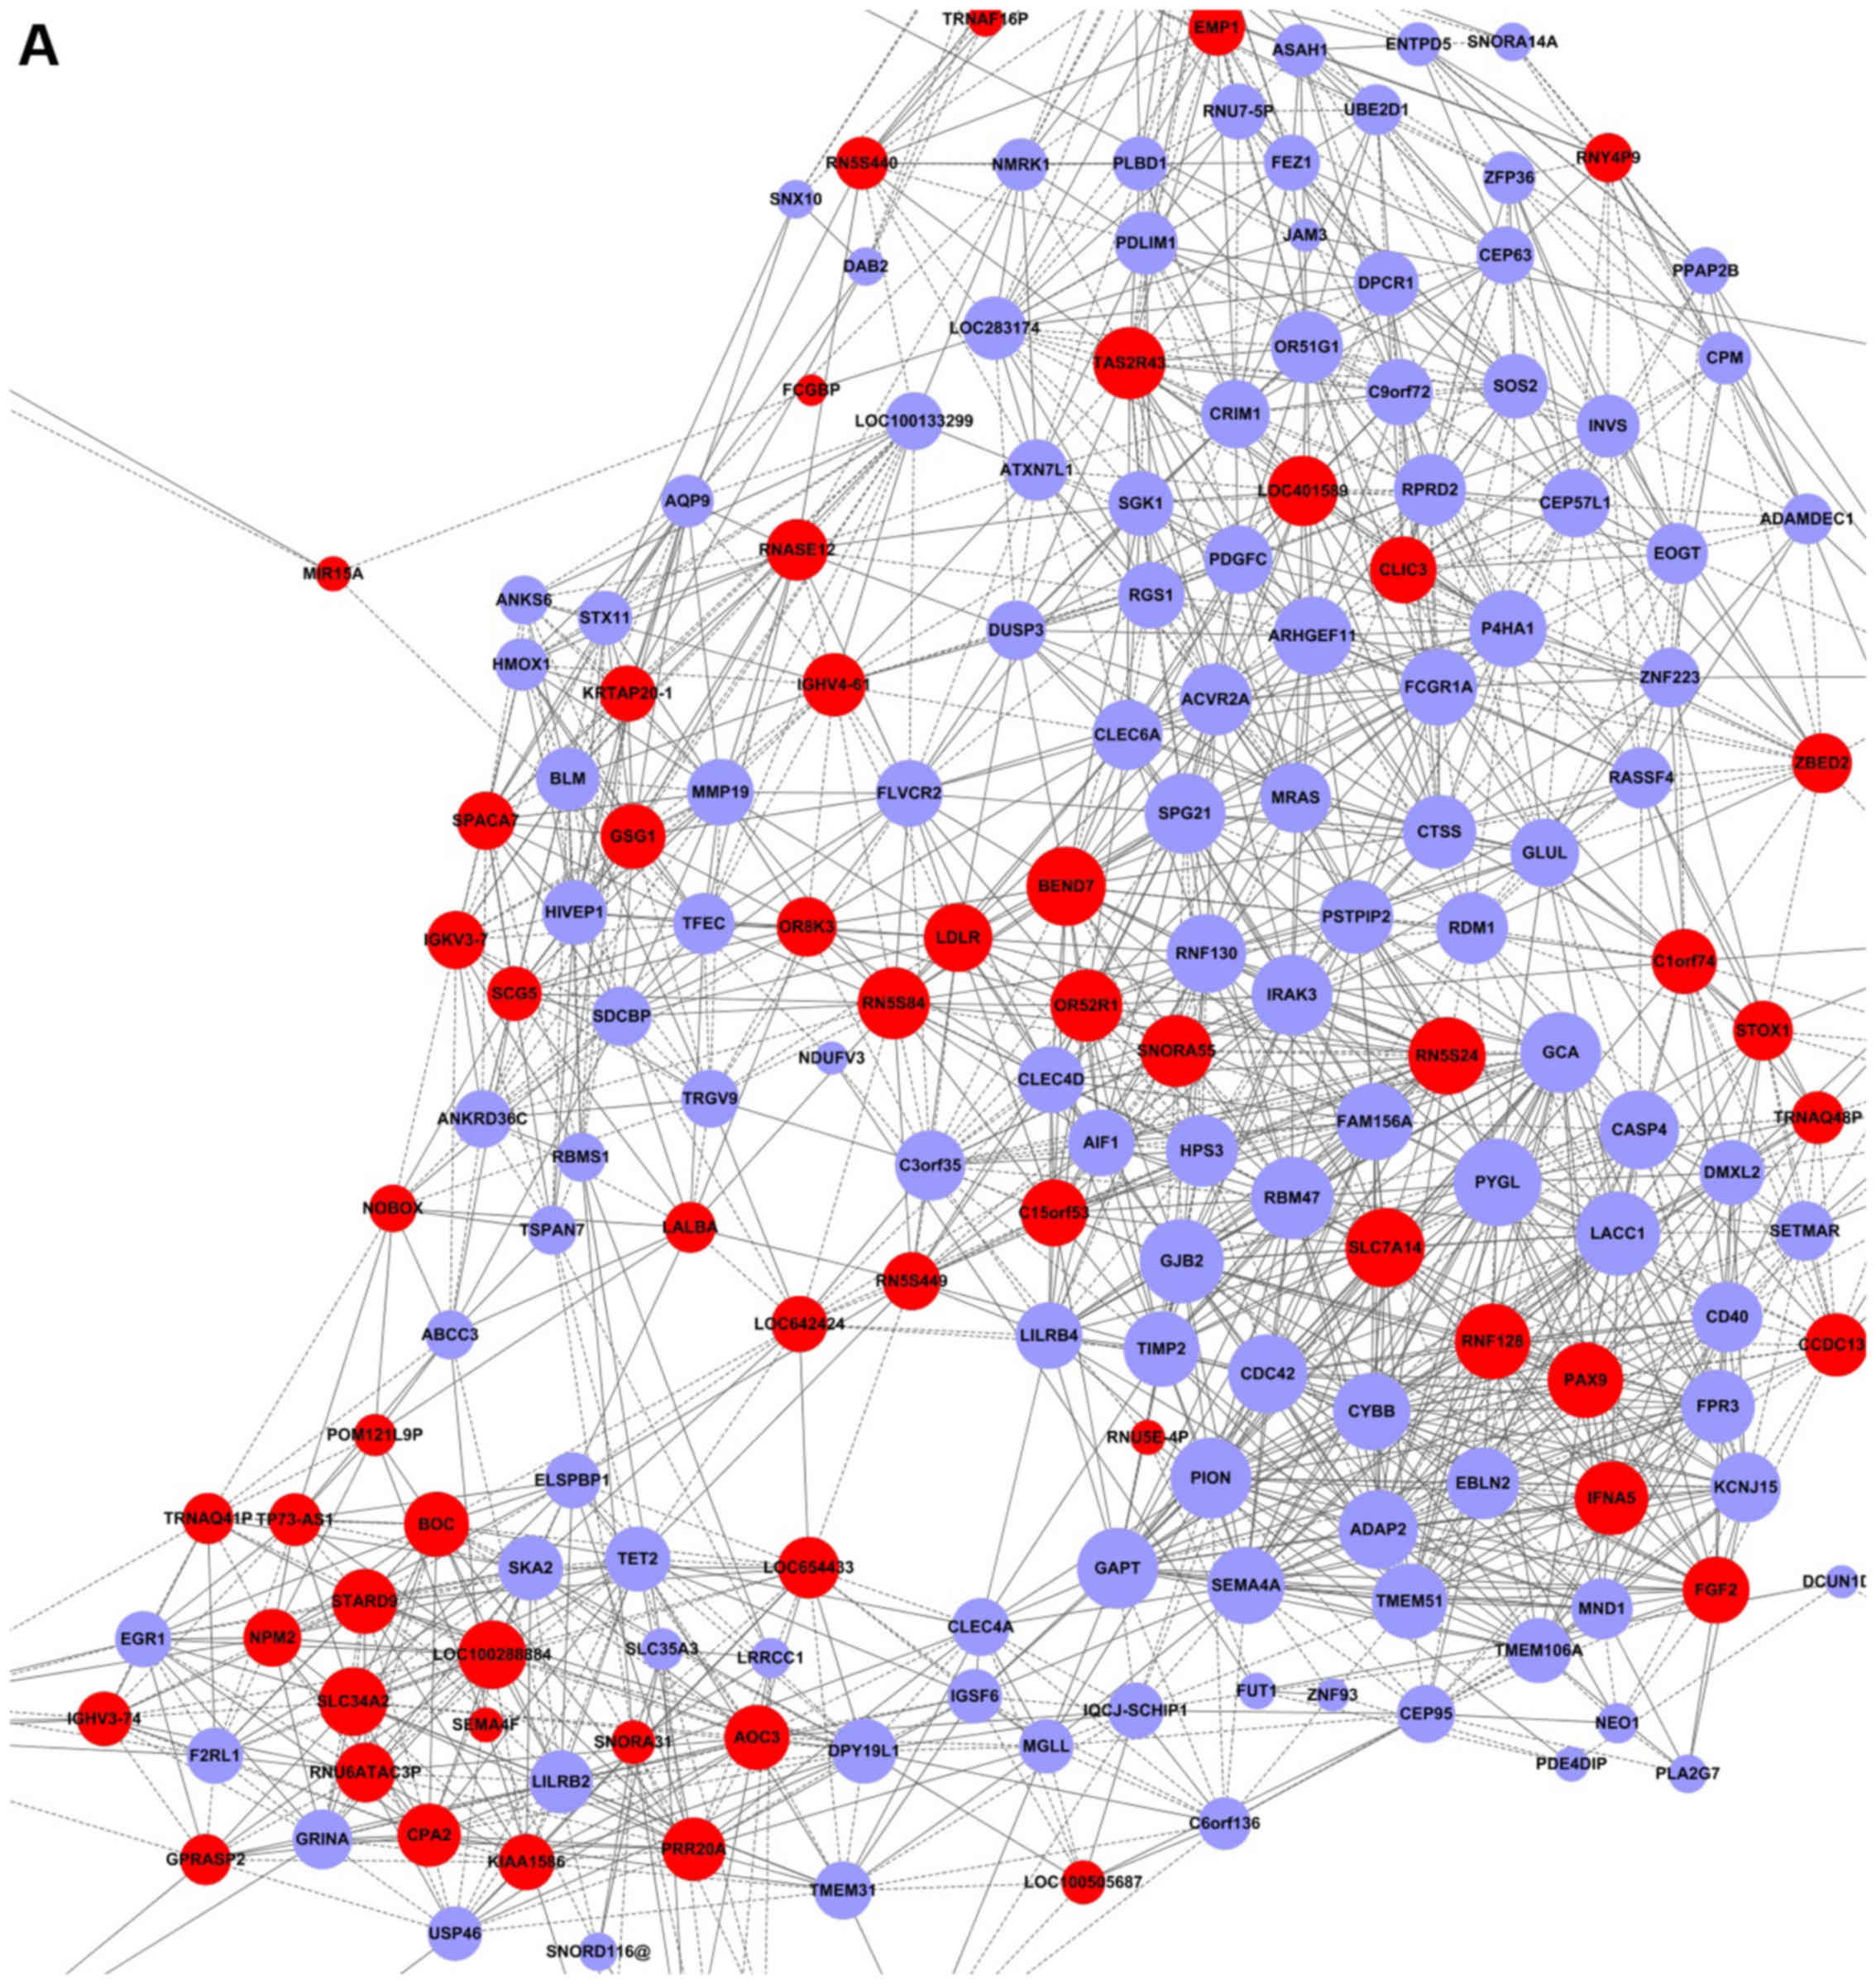
sorting nexin 2 (SNX2) with a higher degree (Fig. 4 and Table I). In Gene-Rel-Net, interleukin-1
receptor-associated kinase 3/M (IRAK3/M), microsomal
glutathione S-transferase 1 (MGST1), cytochrome b-245, β
polypeptide (CYBB), Fc fragment of IgG, high-affinity Ia,
receptor (CD64) (FCGR1A), gap junction protein, β2, 26 kDa
(GJB2), chemokine (C-X-C motif) ligand 9 (CXCL9),
guanine nucleotide-binding protein (G protein), q polypeptide
(GNAQ), cathepsin S (CTSS), phosphatidic acid
phosphatase type 2B (PPAP2B), leukocyte immunoglobulin-like
receptor, subfamily B (with TM and ITIM domains), member 2
(LILRB2), cell division cycle 42 (GTP-binding protein, 25
kDa) (CDC42), allograft inflammatory factor 1 (AIF1),
and fibroblast growth factor 2 (basic) (FGF2) link most
adjacent genes and have the largest degrees; thus, they were deemed
as the core regulatory factors (genes) (Fig. 5 and Table II).
 | Table ITop five genes ranked by degree
following analysis with Signal-Net. |
Table I
Top five genes ranked by degree
following analysis with Signal-Net.
| Gene symbol | Description | Degree | Indegree | Outdegree | Style | P-value | FDR |
|---|
| PHGDH | Phosphoglycerate
dehydrogenase | 20 | 20 | 20 | Up | 0.014022 | 1 |
| ALB | Albumin | 17 | 17 | 17 | Down | 0.017775 | 1 |
| HLTF | Helicase-like
transcription factor | 13 | 13 | 13 | Up | 0.035549 | 1 |
| RNF130 | Ring finger protein
130 | 11 | 11 | 11 | Down | 0.013715 | 1 |
| SNX2 | Sorting nexin
2 | 11 | 11 | 11 | down | 0.029279 | 1 |
| Table IITop 13 genes ranked by ABS following
analysis with Gene-Rel-Net. |
Table II
Top 13 genes ranked by ABS following
analysis with Gene-Rel-Net.
| Gene symbol | Description | Degree A | Degree B | ABS (K2-K1) | Style | P-value | FDR |
|---|
| IRAK3/M | Interleukin-1
receptor-associated kinase 3/M | 30 | 5 | 0.682352941 | Down | 0.028558 | 1 |
| MGST1 | Microsomal
glutathione S-transferase 1 | 0 | 17 | 0.68 | Down | 0.044897 | 1 |
| CYBB | Cytochrome b-245, β
polypeptide | 28 | 4 | 0.663529412 | Down | 0.025561 | 1 |
| FCGR1A | Fc fragment of IgG,
high-affinity Ia, receptor (CD64) | 28 | 4 | 0.663529412 | Down | 0.032623 | 1 |
| GJB2 | Gap junction
protein, β2, 26 kDa | 32 | 7 | 0.661176471 | Down | 0.01698 | 1 |
| CXCL9 | Chemokine (C-X-C
motif) ligand 9 | 8 | 22 | 0.644705882 | Down | 0.031734 | 1 |
| GNAQ | Guanine
nucleotide-binding protein (G protein), q polypeptide | 5 | 19 | 0.612941176 | Down | 0.012584 | 1 |
| CTSS | Cathepsin S | 26 | 4 | 0.604705882 | Down | 0.044654 | 1 |
| PPAP2B | Phosphatidic acid
phosphatase type 2B | 11 | 21 | 0.516470588 | Down | 0.003548 | 1 |
| LILRB2 | Leukocyte
immunoglobulin-like receptor, subfamily B (with TM and ITIM
domains), member 2 | 20 | 2 | 0.508235294 | Down | 0.044337 | 1 |
| CDC42 | Cell division cycle
42 (GTP-binding protein, 25 kDa) | 29 | 9 | 0.492941176 | Down | 0.016927 | 1 |
| AIF1 | Allograft
inflammatory factor 1 | 22 | 5 | 0.447058824 | Down | 0.03037 | 1 |
| FGF2 | Fibroblast growth
factor 2 (basic) | 22 | 7 | 0.367058824 | Up | 0.040008 | 1 |
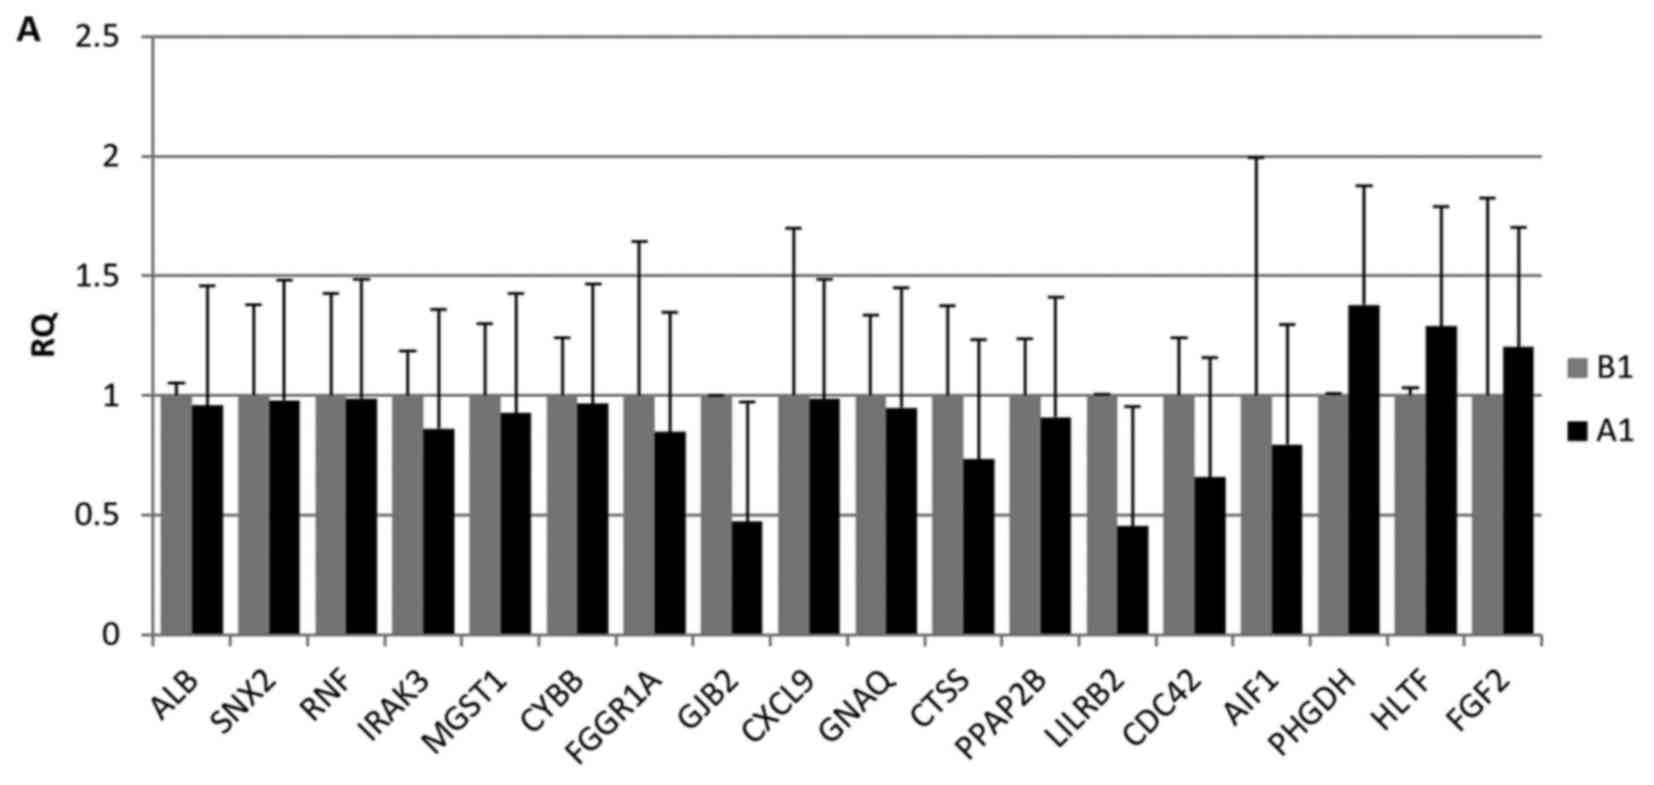
RT-qPCR verification of the genes
RT-qPCR was used to confirm the expression of the 18
candidate genes. Although the fold changes in mRNA varied between
the microarray and RT-qPCR analyses, the expression results were
relatively consistent for the analyzed genes. As expected, there
were very few differences between the A1 and B1 groups. Compared
with the results of the chip between A2 and B2, the expression of
most genes indicated that the overall trend was consistent with the
trend of the chip (Fig. 6).
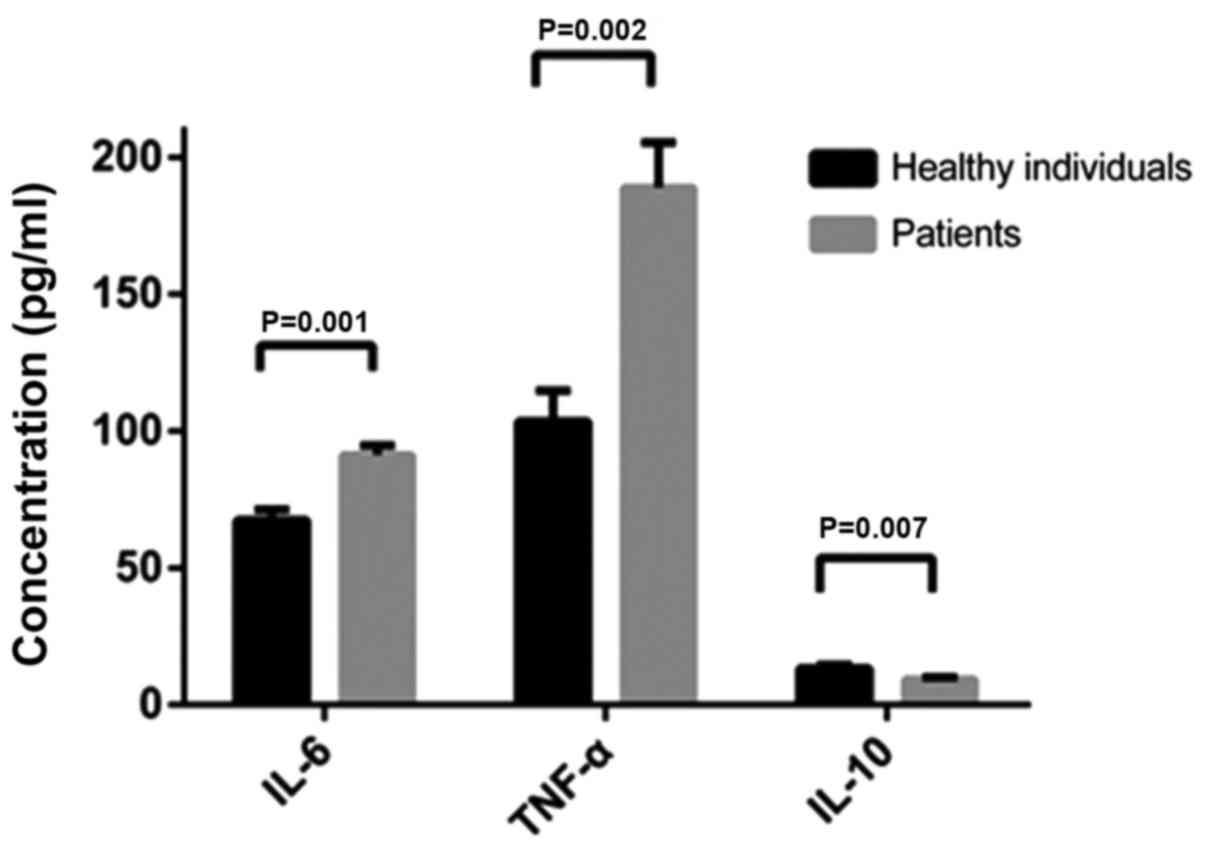
ELISA
The concentrations of TNF-α (at 24 h), IL-6 (at 24
h) and IL-10 (at 8 h) were compared in the culture supernatant of
monocytes isolated from the patients and their blood relatives when
the level of the cytokine reached the maximum following stimulation
with LPS. We found that the concentrations of TNF-α (118.90 pg/ml)
and IL-6 (91.23 pg/ml) were higher in the patients, while the
concentration of IL-10 (13.35 pg/ml) was higher in their blood
relatives (Fig. 7).
Discussion
HLA-B27 exhibits a wide distribution among
geographic regions, which is affecting the prevalence of AAU
worldwide. HLA-B27-associated AAU is the most common type of AAU,
which represents a potential threat to visual integrity (25); however, the exact underlying
mechanism has yet to be determined. Abundant studies have proven
that LPS, a major component of Gram-negative bacterial cell walls,
can induce AAU in animal models (26–29). Our previous studies demonstrated
that LPS-related Gram-negative bacteria could activate
TLR4-mediated immunity, resulting in the development of AAU
(30,31). In addition, the extent of
inflammation and gene expression levels from monocytes of
HLA-B27-positive patients were significantly different compared
with normal individuals in response to LPS stimulation (12). Furthermore, ~18–32% of AAU
patients are HLA-B27-positive, but only a few of the HLA-B27
carriers develop AAU (32), as
evidenced by HLA-B27-positive patients and blood-related healthy
carriers. In the present study, we selected monocytes from patients
with HLA-B27-associated AAU and their HLA-B27-positive blood
relatives to investigate this anomaly. In order to identify the
genes that play more important roles in the development of
HLA-B27-associated AAU, we only enrolled HLA-B27-associated AAU
patients and their immediate HLA-B27-positive healthy (without AAU
or systemic immune disease) family members as controls, which
significantly increased the difficulty of the enrollment for this
study. Thus, a total of 8 subjects were ultimately enrolled.
Although a bigger sample size would potentially optimize the
results, the results presented herein exhibited statistical
significance. We were also able to identify several potential
target genes following data analysis.
Microarray analysis of HLA-B27-associated AAU family
has not been reported to date. High-throughout screening is also an
effective method for comparing differentially expressed genes
between experimental and control groups. In the present study, key
genes and inflammatory signaling pathways involved in monocytes of
HLA-B27-associated AAU families were studied by gene expression
microarray. By comparing gene expression between the two groups, we
identified 801 differentially expressed genes, of which 349 were
upregulated and 452 were downregulated. The results indicated that
LPS stimulation induced an altered expression in monocytes from
HLA-B27-positive-AAU patients compared with their blood relatives.
The DEGs were subsequently organized into different categories
based on the biological processes. The results of the GO analysis
suggested that immune and inflammatory response, regulation of I-κB
kinase/NF-κB cascade, free ubiquitin chain polymerization, MAPK
import into nucleus, cytokines, chemokines, as well as
small-molecule metabolic metabolites, are the most critical GO
terms, which are involved in the occurrence and development of AAU.
In addition, pathway analysis identified Staphylococcus
aureus infection, chemokine signaling pathways,
cytokine-to-cytokine receptor interactions and metabolic pathways
as the most important pathways. The result of the analysis of the
function and pathways of DEGs supported that there were marked
changes in the immune and inflammatory reactions in
HLA-B27-positive AAU patients compared with the controls. We
observed the inflammatory reaction of activated mononuclear cells
in this experiment by using the LPS as a stimulus. It was observed
from the pathway analysis that Gram-negative bacterial
infection-related pathways activated other downstream pathways,
including cytokine-to-cytokine receptor interactions, chemokine
signaling pathways, gap junctions, FcγR-mediated phagocytosis and
several diverse metabolic pathways.
To screen for the important genes, Signal-Net and
Gene-Rel-Net analyses were performed and identified 18 genes that
were selected as key genes. Amongst these, particular attention was
paid to CDC42 and IRAK3/M, as our studies suggested that these two
genes were more significant compared with others (Table I). CDC42 is a member of the Rho
GTPase family that regulates the organization of the cytoskeleton
and membrane, and is involved in cell proliferation, polarity and
motility (33). The Rho family of
small GTPases are critical factors involved in the regulation of
signal transduction cascades from extracellular stimuli to the cell
nucleus, including the JNK̸SAPK signaling pathway (34). CDC42 has been demonstrated to be a
signal point for intracellular signaling networks that monitor
multiple signaling pathways, including cytokine receptors,
integrins, and responses to physical and chemical stresses
(35). Ito et al
demonstrated that knockdown of the CDC42 pathway significantly
inhibited the upregulation of inflammatory genes, decreased the
increased levels of pro-inflammatory molecules, consequently
attenuating the overactivation of immunity. CDC42 regulates the
expression of pro-inflammatory molecules by mobilizing the NF-κB
pathway, which is closely associated with LPS-mediated TLR4
activation (34).
Due to the importance of the immune process, other
key genes may be worth investigating. Interleukin-1
receptor-associated kinase M/3 (IRAKM/3), unlike other active
members of the IRAK family (IRAK-1 and -4) is a negative regulator
of TLR-mediated immune responses and it was downregulated in our
results. The activation of IRAK-M/3 prevents the dissociation of
IRAK-1 and -4 from MyD88 and formation of IRAK-TRAF6 complexes,
thereby suppressing production of the downstream pro-inflammatory
mediators controlled by TLR signaling (36–38). Moreover, it is worth noting that
the IRAK-M/3 is crucial for endotoxin tolerance and its absence
enhances the action of inflammatory cytokines (39). Overexpression of IRAK-M/3 can
downregulate TLR signaling, thus playing an important role in
controlling inflammatory and immune responses. In the present
study, the expression of IRAK-M̸3 was downregulated in monocytes of
AAU patients following stimulation with LPS, as proven in an in
vivo study conducted simultaneously. In this sense, we
hypothesized that the reduction in IRAKM/3 expression was
significantly correlated with HLA-B27-positive AAU patients.
In the present study, we also compared the
concentrations of TNF-α, IL-10 and IL-6 in the culture supernatants
of monocytes isolated from patients and their blood relatives. In
our previous study, high levels of IL-6 were detected in the
aqueous humor of C3H/HeN mice during endotoxin-induced uveitis
(40). In addition, the
concentrations of TNF-α and IL-10 in the culture supernatants of
peripheral blood mononuclear cells isolated from patients with
HLA-B27-associated AAU were found to be significantly increased
following stimulation with LPS (41). In addition, the concentrations of
IL-6, TNF-α and IL-10 were all found to be increased following LPS
stimulation in the patients as well as their blood relatives.
Subsequently, the elevated concentrations of IL-6, TNF-α and IL-10
in the culture supernatants of monocytes were compared between the
patients and their blood relatives following LPS stimulation.
Compared with the non-stimulatory group, the concentrations of IL-6
and TNF-α in the patients were significantly higher in the LPS
stimulation group. By contrast, the concentration of IL-10 cytokine
was significantly higher in the blood relatives. To the best of our
knowledge, the pro-inflammatory cytokines IL-6 and TNF-α regulate
various aspects of the immune response (42,43), whereas IL-10 acts as an
immunosuppressive cytokine (44,45). Our results demonstrated that there
were higher levels of inflammation and lower anti-inflammatory
effects in patients with HLA-B27-associated AAU.
In conclusion, monocytes isolated from patients may
produce a more intense inflammatory response compared with those
isolated from their healthy blood relatives following stimulation
with LPS, and monocytes isolated from patients were found to be
more sensitive to LPS stimulation. This may be a possible
explanation as to why patients with HLA-B27-associated AAU and
their healthy HLA-B27-positive blood relatives are all seropositive
for HLA-B27, but only the former suffer from AAU. Using gene chip
technology to compare monocytes from HLA-B27-positive families with
AAU with the control group following LPS stimulation, we identified
several potential target genes. Experiments on the peripheral blood
of humans and animals are currently being conducted to further
elucidate the roles of these key genes in the development of
HLA-B27-positive AAU. Future investigation into differentially
expressed genes should provide insights into the pathogenesis of
AAU.
Acknowledgments
The authors would like to thank Professor Guilin Xie
(Lanzhou Institute of Biological Products) for providing LPS.
References
|
1
|
Muñoz-Fernández S and Martín-Mola E:
Uveitis. Best Pract Res Clin Rheumatol. 20:487–505. 2006.
View Article : Google Scholar : PubMed/NCBI
|
|
2
|
Jabs DA, Nussenblatt RB and Rosenbaum JT;
Standardization of Uveitis Nomenclature (SUN) Working Group:
Standardization of uveitis nomenclature for reporting clinical
data. Results of the First International Workshop. Am J Ophthalmol.
140:509–516. 2005. View Article : Google Scholar : PubMed/NCBI
|
|
3
|
Wakefield D, Yates W, Amjadi S and
McCluskey P: HLA-B27 anterior uveitis: Immunology and
immunopathology. Ocul Immunol Inflamm. 24:450–459. 2016. View Article : Google Scholar : PubMed/NCBI
|
|
4
|
McGonagle D and McDermott MF: A proposed
classification of the immunological diseases. PLoS Med. 3:e2972006.
View Article : Google Scholar : PubMed/NCBI
|
|
5
|
Smith JA, Märker-Hermann E and Colbert RA:
Pathogenesis of ankylosing spondylitis: Current concepts. Best
Pract Res Clin Rheumatol. 20:571–591. 2006. View Article : Google Scholar : PubMed/NCBI
|
|
6
|
Colbert RA: HLA-B27 misfolding: A solution
to the spondyloarthropathy conundrum. Mol Med Today. 6:224–230.
2000. View Article : Google Scholar : PubMed/NCBI
|
|
7
|
Schröder M and Kaufman RJ: ER stress and
the unfolded protein response. Mutat Res. 569:29–63. 2005.
View Article : Google Scholar
|
|
8
|
Chang JH, McCluskey PJ and Wakefield D:
Acute anterior uveitis and HLA-B27. Surv Ophthalmol. 50:364–388.
2005. View Article : Google Scholar : PubMed/NCBI
|
|
9
|
Goldman M: Translational mini-review
series on Toll-like receptors: Toll-like receptor ligands as novel
pharmaceuticals for allergic disorders. Clin Exp Immunol.
147:208–216. 2007. View Article : Google Scholar : PubMed/NCBI
|
|
10
|
Du L, Kijlstra A and Yang P: Immune
response genes in uveitis. Ocul Immunol Inflamm. 17:249–256. 2009.
View Article : Google Scholar : PubMed/NCBI
|
|
11
|
Bi HS, Liu ZF and Cui Y: Pathogenesis of
innate immunity and adaptive immunity in the mouse model of
experimental autoimmune uveitis. J Chin Med Assoc. 78:276–282.
2015. View Article : Google Scholar : PubMed/NCBI
|
|
12
|
Hu XF, Lu H, Wang J, Zhang XS, Zhang XL,
Liu XH, Xu ZZ, Hu JM and Lu QJ: Screening of key genes and
inflammatory signalling pathway involved in the pathogenesis of
HLA-B27-associated acute anterior uveitis by gene expression
microarray. Zhonghua Yan Ke Za Zhi. 49:217–223. 2013.In Chinese.
PubMed/NCBI
|
|
13
|
Deschenes J, Murray PI, Rao NA and
Nussenblatt RB; International Uveitis Study Group: International
Uveitis Study Group (IUSG): clinical classification of uveitis.
Ocul Immunol Inflamm. 16:1–2. 2008. View Article : Google Scholar : PubMed/NCBI
|
|
14
|
Wright GW and Simon RM: A random variance
model for detection of differential gene expression in small
microarray experiments. Bioinformatics. 19:2448–2455. 2003.
View Article : Google Scholar : PubMed/NCBI
|
|
15
|
Yang H, Crawford N, Lukes L, Finney R,
Lancaster M and Hunter KW: Metastasis predictive signature profiles
pre-exist in normal tissues. Clin Exp Metastasis. 22:593–603. 2005.
View Article : Google Scholar
|
|
16
|
Clarke R, Ressom HW, Wang A, Xuan J, Liu
MC, Gehan EA and Wang Y: The properties of high-dimensional data
spaces: Implications for exploring gene and protein expression
data. Nat Rev Cancer. 8:37–49. 2008. View
Article : Google Scholar :
|
|
17
|
Dupuy D, Bertin N, Hidalgo CA, venkatesan
K, Tu D, Lee D, Rosenberg J, Svrzikapa N, Blanc A, Carnec A, et al:
Genome-scale analysis of in vivo spatiotemporal promoter activity
in Caenorhabditis elegans. Nat Biotechnol. 25:663–668. 2007.
View Article : Google Scholar : PubMed/NCBI
|
|
18
|
Gene Ontology Consortium: The Gene
Ontology (GO) project in 2006. Nucleic Acids Res. 34:D322–D326.
2006. View Article : Google Scholar :
|
|
19
|
Ashburner M, Ball CA, Blake JA, Botstein
D, Butler H, Cherry JM, Davis AP, Dolinski K, Dwight SS, Eppig JT,
et al The Gene Ontology Consortium: Gene ontology: Tool for the
unification of biology. Nat Genet. 25:25–29. 2000. View Article : Google Scholar : PubMed/NCBI
|
|
20
|
Wei Z and Li H: A Markov random field
model for network-based analysis of genomic data. Bioinformatics.
23:1537–1544. 2007. View Article : Google Scholar : PubMed/NCBI
|
|
21
|
Li C and Li H: Network-constrained
regularization and variable selection for analysis of genomic data.
Bioinformatics. 24:1175–1182. 2008. View Article : Google Scholar : PubMed/NCBI
|
|
22
|
Zhang JD and Wiemann S: KEGGgraph: A graph
approach to KEGG PATHWAY in R and bioconductor. Bioinformatics.
25:1470–1471. 2009. View Article : Google Scholar : PubMed/NCBI
|
|
23
|
Pujana MA, Han JD, Starita LM, Stevens KN,
Tewari M, Ahn JS, Rennert G, Moreno V, Kirchhoff T, Gold B, et al:
Network modeling links breast cancer susceptibility and centrosome
dysfunction. Nat Genet. 39:1338–1349. 2007. View Article : Google Scholar : PubMed/NCBI
|
|
24
|
Prieto C, Risueño A, Fontanillo C and De
las Rivas J: Human gene coexpression landscape: Confident network
derived from tissue transcriptomic profiles. PLoS One. 3:e39112008.
View Article : Google Scholar : PubMed/NCBI
|
|
25
|
Chang JH and Wakefield D: Uveitis: A
global perspective. Ocul Immunol Inflamm. 10:263–279. 2002.
View Article : Google Scholar
|
|
26
|
Bhattacherjee P, Williams RN and Eakins
KE: An evaluation of ocular inflammation following the injection of
bacterial endotoxin into the rat foot pad. Invest Ophthalmol vis
Sci. 24:196–202. 1983.PubMed/NCBI
|
|
27
|
McMenamin PG and Crewe J:
Endotoxin-induced uveitis. Kinetics and phenotype of the
inflammatory cell infiltrate and the response of the resident
tissue macrophages and dendritic cells in the iris and ciliary
body. Invest Ophthalmol vis Sci. 36:1949–1959. 1995.PubMed/NCBI
|
|
28
|
de vos AF, van Haren MA, Verhagen C,
Hoekzema R and Kijlstra A: Kinetics of intraocular tumor necrosis
factor and interleukin-6 in endotoxin-induced uveitis in the rat.
Invest Ophthalmol vis Sci. 35:1100–1106. 1994.PubMed/NCBI
|
|
29
|
Zheng C, Lei C, Chen Z, Zheng S, Yang H,
Qiu Y and Lei B: Topical administration of diminazene aceturate
decreases inflammation in endotoxin-induced uveitis. Mol vis.
21:403–411. 2015.PubMed/NCBI
|
|
30
|
Chen W, Hu X, Zhao L, Li S and Lu H:
Expression of toll-like receptor 4 in uvea-resident tissue
macrophages during endotoxin-induced uveitis. Mol vis. 15:619–628.
2009.PubMed/NCBI
|
|
31
|
Li S, Lu H, Hu X, Chen W, Xu Y and Wang J:
Expression of TLR4-MyD88 and NF-κB in the iris during
endotoxin-induced uveitis. Mediators Inflamm. 2010:748218. 2010.
View Article : Google Scholar
|
|
32
|
Wakefield D, Chang JH, Amjadi S,
Maconochie Z, Abu El-Asrar A and McCluskey P: What is new HLA-B27
acute anterior uveitis. Ocul Immunol Inflamm. 19:139–144. 2011.
View Article : Google Scholar : PubMed/NCBI
|
|
33
|
Ito TK, Yokoyama M, Yoshida Y, Nojima A,
Kassai H, Oishi K, Okada S, Kinoshita D, Kobayashi Y, Fruttiger M,
et al: A crucial role for CDC42 in senescence-associated
inflammation and atherosclerosis. PLoS One. 9:e1021862014.
View Article : Google Scholar : PubMed/NCBI
|
|
34
|
Perona R, Montaner S, Saniger L,
Sánchez-Pérez I, Bravo R and Lacal JC: Activation of the nuclear
factor-kappaB by Rho, CDC42, and Rac-1 proteins. Genes Dev.
11:463–475. 1997. View Article : Google Scholar : PubMed/NCBI
|
|
35
|
Puls A, Eliopoulos AG, Nobes CD, Bridges
T, Young LS and Hall A: Activation of the small GTPase Cdc42 by the
inflammatory cytokines TNF(alpha) and IL-1, and by the Epstein-Barr
virus transforming protein LMP1. J Cell Sci. 112:2983–2992.
1999.PubMed/NCBI
|
|
36
|
Kobayashi K, Hernandez LD, Galán JE,
Janeway CA Jr, Medzhitov R and Flavell RA: IRAK-M is a negative
regulator of Toll-like receptor signaling. Cell. 110:191–202. 2002.
View Article : Google Scholar : PubMed/NCBI
|
|
37
|
Nakayama K, Okugawa S, Yanagimoto S,
Kitazawa T, Tsukada K, Kawada M, Kimura S, Hirai K, Takagaki Y and
Ota Y: Involvement of IRAK-M in peptidoglycan-induced tolerance in
macrophages. J Biol Chem. 279:6629–6634. 2004. View Article : Google Scholar
|
|
38
|
Gottipati S, Rao NL and Fung-Leung WP:
IRAK1: A critical signaling mediator of innate immunity. Cell
Signal. 20:269–276. 2008. View Article : Google Scholar
|
|
39
|
Maldifassi MC, Atienza G, Arnalich F,
López-Collazo E, Cedillo JL, Martín-Sánchez C, Bordas A, Renart J
and Montiel C: A new IRAK-M-mediated mechanism implicated in the
anti-inflammatory effect of nicotine via α7 nicotinic receptors in
human macrophages. PLoS One. 9:e1083972014. View Article : Google Scholar
|
|
40
|
Xu Y, Chen W, Lu H, Hu X, Li S, Wang J and
Zhao L: The expression of cytokines in the aqueous humor and serum
during endotoxin-induced uveitis in C3H̸HeN mice. Mol vis.
16:1689–1695. 2010.PubMed/NCBI
|
|
41
|
Liu X, Hu X, Zhang X, Li Z and Lu H: Role
of rheum polysaccharide in the cytokines produced by peripheral
blood monocytes in TLR4 mediated HLA-B27 associated AAU. Biomed Res
Int. 2013:4312322013. View Article : Google Scholar : PubMed/NCBI
|
|
42
|
Santos Lacomba M, Marcos Martín C,
Gallardo Galera JM, Gómez vidal MA, Collantes Estévez E, Ramírez
Chamond R and Omar M: Aqueous humor and serum tumor necrosis
factor-alpha in clinical uveitis. Ophthalmic Res. 33:251–255. 2001.
View Article : Google Scholar : PubMed/NCBI
|
|
43
|
Pérez-Guijo V, Santos-Lacomba M,
Sánchez-Hernández M, Castro-villegas MC, Gallardo-Galera JM and
Collantes-Estévez E: Tumour necrosis factor-alpha levels in aqueous
humour and serum from patients with uveitis: The involvement of
HLA-B27. Curr Med Res Opin. 20:155–157. 2004. View Article : Google Scholar : PubMed/NCBI
|
|
44
|
Mosmann TR: Properties and functions of
interleukin-10. Adv Immunol. 56:1–26. 1994. View Article : Google Scholar : PubMed/NCBI
|
|
45
|
Groux H, Bigler M, de vries JE and
Roncarolo MG: Inhibitory and stimulatory effects of IL-10 on human
CD8+ T cells. J Immunol. 160:3188–3193. 1998.PubMed/NCBI
|