Introduction
Acute myeloid leukemia (AML) is the most common type
of acute leukemia. It is a heterogeneous clonal disorder
characterized by an increase in the number of myeloid cells in the
marrow and an arrest in their maturation, frequently resulting in
hematopoietic insufficiency (1).
The annual incidence of AML in the United States in 1999 was ~2.4
per 100,000 individuals, and the prevalence of the condition
increased progressively with age to reach a peak of 12.6 per
100,000 individuals in adults aged 65 years or older (1). The incidence of AML has become
higher than ever. In 2016, the number of new cases of AML in the
United States was 19,950, representing an increase of 6,090 from
the number reported in 2013 (2,3).
By contrast, the number of cases of AML-associated
mortality in 2016 revealed an increase of only 230 cases, compared
with the number of cases of AML-associated mortality in 2013
(2,3). With the ongoing improvements in
chemotherapeutic protocols in support therapy, and the development
of hematopoietic stem cell transplantation techniques, the
prognosis of patients with AML has improved. However, there remain
several challenges in the clinical treatment of AML. For example,
it was previously reported that 10–20% of patients with AML do not
enter remission following their first course of chemotherapy, a
number of patients succumb to mortality due to complications of
chemotherapy, and >50% of affected patients are expected to
eventually relapse with low remission rates and short median
survival rates (4,5). Therefore, AML remains one of the
most difficult diseases to treat clinically; therefore, the
examination of the pathogenesis of AML and methods to effectively
prevent the condition have become areas of interest in
research.
At present, the pathogenesis of AML remains to be
fully elucidated, and it is generally considered to involve
multiple mutations of gene loci with numerous mechanisms. Previous
studies have identified several prognostic indicators for AML,
including age, cytogenetic findings, white blood cell count, and
the presence or absence of an antecedent hematologic disorder
(e.g., myelodysplasia) (6). Until
the 1990s, cytogenetic findings represented the most useful
prognostic factor (7,8). However, additional factors
associated with the pathogenesis and prognosis of AML have been
found, including cell karyotype, micro-ribonucleic acid-155
(9), and gene mutation and
expression (10). The aberrant
expression of certain specific genes associated with hematopoiesis,
bone marrow differentiation and immune stress can significantly
affect the chemotherapeutic effects on and the prognosis of AML.
For example, the high expression of brain and acute leukemia,
cytoplasmic (BAALC) and MN1 has a close association with the poor
prognosis of AML (10–13). As the previous prognostic scoring
systems that have been used are mainly based on age, cytogenetic
findings and white blood cell count, the examination of additional
AML-related genes and the establishment of a more effective scoring
system based on the expression levels of these genes are of
important theoretical and clinical significance.
In order to investigate the possible unknown
important pathogenic mechanisms and novel biomarkers of AML,
comprehensive bioinformatics analysis methods were used in the
present study. The messenger ribonucleic acid sequencing (mRNA-seq)
data of patients with AML were downloaded from the Cancer Genome
Atlas (TCGA) database, and were integrated with clinical data and
survival information to screen out differentially expressed genes
(DEGs) associated with AML. A prognostic scoring system was
established based on the screened genes and simultaneously
validated by a dataset from the Gene Expression Omnibus (GEO)
database. The reliability of the novel prognostic scoring system
was further validated by performing a correlation analysis between
clinical characteristics and prognosis, and stratified analysis
between risk assessment and clinical characteristics.
Materials and methods
Data sources
The mRNA‑seq expression profiles of adult patients
with AML were downloaded from TCGA database (https://gdc-portal.nci.nih.gov/) on April 10, 2017,
having been sequenced on the Illumina HiSeq™ 2000 platform
(Illumina, San Diego, CA, USA). In total, there were 200 bone
marrow tissue samples from patients with AML, of which 173 had
corresponding clinical information barcode numbers. This dataset
was used as the training dataset.
For the validation dataset, 'acute myeloid leukemia'
and 'human' were used as key words to search the GEO database
(https://www.ncbi.nlm.nih.gov/geo) on
April 27, 2017. Subsequently, the GSE12417 expression dataset
(14) from the GPL96 platform,
which contained a total of 163 AML adult bone marrow tissue
samples, was selected and downloaded. In the original article of
the GSE12417 dataset, the trials were approved by the local
institutional review boards of all participating centers, and
informed consent was obtained from all patients in accordance with
the Declaration of Helsinki (14). The overall analytical process used
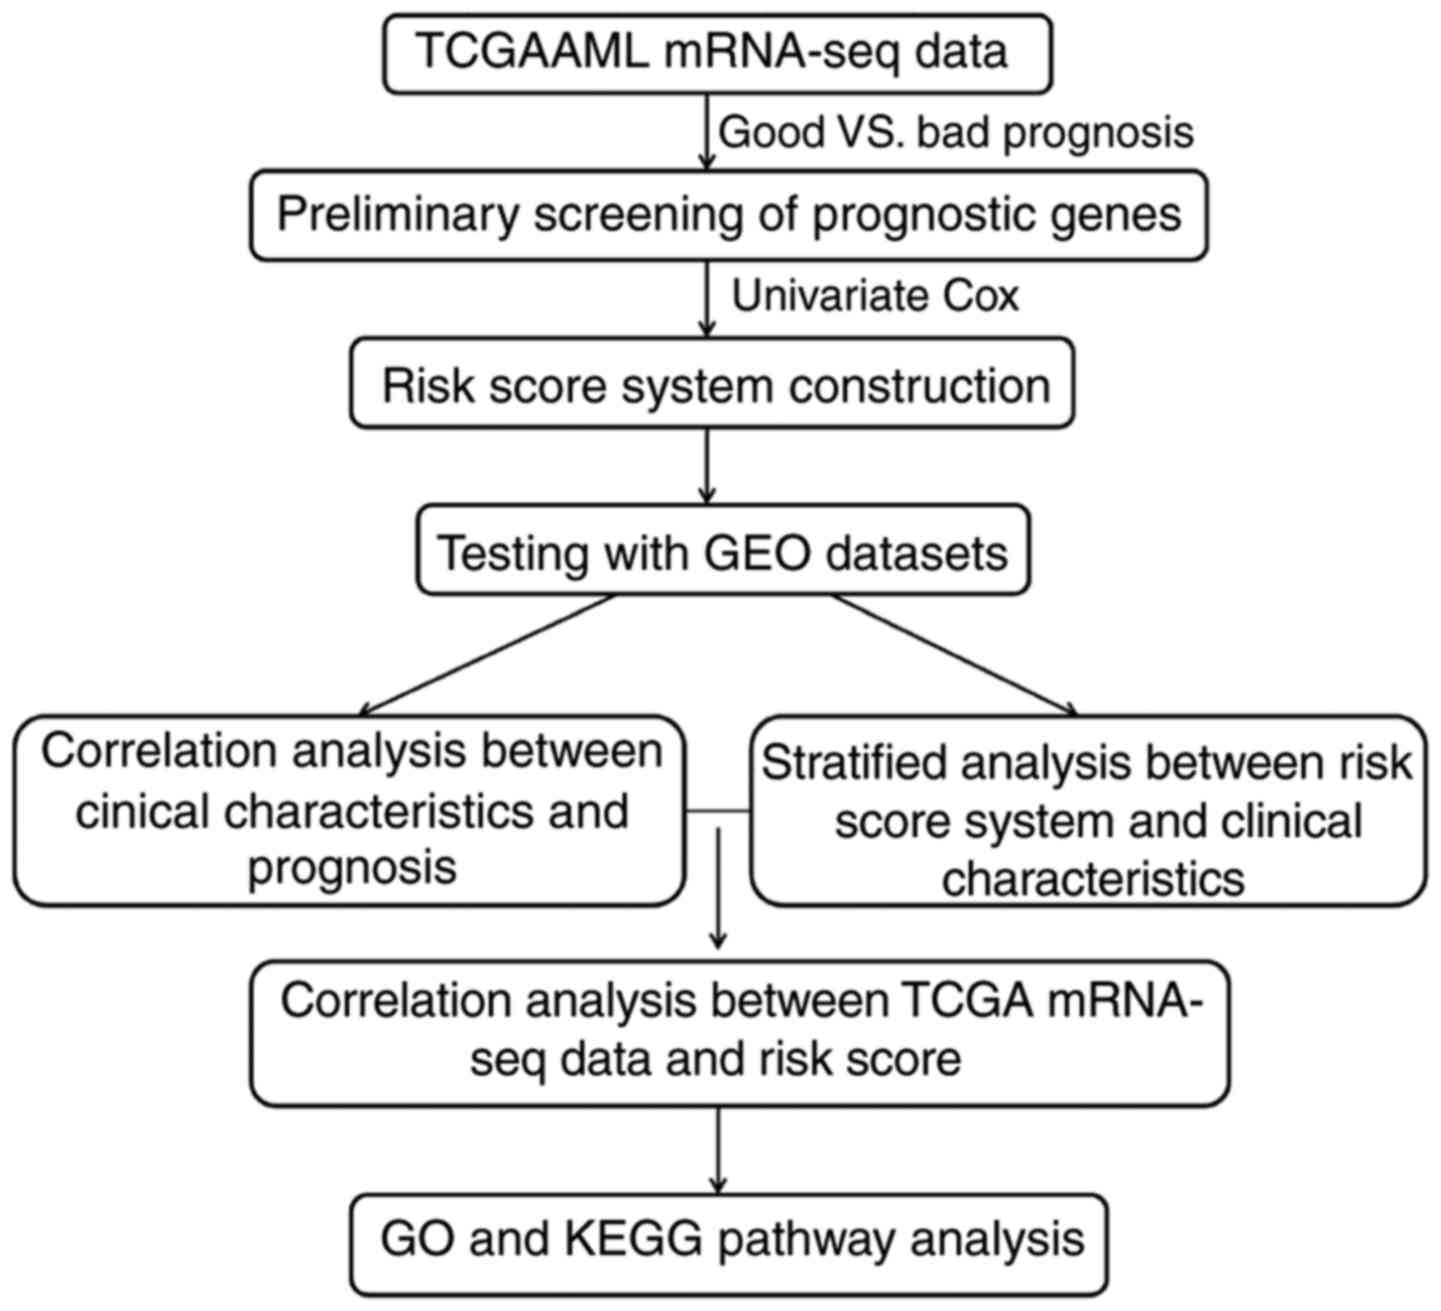
in the present study is presented in Fig. 1.
Clinical information
The clinical information of the training and
validation datasets were received and then sorted, as shown in
Table I. Survival information was
provided; the overall survival rates were 19.30±19.79 months in the
training dataset and 15.12±14 months in the validation dataset,
respectively (Table I).
 | Table IClinical information of TCGA training
and validation datasets. |
Table I
Clinical information of TCGA training
and validation datasets.
| Clinical
characteristics | TCGA (N=174) | GSE1241
(N=326) |
|---|
| Age (mean years ±
standard deviation) | 55.28±16.14 | 55.66±14.82 |
| Gender
(male/female/−) | 93/80/1 | – |
| FLT3 mutation
(positive/negative/−) | 50/116/8 | – |
| BCR-ABL
(positive/negative/−) | 1/13/160 | – |
| IDH1 R132
(positive/negative/−) | 15/153/6 | – |
| IDH1 R140
(positive/negative/−) | 13/153/8 | – |
| IDH1 R172
(positive/negative/−) | 2/167/5 | – |
| Activating RAS
(positive/negative/−) | 9/161/4 | – |
| NPMc
(positive/negative/−) | 42/128/4 | – |
| PML-RAR
(positive/negative/−) | 5/7/162 | – |
| Death
(deceased/alive/−) | 103/57/14 | 206/120 |
| Overall survival
months (mean ± standard deviation) | 19.30±19.79 | 15.12±14.00 |
Screening of DEGs
Among the 173 AML samples in the training dataset,
160 had survival and prognosis information. Following the removal
of those without clinical information and those with survival rates
of <6 months, 141 samples remained for further analysis. Of
these, samples with survival rates of <12 months were defined as
the poor prognosis group, whereas those with survival rates of
>24 months were classified into the good prognosis group. The
DEGs of the two groups were examined using the Linear Models for
Microarray Data (LIMMA) package (15) of R3.1.0 with a false discovery
rate (FDR) threshold of <0.05.
Screening of genes associated with
prognosis
For the 141 samples with survival rates of >6
months, univariate Cox regression analysis was used in the survival
package of R3.1.0 language (16)
to screen for genes significantly correlated with prognosis.
P‑values were examined by log‑rank and P≤0.05 was set as the
threshold of significant correlation. Multivariate Cox regression
was then performed to narrow down the eligible genes associated
with prognosis.
Establishment of the risk assessment
model
Using the genes obtained in the above analyses, a
system of patient risk assessment was established by regression
factor-weighted gene expression based on linear combination to
acquire the risk values for each patient. That is, each risk value
was a linear combination of the mRNA expression values obtained
following weighting with regression coefficients. The risk score
for each patient was calculated according to the following
equation: Risk score = βGENE1 × ExprGENE1 + β GENE2 × ExprGENE2 + ⋯
+ βGENEn × ExprGENEn, where β represents the coefficient for each
gene obtained from the training set and was used to validate the
risk of patients in the validation dataset. The difference in
prognosis between the high-risk and low-risk groups (with the risk
score median as the break point) was also assessed.
Correlation analysis between risk scores
and clinical features
The risk scores of samples in the training set and
validation set were calculated according to the aforementioned risk
assessment system. Likewise, the samples were divided into high and
low risk types with the threshold being the median risk score.
Additionally, corresponding clinical features of those samples that
were significantly associated with prognosis were analyzed using
Kaplan-Meier (KM) survival analysis. Consequently, their
correlation analysis was performed by Cox regression, which
combined the clinical data and the corresponding samples.
Stratification analysis of clinical
features significantly correlated with risk scores
According to the aforementioned available
information, stratification analysis was performed on the clinical
features significantly associated with high and low risk. The
detailed analytical procedure included: i) calculation of the
correlation between the expression values of each selected gene and
their high or low risk; ii) calculation of the correlation between
the high- and low-risk groups with their respective survival
prognosis with regard to the same risk condition; and iii)
calculation of the correlation between different clinical
conditions and survival prognosis with the same risk factor.
Functional analysis of important genes
associated with high and low risk
According to the scores calculated by the risk
assessment model, the samples were divided into a high risk and low
risk group. In the training set, the DEGs were screened using the
LIMMA package (15)
(FDR<0.05). Subsequently, the genes associated with positive or
negative risk were selected on the basis of the correlation
coefficient between their expression values and corresponding risk
values. Thereafter, their biological functions were analyzed by the
Database for Annotation, Visualization, and Integrated Discovery
(17) to screen the significantly
enriched biological processes and pathways in combination with
information from the Gene Ontology (GO; http://www.geneontology.org/) and the Kyoto
Encyclopedia of Genes and Genomes (KEGG; http://www.genome.jp/kegg/pathway.html) databases. The
cut‑off for the selection of significant categories was
P<0.05.
Results
Identification and validation of a six
gene prognostic signature
The genes in the training datasets were first
filtered according to their expression values, and those with an
average expression of <5 were removed. Subsequently, a total of
141 samples were screened out following the exclusion of those with
survival rates of <6 months. Among the 141 samples, further
grouping was performed to differentiate the samples with good or
poor prognosis. Finally, a total of 55 samples from deceased
patients with survival rates of <12 months were classified as
the poor prognosis group, and 27 patient samples from living
patients with survival rates of >24 months were classified as
the good prognosis group. The DEGs of the two groups were screened
and a total of 206 significant DEGs were screened out.
Subsequently, the prognostic values of the above 206
DEGs were assessed by univariate Cox regression analysis and a
total of 162 genes associated with prognosis were screened out.
Multivariate Cox regression analysis was then performed for these
162 genes associated with prognosis, and a total of 14 genes
significantly associated with prognosis were selected according to
the threshold of P<0.01. Finally, the model equations for risk
assessment were established based on six genes, specifically NACHT,
LRR, and PYD domains-containing protein 2 (NLRP2);
triggering receptor expressed on myeloid cells 2 (TREML2);
cysteine-glutamate transporter (SLC7A11); DNA
damage-inducible transcript 4 protein (DDIT4);
lymphocyte-specific protein 1 (LSP1); and C-type lectin
domain family 11 member A (CLEC11A) (Table II). The risk scores were
determined as follows: Risk score = 1.053 × ExprTREM L2 + 0.426 ×
ExprSLC7A11 + 0.222 × ExprNLRP2 + 0.548 × E xprDDIT4 + (−0.771) ×
ExprLSP1 + (−0.396) × ExprCLEC11A
| Table IIInformation of six genes based on
which the model equations for risk assessment were constructed. |
Table II
Information of six genes based on
which the model equations for risk assessment were constructed.
| Gene | Coef | HR | P-value |
|---|
| TREML2 | 1.053 | 0.349 | 1.76E-05 |
| SLC7A11 | 0.426 | 0.653 | 9.52E-05 |
| NLRP2 | 0.222 | 0.801 | 0.000442 |
| DDIT4 | 0.548 | 0.578 | 0.000609 |
| LSP1 | −0.771 | 2.162 | 0.000692 |
| CLEC11A | −0.396 | 1.486 | 0.000989 |
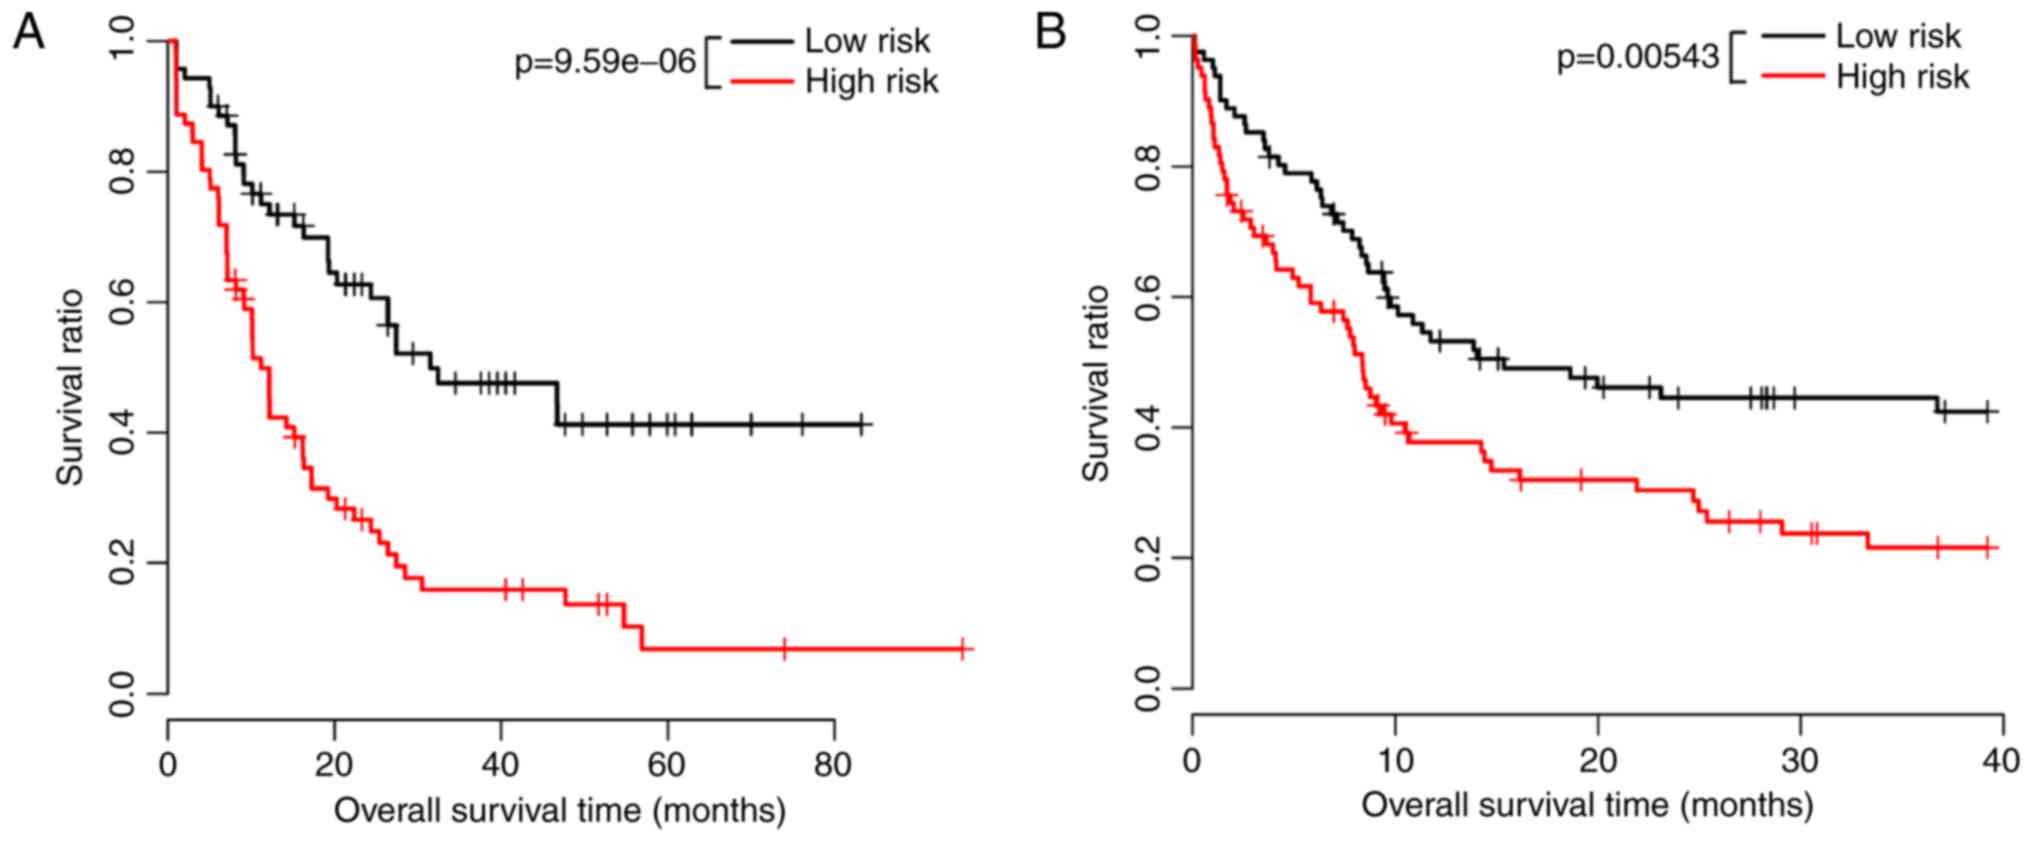
Validation of the model classification
effect
The model equation for risk assessment was used to
evaluate the risk of each patient, following which patients in the
TCGA training group were divided into high-risk patients and
low-risk patients according to the median risk score. Patients in
the low-risk group had longer survival rates, compared with those
in the high-risk group. In the training dataset, the mean survival
rate of 71 samples in the high-risk group was 14.06±14.81 months,
whereas that of the 70 samples in the low-risk group was 28.9
6±21.57 months (P=9.59e-06). In the validation dataset, the mean
survival rate of 81 samples in the high-risk group was 17.48±7.49
months, whereas that of 82 samples in the low-risk group was
28.24±12.89 months (P=0.00543). The significant association between
the expression of the above six genes and the survival information
was validated using KM survival curve analysis (Fig. 2A and B).
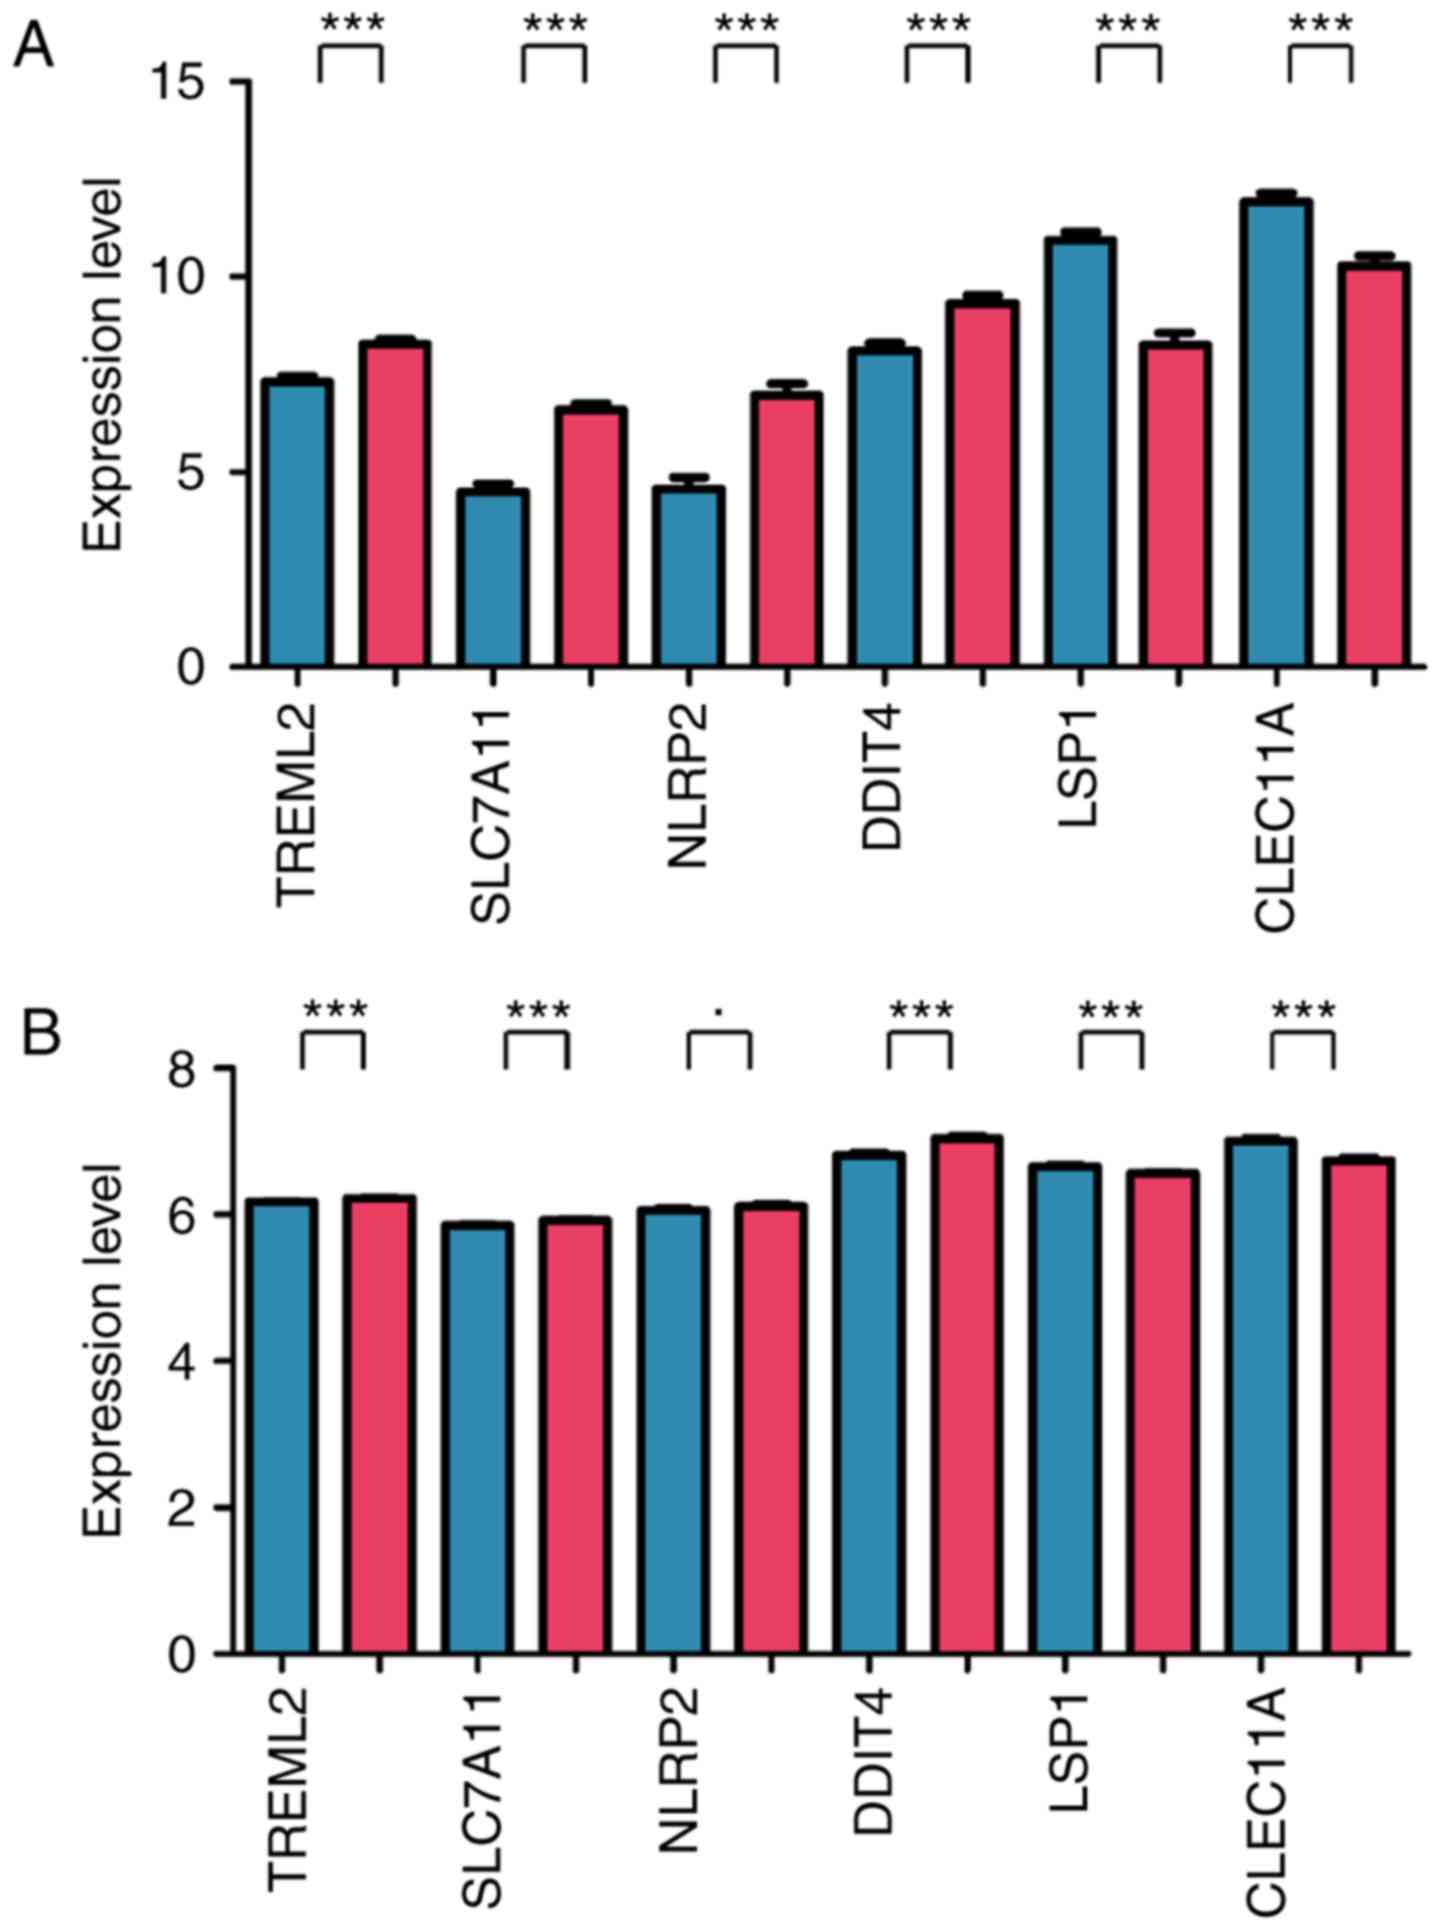
Expression profile of the six important
genes
In the training dataset, the expression values of
TREML2, SLC7A11, NLRP and DDIT in the
high‑risk group were significantly higher, compared with those in
the low-risk group (P<0.005), whereas the expression values of
LSP and CLEC11 in the high-risk group were
significantly lower, compared with those in the low-risk group
(P<0.005) (Fig. 3A). In the
validation dataset, the expression trends of five genes were
similar to those in the training dataset (P<0.005), with the
exception of NLRP2 (0.01≤P<0.05) (Fig. 3B).
Correlation analysis between risk score
and clinical features
The clinical features that were significantly
associated with prognosis were screened using univariate and
multivariate Cox regression analysis and the results showed that,
in addition to risk score, which was the independent prognostic
factor, age was another factor associated with clinical prognosis
(Table III).
| Table IIIResults of clinical prognosis by Cox
regression analysis. |
Table III
Results of clinical prognosis by Cox
regression analysis.
| Clinical
characteristic | Univariate Cox | Multivariate
Cox |
|---|
| Gender (male vs.
female) | 0.215 | – |
| FLT3 mutation
(positive vs. negative) | 0.051 | – |
| IDH1 R132 (positive
vs. negative) | 0.770 | – |
| IDH1 R140 (positive
vs. negative) | 0.985 | – |
| IDH1 R172 (positive
vs. negative) | 0.876 | – |
| Activating RAS
(positive vs. negative) | 0.892 | – |
| NPMc (positive vs.
negative) | 0.027 | 0.735 |
| Age (above vs.
below median of 58 years) | 0.000283 | 0.018 |
| Risk score | 2.12E-06 | 0.0000712 |
Correlation between individual signature
genes and risk score
The correlation between the six individual signature
genes (TREML2, SLC7A11, NLRP2, DDIT4,
LSP and CLEC11A) and risk score model equations were
analyzed using univariate Cox regression. As shown in Table IV, five genes, including
TREML2, SLC7A11, NLRP2, LSP and
CLEC11A, were associated with age (P<0.05) and
TREML was also associated with FMS-like tyrosine kinase 3
(FLT3) mutation and nucleophosmin mutation (NPMc) (P<0.05).
| Table IVCorrelation between six individual
signature genes and risk score. |
Table IV
Correlation between six individual
signature genes and risk score.
| Clinical
characteristic | TREML2 | SLC7A11 | NLRP2 | DDIT4 | LSP1 | CLEC11A |
|---|
| Age (>58, vs.
<58 years) | 0.039 | 0.031 | 0.001 | 0.113 | 0.001 | 0.029 |
| Gender (male, vs.
female) | 0.487 | 0.378 | 0.149 | 0.914 | 0.294 | 0.835 |
| FLT3 mutation
(positive, vs. negative) | 0.012 | 0.494 | 0.095 | 0.274 | 0.250 | 0.130 |
| IDH1 R132
(positive, vs. negative) | 0.424 | 0.376 | 0.661 | 0.270 | 0.809 | 0.304 |
| IDH1 R140
(positive, vs. negative) | 0.896 | 0.319 | 0.647 | 0.701 | 0.380 | 0.625 |
| IDH1 R172
(positive, vs. negative) | 0.852 | 0.452 | 0.878 | 0.827 | 0.503 | 0.964 |
| Activating RAS
(positive, vs. negative) | 0.558 | 0.166 | 0.860 | 0.969 | 0.152 | 0.766 |
| NPMc (positive, vs.
negative) | 0.049 | 0.329 | 0.336 | 0.987 | 0.807 | 0.898 |
Stratification analysis of clinical
features significantly correlated with risk scores
The correlations between clinical features and
prognosis were analyzed. The results showed that age, FLT3
mutation, isocitrate dehydrogenase (NADP+) 1, cytosolic
R132, and NPMc were significantly associated with prognosis
(Table V). The KM survival curves
of the above four factors in the low-risk and high-risk groups are
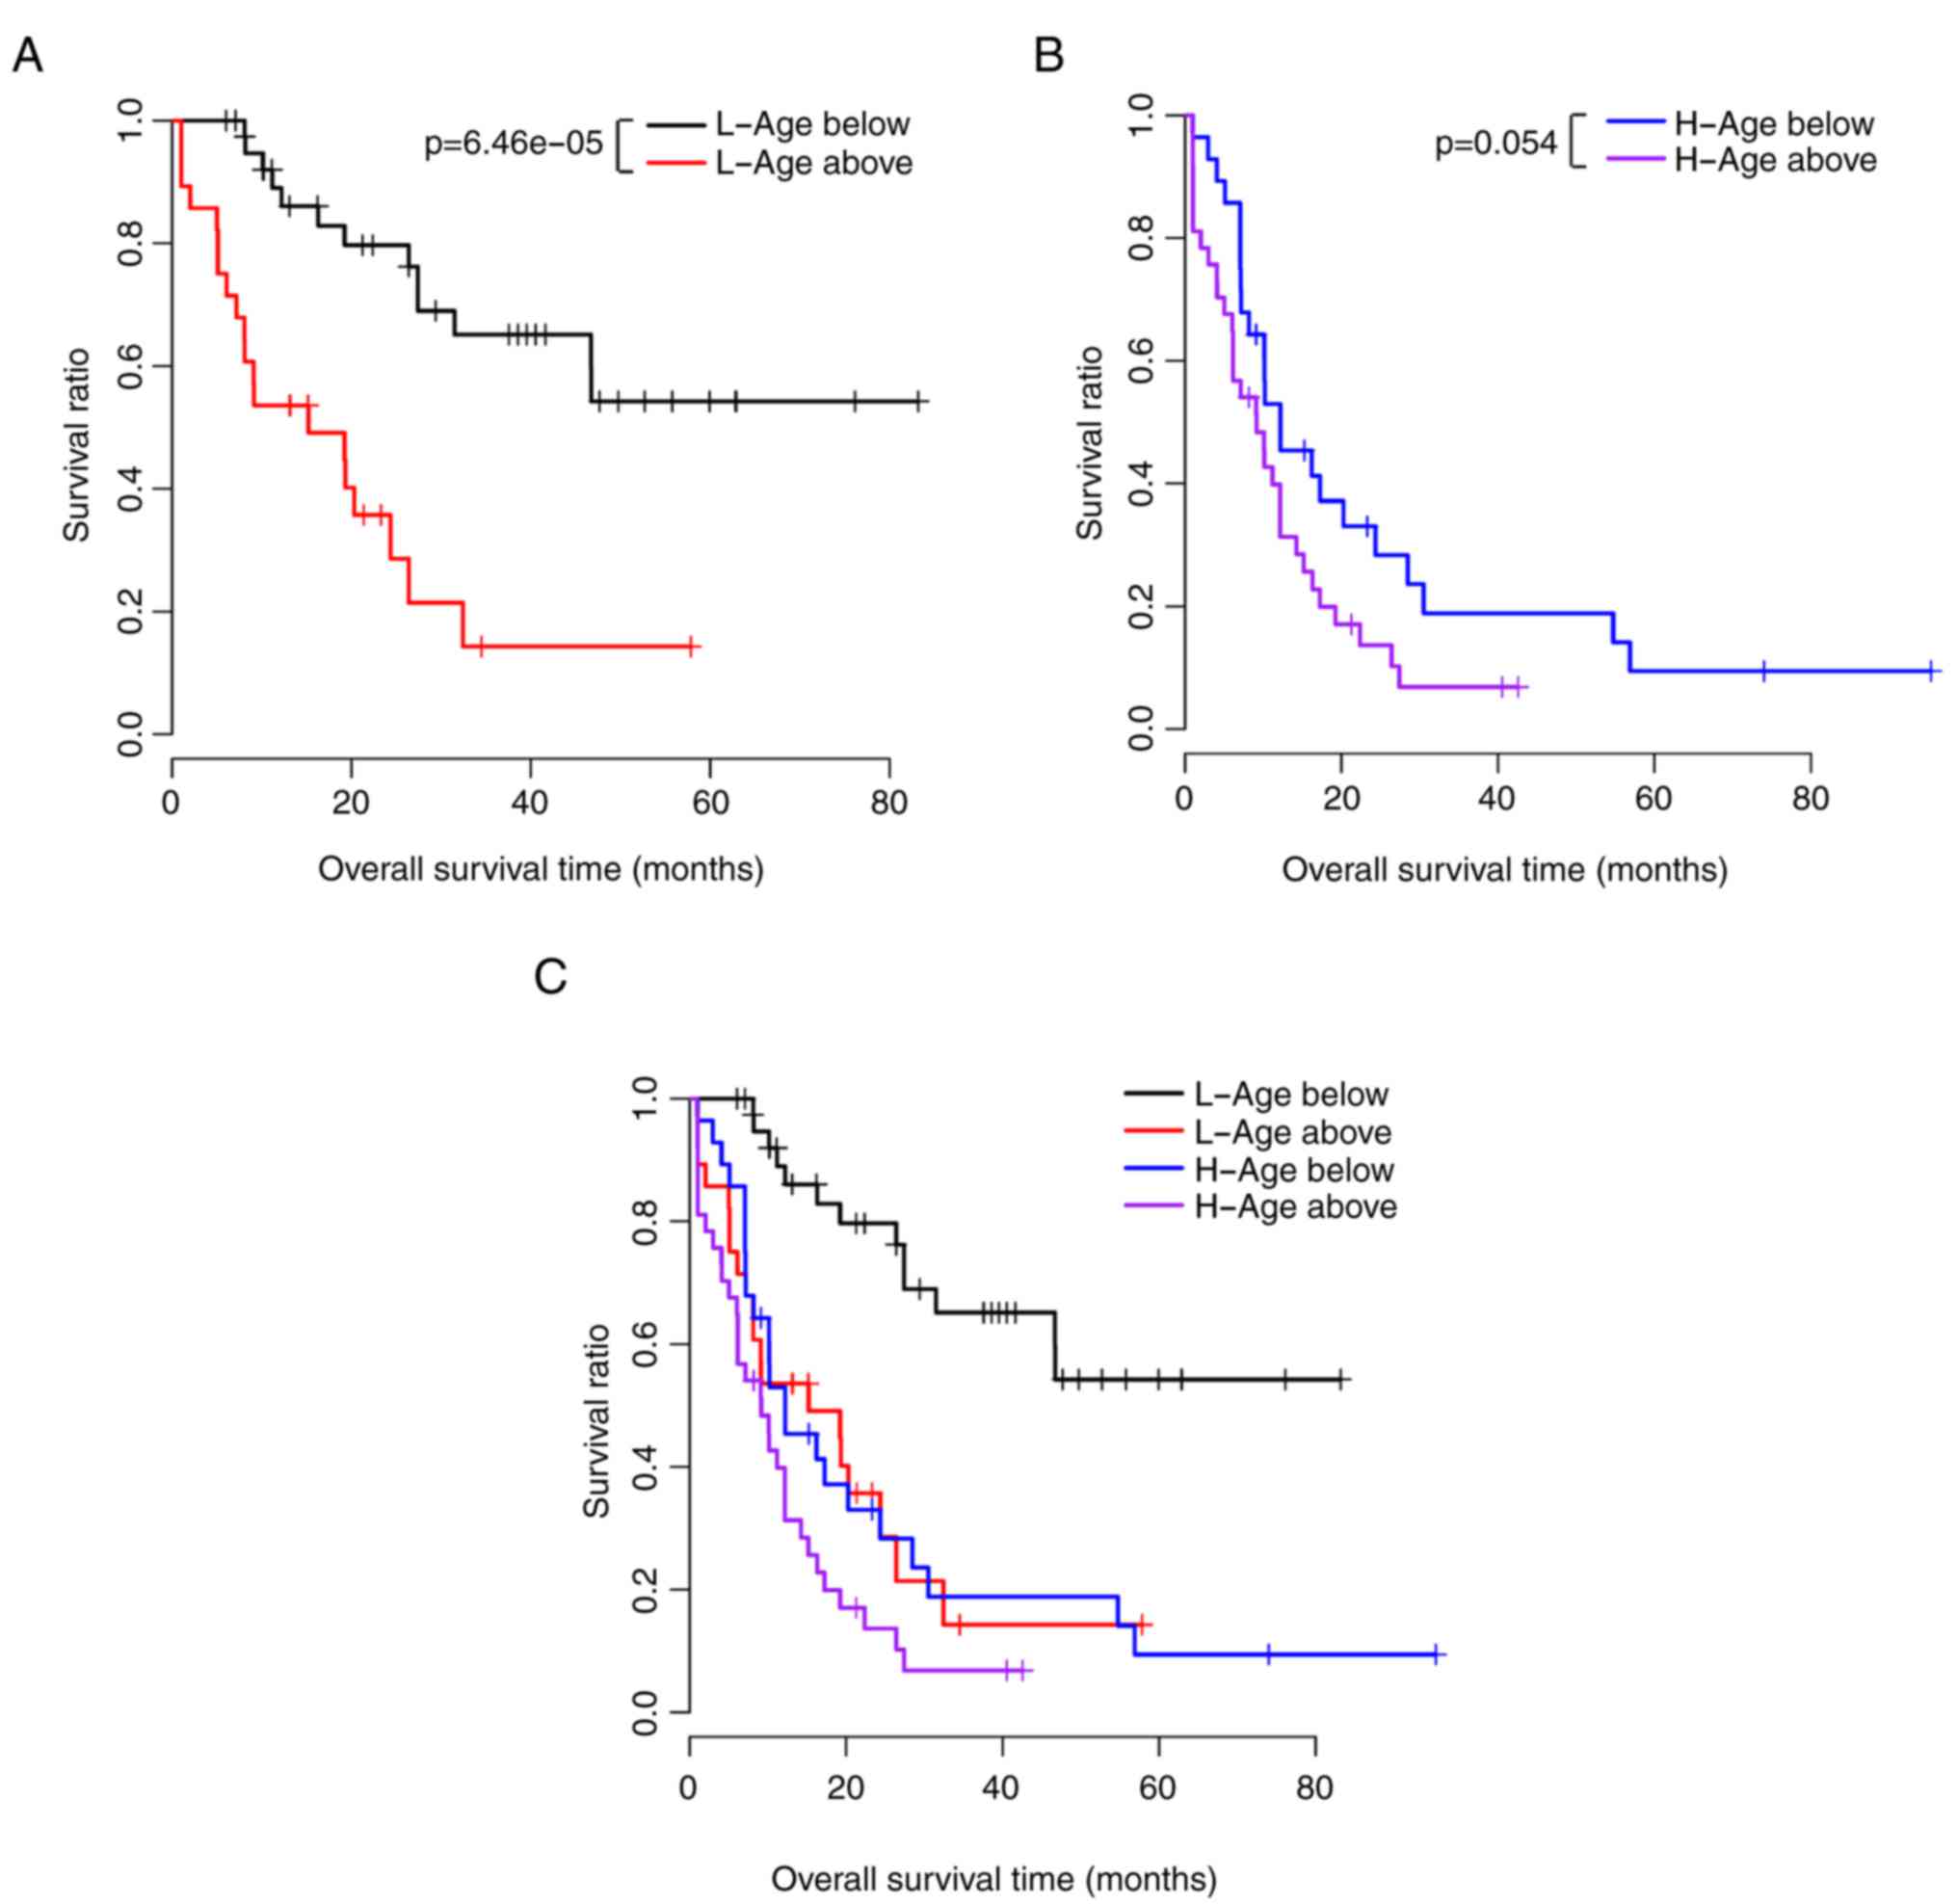
shown in Fig. 4A–D.
| Table VCorrelation between risk score and
prognosis in the same clinical setting. |
Table V
Correlation between risk score and
prognosis in the same clinical setting.
| Clinical
characteristic | P-value |
|---|
| Age (>58 years,
N=70) | 0.081 |
| Age (<58 years,
N=71) | 6.30E-05 |
| Gender (male,
N=75) | 0.249 |
| Gender (female,
N=66) | 0.102 |
| FLT3 mutation
(positive, N=37) | 0.020 |
| FLT3 mutation
(negative, N=97) | 8.75E-05 |
| IDH1 R132
(positive, N=12) | 0.117 |
| IDH1 R132
(negative, N=126) | 1.21E-05 |
| IDH1 R140
(positive, N=12) | 0.741 |
| IDH1 R140
(negative, N=125) | 0.251 |
| IDH1 R172
(positive, N=2) | – |
| IDH1 R172
(negative, N=135) | 0.349 |
| Activating RAS
(positive, N=8) | 0.059 |
| Activating RAS
(negative, N=130) | 2.44E-01 |
| NPMc (positive,
N=36) | 0.015 |
| NPMc (negative,
N=102) | 6.97E-05 |
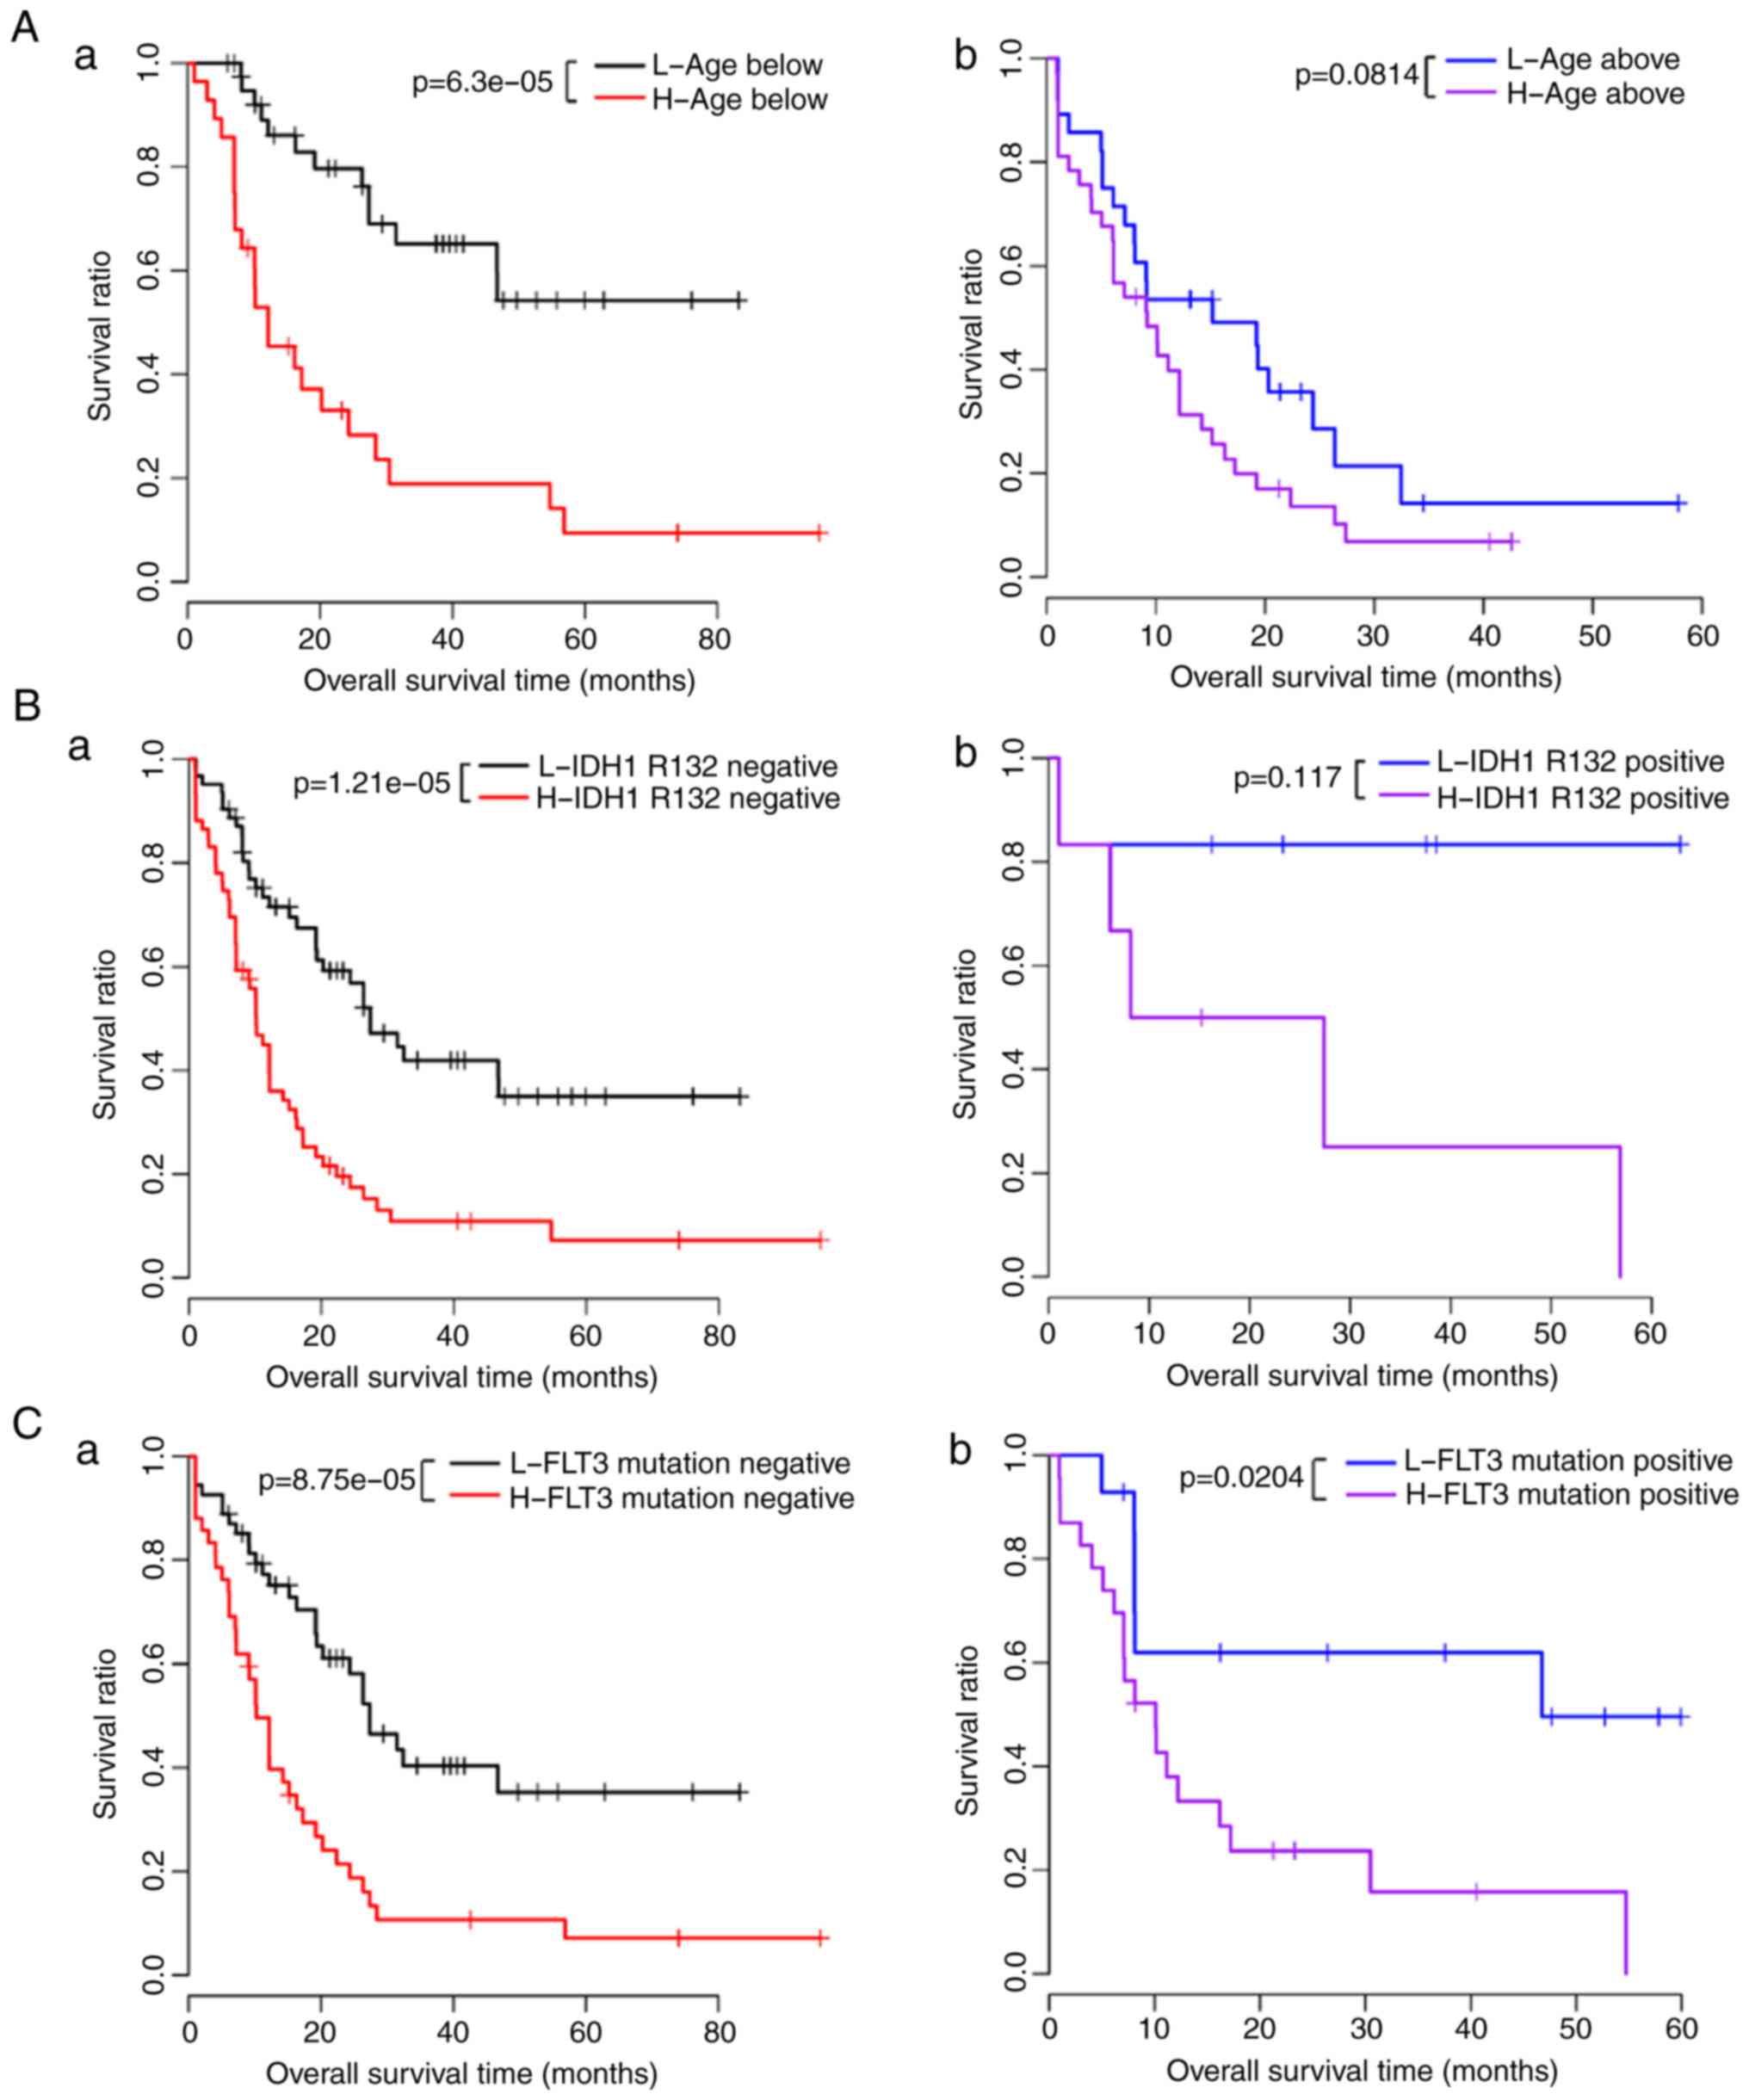
The correlations between different clinical
conditions and survival prognosis under the same risk condition
were analyzed, and the results showed that age was significantly
associated with prognosis under the same risk conditions (Table VI). The KM survival curves of age
and prognosis in the low-risk and high-risk groups are shown in
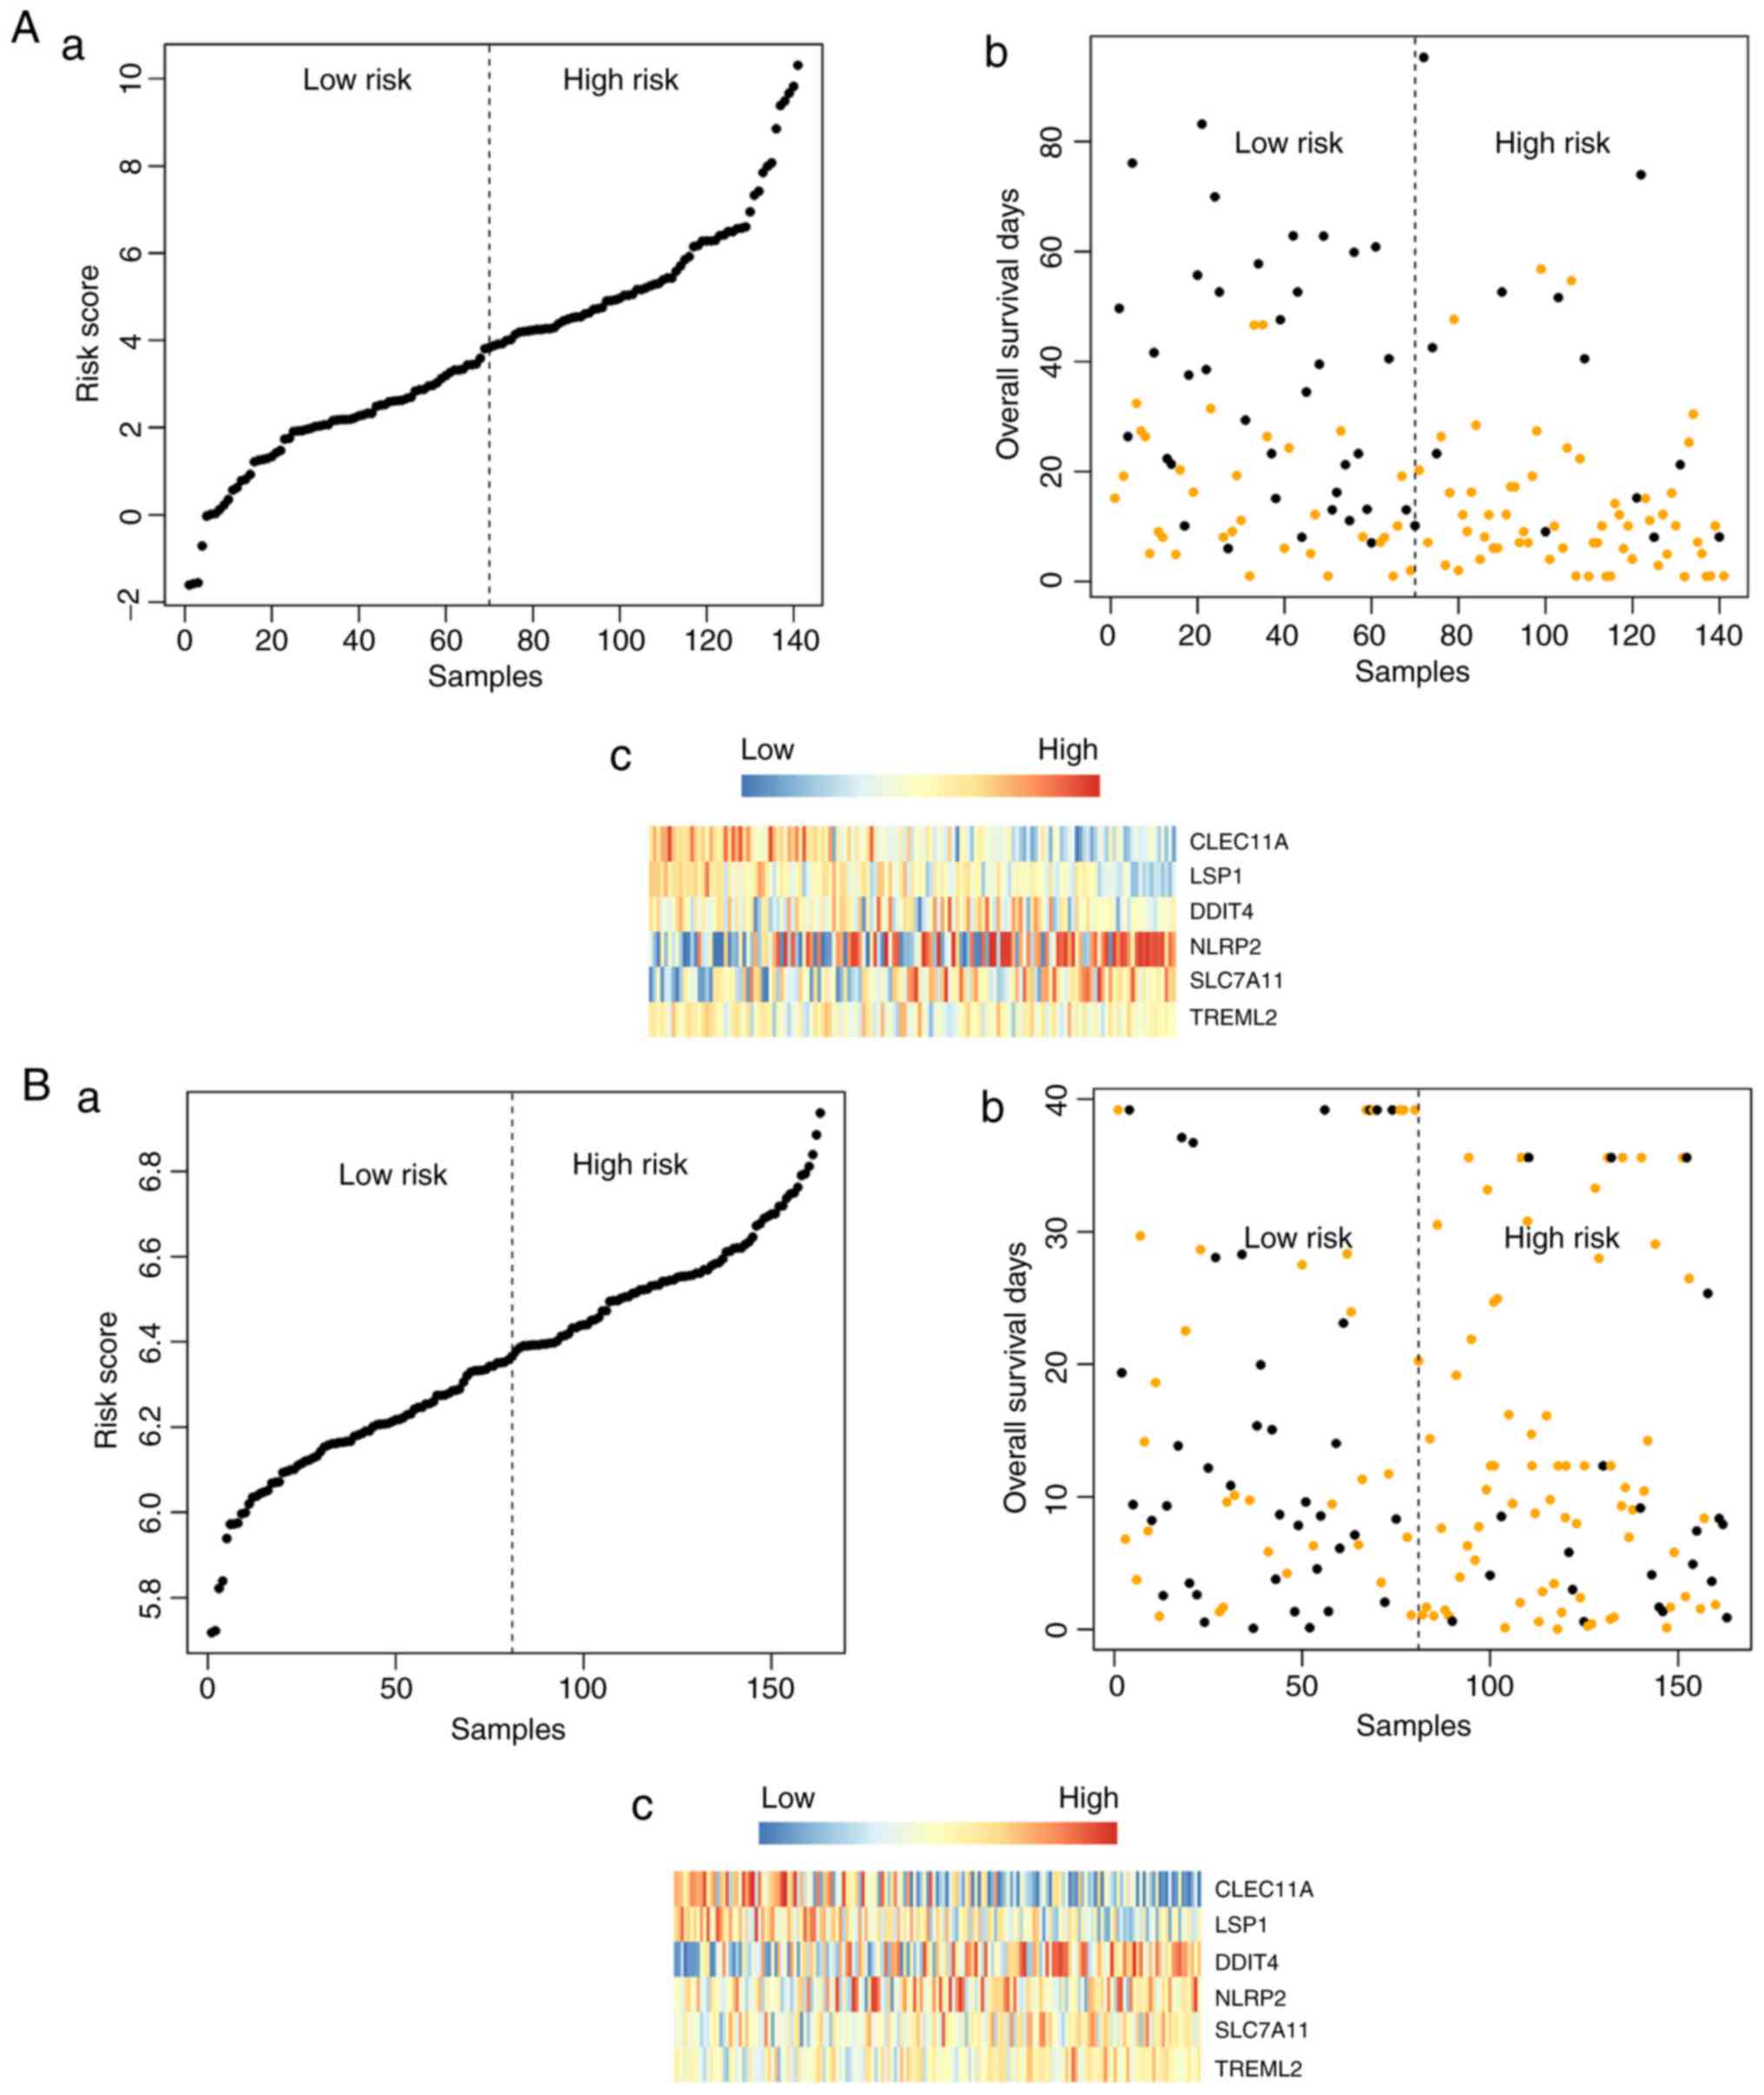
Fig. 5A–C. The risk score,
overall survival, and the expression values of the six signature
genes in the training dataset (Fig.
6Aa-c) and validation dataset (Fig. 6Ba-c) are shown in Fig. 6.
| Table VICorrelation between clinical features
and prognosis under the same risk factors. |
Table VI
Correlation between clinical features
and prognosis under the same risk factors.
| Clinical
characteristic | High risk | Low risk |
|---|
| Age (above vs.
below median of 58 years) | 0.054 | 6.46E-05 |
| Gender (male vs.
female) | 0.310 | 0.131 |
| FLT3 mutation
(positive vs. negative) | 0.818 | 0.574 |
| IDH1 R132 (positive
vs. negative) | 0.539 | 0.206 |
| IDH1 R140 (positive
vs. negative) | 0.674 | 0.067 |
| IDH1 R172 (positive
vs. negative) | 0.553 | 0.570 |
| Activating RAS
(positive vs. negative) | 0.228 | 0.327 |
| NPMc (positive vs.
negative) | 0.753 | 0.517 |
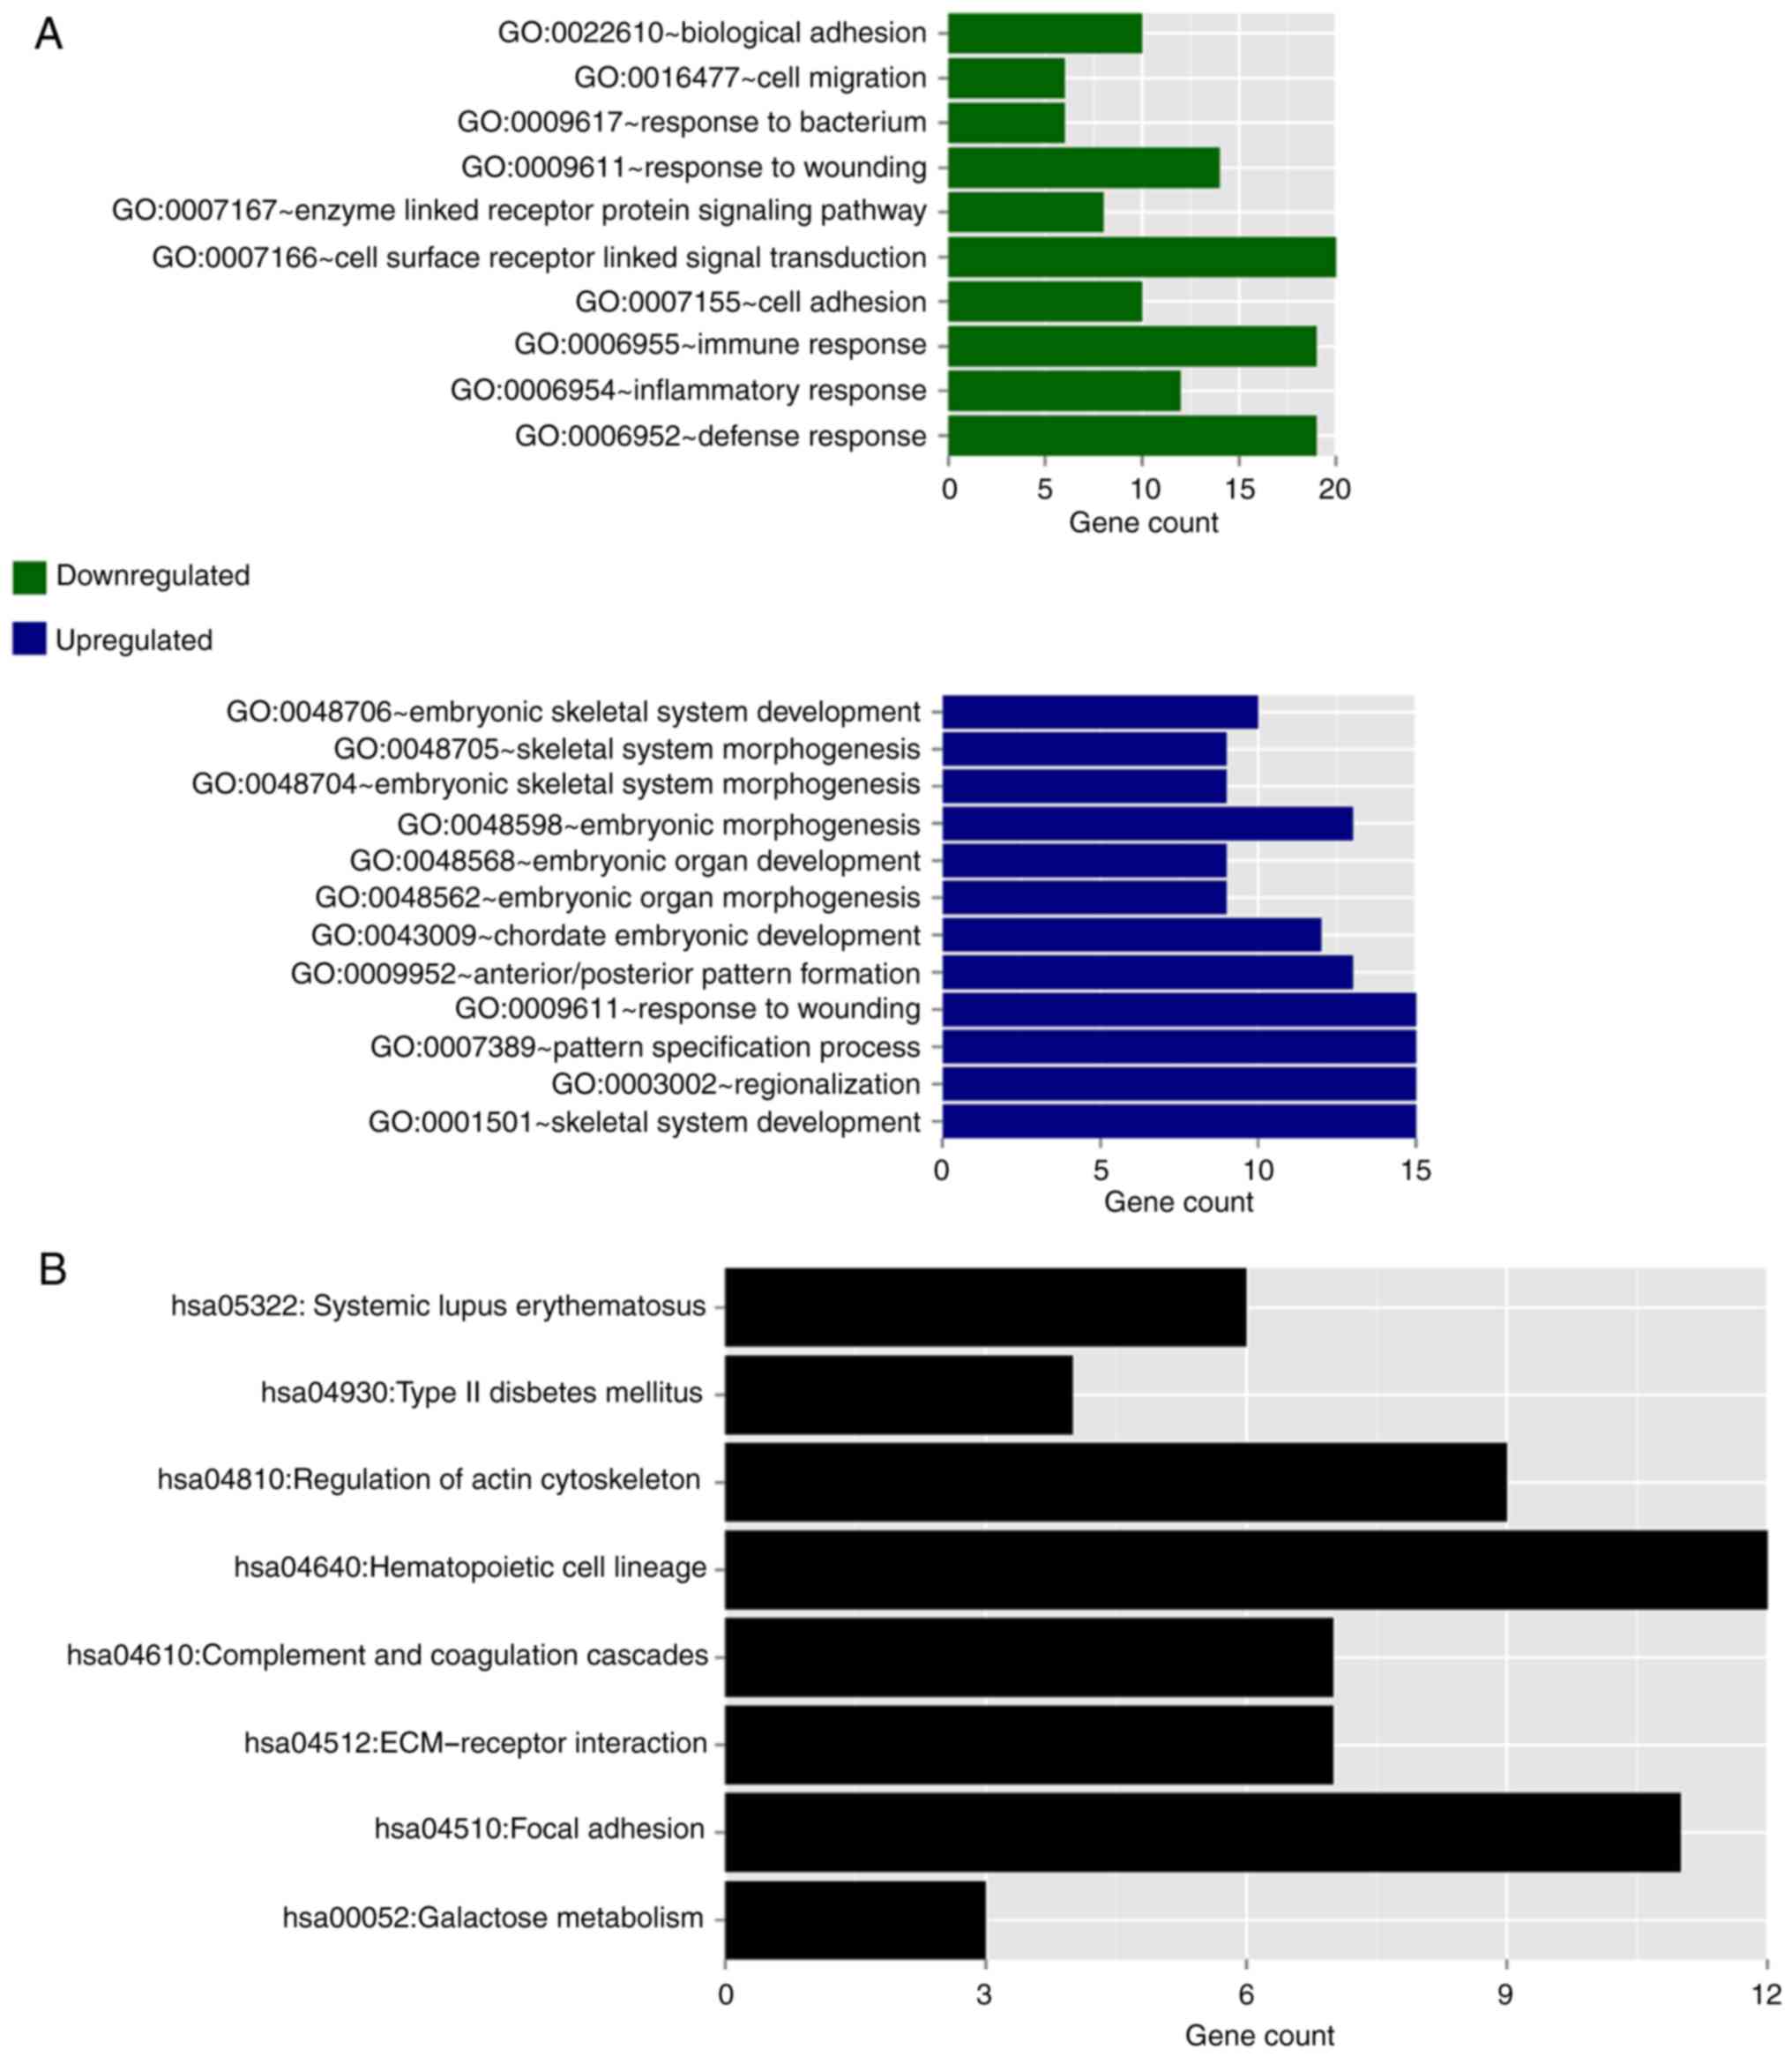
Functional enrichment analysis of genes
associated with different prognoses
The DEGs of the high-risk group and low-risk group
in the training dataset were screened using LIMMA (15). A total of 309 DEGs were obtained
with the criterion of FDR<0.05.
Following correlation analysis between the DEGs and
risk value, 111 and 198 DEGs were obtained with expression levels
associated with negative or positive risk, respectively. GO
function and KEGG pathway enrichment analysis of these DEGs were
performed and the results are shown in Fig. 7. The downregulated genes were
significantly enriched into 10 GO terms, predominantly associated
with cell defense and immune response, whereas the upregu-lated
genes were significantly enriched into 12 GO terms, predominantly
associated with morphogenesis and development (Fig. 7A). With regard to the KEGG
pathways, as no significant pathways were enriched for the
upregulated and downregulated genes, respectively, all these genes
were combined to show the KEGG pathway enrichment results. These
genes were predominantly enriched in eight KEGG pathways: Systemic
lupus erythematosus, type 2 diabetes mellitus, regulation of actin
cytoskeleton, hematopoietic cell lineage, complement and
coagulation cascades, extracellular matrix receptor interaction,
focal adhesion, and galactose metabolism (Fig. 7B).
Discussion
Previous studies have identified several prognostic
indicators for AML, including age and cytogenetic findings
(6). With the development of
molecular biology, genetics, and blood cell disease detection
technology, increasing factors associated with AML pathogenesis and
prognosis have been found, including cell karyotype, and gene
mutation and expression (10). In
the present study, the large quantities of mRNA-seq data on
patients with AML published in TCGA database were used to screen
out the significant DEGs associated with AML. As a large-scale
cancer genomics project, TCGA database contains substantial cancer
genomics data from multiple technical platforms (18). The data are important to cancer
research and several studies have demonstrated the value of
analyzing networks based on TCGA database (19,20). The present study was performed
using 141 patients with AML in the training dataset and 163
patients with AML in the validation dataset. The two datasets
provided survival information. According to the survival rates, of
the 141 patients with AML in the training dataset, 55 poor
prognosis samples were distinguished from 27 good prognosis
samples. The aberrant expression of certain specific genes
associated with hematopoiesis, bone marrow differentiation, and
immune stress can significantly affect the chemotherapeutic effects
on and the prognosis of AML, and can become preferred potential
candidate genes for investigations, providing assistance in
revealing the pathogenesis of AML. In the present study, a total of
206 significantly DEGs were screened out between the poor prognosis
group and the good prognosis group. Following univariate Cox
regression analysis and multivariate Cox regression analysis, a
total of 14 genes significantly associated with prognosis were
screened. Finally, six genes (TREML2, SLC7A11,
NLRP2, DDIT4, LSP and CLEC11A) were
used to establish the model equations for risk assessment. As
previous prognostic scoring systems have mainly been based on age,
cytogenetic findings and white blood cell count, the establishment
of the present prognostic scoring system based on the expression
level of AML-related genes has important theoretical and clinical
significance, and offers potential for practical application in
preclinical and clinical trials.
The six candidate signature genes were divided into
two groups according to their expression profiles. The first group
included four upregulated genes, which were TREML2,
SLC7A11, NLRP and DDIT4. TREM proteins are a
family of cell surface receptors, which are involved in diverse
cell processes, including inflammation, bone homeostasis,
neurological development and coagulation (21). Reportedly, TREML is a
potential susceptible gene of osteoporosis. In addition, missense
mutation of TREML has a protective effect in the development
of Alzheimer's disease (22,23). Based on the present study, it may
be associated with the progression of AML.
SLC7A1 is a member of a heterodimeric
Na+-independent anionic amino acid transport system,
which mediates cysteine-glutamate exchange and thereby regulates
intracellular glutathione levels (24,25). In addition, SLC7A1 controls
the production of pheomelanin pigment and the proliferation of
cultured cells (26), and
protects cancer cells of the NCI-60 panel from chemoresistance to
numerous compounds (24). The
impairment of SLC7A1 can result in the disruption of
glutamate homeostasis and lead to a variety of central nervous
system disorders, including drug addiction, schizophrenia and
neurodegenerative conditions (27). Studies have indicated that the
expression of SLC7A1 is markedly increased in breast cancer
cell lines and clinical samples (28), and can serve as a predictor of
cellular response to L-alanosine- and glutathione-mediated
resistance to geldanamycin (24).
In gastric cancer, the long non-coding RNA SLC7A11-AS1 can promote
tumor growth, and its decreased expression is linked with poor
prognosis (29). According to the
results of the present study, SLC7A1 may be important in the
pathogenesis of AML, yielding a potential target for AML
treatment.
NALP genes are characterized by the N-terminal pyrin
domain (PYD), and are involved in the activation of caspase-1 by
Toll-like receptors and in protein complexes that activate
proinflammatory caspases (30).
As the most well known member of the NALP gene family, NLRP
has been shown to form the core of the inflammasome and respond to
numerous pathogen-, danger-, and disease-associated molecular
patterns (31–33). Similarly, NALP2 is crucial in
inflammation through the regulation of nuclear factor-κB activity,
and the PYD of NALP2 can inhibit cell proliferation and tumor
growth in human glioblastoma (34). Additionally, NALP has been
identified as a predictive biomarker for pregnancy following in
vitr fertilization (35).
However, there is no direct evidence to date that NALPs are
associated with AML.
DDIT4, also known as regulated in development
and DNA damage response 1 (REDD1), usually acts as a negative
regulator of mechanistic target of rapamycin (mTOR), which
regulates a variety of cellular functions including growth,
proliferation and autophagy (36,37). Due to its effect on mTOR, which
has been associated with aging and linked with diseases including
tuberous sclerosis, diabetes and cancer (38), DDIT has attracted
increasing interest in clinical studies. The high expression of
DDIT has been considered as a prognostic marker in certain
malignancies, including AML, breast cancer, and colon, skin and
lung cancer (39). This finding
supports the reliability of the results of the present study.
The second group included two downregulated genes,
LSP and CLEC11A, which are associated with cellular
immunity, hematopoiesis and the cytoskeleton. LSP was
originally reported as a lymphocyte‑specific actin‑binding protein
in murine lymphocytes (40) and
was subsequently found in all hematopoietic cells (41). LSP has been reported to
regulate cell biology in several types of human cancer, including
lymphomas (42), pancreatic
cancer (43), breast cancer
(44), dermatofibroma (45) and hepatocellular carcinoma (HCC)
(46). However, the functions of
LSP in AML remain to be elucidated. It has been reported
that LSP is downregulated in breast cancer and in patients
with HCC, and is considered a risk factor for these two types of
cancer (44,46,47). On the basis of previous findings,
the downregulation of LSP in the poor prognosis group in the
present study indicated that LSP may serve as a prognostic
marker and a potential therapeutic target in AML.
CLEC11A, a secreted sulfated glycoprotein
expressed in the bone marrow and skeletal tissues, can promote
colony formation by human hematopoietic progenitors in culture and
assist in maintenance of the adult skeleton (48–51). Previously, CLEC11 was
identified as a biomarker for predicting colorectal cancer
(52). A previous study confirmed
the central role of CLEC11 as a potential regulator of
multiple myeloma SET protein in multiple myeloma cell survival and
regulation (53). In addition,
the plasma level of CLEC11 has been associated with
hemoglobin levels and was found to be increased in patients
following bone marrow transplantation (54,55). Therefore, it has been considered
as a hematopoietic growth factor and novel drug target for myeloma.
However, the physiological function of CLEC11 in AML has not
been reported.
As SLC7A11, NLRP2, DDIT and
LSP have previously been reported to be associated with
cancer, it was hypothesized that the six candidate signature genes
identified in the present study may be novel factors associated
with AML. A correlation analysis between the risk assessment model
and clinical features was performed and the results showed that
both the risk score and age were prognostic factors, and that age
was significantly associated with prognosis under the same risk
conditions. The reliability of the model equations for risk
assessment was further validated in an independent validation
dataset. These investigations aimed to provide an effective tool
for the clinical diagnosis of AML, which may assist in elucidating
the possible pathogenesis of AML.
Functional annotations of the significant DEGs
according to the GO and KEGG databases can provide numerous
candidate genes and more information on the pathogenesis of AML. In
the present study, GO function analysis of DEGs was performed. The
GO terms of the significantly downregulated genes were mainly
associated with cell defense and immune response, whereas the GO
terms of the significantly upregulated genes were mainly associated
with morphogenesis and development, indicating that the immune
defense system of the organism was suppressed, with the abnormal
amplification of cancer cells predominant. This finding was
consistent with the characterization of AML (1). Subsequently, KEGG pathway analysis
was performed on the 20 significant characteristic factors, and the
results showed that these genes were mainly involved in eight KEGG
pathways. The top three significant KEGG pathways were
hematopoietic cell lineage, focal adhesion, and regulation of actin
cytoskeleton, which are all associated with the abnormal
amplification of hemocytes. For example, the 'hematopoietic cell
lineage' pathway is important in the processes of hematopoiesis and
immune response (56), whereas
the 'focal adhesion' pathway is associated with another blood
disease, macrothrombocytopenia (57). The results of the present study
may provide clues for further clarifying the pathogenesis of AML.
However, there were several limitations in the present study. For
example, the predictive capability of the model has not been
confirmed by direct experiments. In addition, the expression of the
six important genes (TREML2, SLC7A11, NALP.,
DDIT4, LSP and CLEC11A) and their functions in
AML require further validation in experiments in vitr and
in vivo. Additionally, the survival rates of different
individuals in the two datasets were different, which may influence
the accuracy of the analysis. Therefore, further analyses are
required to elucidate the mechanisms underlying the processes of
tumorigenesis and the development of AML.
In conclusion, the present study provided a credible
risk assessment model for AML prognosis based on a comprehensive
bioinformatics analysis of six candidate genes using data from two
independent datasets. All six genes were significantly associated
with the diagnosis of AML and may be potential prognostic
biomarkers.
Acknowledgments
The authors would like to thank those providing
linguistic assistance during the preparation of this
manuscript.
Funding
No funding was received.
Availability of data and materials
The datasets used and/or analysed during the current
study are available from the corresponding author on reasonable
request.
Authors' contributions
HW conceived and designed the study. XZ performed
data analyses and wrote the manuscript. YL performed data analyses
and revised the manuscript. All authors read and approved the final
manuscript.
Ethics approval and consent to
participate
In the original article of the GSE12417 dataset, the
trials were approved by the local institutional review boards of
all participating centers, and informed consent was obtained from
all patients in accordance with the Declaration of Helsinki.
Patient consent for publication
Not applicable.
Competing interests
The authors declare that they have no competing
interests.
References
|
1
|
Löwenberg B, Downing JR and Burnett A:
Acute myeloid leukemia. N Engl J Med. 1999:1051–1062. 1999.
View Article : Google Scholar
|
|
2
|
Siegel R, Naishadham D and Jemal A: Cancer
statistics, 2013. CA Cancer J Clin. 63:11–30. 2013. View Article : Google Scholar : PubMed/NCBI
|
|
3
|
Siegel RL, Miller KD and Jemal A: Cancer
statistics, 2016. CA Cancer J Clin. 66:7–30. 2016. View Article : Google Scholar : PubMed/NCBI
|
|
4
|
Coombs C, Tavakkoli M and Tallman M: Acute
promyelocytic leukemia: Where did we start, where are we now, and
the future. Blood Cancer J. 5:e3042015. View Article : Google Scholar : PubMed/NCBI
|
|
5
|
Tallman MS, Gilliland DG and Rowe JM: Drug
therapy for acute myeloid leukemia. Blood. 106:1154–1163. 2005.
View Article : Google Scholar : PubMed/NCBI
|
|
6
|
Löwenberg B: Prognostic factors in acute
myeloid leukaemia. Best Pract Res Clin Haematol. 14:65–75. 2001.
View Article : Google Scholar : PubMed/NCBI
|
|
7
|
Bloomfield CD, Lawrence D, Byrd JC,
Carroll A, Pettenati MJ, Tantravahi R, Patil SR, Davey FR, Berg DT,
Schiffer CA, et al: Frequency of prolonged remission duration after
high-dose cytarabine intensification in acute myeloid leukemia
varies by cytogenetic subtype. Cancer Res. 58:4173–4179.
1998.PubMed/NCBI
|
|
8
|
Grimwade D, Walker H, Oliver F, Wheatley
K, Harrison C, Harrison G, Rees J, Hann I, Stevens R, Burnett A, et
al: The importance of diagnostic cytogenetics on outcome in AML:
Analysis of 1,612 patients entered into the MRC AML 10 trial The
medical research council adult and children's Leukaemia working
parties. Blood. 92:2322–2333. 1998.PubMed/NCBI
|
|
9
|
Yan W, Xu L, Sun Z, Lin Y, Zhang W, Chen
J, Hu S and Shen B: MicroRNA biomarker identification for pediatric
acute myeloid leukemia based on a novel bioinformatics model.
Oncotarget. 6:26424–26436. 2015. View Article : Google Scholar : PubMed/NCBI
|
|
10
|
Metzeler KH, Dufour A, Benthaus T, Hummel
M, Sauerland MC, Heinecke A, Berdel WE, Büchner T, Wörmann B,
Mansmann U, et al: ER expression is an independent prognostic
factor and allows refined risk stratification in cytogenetically
normal acute myeloid leukemia: A comprehensive analysis of ERG,
MN1, and BAALC transcript levels using oligonucleotide microarrays.
J Clin Oncol. 27:5031–5038. 2009. View Article : Google Scholar : PubMed/NCBI
|
|
11
|
Aref S, Al Khodary T, Zeed TA, El Sadiek
A, El Menshawy N and Al Ashery R: The prognostic relevance of BAALC
and ERG expression levels in cytogenetically normal pediatric acute
myeloid leukemia. Indian J Hematol Blood Transfus. 31:21–28. 2015.
View Article : Google Scholar
|
|
12
|
Guo X, Shi P, Chen F, Zha J, Liu B, Li R,
Dong H, Zheng H and Xu B: Low MDR1 and BAALC expression identifies
a new subgroup of intermediate cytogenetic risk acute myeloid
leukemia with a favorable outcome. Blood Cells Mol Dis. 53:144–148.
2014. View Article : Google Scholar : PubMed/NCBI
|
|
13
|
Xiang L, Li M, Liu Y, Cen J, Chen Z, Zhen
X, Xie X, Cao X and Gu W: The clinical characteristics and
prognostic significance of MN gene and MN1-associated microRNA
expression in adult patients with de novo acute myeloid leukemia.
Ann Hematol. 92:1063–1069. 2013. View Article : Google Scholar : PubMed/NCBI
|
|
14
|
Metzeler KH, Hummel M, Bloomfield CD,
Spiekermann K, Braess J, Sauerland MC, Heinecke A, Radmacher M,
Marcucci G, Whitman SP, et al: An 86-probe-set gene-expression
signature predicts survival in cytogenetically normal acute myeloid
leukemia. Blood. 112:4193–4201. 2008. View Article : Google Scholar : PubMed/NCBI
|
|
15
|
Ritchie ME, Phipson B, Wu D, Hu Y, Law CW,
Shi W and Smyth GK: Limma powers differential expression analyses
for RNA-sequencing and microarray studies. Nucleic Acids Res.
43:e472015. View Article : Google Scholar : PubMed/NCBI
|
|
16
|
Wang P, Wang Y, Hang B, Zou X and Mao JH:
A novel gene expression-based prognostic scoring system to predict
survival in gastric cancer. Oncotarget. 7:55343–55351.
2016.PubMed/NCBI
|
|
17
|
Huang da W, Sherman BT and Lempicki RA:
Systematic and integrative analysis of large gene lists using DAVID
bioinformatics resources. Nat Protoc. 4:44–57. 2009. View Article : Google Scholar : PubMed/NCBI
|
|
18
|
Hudson TJ, Anderson W, Aretz A, Anderson
W, Artez A, Barker AD, Bell C, Bernabé RR, Bhan MK, Calvo F, et al:
International network of cancer genome projects. Nature.
464:993–998. 2010. View Article : Google Scholar : PubMed/NCBI
|
|
19
|
Yang Y, Han L, Yuan Y, Li J, Hei N and
Liang H: Gene co-expression network analysis reveals common
system-level properties of prognostic genes across cancer types.
Nat Commun. 5:32312014. View Article : Google Scholar : PubMed/NCBI
|
|
20
|
Ying H, Lv J, Ying T, Jin S, Shao J, Wang
L, Xu H, Yuan B and Yang Q: Gene-gene interaction network analysis
of ovarian cancer using TCGA data. J Ovarian Res. 6:882013.
View Article : Google Scholar : PubMed/NCBI
|
|
21
|
Klesney-Tait J, Turnbull IR and Colonna M:
The TREM receptor family and signal integration. Nat Immunol.
7:1266–1273. 2006. View
Article : Google Scholar : PubMed/NCBI
|
|
22
|
Lin D, Zhang J, Li J, He H, Deng HW and
Wang YP: Integrative analysis of multiple diverse omics datasets by
sparse group multitask regression. Front Cell Dev Biol. 2:622014.
View Article : Google Scholar : PubMed/NCBI
|
|
23
|
Benitez BA, Jin SC, Guerreiro R, Graham R,
Lord J, Harold D, Sims R, Lambert JC, Gibbs JR, Bras J, et al:
Missense variant in TREML protects against Alzheimer's disease.
Neurobiol Aging. 35:e19-e262014. View Article : Google Scholar
|
|
24
|
Huang Y, Dai Z, Barbacioru C and Sadée W:
Cystine-glutamate transporter SLC7A11 in cancer chemosensitivity
and chemoresistance. Cancer Res. 65:7446–7454. 2005. View Article : Google Scholar : PubMed/NCBI
|
|
25
|
Lutgen V, Resch J, Qualmann K, Raddatz NJ,
Panhans C, Olander EM, Kong L, Choi S, Mantsch JR and Baker DA:
Behavioral assessment of acute inhibition of system
xc− in rats. Psychopharmacology.
231:4637–4647. 2014. View Article : Google Scholar
|
|
26
|
Chintala S, Li W, Lamoreux ML, Ito S,
Wakamatsu K, Sviderskaya EV, Bennett DC, Park YM, Gahl WA, Huizing
M, et al: Slc7a1 gene controls production of pheomelanin pigment
and proliferation of cultured cells. Proc Natl Acad Sci USA.
102:10964–10969. 2005. View Article : Google Scholar
|
|
27
|
Bridges R, Lutgen V, Lobner D and Baker
DA: Thinking outside the cleft to understand synaptic activity:
Contribution of the cystine-glutamate antiporter (system
xc−) to normal and pathological glutamatergic
signaling. Pharmacol Rev. 64:780–802. 2012. View Article : Google Scholar : PubMed/NCBI
|
|
28
|
Liu X, Li X, Zhang B, Liang YJ, Zhou CX,
Cao DX, He M, Chen GQ, He JR and Zhao Q: MicroRNA-26b is
underexpressed in human breast cancer and induces cell apoptosis by
targeting SLC7A11. FEBS Lett. 585:1363–1367. 2011. View Article : Google Scholar : PubMed/NCBI
|
|
29
|
Luo Y, Wang C, Yong P, Ye P, Liu Z, Fu Z,
Lu F, Xiang W, Tan W and Xiao J: Decreased expression of the long
non-coding RNA SLC7A11-AS1 predicts poor prognosis and promotes
tumor growth in gastric cancer. Oncotarget. 8:112530–112549. 2017.
View Article : Google Scholar
|
|
30
|
Tschopp J, Martinon F and Burns K: NALPs:
A novel protein family involved in inflammation. Nat Rev Mol Cell
Biol. 4:95–104. 2003. View Article : Google Scholar : PubMed/NCBI
|
|
31
|
Hughes FM Jr, Kennis JG, Youssef MN, Lowe
DW, Shaner BE and Purves JT: The NACHT, LRR and PYD
domains-containing protein 3 (NLRP3) inflammasome mediates
inflammation and voiding dysfunction in a
lipopolysaccharide-induced rat model of cystitis. J Clin Cell
Immunol. 7:2016. View Article : Google Scholar : PubMed/NCBI
|
|
32
|
Leemans JC, Cassel SL and Sutterwala FS:
Sensing damage by the NLRP3 inflammasome. Immunol Rev.
243:1521622011. View Article : Google Scholar : PubMed/NCBI
|
|
33
|
Yu N, Liu S, Yi X, Zhang S and Ding Y:
Serum amyloid A induces interleukin-1β secretion from keratinocytes
via the NACHT, LRR and PYD domains‑containing protein 3
inflammasome. Clin Exp Immunol. 179:344–353. 2015. View Article : Google Scholar :
|
|
34
|
Wu G, Liao Y, Qin Z, He LR, Chen YC, Zeng
YX, Kung HF and Xie D: PYRIN domain of NALP2 inhibits cell
proliferation and tumor growth of human glioblastoma. Plasmid.
64:41–50. 2010. View Article : Google Scholar : PubMed/NCBI
|
|
35
|
Li J, Liu D, Wang J, Deng H, Luo X, Shen
X, Huan Y, Huang G and Ye H: Meta‑analysis identifies candidate key
genes in endometrium as predictive biomarkers for clinical
pregnancy in IVF. Oncotarget. 8:102428–102436. 2017.PubMed/NCBI
|
|
36
|
Sato T, Nakashima A, Guo L, Coffman K and
Tamanoi F: Single amino-acid changes that confer constitutive
activation of mTOR are discovered in human cancer. Oncogene.
29:2746–2752. 2010. View Article : Google Scholar : PubMed/NCBI
|
|
37
|
Sofer A, Lei K, Johannessen CM and Ellisen
LW: Regulation of mTOR and cell growth in response to energy stress
by REDD1. Mol Cell Biol. 25:5834–5845. 2005. View Article : Google Scholar : PubMed/NCBI
|
|
38
|
Zoncu R, Efeyan A and Sabatini DM: mTOR:
From growth signal integration to cancer, diabetes and ageing. Nat
Rev Mol Cell Biol. 12:21–35. 2011. View Article : Google Scholar
|
|
39
|
Pinto JA, Rolfo C, Raez LE, Prado A,
Araujo JM, Bravo L, Fajardo W, Morante ZD, Aguilar A, Neciosup SP,
et al: In silico evaluation of DNA damage inducible transcript 4
gene (DDIT4) as prognostic biomarker in several malignancies. Sci
Rep. 7:15262017. View Article : Google Scholar : PubMed/NCBI
|
|
40
|
Li Y, Guerrero A and Howard TH: The
actin-binding protein, lymphocyte‑specific protein 1, is expressed
in human leukocytes and human myeloid and lymphoid cell lines. J
Immunol. 155:3563–3569. 1995.PubMed/NCBI
|
|
41
|
Howard TH, Hartwig J and Cunningham C:
Lymphocyte‑specific protein 1 expression in eukaryotic cells
reproduces the morphologic and motile abnormality of NAD 47/89
neutrophils. Blood. 91:4786–4795. 1998.PubMed/NCBI
|
|
42
|
Marafioti T, Mancini C, Ascani S,
Sabattini E, Zinzani PL, Pozzobon M, Pulford K, Falini B, Jaffe ES,
Müller- Hermelink HK, et al: Leukocyte‑specific phosphoprotein‑1
and PU. 1: Two useful markers for distinguishing T-cell-rich B-cell
lymphoma from lymphocyte-predominant Hodgkin's disease.
Haematologica. 89:957–964. 2004.PubMed/NCBI
|
|
43
|
Couch FJ, Wang X, McWilliams RR, Bamlet
WR, de Andrade M and Petersen GM: Association of breast cancer
susceptibility variants with risk of pancreatic cancer. Cancer
Epidemiol Biomarkers Prev. 18:3044–3048. 2009. View Article : Google Scholar : PubMed/NCBI
|
|
44
|
Chen H, Qi X, Qiu P and Jhao J:
Correlation between LSP1 polymorphisms and the susceptibility to
breast cancer. Int J Clin Exp Pathol. 8:5798–5802. 2015.PubMed/NCBI
|
|
45
|
Jin SY, Choi JS, Choi YL, Choi YL, Kim DH
and Lee SH: Identification of leukocyte‑specific protein 1‑positive
cells: A clue to the cell of origin and a marker for the diagnosis
of dermatofibroma. Ann Dermatol. 27:1571622015. View Article : Google Scholar : PubMed/NCBI
|
|
46
|
Zhang H, Wang Y, Liu Z, Yao B, Dou C, Xu
M, Li Q, Jia Y, Wu S, Tu K and Liu Q: Lymphocyte‑specific protein 1
inhibits the growth of hepatocellular carcinoma by suppressing
ERK1/2 phosphorylation. FEBS Open Bio. 6:1227–1237. 2016.
View Article : Google Scholar
|
|
47
|
Stone J, Thompson DJ, dos Santos Silva I,
Scott C, Tamimi RM, Lindstrom S, Kraft P, Hazra A, Li J, Eriksson
L, et al: Novel associations between common breast cancer
susceptibility variants and risk-predicting mammographic density
measures. Cancer Res. 75:2457–2567. 2015. View Article : Google Scholar : PubMed/NCBI
|
|
48
|
Bannwarth S, Giordanengo V, Lesimple J and
Lefebvre JC: Molecular cloning of a new secreted sulfated
mucin-like protein with a C-type lectin domain that is expressed in
lymphoblastic cells. J Biol Chem. 273:1911–1916. 1998. View Article : Google Scholar : PubMed/NCBI
|
|
49
|
Hiraoka A, Sugimura A, Seki T, Nagasawa T,
Ohta N, Shimonishi M, Hagiya M and Shimizu S: Cloning, expression,
and characterization of a cDNA encoding a novel human growth factor
for primitive hematopoietic progenitor cells. Proc Nat Acad Sci
USA. 94:7577–7582. 1997. View Article : Google Scholar : PubMed/NCBI
|
|
50
|
Hiraoka A, Yano KI K, Kagami N, Takeshige
K, Mio H, Anazawa H and Sugimoto S: Stem cell growth factor: In
situ hybridization analysis on the gene expression, molecular
characterization and in vitro proliferative activity of a
recombinant preparation on primitive hematopoietic progenitor
cells. Hematol J. 2:307–315. 2001. View Article : Google Scholar
|
|
51
|
Yue R, Shen B and Morrison SJ:
Clec11a/osteolectin is an osteogenic growth factor that promotes
the maintenance of the adult skeleton. Elife. 5:e187822016.
View Article : Google Scholar : PubMed/NCBI
|
|
52
|
Hur K, Toiyama Y, Boland CR and Goel A:
468 Serum microRNA-885-5p is a novel prognostic and
metastasis-predictive biomarker in patients with colorectal cancer.
Gastroenterol. 144:735–743. 2013. View Article : Google Scholar
|
|
53
|
Perumal D, Lagana A, Melnekoff D, Readhead
B, Kidd B, Leshchenko VV, Kuo P-Y, Yesil J, Derome M, Auclair D, et
al: Network Modeling Reveals CDC42BP and CLEC11A As Novel Driver
Genes of t(4; 14) Multiple Myeloma. Am Soc Hematol.
128:8022016.
|
|
54
|
Ito C, Sato H, Ando K, Watanabe S, Yoshiba
F, Kishi K, Furuya A, Shitara K, Sugimoto S, Kohno H, et al: Serum
stem cell growth factor for monitoring hematopoietic recovery
following stem cell transplantation. Bone Marrow Transplant.
32:391–398. 2003. View Article : Google Scholar : PubMed/NCBI
|
|
55
|
Keller CC, Ouma C, Ouma Y, Awandare GA,
Davenport GC, Were T, Hittner JB, Vulule JM, Ong'echa JM and
Perkins DJ: Suppression of a novel hematopoietic mediator in
children with severe malarial anemia. Infect Immun. 77:3864–3871.
2009. View Article : Google Scholar : PubMed/NCBI
|
|
56
|
de Bruijn MF and Speck NA: Core-binding
factors in hematopoiesis and immune function. Oncogene.
23:4238–4248. 2004. View Article : Google Scholar : PubMed/NCBI
|
|
57
|
Wickramarachchi DC, Theofilopoulos AN and
Kono DH: Immune pathology associated with altered actin
cytoskeleton regulation. Autoimmunity. 43:64–75. 2010. View Article : Google Scholar
|