Introduction
Alzheimer's disease (AD) is characterized by the
presence of neurofibrillary tangles and neuron loss, which are
generated by amyloid β (Aβ)-induced plaques and abnormally
aggregated hyperphosphorylated tau (1,2).
AD onset, which features progressively dysfunctional cognition and
pathological neuron loss, is considered to be associated with the
activation of neuroinflammatory factors, astrocytes, microglia (MI)
and the complement system (3). A
total of ~5% of the worldwide population >65-years old are at
risk of developing AD, and ≤30% population aged >85-years-old
suffer from AD, emphasizing the evidently incremental trend of AD
patients with aging (4). Since
late-stages of AD are accompanied with dementia and gradual loss of
self-sufficiency, it is important that AD patients are diagnosed
and treated at the mild or moderate stages of the disease (5). Various drug therapies for AD have
been emerging, including cholinesterase inhibitors (such as
donepezil) and N-methyl-D-aspartic acid receptor antagonists (such
as memantine hydrochloride). Nevertheless, these therapies merely
delay cognitive decline, rather than prohibiting the progression of
AD. Thus, it is urgent to explore the pathogenesis of AD in order
to facilitate the development of novel diagnostic biomarkers and
efficient treatment targets for this disease.
Certain long non-coding RNAs (lncRNAs) are
differentially expressed within astrocytes, oligodendrocytes and
glia, indicating that they may participate in the pathogenesis of
certain neuronal disorders by acting on downstream microRNAs (miRs)
and mRNAs (6). For instance,
lncRNA SNHG14 may result in activated MI via modifying downstream
miR-145-5p and PLA2G4A, elevating the probability of an individual
suffering from cerebral infarction (7). Furthermore, the lncRNA
2700046G09Rik/miR-23a/phosphatase and tensin homolog axis
served a crucial role in the myelination process of
oligodendrocytes (8), while
lncRNA MEG3 interacted with miR-181b to interfere with
anoxia-induced neuronal apoptosis (9).
The abnormal expression of certain miRNAs has been
documented to be implicated in the etiology of AD, including
miR-146a, miR-34a, miR-125a and miR-324-3p (10). For instance, miRNA-34a within
activated MI was associated with Aβ accumulation by inhibiting
Trem-2 expression (11), while
the pro-inflammatory responses of MI were also subject to the
modulation of miR-146a within AD mice brains (12). Furthermore, miR-324-3p was able to
mediate the expression of Rel A (13,14), which participates in neuritis
growth and apoptosis (15,16).
Thus, it was suggested that miR-324-3p may modulate neuronal growth
or apoptosis, and aberrant functioning of this miRNA may be
involved in triggering AD development. Considering the interactive
role of lncRNAs and miRNAs in promoting numerous diseases, the
present study was conducted to determine an lncRNA/miRNA axis that
may partly account for AD development.
It is also notable that the increased Aβ dimers due
to AD onset damage the synaptic plasticity (17), and thereby lead to neuritic
abnormalities (1). During this
process, the abnormally induced Aβ under pathological conditions
may activate the MI cells, reducing Aβ levels and producing
inflammatory factors, thus inducing damage and the apoptosis of
neurons (18). As a result, it
was further hypothesized that the lncRNA/miRNA axis proposed by the
current study may interfere with MI-induced neuronal apoptosis.
Overall, the aim of the present study was to
identify a potentially significant lncRNA and its targeted miRNA
underlying AD pathogenesis via chip hybridization analysis, which
may provide a foundation for the diagnosis and treatment of
early-stage AD.
Materials and methods
Culture, purification and passage of
MI
After the written approval of a female participant
and the ethics committee of Zhejiang Hospital (Hangzhou, China)
were acquired, the fetus whose life was terminated around 12 weeks
after pregnancy was taken from the obstetrics and gynecology
department of Zhejiang hospital (Zhejiang province, China). In
accordance with the methods reported by Dobrenis et al
(19), the 12-week aborted fetus
was washed with tri-distilled water, and was then soaked in 75%
alcohol for 5 min. Following washing with PBS, the embryo was
decapitated under a dissecting microscope, and the skull was
sectioned to collect the brain tissues (cortex and medulla). The
meninges and blood vessels were removed, and cold DMEM was prepared
to rinse the brain tissues. Then the tissues were mechanically
dissociated with a pipette (1-ml), and 0.25% trypsin was added for
15-min digestion at 37°C. Subsequently, 10% PBS was added to
terminate digestion, and the mixtures were filtered via a 200-mesh
sieve. The obtained filtrate was collected for 100 × g
centrifugation at room temperature for 5 min, and then the
supernatant was discarded. Additionally, DMEM medium that contained
10% FBS was added, and single-cell suspension was consequently made
following mechanical isolation of the samples. Then the cells at a
density of 1×10⁵/ml were inoculated into an
air-permeable culture flask that was pre-coated with poly-lysine.
Subsequently, cells were cultured under in 5% CO2 and
95% air at 37°C. After 2 days, cell growth and survival were
observed for 7–9 days, and medium was changed every 3–4 days.
After 7–9 days of culture, at room temperature, the
samples were agitated at 26 × g for 2 h prior to removal of the
supernatant. Finally, the MI-containing culture solution was
transferred to a poly-lysine-coated culture plate for 30-min
cultivation in 5% CO2 at 37°C. When cells grew to cover
the well plate, they were digested with pancreatin for subculture;
passage 4 was used for subsequent analysis. With addition of CD11b
antibody (1:100; Y07D10A; Wuham Boster Biological Technology, Ltd.,
Wuhan, China), MIs were identified according to the instructions of
DAB staining kit (08A04A22; Wuhan Boster Biological Technology,
Ltd.) (20). The purified MIs
were stained with 1% cresyl-violet (Nanjing SenBeiJia Biological
Technology, Nanjing, Jiangsu Province, China) at 37°C for 20 min,
and they were also managed with CD68 immunofluorescent staining
(OriGene Technologies, Inc., Rockville, MD, Beijing, China). A
total of 20 views per field were collected to calculate number of
cresyl violet-stained or CD68-positive cells, and the purity of MI
was calculated according to the formula of
NCD68+/Ncresyl violet+.
Construction of AD cell models
Human neuroblastoma SH-SY5Y cells were purchased
from the Cell Bank of the Chinese Academy of Sciences (Shanghai,
China) and cultured in high-glucose Dulbecco's modified Eagle's
medium (DMEM) (Thermo Fisher Scientific, Inc., Waltham, MA, USA),
which included 10% fetal bovine serum (FBS; Gemini Bio Products,
West Sacramento, CA, USA), 100 U/ml penicillin (Thermo Fisher
Scientific, Inc.) and 0.1 mg/ml streptomycin (Thermo Fisher
Scientific, Inc.) under saturated humidity in 5% CO2 at
37°C. For the AD cell model group, Aβ25–35
(Sigma-Aldrich; Merck KGaA, Darmstadt, Germany) was added to the
cells at the logarithmic growth phase, and the final concentration
of Aβ25–35 was adjusted to 20 µmol/l. For the
control group, the cells at the logarithmic growth phase were
treated with 10% dimethyl sulfoxide. The aforementioned AD cell
model and control group were both incubated at 37°C for another 48
h, and each of them was managed with six repeats. Three of the
repeats were used for the detection of P-tau in order to verify
whether the AD cell model was successfully established, and the
other three repeats were prepared for microarray data analysis
(KangCheng Biological Engineering, Shanghai, China).
Separation of nucleus from cytoplasm
Nuclear/cytoplasmic separation of SH-SY5Y cells was
implemented using the PARIS™ Protein and RNA Isolation System kit
(Thermo Fisher Scientific, Inc., Waltham, MA, USA). The 45S
ribosomal RNA (rRNA) was set as the internal reference for nucleus
RNAs, and 12S rRNA was designated as the internal reference for
cytoplasmic RNAs.
Chip hybridization and data analysis
Sample labeling and chip hybridization were
performed for the aforementioned AD and control cells groups,
according to the protocols of Agilent One-Color Microarray-Based
Gene Expression Analysis (Agilent Technologies, Inc., Beijing,
China). Specifically, TRIzol reagent (Invitrogen; Thermo Fisher
Scientific, Inc.) was employed to extract total RNA from the cells.
The mRNAs were obtained by removing rRNA from total RNA
(mRNA-ONLYTM Eukaryotic mRNA Isolation; Epicentre, Madison, WI,
USA), and were amplified following the random primer method
(21). The amplified mRNAs
underwent reverse transcription (RT) into cDNAs at 42°C for 60 min,
according to the guidance of PrimeScript™ RT reagent kit (RR037B;
Takara Bio, Inc., Otsu, Japan). The cDNAs were then transcribed
into fluorescent cRNAs with aid of T7 RiboMAX™ Express RNAi System
(P1700; Promega Corporation). Subsequently, the labeled cRNAs were
purified utilizing the RNeasy Mini Kit (Qiagen GmbH, Duesseldorf,
Germany), and Nanodrop ND-1000 (Thermo Fisher Scientific, Inc.) was
used to detect their concentration and activity. Subsequently,
cRNAs were precipitated with absolute ethanol and dried prior to
being dissolved in 16 µl hybridization solution (15%
methanamide, 0.2% SDS, 3× SSC and 50× Denhardt's) at 42°C overnight
(Agilent Technologies, Inc., Santa Clara, CA, USA). After
completion of chip hybridization, the chips were washed, fixed and
scanned with a DNA microarray Scanner (G2505C; Agilent
Technologies, Inc.). The Agilent Feature Extraction software
(version 11.0.1.1) was applied to read the chip values, which were
then processed via GeneSpring GX version 12.1 software (both from
Agilent Technologies, Inc.). Notably, the values that demanded
standardizing were further analyzed following screening of
high-quality probes, and the ratio of the P-value and false
discovery rate was determined to select the differentially
expressed lncRNAs or mRNAs. Furthermore, hierarchical clustering
and association analysis were conducted via compiling scripts.
RT-quantitative polymerase chain reaction
(RT-qPCR)
SH-SY5Y cells were inoculated into 6-well plates at
the density of 4.5×10⁵ cells/ml. When cell confluence
reached about 50%, cells were treated with Aβ25–35.
After ~48 h, total RNA was extracted with usage of
TRIzol® reagent (Invitrogen; Thermo Fisher Scientific,
Inc.). The purity (A260 nm/A280 nm) and concentration of RNA were
determined spectrophotometrically. Next, total RNA was reverse
transcribed into cDNA, with assistance of 10 µl RT mixture
(Sigma-Aldrich; Merck KGaA), which included 2 nt 10× RT buffer, 1
µl RT Enzyme Mix, 2 µl FQ-RT Primer Mix and
RNase-Free ddH2O. The reverse transcription conditions
involved incubation at 42°C for 15 min, and then at 95°C for 3 min.
Subsequently, the products were subjected to qPCR analysis with
THUNDERBIRD SYBR® qPCR Mix (Toyobo Life Science, Osaka,
Japan). The reaction system (20 µl) was made up of cDNA
template (2 µl), 10 µM forward primer (1 µl),
10 µM reverse primer (1 µl), 2× SuperReal PreMix Plus
(10 µl) and RNase-free H2O. The CFX96 Touch
Real-Time PCR detection system (Bio-Rad Laboratories, Inc.,
Hercules, CA, USA) was used, and the qPCR reaction conditions were
as follows: Pre-degeneration at 95°C for 30 sec, 39 cycles of
degeneration at 95°C for 5 sec, followed by annealing and extension
at 58–60°C for 32 sec. The 2−ΔΔCq method (22) was employed to analyze the relative
expression levels of lncRNA and mRNA, with β-actin serving as the
internal reference. All the primers were synthesized by Sangon
Biotech Co., Ltd. (Shanghai, China) and are listed in Table I.
 | Table IPrimers for RP11-543N12.1-siRNA,
RP11-543N12.1 and β-actin. |
Table I
Primers for RP11-543N12.1-siRNA,
RP11-543N12.1 and β-actin.
| Genes | Primers |
|---|
|
RP11-543N12.1-siRNA | |
| siRNA-1 |
5′-CCAGCAGAUUAGUCUGCAUTT-3′
(sense)
5′-AUGCAGACUAAUCUGCUGGTT-3′ (antisense) |
| siRNA-2 |
5′-GGGAUGGUCACCUGUAAAUTT-3′
(sense)
5′-AUUUACAGGUGACCAUCCCTT-3′ (antisense) |
| siRNA-3 |
5′-GAUGGACCACGUUGAGCAUTT-3′
(sense)
5′-AUGCUCAACGUGGUCCAUCTT-3′ (antisense) |
| RP11-543N12.1 |
5′-CAAGACTAGCGTCTCCCAGC-3′
(forward)
5′-GTCTTGGTGCATTTGATTTCTCTGA-3′ (reverse) |
| β-actin |
5′-GAAGTGTGACGTGGACATCC-3′
(forward)
5′-CCGATCCACACGGAGTACTT-3′ (reverse) |
Western blotting
Total protein was extracted from the cells utilizing
SDS lysis buffer (Beyotime Institute of Biotechnology, Shanghai,
China), and Bradford's method was conducted to measure the
concentration of total protein. The proteins were separated by 8%
SDS-PAGE, and then the samples were transferred to a polyvinylidene
fluoride (PVDF) membrane. Subsequently, the PVDF membrane was
blocked at room temperature in Tris-buffered saline Tween-20 (TBST)
that contained 5% skim milk powder for 1 h. Subsequently, primary
antibodies were added, including rabbit anti-mouse tau primary
antibody (1:1,000; ab64193; Abcam, Cambridge, MA, USA), rabbit
anti-mouse tau-S404 primary antibody (1:1,000; ab92676; Abcam),
rabbit anti-mouse tau-T231 primary antibody (1:1,000; ab151559;
Abcam), rabbit anti-mouse GAPDH primary antibody (1:200; Abcam),
rabbit anti-mouse p53 monoclonal antibody (1:200; ab31333; Abcam),
rabbit anti-mouse B-cell lymphoma-2 (Bcl-2) monoclonal antibody
(1:100; ab182858; Abcam) and rabbit anti-mouse Bcl-2-associated X
(Bax) monoclonal antibody (1:200; ab2568; Abcam). Following
incubation overnight at 4°C and rinsing with TBST, goat anti-rabbit
horseradish peroxidase-conjugated IgG (HRP-IgG) (1:2,000; ab6721;
Abcam) were added for incubation at 37°C for a further 1 h. Based
on the manufacturer's protocols of ECL chemi-luminescence assay kit
(Beyotime Institute of Biotechnology), color development was
completed. Finally, the integrated optical density (IOD) of protein
bands was measured by the Lab Works 4.5 image acquisition
instrument (Syngene Europe, Cambridge, UK), and the GAPDH protein
bands were designated as the internal reference.
Construction of pcDNA3.1(+)-RP11-543N12.1
vector and lentiviral transfection
With assistance of T4 DNA ligase
(Fermentas Thermo Fisher, Scientific, Inc.), the PCR products of
RP11-543N12.1 were inserted into the eukaryotic expression vectors
pcDNA3.1(+) that were digested by two restriction enzymes of
EcoRI (Fermentas; Thermo Fisher Scientific, Inc.) and
BamHI (Fermentas; Thermo Fisher Scientific, Inc.). Then the
ligated products were transformed into DH5a competent cells
(Shanghai GeneChem, Co., Ltd., Shanghai, China), which were then
spread onto plates for 37°C culture. Subsequently, the supernatant
was collected for the following transfection of SH-SY5Y cells.
Furthermore, according to the instructions of the lentivirus
packaging kit (BBV0017; Backer Biotech Zhengzhou, China), the
double enzyme vector pGLV was co-transfected into SH-SY5Y cells
with pHelper 1.0 and pHelper 2.0, and cell supernatants that were
rich in lentiviral particles were collected by 100 × g
centrifugation at room temperature for 10 min. In addition,
RP11-543N12.1-siRNA sequences were designed and synthesized by
Shanghai GenePharma Co., Ltd. (Shanghai, China). The sense and
anti-sense sequences were as follows: siRNA1#, sense 5′-CCA GCA GAU
UAG UCU GCA UTT-3′, antisense 5′-AUG CAG ACU AAU CUG CUG GTT-3′;
siRNA2#, sense 5′-GGG AUG GUC ACC UGU AAA UTT-3′, antisense, 5′-AUU
UAC AGG UGA CCA UCC CTT-3′, and siRNA3#, sense 5′-GAU GGA CCA CGU
UGA GCA UTT-3′, and 5′-AUG CUC AAC GUG GUC CAU CTT-3′. The SH-SY5Y
cells at the logarithmic growth phase were employed for
transfection process using Lipofectamine 2000 (Invitrogen; Thermo
Fisher Scientific, Inc.).
The SH-SY5Y cells transfected with RP11-543N12.1- si
R NA were g rouped as fol lows: i) MOCK; ii)
MOCK+Aβ25–35 (20 µmol/l); iii) negative control
(NC); iv) NC+Aβ25–35 (20 µmol/l); v)
RP11-543N12.1-siRNA and vi) RP11-543N12.1-siRNA+Aβ25–35
(20 µmol/l). Furthermore, the cells transfected with
RP11-543N12.1-overexpressed plasmids were divided into: i) MOCK;
ii) MOCK+Aβ25–35 (20 µmol/l); iii) pcDNA3.1(+);
iv) pcDNA3.1(+)+Aβ25–35 (20 µmol/l); v)
pcDNA3.1(+)-RP11-543N12.1; and vi)
pcDNA3.1(+)-RP11-543N12.1+Aβ25–35 (20 µmol/l).
The afore-mentioned cells were cultured at room temperature for 48
h, after being treated with 20 µmol/l Aβ25–35 at
room temperature for 48 h. The RP11-543N12.1-siRNA sequence
employed in the present study was designed and synthesized by
Shanghai GenePharma Co., Ltd. In addition, miR-324-3p inhibitor and
miR-324-3p mimic were purchased from Biomics Biotechnologies
(Nantong, Jiangsu Province, China).
Target prediction
The software MIRDB4.0 (http://mirdb.org/miRDB/index.html) and PITA
(http://genie.weizmann.ac.il/pubs/mir07/mir07_exe.Html)
were operated to co-predict the target miRNAs of lncRNA
RP11-543N12.1.
Dual-luciferase reporter assay
The RP11-543N12.1 fragment that contained binding
sites for miR-324-3p was amplified and cloned into the psiCHECK-2
luciferase vector (Promega, Madison, WI, USA), and the resultant
was termed RP11-543N12.1-wild-type (wt). Next, the binding sites
within the RP11-543N12.1 fragment were mutated using an XL
Site-directed Mutagenesis kit (Qiagen, Duesseldorf, Germany), and
the obtained fragment was connected with luciferase vectors to
construct RP11-543N12.1-mutated (mut). With assistance of
Lipofectamine 2000 (Invitrogen, Carlsbad, CA, USA), miR-324-3p
mimic or miR-NC was co-transfected with RP11-543N12.1-wt or
RP11-543N12.1-mut into SH-SY5Y cells. The activities of reporter
genes were detected with the Dual-Luciferase Reporter Assay kit
(Promega Corporation), and analyzed by means of Turner Designs
Spreadsheet Interface (version 2.0.1; Turner Designs, Sunnyvale,
CA, USA).
Establishment of the transwell co-culture
system
A transwell chamber was devised as the culture
device: The upper chamber was arranged for the inoculation of MI,
while the lower chamber was prepared for cultivation of SH-SY5Y
cells. The concentrations of SH-SY5Y cells and MI were adjusted to
1.0×10⁶/ml, respectively, with DMEM and F12 that
contained 10% FBS. The specific grouping and treatment details were
described as follows: i) NC group, in which SH-SY5Y cells
(1.0×10⁶/ml) were cultured within the lower chamber,
with 2 ml medium added in the upper chamber; ii) Aβ stimulation
group, in which SH-SY5Y cells were cultured in the lower chamber
and 10 µM Aβ25–35 was added into the upper
chamber; iii) MI stimulation group, in which SH-SY5Y cells and MI
were, respectively, inoculated in the lower and upper chambers
according to the concentration ratio of 1:1; and iv) Aβ and MI
co-stimulation group, in which the same treatment as that of the MI
stimulation group was performed, with addition of 10 µM
Aβ25–35 into the MI layer subsequent to attachment of MI
cells onto the plate wall. The aforementioned cell groups were all
cultured in 5% CO2 at 37°C for 96 h, and the incubation
time was counted from the addition of Aβ25–35.
Approximately five repeats of each group were conducted.
Detection of SH-SY5Y cell survival rate
with an MTT assay
SH-SY5Y cells were seeded into 96-well plates at the
density of 5,000/well, and 200 ml antibiotic-free medium was added
in each well. At the time points of 0, 24, 48 and 72 h, each well
was added with 5 g/l MTT (20 µl). Subsequent to culturing
for 4 h, 150 µl dimethyl sulfoxide was added to each well
and shaken for 10 min. Finally, the optical density (OD) values at
490 nm were measured with a universal microplate spectrophotometer,
and the cell survival rate was calculated according to the
following formula: ODexperimental group/ODcontrol
group × 100%.
Detection of SH-SY5Y cell apoptosis with
the Annexin V-FITC/propidium iodide (PI) method
The apoptotic status of SH-SY5Y cells was determined
with the Annexin V-FITC/PI apoptosis detection kit (Beyotime
Institute of Biotechnology). Briefly, after cells were rinsed twice
with PBS, binding buffer (100 µl) and 20 µg/ml
FITC-labeled Annexin V (10 µl) were added, and the mixture
was kept in the dark at room temperature for 30 min. Subsequently,
the mixture was supplemented with 50 µg/ml PI (5 µl)
and 400 µl binding buffer. A sample without Annexin V-FITC
and PI was regarded as the negative control. A total of 10
fields-of-view were randomly selected under the high-power
microscope, and the apoptosis rate was calculated according to the
formula of Napoptotic cells/Ntotal cells ×
100%.
Detection of tumor necrosis factor α
(TNF-α), interleukin-6 (IL-6) and nitric oxide (NO) levels by
ELISA
ELISA detection kits were used to determine the
levels of TNF-α (cat. no. 88-7340-22 Thermo Fisher Scientific,
Inc.), IL-6 (cat. no. RAB0308 Sigma-Aldrich; Merck KGaA) and NO
(cat. no. A013-2, Nanjing Jiancheng Bio-Engineering Institute Co.,
Ltd., Nanjing, China), according to the manufacturer's protocol.
The absorbance values at 450 and 520 nm were obtained, and the
respective contents of TNF-α, IL-6 and NO were confirmed according
to the standard curves.
Statistical analysis
The measurement data (mean ± standard deviation)
were compared based on t-test, while multigroup comparisons were
examined using analysis of variance, followed by Bonferroni's
post-hoc test. Statistical analyses were conducted using SPSS 16.0
software (SPSS, Inc., Chicago, IL, USA). P<0.05 was considered
to indicate a statistically significant difference.
Results
Establishment of AD cell model
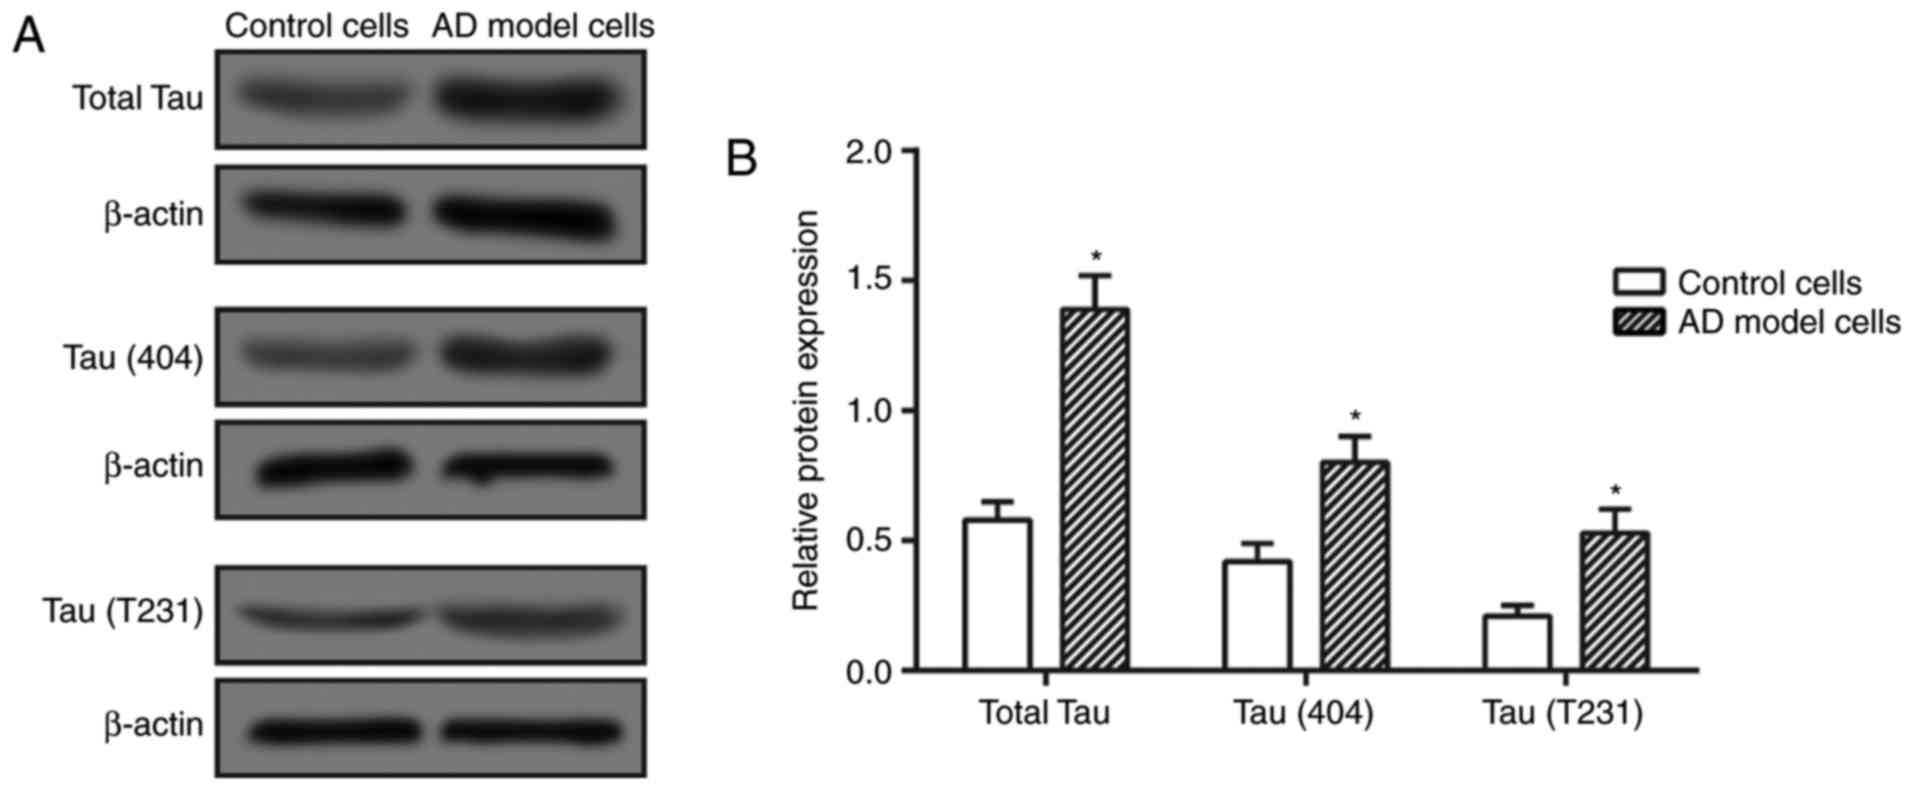
As tau (S404) and tau (T231) are two major forms of
phosphorylated tau, they were detected in the present study to
demonstrate the abundance of phosphorylated tau within cells. It
was revealed that the total tau and P-tau expressions were
significantly elevated in the Aβ25–35 treatment group in
comparison with those in the control group (P<0.05; Fig. 1), indicating that the AD cell
model was successfully constructed.
Identification of
differentially-expressed lncRNAs between AD and normal groups by
chip data analysis
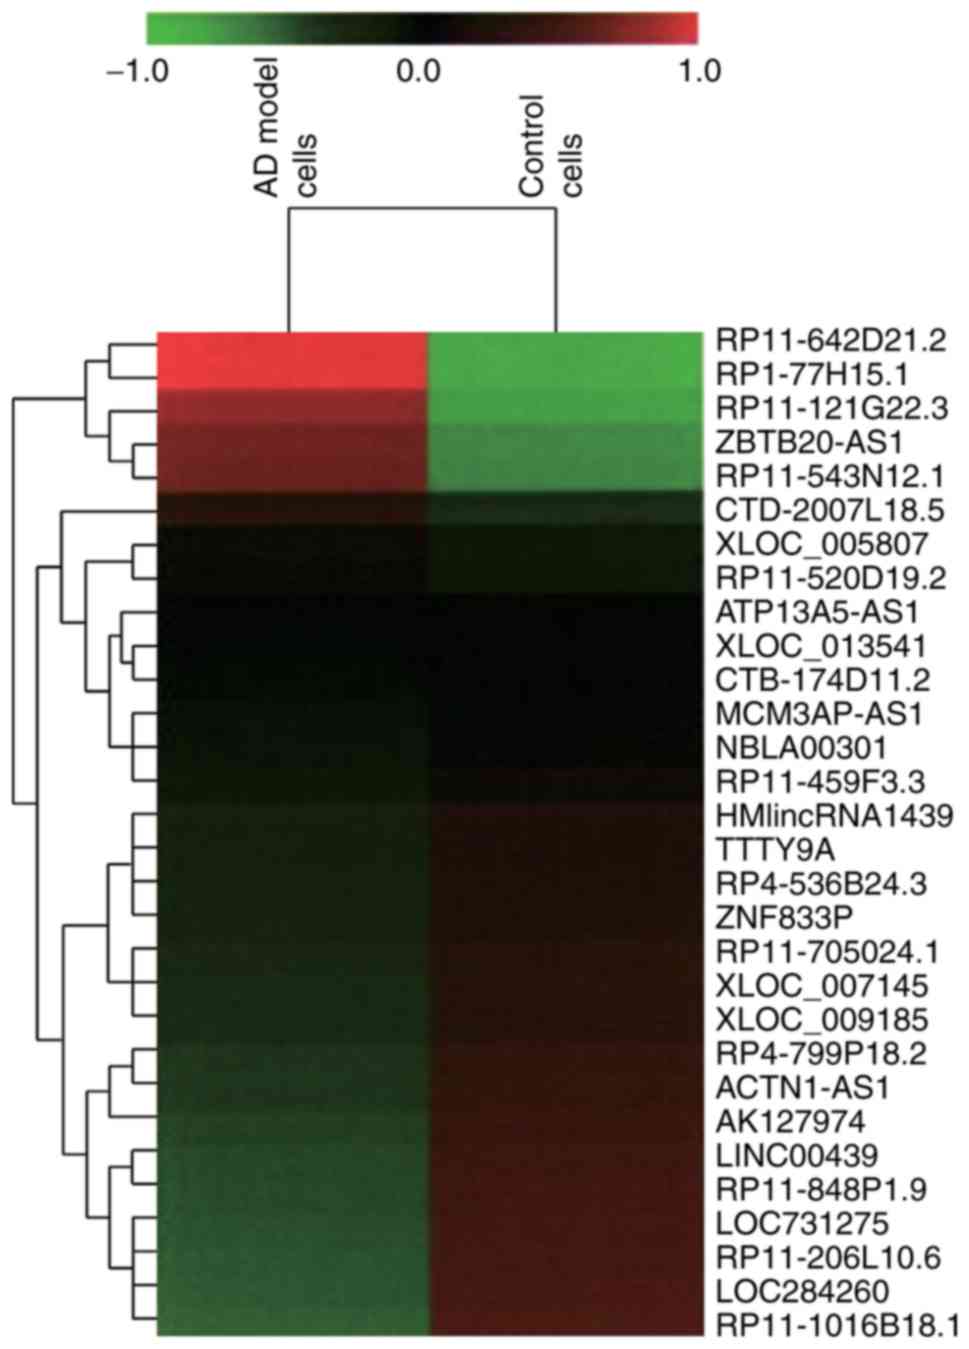
Through screening of differentially expressed
lncRNAs and mRNAs based on fold change (>2.0), 997 upregulated
lncRNAs and 1,653 downregulated lncRNAs were observed within AD
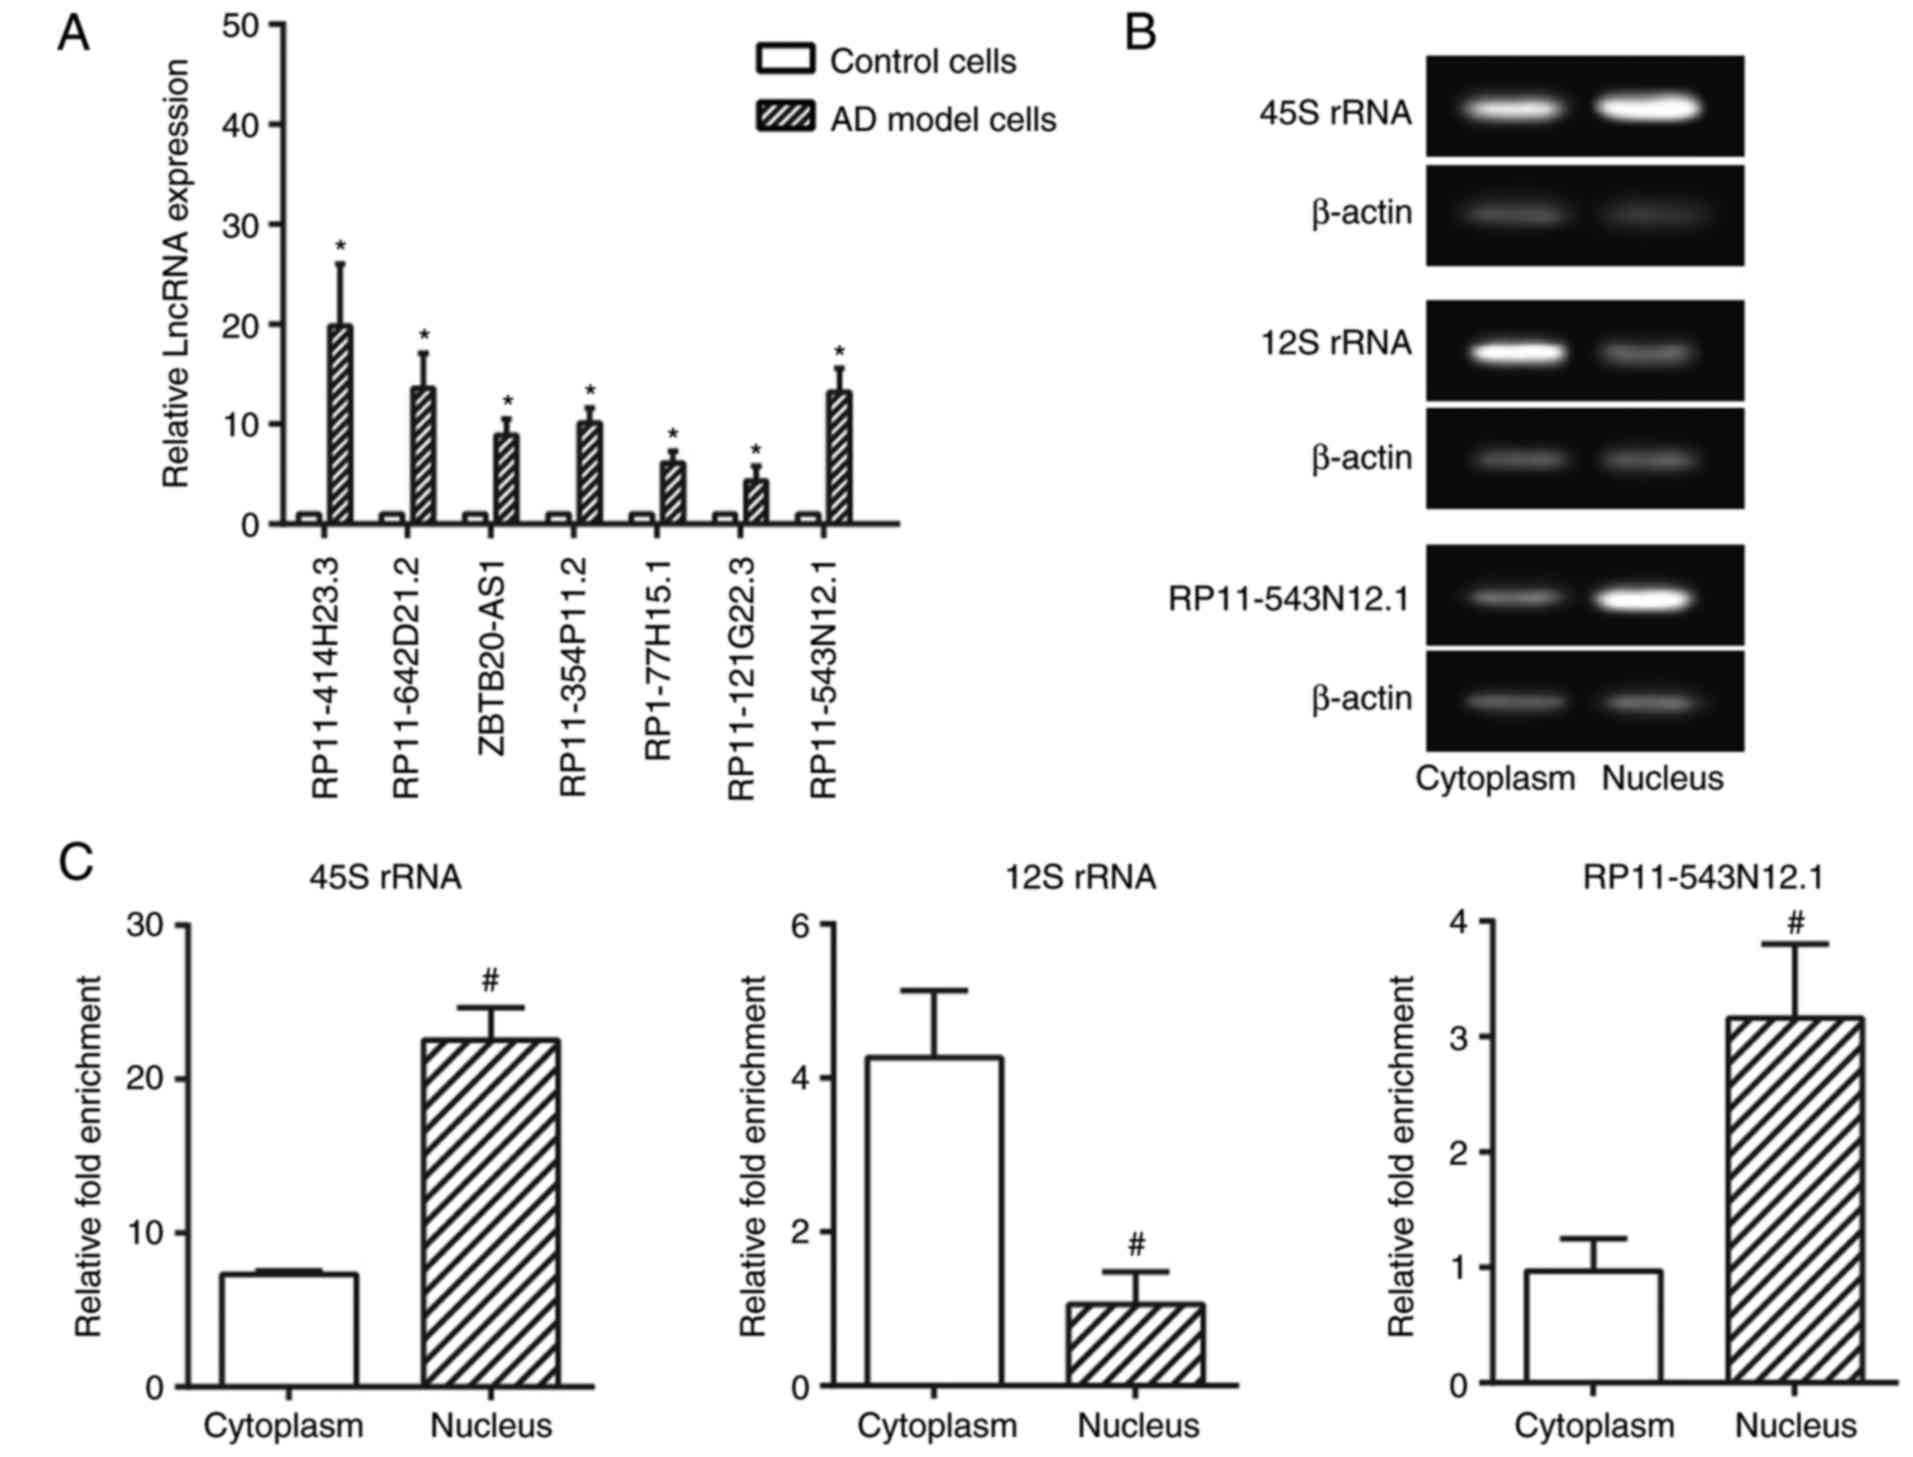
cell model in comparison to normal cell (P<0.05; Fig. 2). Furthermore, the expression
levels of the lncRNAs RP11-414H23.3, RP11-642D21.1, ZBTB20-AS1,
RP11-354P11.2, RP1-77H15.1, RP11-121G22.3 and RP11-543N12.1 were
confirmed to differ significantly between the AD cell model and
control cell (P<0.05) (Fig.
3A). Among them, lncRNA RP11-414H23.3 revealed the highest
levels of expression; however, expression was deemed to be unstable
within SH-SY5Y cells. Therefore, RP11-543N12.1 was selected for
genetic sequencing and subsequent experiments, considering its
relatively high and stable expression within AD cell models.
Sub-location of RP11-543N12.1 within
SH-SY5Y cells
As displayed in Fig.
3B and C, the nuclear/cytoplasmic ratio of RP11-543N12.1
expression within 45S rRNA was greater compared with that within
12S rRNA (P<0.05), and the RP11-543N12.1 expression within the
nucleus also exceeded that within the cytoplasm (P<0.05). Thus,
it was suggested that RP11-543N12.1 may function mainly through
modulating genetic transcriptions within the cell nucleus.
RP11-543N12.1 and Aβ25–35 coordinately
facilitated miR-324-3p expression
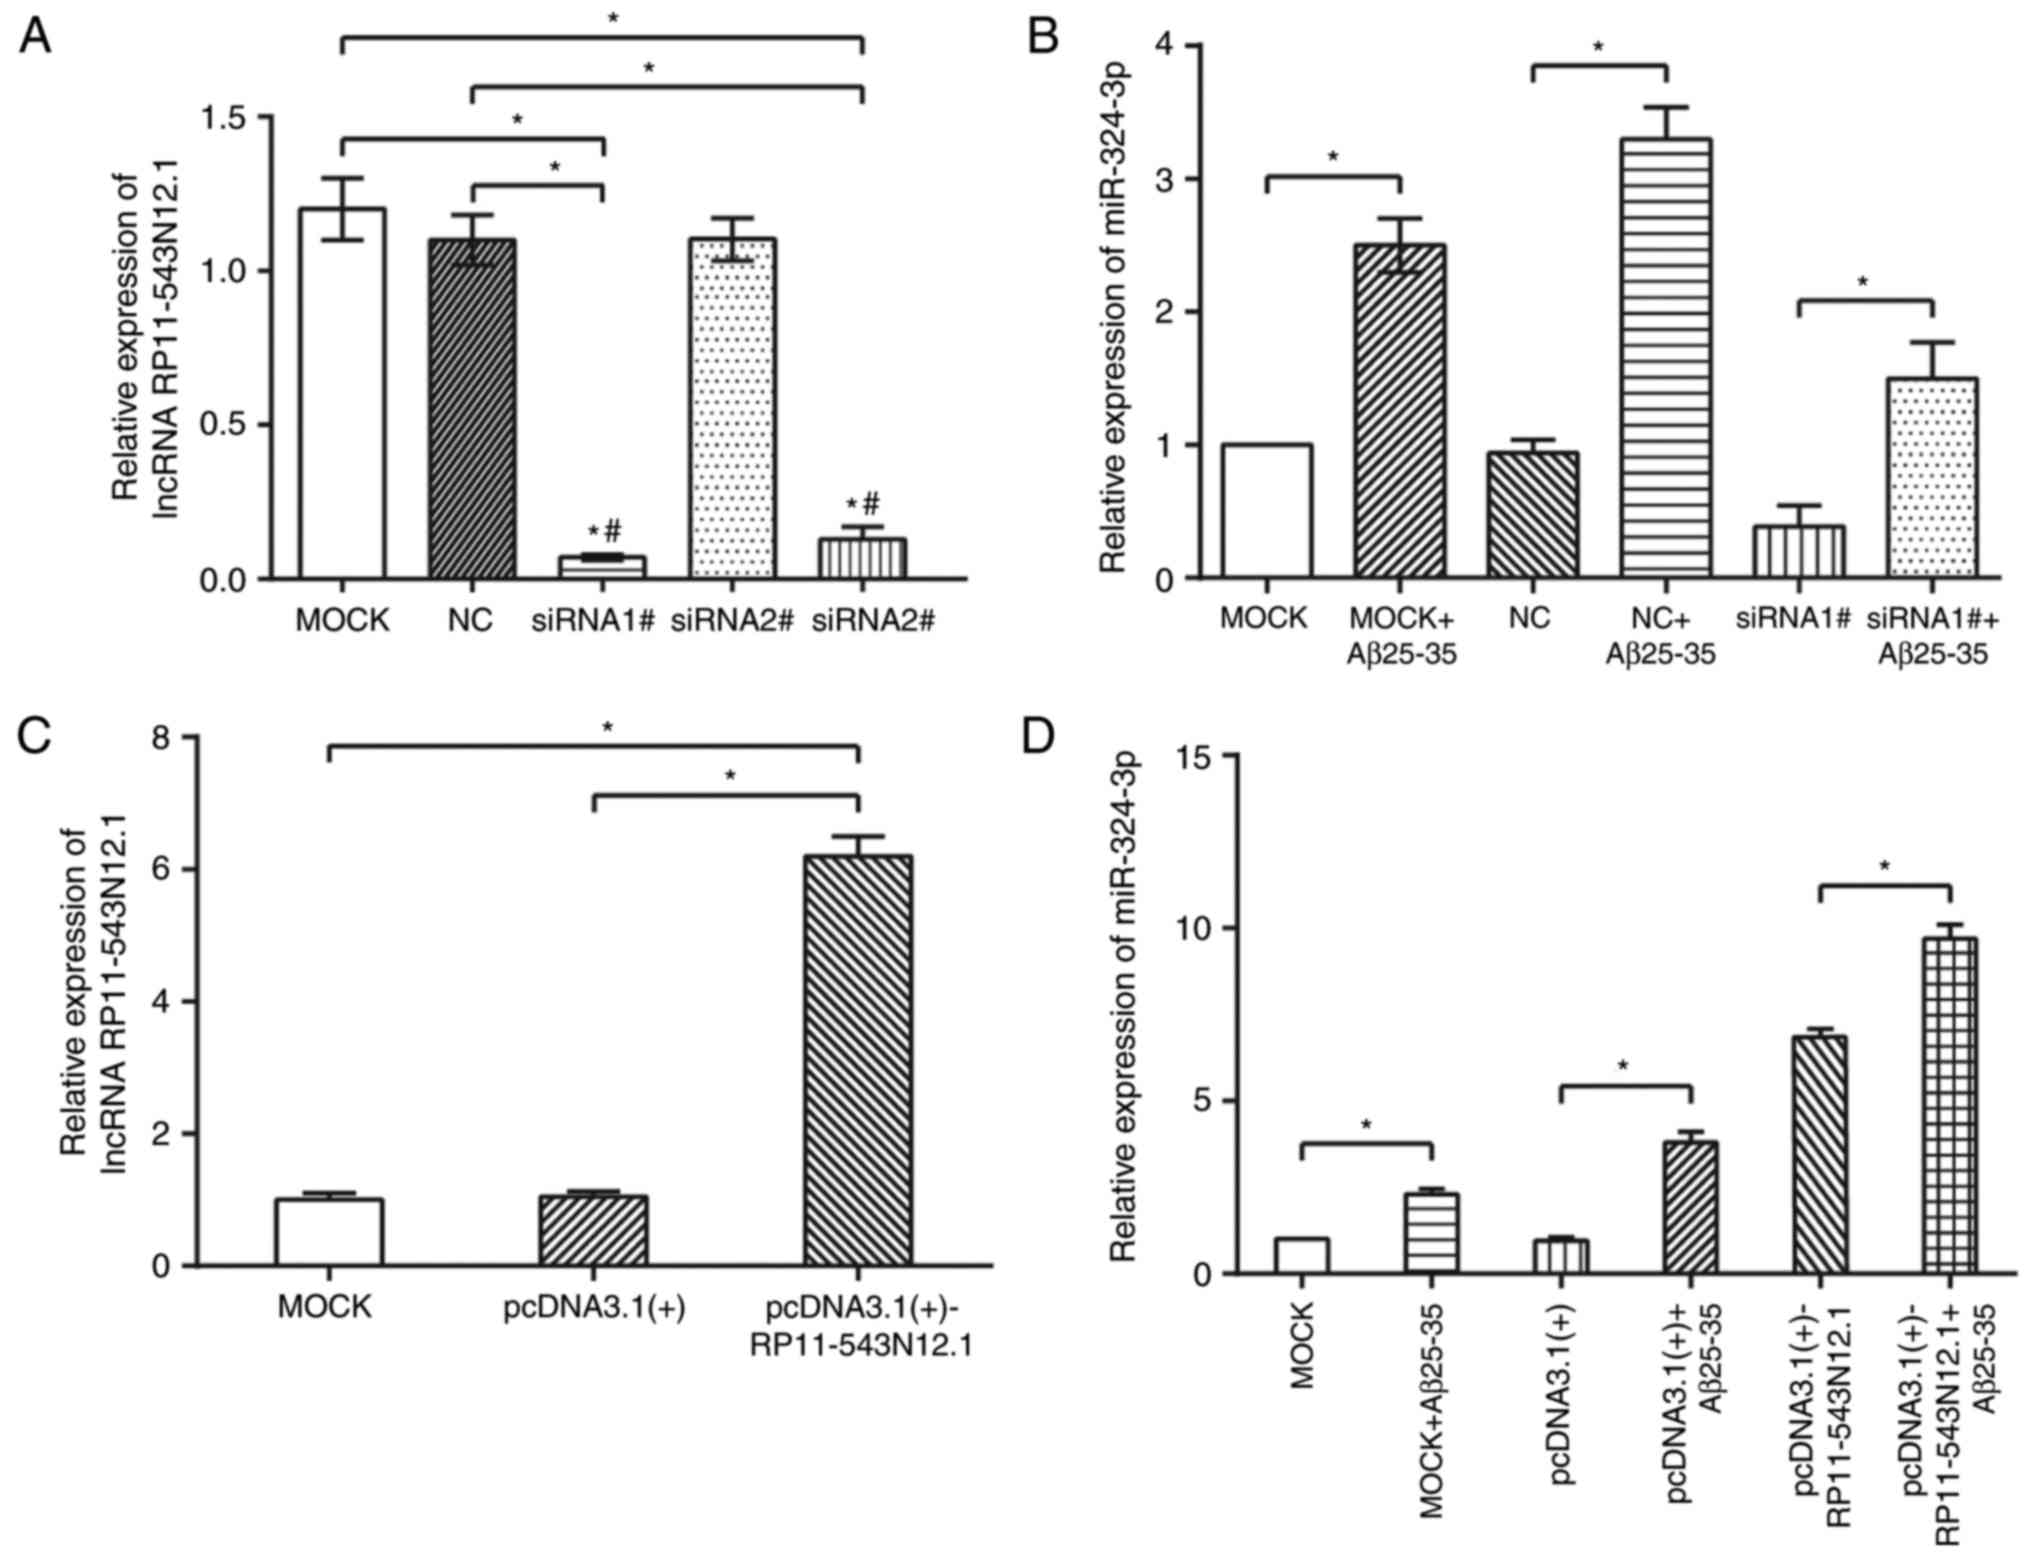
Three siRNA interference sequences (i.e, siRNA-1#,
siRNA-2# and siRNA-3#) were initially designed to ensure successful
interference with lncRNA RP11-543N12.1. The results revealed that
only siRNA-1# and siRNA-3# posed significant interfering effects,
while the effect of siRNA-1# on lncRNA RP11-543N12.1 was more
evident than that of siRNA-3# (Fig.
4A). Thus, siRNA-1# was selected for use in subsequent
experiments.
In addition, the expression levels of miR-324-3p
within the MOCK+Aβ25–35 and NC+Aβ25–35 groups
were significantly higher than those with in MOCK and NC groups,
respectively (P<0.05; Fig.
4B). Additionally, when the lncRNA RP11-543N12.1-siRNA1# group
was treated with Aβ25–35, its miR-324-3p expression was
significantly lower than MOCK+Aβ25–35 and
NC+Aβ25–35 groups, yet higher than MOCK and NC groups
(Fig. 4B). Furthermore,
transfection with pcDNA3.1(+)-RP11-543N12.1 vectors revealed
significantly increased RP11-543N12.1 expression levels than the
MOCK and pcDNA3.1(+) groups (P<0.05) (Fig. 4C), and the miR-324-3p expressions
within pcDNA3.1(+)-RP11-543N12.1 and
pcDNA3.1(+)-RP11-543N12.1+Aβ25–35 groups were also
significantly increased compared with in the MOCK and pcDNA3.1(+)
groups (P<0.05; Fig. 4D).
Furthermore, as the miR-324-3p expression levels of the
pcDNA3.1(+)-RP 11-543N12.1+Aβ25–35 group significantly
exceeded that of the MOCK+Aβ25–35 group (P<0.05), it
was suggested that Aβ25–35 and pcDNA3.1(+)-RP11-543N12.1
may upregulated miR-324-3p expression in a synergistic manner.
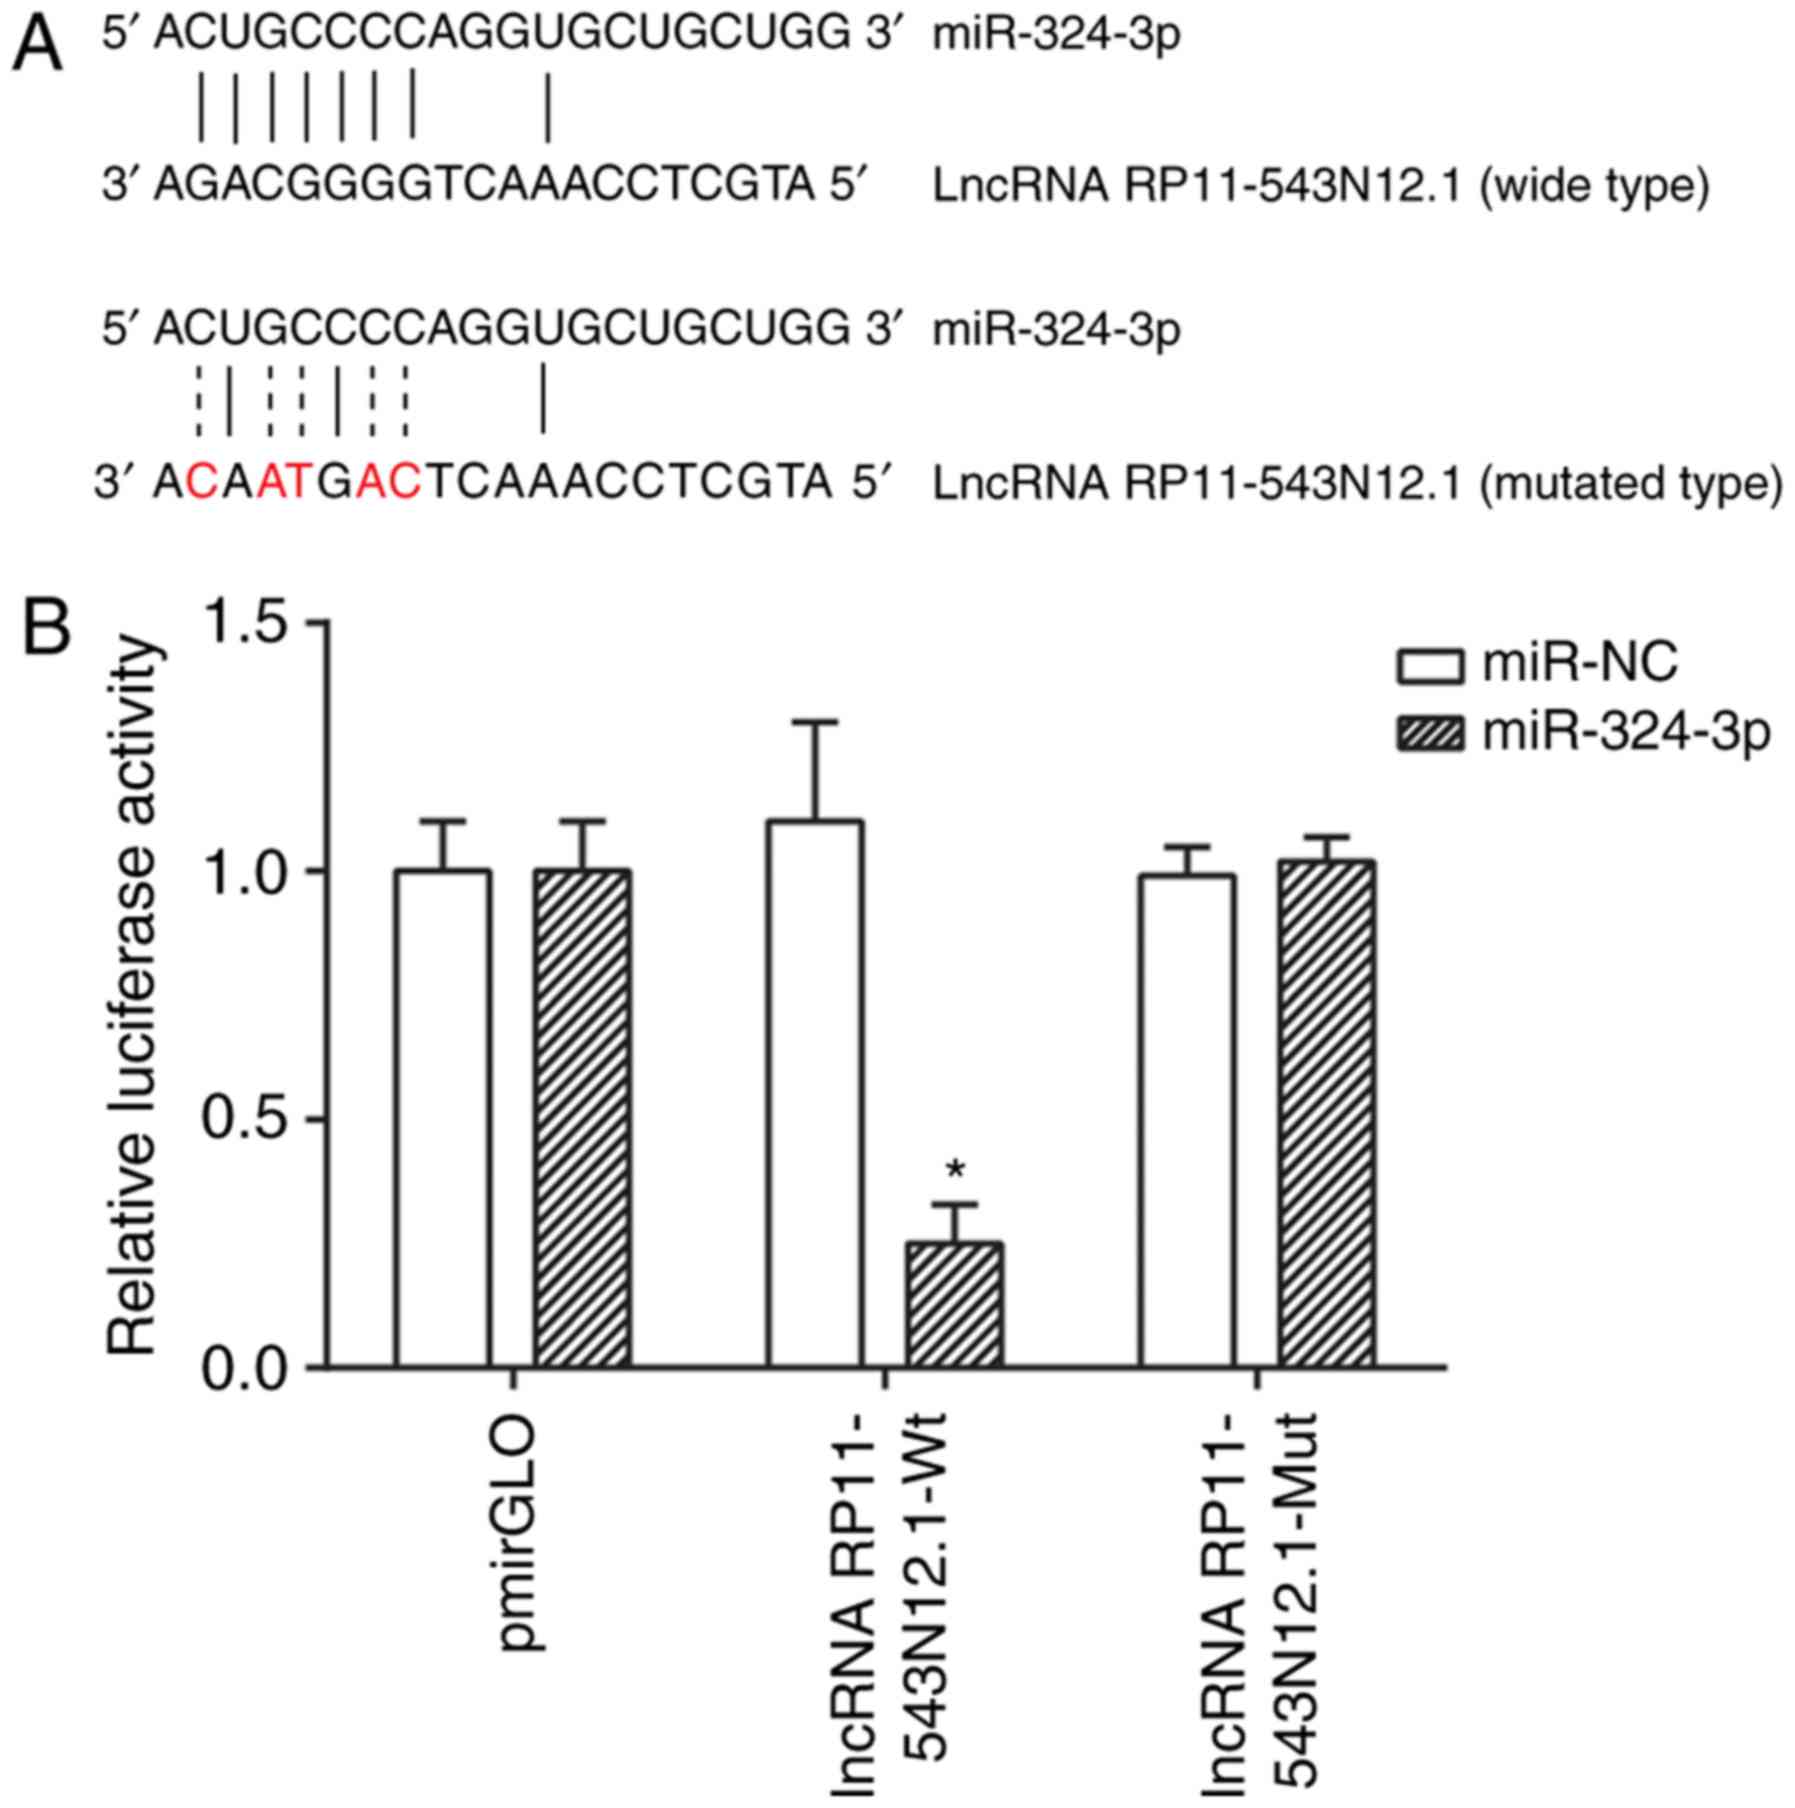
Targeted association between lncRNA
RP11-543N12.1 and miR-324-3p
The miRDB 4.0 and PITA databases were used to
co-predict the target miRNAs of RP11-543N12.1. It was observed that
miR-324-3p was complementary to RP11-543N12.1, with a reasonable
target score and target rank (Fig.
5A). In addition, the relative luciferase activity of the
RP11-543N12.1-wt+miR-324-3p group was significantly suppressed
(P<0.05), while the RP11-543N12.1-mut+miR-324-3p group exhibited
no evident difference when compared with the psiCHECK-2+miR-324-3p
group, implying that RP11-543N12.1-wt was able to effectively bind
to miR-324-3p (Fig. 5B).
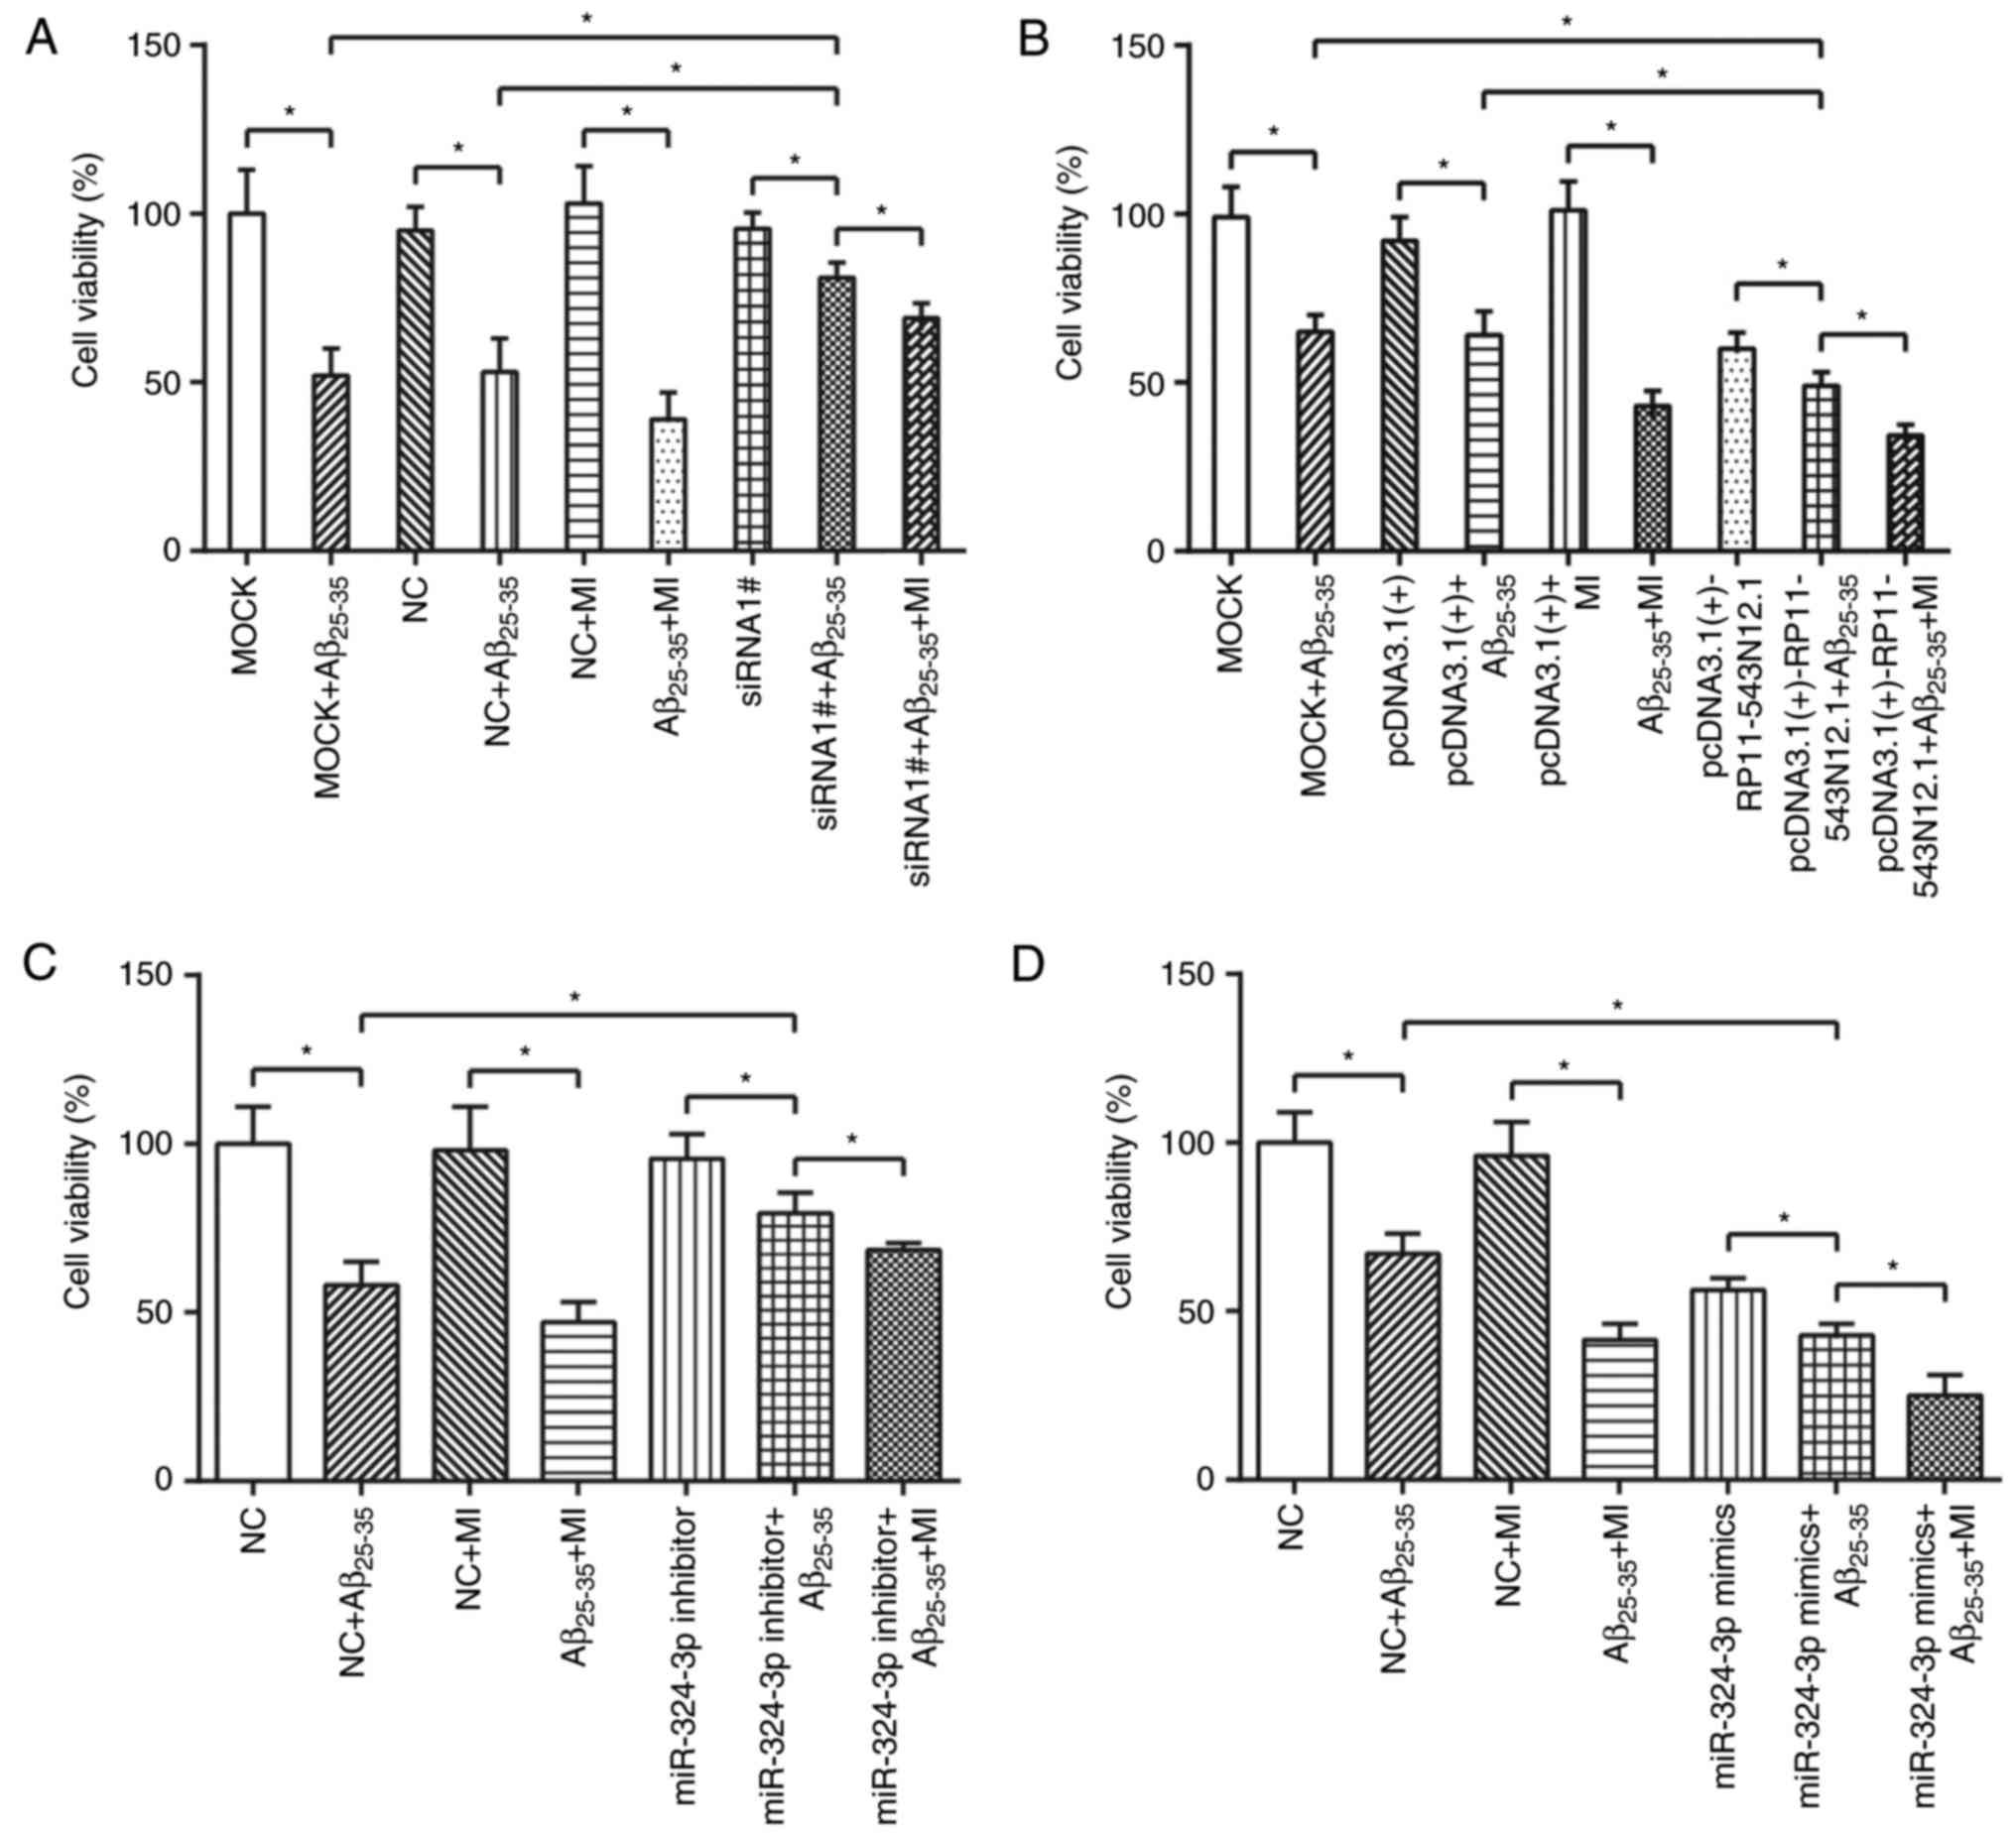
RP11-543N12.1, miR-324-3p and MI
contribute to reduction of cell viability and promotion of cell
apoptosis
The results derived of the MTT assay (Fig. 6A) revealed that the cell activity
of the MOCK+Aβ25–35 and NC+Aβ25–35 groups was
significantly inhibited compared with in the MOCK and NC groups,
respectively (P<0.05). Additionally, the cell viability of the
Aβ25–35+MI group was significantly reduced compared with
in the NC+MI group (P<0.05; Fig.
6A). The dual treatments of RP11-543N12.1-siRNA1# and
Aβ25–35 (RP11-543N12.1-siRNA1#+Aβ25–35 group)
significantly increased cell viability compared with in
MOCK+Aβ25–35 or NC+Aβ25–35 group (P<0.05);
however, the RP11-543N12.1-siRNA1#+Aβ25–35+MI group
exhibited significantly lowered cell viability compared with in the
RP11-543N12.1-siRNA1#+Aβ25–35 group (P<0.05; Fig. 6A). On the contrary, the
pcDNA3.1(+)-RP11-543N12.1+Aβ25–35 group exhibited
significantly reduced cell viability when compared with in
MOCK+Aβ25–35 or pcDNA3.1(+)+Aβ25–35 group
(P<0.05; Fig. 6B). In
addition, the cell viability of the pcDNA3.1(+)-RP1
1-543N12.1+Aβ25–35+MI group was significantly lower than
that of the pcDNA3.1(+)-RP11-543N12.1+Aβ25–35 group
(P<0.05; Fig. 6B). Thus, it
was suggested that RP11-543N12.1 may promote the inhibiting effects
of Aβ25–35 on cell viability, and that MI may enhance
the inhibitory effects of Aβ25–35 exerted on cell
viability.
Similarly, transfection with miR-324-3p inhibitor
followed by the addition of Aβ25–35 for 48 h
demonstrated significant increases in cell viability compared with
in the NC+Aβ25–35 group (P<0.05), yet the miR-324-3p
inhibitor+Aβ25–35+MI group exhibited significantly
decreased cell viability than that of the miR-324-3p
inhibitor+Aβ25–35 group (P<0.05; Fig. 6C). Transfection with miR-324-3p
mimic affected the cell ability in a manner that was contrary to
that miR-324-3p inhibitor alone (P<0.05; Fig. 6D). Thus, it was hypothesized that
the effects of MI and inhibited miR-324-3p expression may act in a
synergic manner as for their roles in the reduced ability of
SH-SY5Y cells induced by Aβ25–35.
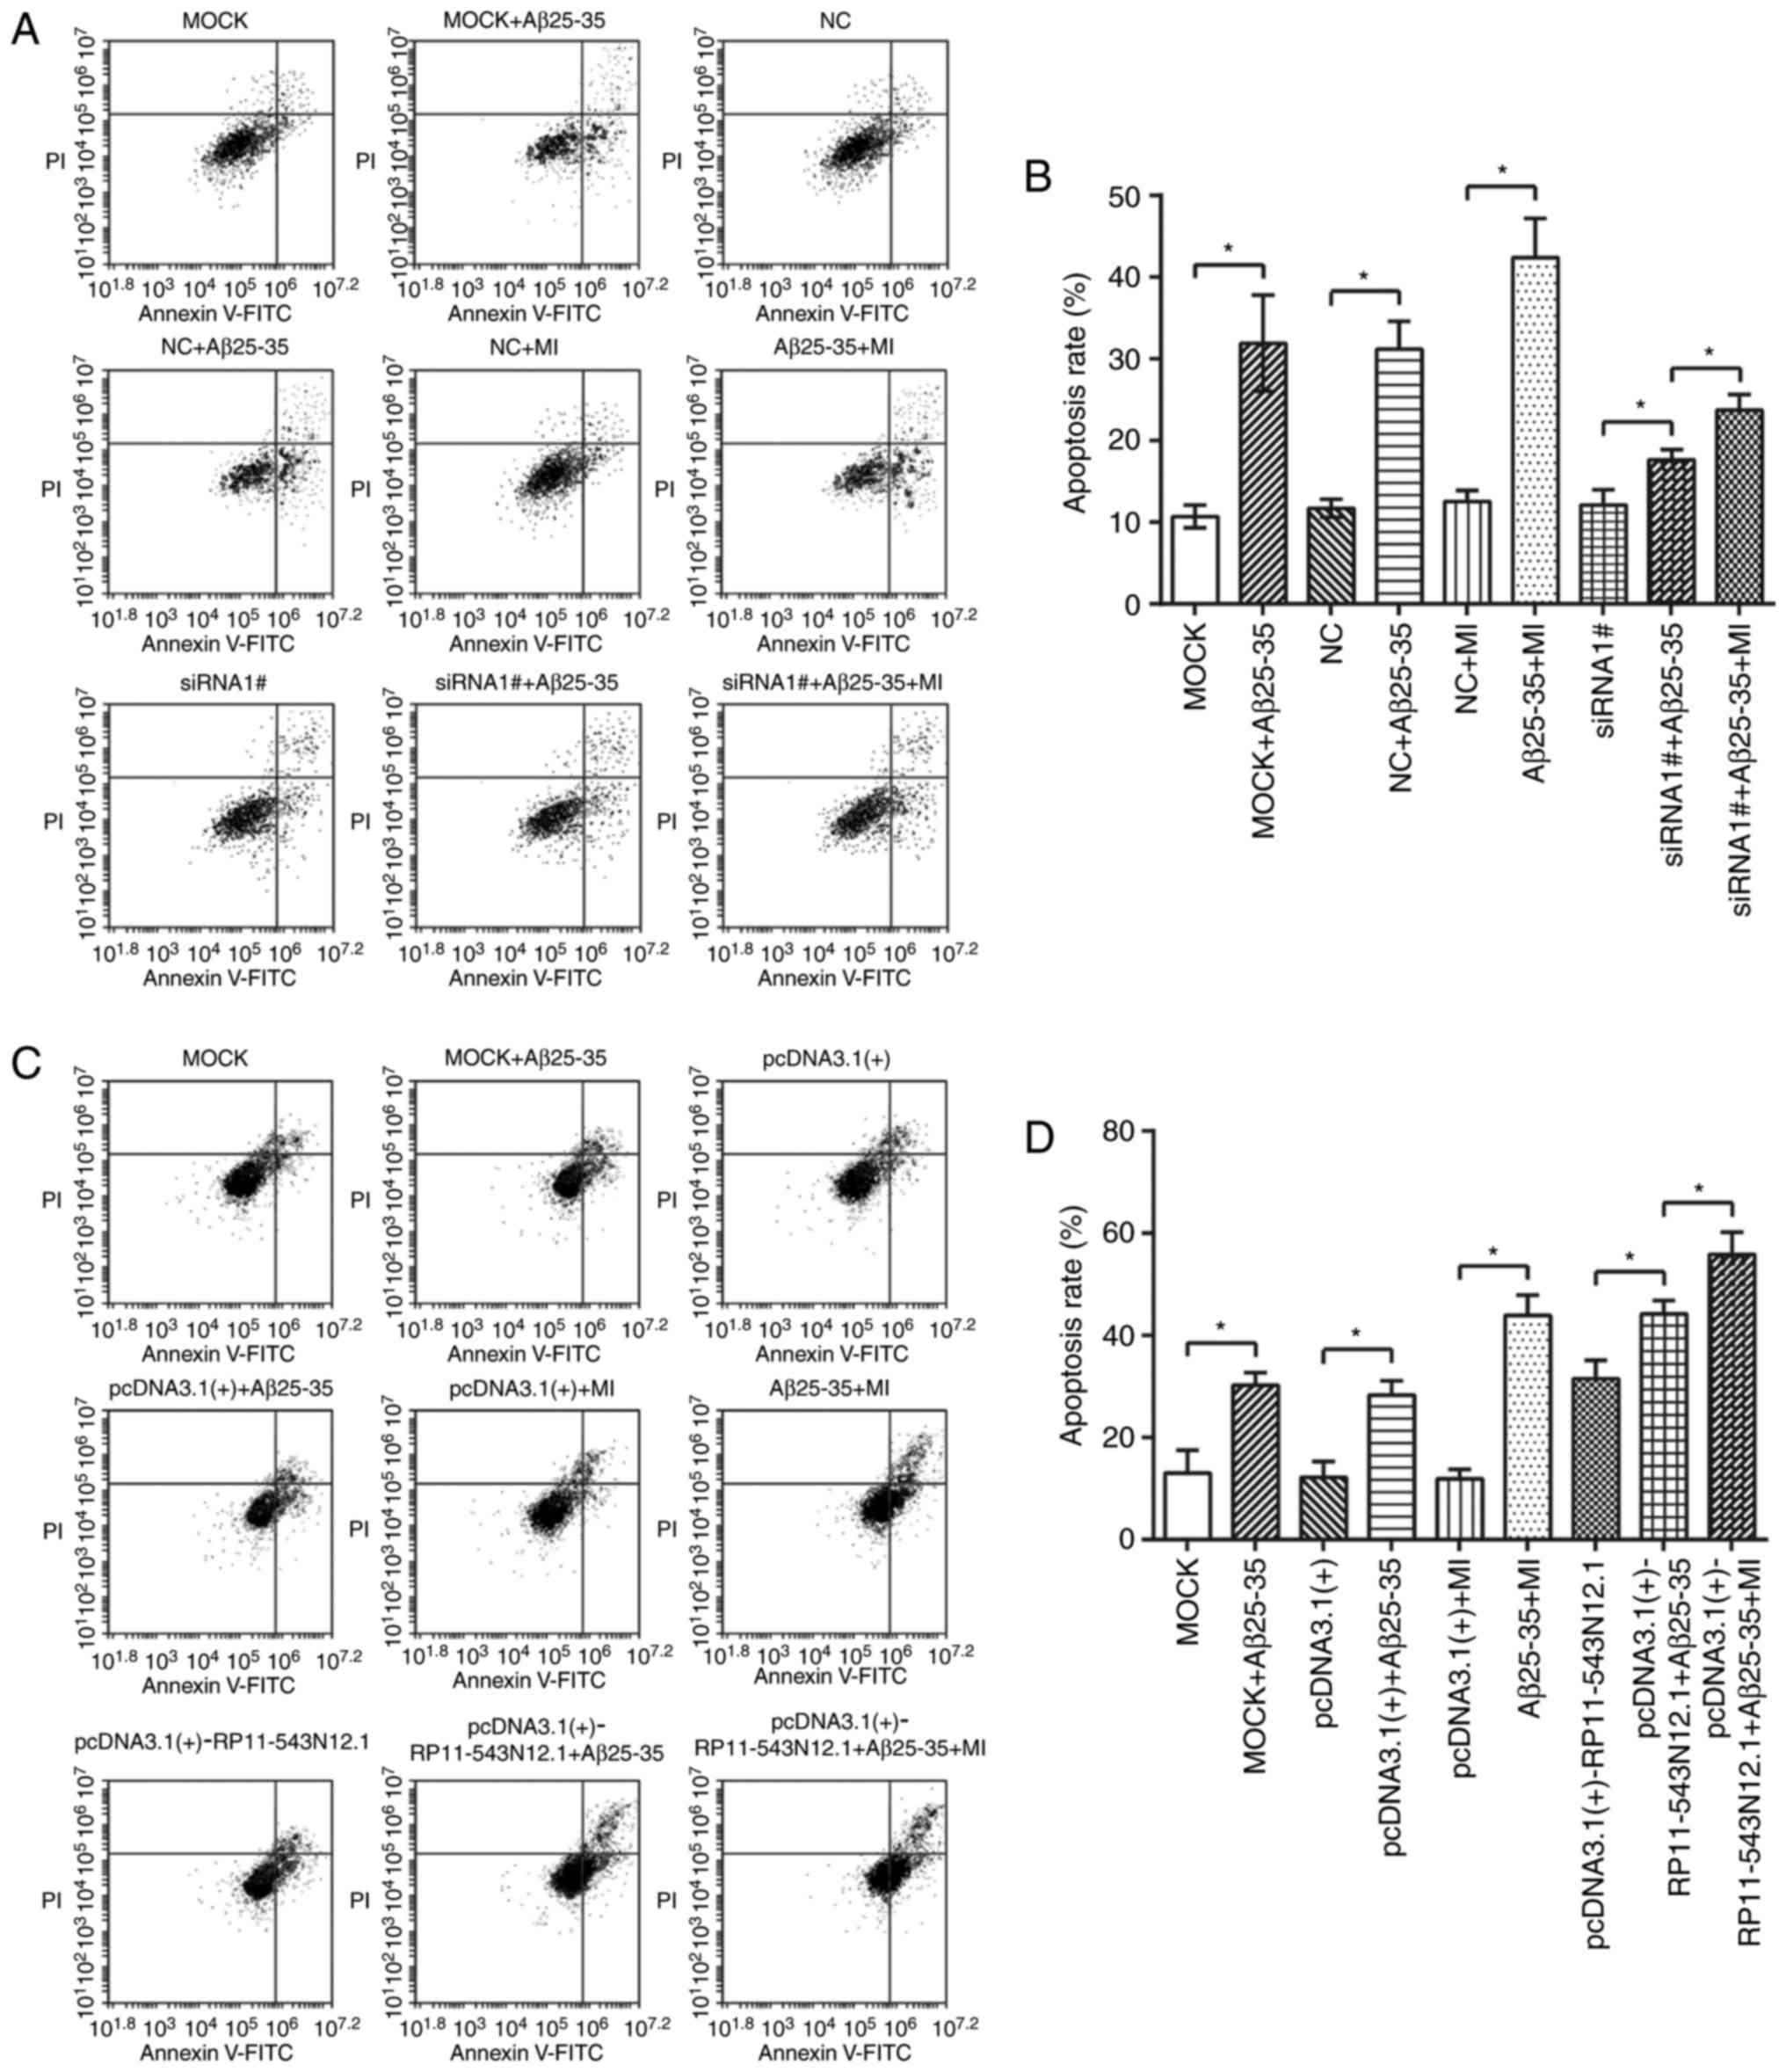
RP11-543N12.1, miR-324-3p and MI led to
promoted cell apoptosis
For the cell groups transfected with
RP11-543N12.1-siRNA, the apoptotic rate of the
MOCK+Aβ25–35 and NC+Aβ25–35 groups appeared
to exceed that of the MOCK and NC groups, respectively (P<0.05;
Fig. 7A). In addition, the
apoptotic rate of siRNA1#+Aβ25–35 group was
significantly lower than that of the MOCK+Aβ25–35 group
(P<0.05); the apoptotic rate of siRNA1#+Aβ25–35+MI
group was significantly upregulated compared with in the
siRNA1#+Aβ25–35 group (P<0.05; Fig. 7A). In contrast, the
pcDNA3.1(+)-RP11-543N12.1+Aβ25–35 group was associated
with a significantly higher apoptotic rate than that of the
MOCK+Aβ25–35 group (P<0.05); the
pcDNA3.1(+)-RP11-543N 12.1+Aβ25–35+MI group exhibited
significantly increased rates of apoptosis compared with in the
pcDNA3.1(+)-RP11-543N12.1+Aβ25–35 group (P<0.05;
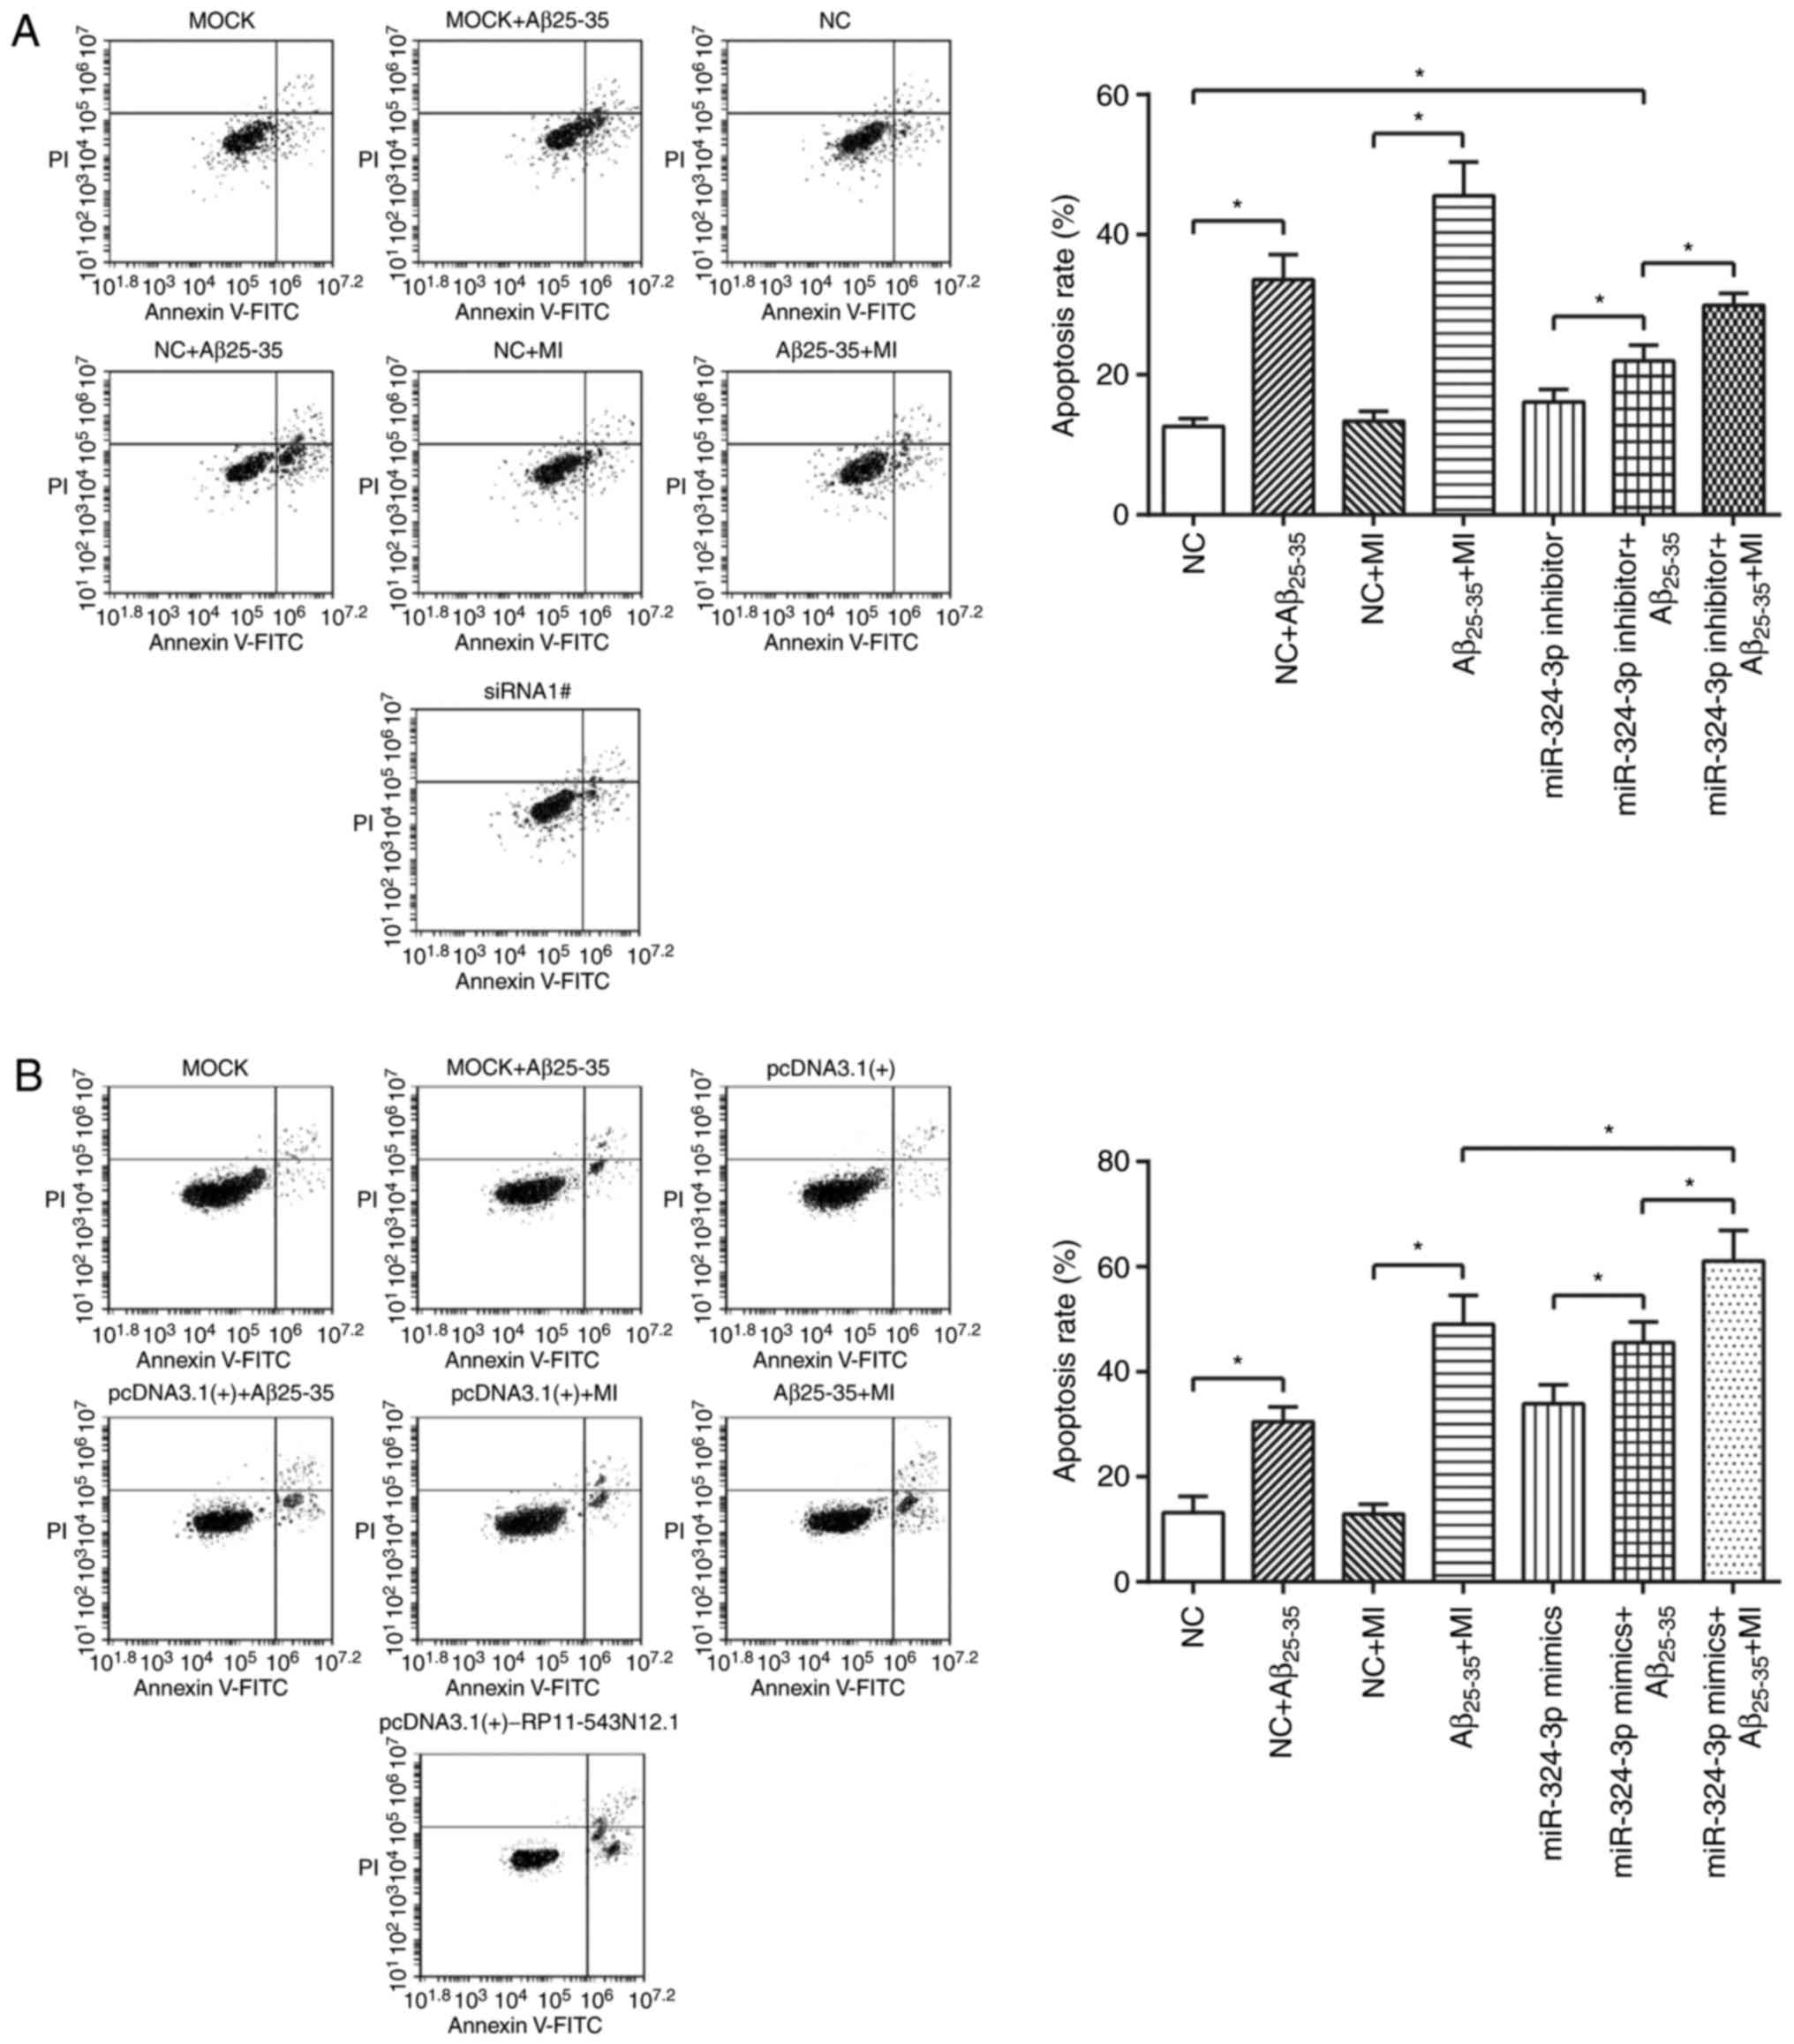
Fig. 7B). Furthermore, the
apoptotic rate of miR-324-3p inhibitor+Aβ25–35 group was
significantly higher than that of NC group (P<0.05); the
miR-324-3p inhibitor+Aβ25–35+MI group exhibited
significantly increased apoptotic rates compared with in miR-324-3p
inhibitor+Aβ25–35 group (P<0.05; Fig. 8A). Additionally, miR-324-3p
mimic+Aβ25–35+MI group exhibited significantly enhanced
apoptosis rate compared with the miR-324-3p
mimic+Aβ25–35 group; however, notable increase was
observed compared with in the Aβ25–35+MI group
(P<0.05; Fig. 8B).
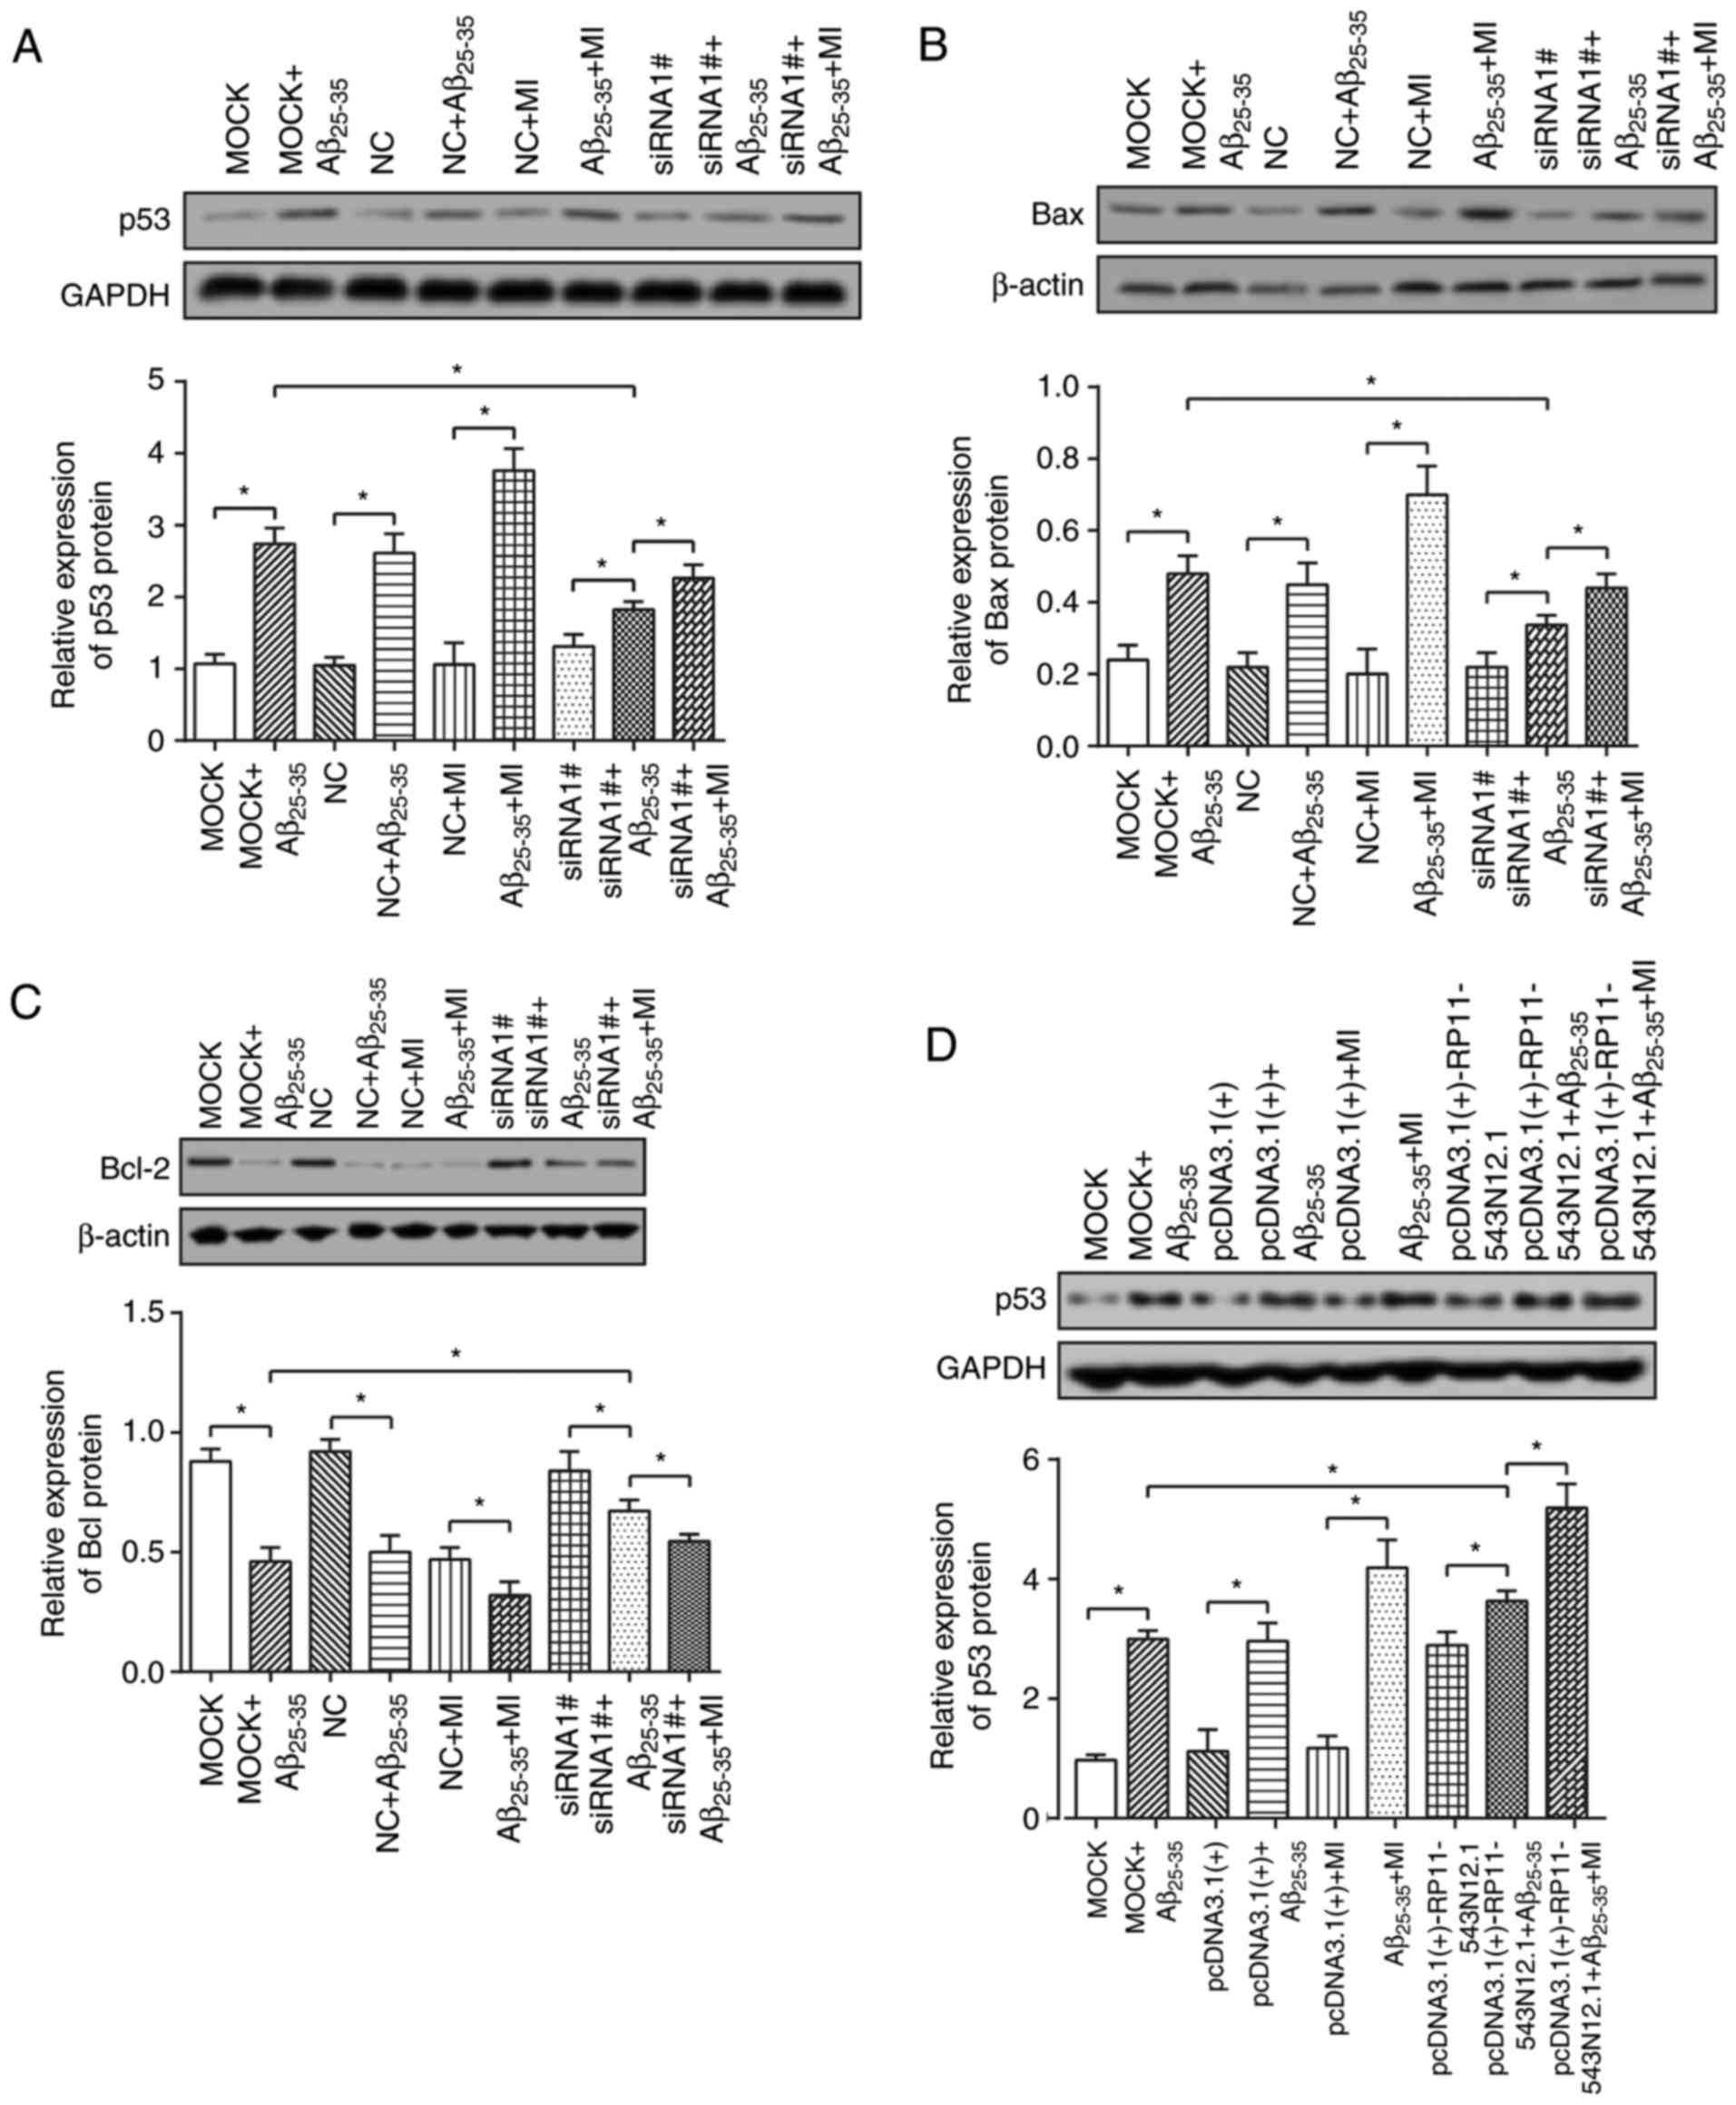
Effects of RP11-543N12.1 and miR-324-3p
on the expressions of apoptosis-associated proteins
Increases in p53 and Bax expression levels, as well
as reduced Bcl-2 expressions levels were observed in the
MOCK+Aβ25–35 and NC+Aβ25–35 groups compared
with in the MOCK and NC groups (P<0.05; Fig. 9A–F). Also, compared with in the
MOCK+Aβ25–35 group, the siRNA1#+Aβ25–35 group
revealed significantly elevated the Bcl-2 expression levels; p53
and Bax expression levels were significantly decreased (P<0.05;
Fig. 9A–C). However, the
pcDNA3.1(+)-RP11-543N12.1+Aβ25–35 group revealed
significantly downregulated Bcl-2 expression and upregulated p53
expression compared with in the MOCK+Aβ25–35
group(P<0.05) (Fig. 9D–F).
Furthermore, the addition of MI significantly
(siRNA1#+Aβ25–35+MI group) reversed the effects of
siRNA1# (siRNA1#+Aβ25–35 group) on the expression of
apoptosis-associated proteins, upregulating p53/Bax expression
levels and downregulating Bcl-2 expression levels (P<0.05).
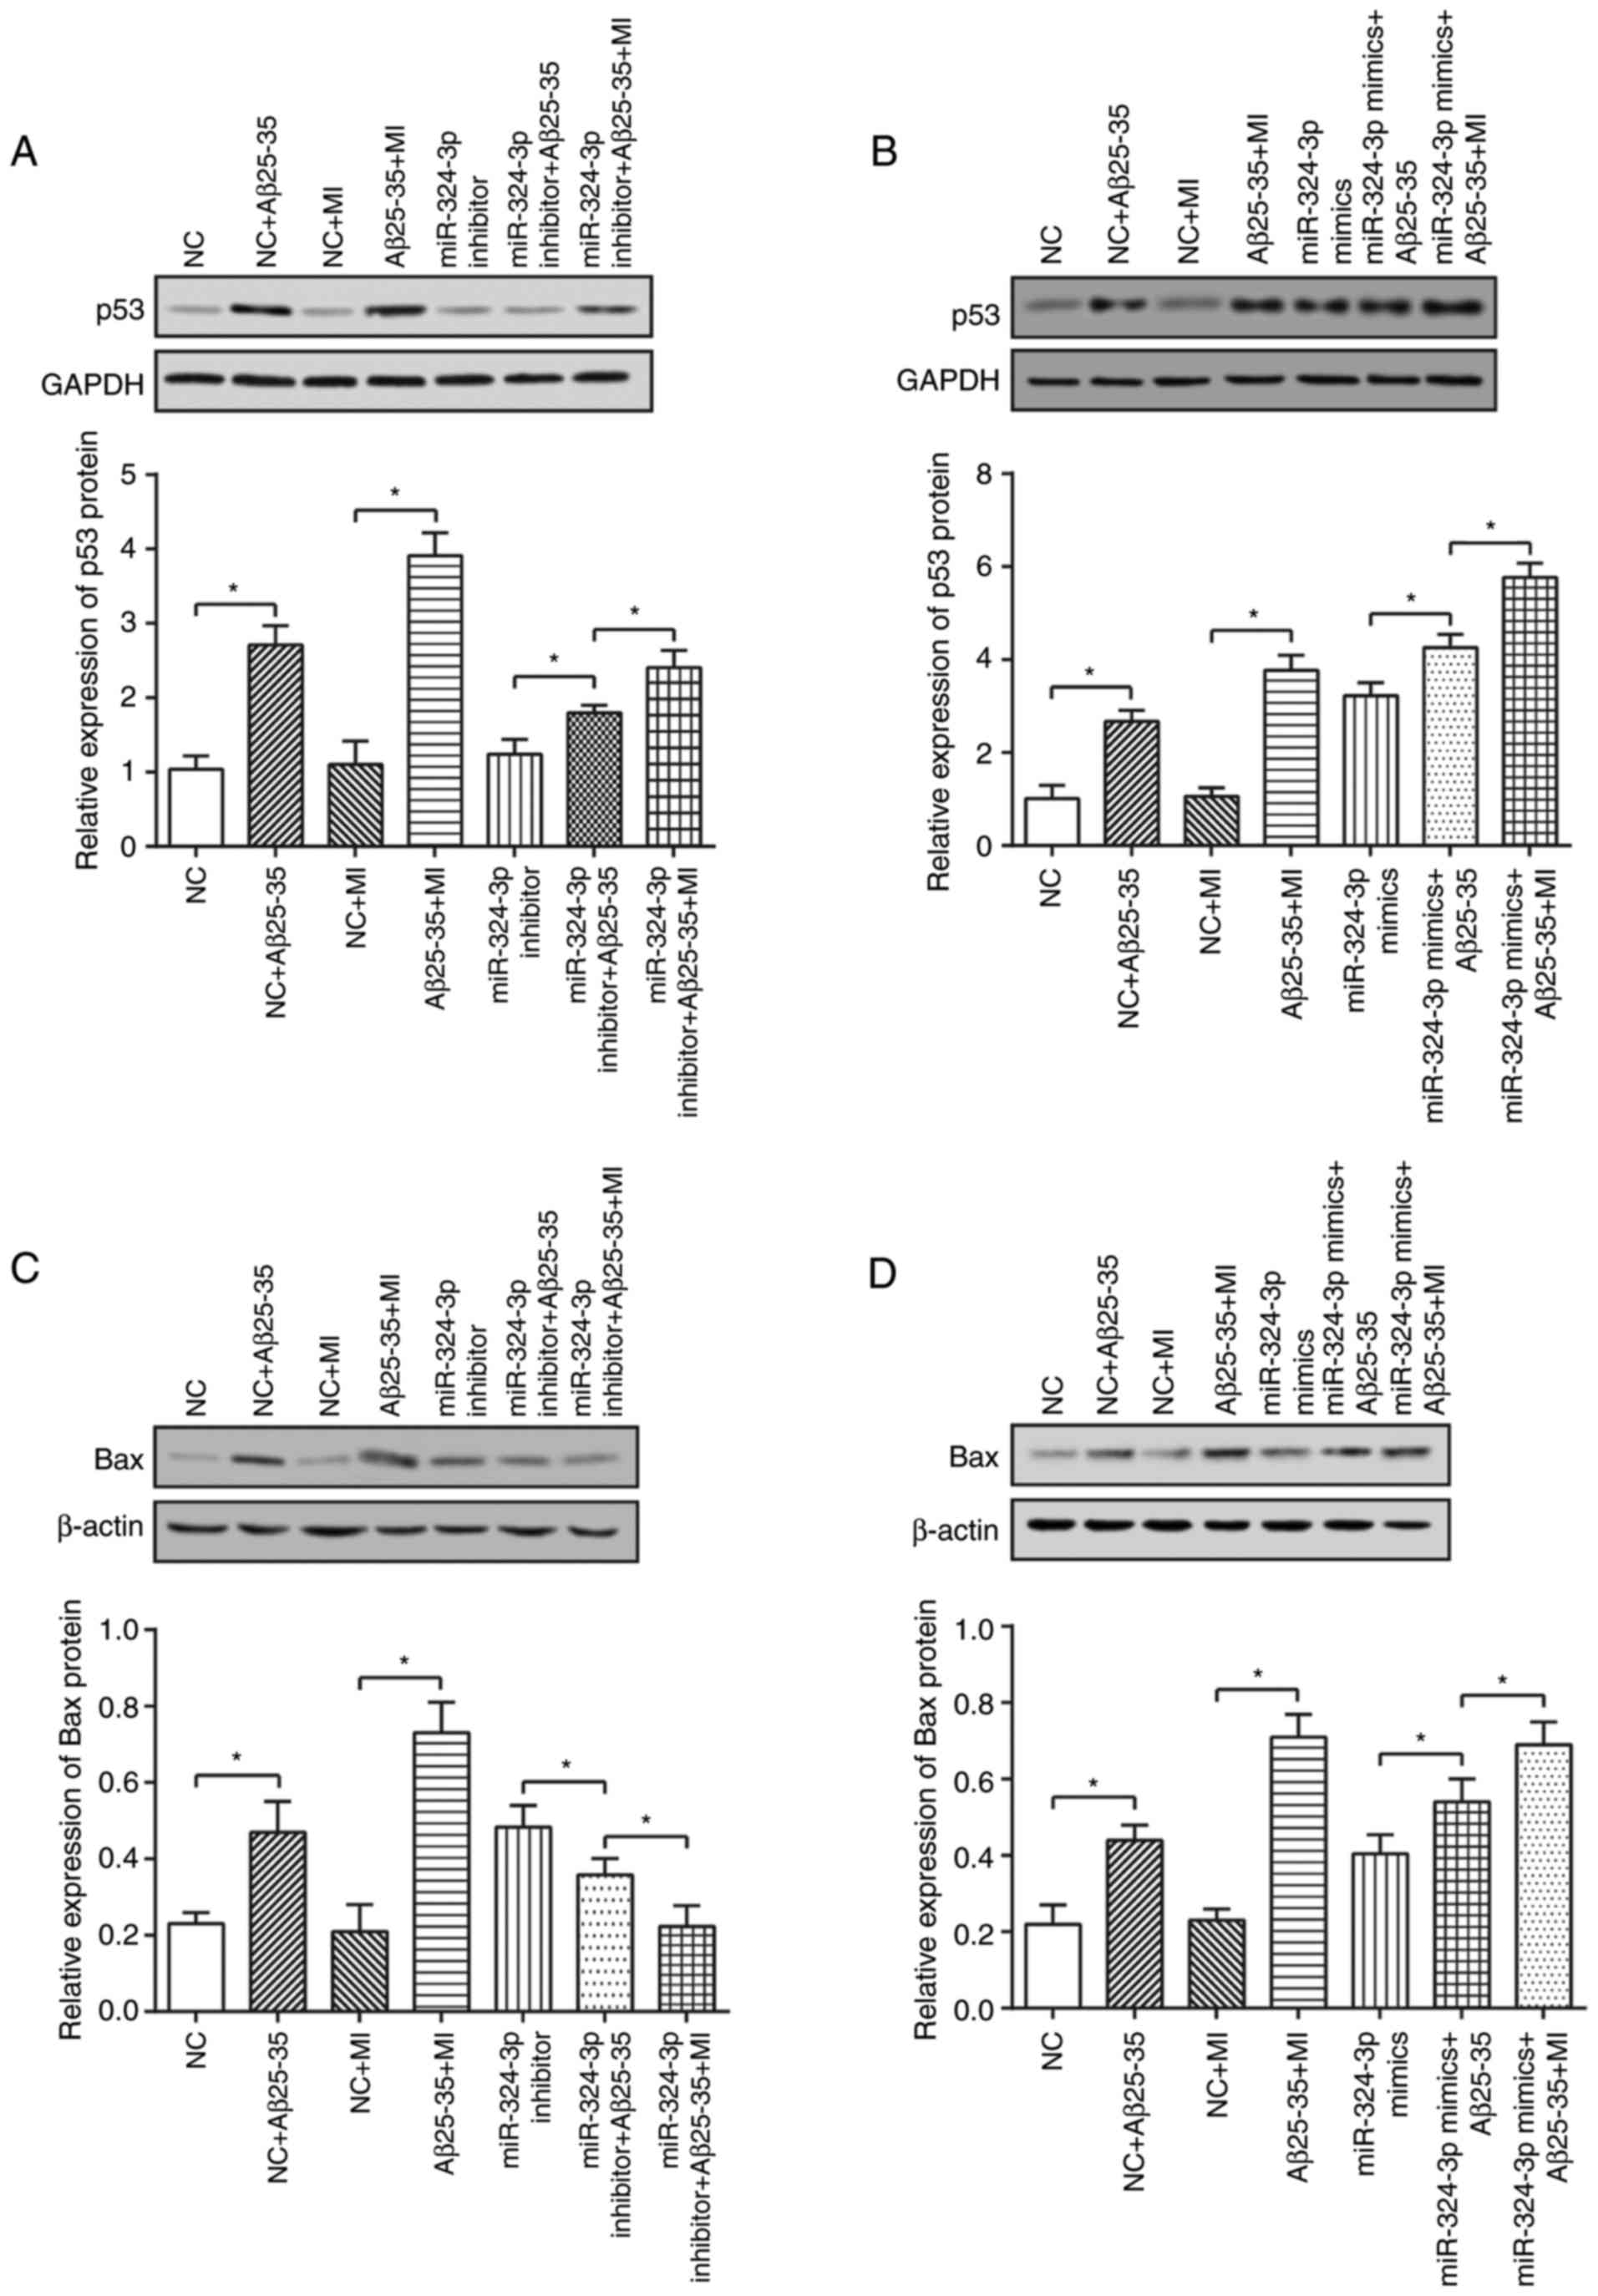
In addition, the miR-324-3p
inhibitor+Aβ25–35 group was exhibited significantly
reduced p53 and Bax expression levels, as well as increased Bcl-2
expression levels compared with in the NC+Aβ25–35 group
(P<0.05; Fig. 10A–C).
Furthermore, the miR-324-3p mimic+Aβ25–35 group
exhibited increased p53 and Bax expressions, along with decreased
Bcl-2 expressions compared with in the NC+Aβ25–35 group
as the control (P<0.05; Fig.
10D–F).
Overexpression of RP11-543N12.1 and
miR-324-3p further elevates the ability of MI to secrete
inflammatory molecules within SH-SY5Y cells
Under the stimulation of Aβ25–35, the
secretion levels of TNF-α, IL-6 and NO in the supernatants of the
activated MI culture solution increased from 3.39 to 32.78 ng/ml,
from 9.67 to 204.16 pg/ml, and from 2.69 to 40.64 µmol/l,
respectively (P<0.05). The levels of TNF-α, IL-6 and NO secreted
by MI markedly dropped when co-cultured with SH-SY5Y cells
transfected with RP11-543N12.1-siRNA or miR-324-3p inhibitor
(P<0.05), although they remained higher than those of the
control group (Table II). By
contrast, co-culturing with SH-SY5Y cells transfected with
pcDNA3.1(+)-RP11-543N12.1 or miR-324-3p mimics enable further
elevation of TNF-α, IL-6 and NO levels secreted by MI
(P<0.05).
| Table IISecretion level of inflammatory
molecules (TNF-α, IL-6 and NO) affected by MI and Aβ25–35. |
Table II
Secretion level of inflammatory
molecules (TNF-α, IL-6 and NO) affected by MI and Aβ25–35.
| Group | TNF-α (ng/ml) | IL-6 (pg/ml) | NO
(µmol/l) |
|---|
| Control | 3.39±0.39 | 9.67±3.05 | 2.69±0.54 |
| Aβ25–35+MI | 32.78±2.21a |
204.16±19.44a | 40.64±3.16a |
|
RP11-543N12.1-siRNA-1 + Aβ25–35+MI | 4.56±0.78 | 9.12±2.45 | 3.01±0.82 |
|
pcDNA3.1(+)-RP11-543N12.1 +
Aβ25–35+MI | 47.23±3.25a |
284.32±22.78a | 55.85±6.13a |
| miR-324-3p
inhibitor + Aβ25–35+MI | 5.12±0.47a | 11.03±1.98 | 4.93±0.75a |
| miR-324-3p mimics +
Aβ25–35+MI | 43.63±2.94a |
253.89±19.78a | 49.71±7.31a |
Discussion
A large number of studies have demonstrated that
lncRNAs are involved in essential biological processes, including
pluripotency maintenance, genomic imprinting and immune responses
(23–25). Recently, specific lncRNAs were
reported to serve a crucial role in the development of AD, for
instance, the lncRNAs AP000265, KB-1460A1.5 and RP11-145M9.4 were
identified to accelerate presence of intracellular neurofibrillary
tangle, which is a major etiology of AD (26–28). In the present study, a cell model
of AD was established through treating neuroblastoma SH-SY5Y cells
with Aβ25–35, and the successful construction of the AD
cell model was verified by detecting the total tau and P-tau
expression levels. Consistent with a previous study (29), the current microarray results
demonstrated that RP11-543N12.1 was differentially expressed
between Aβ25–35-treated and control cells (P<0.05;
Figs. 2 and 3).
lncRNAs have been demonstrated to compete with miRNA
target genes by sharing common miRNA-binding sites, thereby
relieving miRNA-mediated target inhibition (26). Similarly, in the present study,
the targeted association of RP11-543N12.1 and miR-324-3p was
predicted based on the miRDB4.0 and PITA databases, and a
dual-luciferase reporter assay was conducted to elucidate relative
mechanisms. As a consequence, the present study results indicated
that miR-324-3p was a target gene of RP11-543N12.1, and that
miR-324-3p expression was significantly increased upon the direct
binding of RP11-543N12.1 to the 3′-untranslated region of
miR-324-3p.
It was previously revealed that lncRNAs was able to
regulate cell proliferation and apoptosis (30), while miR-324-3p is believed to be
a multi-functional miRNA involved in the proliferation and
apoptosis of cancer cells (31,32). More specifically, miR-324-3p
participated in modulating the apoptotic status of nasopharyngeal
carcinoma cells via targeting and upregulating the expression of
downstream SMAD7 (31). In order
to further ascertain the apoptosis-associated mechanisms of
miR-324-3p and RP11-543N12.1 within AD cells,
pcDNA3.1(+)-RP11-543N12.1, miR-324-3p mimics, RP11-543N12.1-siRNA
and miR-324-3p inhibitor were respectively transfected into SH-SY5Y
cells in the present study. The finding revealed that upregulation
of RP11-543N12.1 and miR-324-3p not only suppressed the
proliferation of SH-SY5Y cells, but also promoted their apoptosis.
By contrast, inhibition of RP11-543N12.1 and miR-324-3p expression
increased SH-SY5Y cell proliferation and inhibited their apoptosis.
Furthermore, the study identified that the co-culture of MI with
SH-SY5Y cells that were transfected with pcDNA3.1(+)-RP11-543N12.1
or miR-324-3p mimics significantly enhanced the apoptosis of
SH-SY5Y cells (P<0.05). Thus, these data indicated that the
expression of miR-324-3p was modulated by RP11-543N12.1, and that
RP11-543N12.1 was able to increase the apoptosis of SH-SY5Y cells
by upregulating miR-324-3p.
Bcl-2 is a direct participant in cell apoptosis and
has an anti-apoptotic effect (33). Previous studies have suggested
that Bcl-2 was lowly expressed or even not expressed within
apoptotic cells (34). The tumor
suppressor p53 was reported to induce cell apoptosis by inhibition
of Bcl-2 expression, which was mediated by the direct binding of
p53 to a negative portion that was beyond the range of the Bcl-2
promoter (35). Moreover, Bcl-2
promoted cell apoptosis, yet Bax contributed to decreased cell
apoptosis (36). Therefore, these
three molecules were selected to assess the apoptotic condition of
SH-SY5Y cells in the current study. In agreement with the
aforementioned studies, the current results indicated higher p53
and Bax activities, as well as increased apoptosis rate, in cells
transfected with pcDNA3.1(+)-RP11-543N12.1 and miR-324-3p mimics.
By contrast, lower p53 and Bax activities, accompanied with
decreased apoptosis rate, were examined within cells transfected
with pcDNA3.1(+)-RP11-543N12.1 and miR-324-3p mimics. Taken
together, RP11-543N12.1 and miR-324-3p served as two parameters
promoting the apoptosis of SH-SY5Y cells, which is a crucial step
in the facilitation of AD onset.
As previously reported, chronic or sustained
inflammatory signaling usually contribute to multiple pathological
and degenerative conditions, including AD and cancer (37). In addition, MI responds to
AD-relevant Aβ by releasing pro-inflammatory factors (such as NO,
reactive oxygen species and prostaglandin E2), cytokines (such as
TNF-α, IL-1β and IL-6), and chemotactic factors that attract
monocytes and T-cells to the inflammation region (38). In the present study, the
expression levels of TNF-α, IL-6 and NO were higher when MI cells
were co-cultured with RP11-543N12.1- or miR-324-3p-overexpressing
SH-SY5Y cells, verifying that RP11-543N12.1 participated in the
MI-mediated inflammatory pathway by binding to miR-324-3p.
In conclusion, the present study revealed that
RP11-543N12.1 inhibited the proliferation and promoted the
apoptosis of an AD cell model through positively regulating
miR-324-3p. It is thus suggested that RP11-543N12.1 and miR-324-3p
may serve as effective biomarkers and therapeutic targets for AD in
the future. However, only an AD cell model was used in the current
study, therefore, it is highly recommended that animal models are
also established to validate the aforementioned mechanism.
Simultaneously, clinical specimens should be gathered to verify
whether RP11-543N12.1 and miR-324-3p follow the tendencies
suggested by the microarray analysis. Ultimately, further direct
associations among the lncRNA RP11-543N12.1/miR-324-3p axis, MIs
and SH-SY5Y cells may be explored in the future; thus, whether the
inflammatory factors secreted by MI cells affect the transcription
of specific lncRNAs, miRNAs or mRNAs should be further
investigated.
Acknowledgments
Not applicable.
Funding
This study was supported by the Public Welfare
Project from the Science Technology Department of Zhejiang Province
(grant no. 2015C33135).
Availability of data and materials
All data generated or analyzed during this study are
included in this article.
Authors' contributions
MC, YW and SX conceived and designed the
experiments. MC, YW, SX, SQ, QS, JD, YL and XL performed the
experiments. SQ, QS and JD analyzed the data. YL and XL drafted the
manuscript. All authors read and approved the final manuscript.
Ethics approval and consent to
participate
All participants provided written informed consent.
The present study was approved by the Ethics committee of Zhejiang
Hospital (Hangzhou, China).
Patient consent for publication
Not applicable.
Competing interests
The authors declare that they have no competing
interests.
References
|
1
|
D'Amore JD, Kajdasz ST, McLellan ME,
Bacskai BJ, Stern EA and Hyman BT: In vivo multiphoton imaging of a
transgenic mouse model of Alzheimer disease reveals marked
thioflavine-S-associated alterations in neurite trajectories. J
Neuropathol Exp Neurol. 62:137–145. 2003. View Article : Google Scholar : PubMed/NCBI
|
|
2
|
Yoshiyama Y, Higuchi M, Zhang B, Huang SM,
Iwata N, Saido TC, Maeda J, Suhara T, Trojanowski JQ and Lee VM:
Synapse loss and microglial activation precede tangles in a P301S
tauopathy mouse model. Neuron. 53:337–351. 2007. View Article : Google Scholar : PubMed/NCBI
|
|
3
|
Lemere CA, Maier M, Jiang L, Peng Y and
Seabrook TJ: Amyloid-beta immunotherapy for the prevention and
treatment of Alzheimer disease: Lessons from mice, monkeys, and
humans. Rejuvenation Res. 9:77–84. 2006. View Article : Google Scholar : PubMed/NCBI
|
|
4
|
Galimberti D and Scarpini E: Progress in
Alzheimer's disease. J Neurol. 259:201–211. 2012. View Article : Google Scholar
|
|
5
|
Alzheimer's Association: 2010 Alzheimer's
disease facts and figures. Alzheimers Dement. 6:158–194. 2010.
View Article : Google Scholar : PubMed/NCBI
|
|
6
|
Millan MJ: Linking deregulation of
non-coding RNA to the core pathophysiology of Alzheimer's disease:
An integrative review. Prog Neurobiol. 156:1–68. 2017. View Article : Google Scholar : PubMed/NCBI
|
|
7
|
Qi X, Shao M, Sun H, Shen Y, Meng D and
Huo W: Long non-coding RNA SNHG14 promotes microglia activation by
regulating miR-145-5p/PLA2G4A in cerebral infarction. Neuroscience.
348:98–106. 2017. View Article : Google Scholar : PubMed/NCBI
|
|
8
|
Lin ST, Heng MY, Ptáček LJ and Fu YH:
Regulation of myelination in the central nervous system by nuclear
lamin B1 and non-coding RNAs. Transl Neurodegener. 3:42014.
View Article : Google Scholar : PubMed/NCBI
|
|
9
|
Liu X, Hou L, Huang W, Gao Y, Lv X and
Tang J: The mechanism of long non-coding RNA MEG3 for neurons
apoptosis caused by hypoxia: Mediated by miR-181b-12/15-LOX
signaling pathway. Front Cell Neuroscie. 10:2012016.
|
|
10
|
Ko CY, Chu YY, Narumiya S, Chi JY,
Furuyashiki T, Aoki T, Wang SM, Chang WC and Wang JM:
CCAAT/enhancer-binding protein delta/miR135a/thrombospondin 1 axis
mediates PGE2-induced angiogenesis in Alzheimer's disease.
Neurobiol Aging. 36:1356–1368. 2015. View Article : Google Scholar : PubMed/NCBI
|
|
11
|
Zhao Y, Bhattacharjee S, Jones BM, Dua P,
Alexandrov PN, Hill JM and Lukiw WJ: Regulation of TREM2 expression
by an NF-κB-sensitive miRNA-34a. Neuroreport. 24:318–323. 2013.
View Article : Google Scholar : PubMed/NCBI
|
|
12
|
Jayadev S, Case A, Alajajian B, Eastman
AJ, Möller T and Garden GA: Presenilin 2 influences miR146 level
and activity in microglia. J Neurochem. 127:592–599. 2013.
View Article : Google Scholar : PubMed/NCBI
|
|
13
|
Dharap A, Pokrzywa C, Murali S, Pandi G
and Vemuganti R: MicroRNA miR-324-3p induces promoter-mediated
expression of RelA gene. PLoS One. 8:e794672013. View Article : Google Scholar : PubMed/NCBI
|
|
14
|
Gutierrez H, O'Keeffe GW, Gavaldà N,
Gallagher D and Davies AM: Nuclear factor kappa B signaling either
stimulates or inhibits neurite growth depending on the
phosphorylation status of p65/RelA. J Neurosci. 28:8246–8256. 2008.
View Article : Google Scholar : PubMed/NCBI
|
|
15
|
Peng Y, Gallagher SF, Landmann R, Haines K
and Murr MM: The role of p65 NF-kappaB/RelA in pancreatitis-induced
Kupffer cell apoptosis. J Gastrointest Surg. 10:837–847. 2006.
View Article : Google Scholar : PubMed/NCBI
|
|
16
|
Sheehy AM and Schlissel MS: Overexpression
of RelA causes G1 arrest and apoptosis in a pro-B cell line. J Biol
Chem. 274:8708–8716. 1999. View Article : Google Scholar : PubMed/NCBI
|
|
17
|
Shankar GM, Li S, Mehta TH, Garcia-Munoz
A, Shepardson NE, Smith I, Brett FM, Farrell MA, Rowan MJ, Lemere
CA, et al: Amyloid-beta protein dimers isolated directly from
Alzheimer's brains impair synaptic plasticity and memory. Nat Med.
14:837–842. 2008. View
Article : Google Scholar : PubMed/NCBI
|
|
18
|
McGeer EG and McGeer PL: Inflammatory
processes in Alzheimer's disease. Prog Neuropsychopharmacol Biol
Psychiatry. 27:741–749. 2003. View Article : Google Scholar : PubMed/NCBI
|
|
19
|
Dobrenis K: Microglia in cell culture and
in transplantation therapy for central nervous system disease.
Methods. 16:320–344. 1998. View Article : Google Scholar
|
|
20
|
Tan AM, Zhao P, Waxman SG and Hains BC:
Early microglial inhibition preemptively mitigates chronic pain
development after experimental spinal cord injury. J Rehabil Res
Dev. 46:123–133. 2009. View Article : Google Scholar : PubMed/NCBI
|
|
21
|
Roth R, Madhani HD and Garcia JF: Total
RNA isolation and quantification of specific RNAs in fission yeast.
Methods Mol Biol. 1721:63–72. 2018. View Article : Google Scholar : PubMed/NCBI
|
|
22
|
Livak KJ and Schmittgen TD: Analysis of
relative gene expression data using real-time quantitative PCR and
the 2−ΔΔCT method. Methods. 25:402–408. 2001. View Article : Google Scholar
|
|
23
|
Mercer TR, Dinger ME and Mattick JS: Long
non-coding RNAs: Insights into functions. Nat Rev Genet.
10:155–159. 2009. View Article : Google Scholar : PubMed/NCBI
|
|
24
|
Wu P, Zuo X, Deng H, Liu X, Liu L and Ji
A: Roles of long noncoding RNAs in brain development, functional
diversification and neurodegenerative diseases. Brain Res Bull.
97:69–80. 2013. View Article : Google Scholar : PubMed/NCBI
|
|
25
|
Batista PJ and Chang HY: Long noncoding
RNAs: Cellular address codes in development and disease. Cell.
152:1298–1307. 2013. View Article : Google Scholar : PubMed/NCBI
|
|
26
|
Wang LK, Chen XF, He DD, Li Y and Fu J:
Dissection of functional lncRNAs in Alzheimer's disease by
construction and analysis of lncRNA-mRNA networks based on
competitive endogenous RNAs. Biochem Biophys Res Commun.
485:569–576. 2017. View Article : Google Scholar
|
|
27
|
Ciarlo E, Massone S, Penna I, Nizzari M,
Gigoni A, Dieci G, Russo C, Florio T, Cancedda R and Pagano A: An
intronic ncRNA-dependent regulation of SORL1 expression affecting
Aβ formation is upregulated in post-mortem Alzheimer's disease
brain samples. Dis Model Mech. 6:424–433. 2013. View Article : Google Scholar
|
|
28
|
Mus E, Hof PR and Tiedge H: Dendritic
BC200 RNA in aging and in Alzheimer's disease. Proc Natl Acad Sci
USA. 104:10679–10684. 2007. View Article : Google Scholar : PubMed/NCBI
|
|
29
|
Zhou X and Xu J: Identification of
Alzheimer's disease-associated long noncoding RNAs. Neurobiol
Aging. 36:2925–2931. 2015. View Article : Google Scholar : PubMed/NCBI
|
|
30
|
Yan B and Wang Z: Long noncoding RNA: Its
physiological and pathological roles. DNA Cell Biol. 31(Suppl 1):
S34–S41. 2012. View Article : Google Scholar : PubMed/NCBI
|
|
31
|
Xu J, Ai Q, Cao H and Liu Q: MiR-185-3p
and miR-324-3p predict radiosensitivity of nasopharyngeal carcinoma
and modulate cancer cell growth and apoptosis by targeting SMAD7.
Med Sci Monit. 21:2828–2836. 2015. View Article : Google Scholar : PubMed/NCBI
|
|
32
|
Kuo WT, Yu SY, Li SC, Lam HC, Chang HT,
Chen WS, Yeh CY, Hung SF, Liu TC, Wu T, et al: MicroRNA-324 in
human cancer: miR-324-5p and miR-324-3p have distinct biological
functions in human cancer. Anticancer Res. 36:5189–5196. 2016.
View Article : Google Scholar : PubMed/NCBI
|
|
33
|
Liu N, Zheng Y, Zhu Y, Xiong S and Chu Y:
Selective impairment of CD4+CD25+Foxp3+ regulatory T cells by
paclitaxel is explained by Bcl-2/Bax mediated apoptosis. Int
Immunopharmacol. 11:212–219. 2011. View Article : Google Scholar
|
|
34
|
Yang Q, Yang K and Li A: microRNA-21
protects against ischemia-reperfusion and
hypoxia-reperfusion-induced cardiocyte apoptosis via the
phosphatase and tensin homolog/Akt-dependent mechanism. Mol Med
Rep. 9:2213–2220. 2014. View Article : Google Scholar : PubMed/NCBI
|
|
35
|
Miyashita T, Krajewski S, Krajewska M,
Wang HG, Lin HK, Liebermann DA, Hoffman B and Reed JC: Tumor
suppressor p53 is a regulator of bcl-2 and bax gene expression in
vitro and in vivo. Oncogene. 9:1799–1805. 1994.PubMed/NCBI
|
|
36
|
Moshrefi M, Spotin A, Kafil HS,
Mahami-Oskouei M, Baradaran B, Ahmadpour E and Mansoori B: Tumor
suppressor p53 induces apoptosis of host lymphocytes experimentally
infected by Leishmania major, by activation of Bax and caspase-3: A
possible survival mechanism for the parasite. Parasitol Res.
116:2159–2166. 2017. View Article : Google Scholar : PubMed/NCBI
|
|
37
|
Lukiw WJ: NF-κB-regulated, proinflammatory
miRNAs in Alzheimer's disease. Alzheimers Res Ther. 4:472012.
View Article : Google Scholar
|
|
38
|
Lee M: Neurotransmitters and
microglial-mediated neuroinflammation. Curr Protein Pept Sci.
14:21–32. 2013. View Article : Google Scholar : PubMed/NCBI
|