Introduction
The red color of the vertebrate skeletal and cardiac
muscles originates from a high expression level of the respiratory
protein myoglobin (MB) (1,2).
The globin fold of MB harbors an iron-containing heme group that
allows the binding of gaseous ligands such as O2 and
nitric oxide (NO·) (3,4).
The impact of MB as an intracellular O2 storage and
transport molecule was indirectly evidenced when the viability of
Mb−/− mice required compensatory adaptions in
cardiac and striated muscles, including increased vessel densities,
higher blood viscosity and elevated expression of the
hypoxia-inducible transcription factors hypoxia-inducible factor 1α
(HIF1α) and HIF2α (5-7). An additional function of oxygenated
MB (oxy-MB) in aerobic muscles is to convert harmful NO·
to inert nitrate by enzymatic dioxygenase activity (4,8).
Mb−/− mice exhibited a greater sensitivity for
altered NO· concentrations in cardiomyocytes compared
with respective wild-type animals and were more susceptible to
NO·-induced changes in the vascular tone, cardiac
functions and energetic parameters (8). Oxy-MB was further reported to
scavenge toxic reactive oxygen species (ROS) for cell protection in
C2C12 mouse myotubes and in the brain of the common carp (9-11).
Under hypoxia, deoxygenated MB (deoxy-MB) can produce
NO·, as observed in studies on mouse smooth muscle cells
in vivo; this regulates NO·-mediated vasodilation
of adjacent blood vessels in isolated hearts of
Mb+/+ vs. Mb−/− mice, thus
reducing ischemia-induced cardiac damage (12). MB harbors various fatty acid
binding sites with high affinity for palmitic and oleic acid
(13-15). Thus, oxy-MB has been proposed to
bind and transport fatty acids (FAs) and acylcarnitines to
mitochondria in an O2-dependent manner (14,15). In addition, since the
cardiomyocytes of Mb−/− mice were less able to
oxidize fatty acids, older mice developed a lipid overload
phenotype that impaired the heart function (16,17). These results suggested that oxy-MB
may serve a non-canonical role by promoting FA turnover in
vivo.
Ectopic MB expression at a level of 1:100-1:1,000
compared to striated muscle was further reported in several tumor
types, including breast, prostate, non-small lung and colon cancer,
renal cell carcinoma, head and neck squamous cell carcinoma,
osteosarcoma and leukemic bone marrow (18-25). Instead of using the myocytic
standard gene promoter, MB is transcribed from an
alternative upstream promoter region in cancer cells, which can be
specifically induced by hypoxia and silenced by hormonal treatments
(26,27). In addition, MB staining was
enhanced at hypoxic, perinecrotic central areas in avascular,
non-invasive ductal carcinoma in situ (DCIS) breast tumors
(28). Compared to the low-level
expression of MB in the healthy breast epithelium, MB production in
mammary malignancies increases up to 350-fold (29). Overall, MB positivity was detected
in ~40% of primary breast tumors, mainly in a mosaic-like pattern
in luminal-type, estrogen receptor (ER)-positive cases (21), and in ~53% of prostate cancer
tumors, mostly in androgen-receptor positive and poorly
differentiated cases (24).
Kaplan-Meier survival analyses of a large cohort of patients with
mammary carcinoma associated high MB expression with beneficial
prognostic outcomes for cases with positive or negative ERα
receptor status (21).
Additionally, a trend towards prolonged recurrence-free patient
survival was observed for MB-positive compared with -negative
tumors in a cohort of poorly differentiated prostate tumors
(24). In contrast to a
hypothetical tumor-suppressing role of MB in these tumor entities,
patients with lung adenocarcinoma with high MB levels in tumor
biopsies exhibited poor prognostic outcomes (22). This discrepancy indicates
potential tumor type-specific differences for the role of MB in
cancer cells.
Despite a limited number of initial experiments, no
in-depth characterization of the molecular role of MB endogenously
expressed in tumor cells has been achieved. As breast, prostate and
colon cancer exhibit several pathological and biochemical
commonalities, and in order to assess a broader spectrum of
potential molecular functions of MB in epithelial cancers, the
present study aimed to determine the impact of endogenous MB
expression in three different cancer cell lines representing the
above malignancies: MDA-MB468, LNCaP and DLD-1. To keep this
approach free of a priori hypotheses, transcriptome-wide
cDNA sequencing (RNA-Seq) of MB-expressing (MB+)
cancer cell lines and respective RNA interference (RNAi)-mediated
MB-knockdown cells (siMB) was conducted. The
bioinformatic identification of differentially expressed gene
categories and pathways may provide valuable information about the
molecular role of MB in tumor cells.
Materials and methods
Cell culture
MDA-MB468 and DLD-1 cells were cultured in
DMEM/HamsF12 with L-glutamine (PAA Laboratories; GE Healthcare
Bio-Sciences Austria GmbH); LNCaP cells were cultured in RPMI-1640
medium with L-glutamine (Invitrogen; Thermo Fisher Scientific,
Inc.). All cells were supplemented with 10% Fetal Bovine Serum Gold
(PAA Laboratories; GE Healthcare Bio-Sciences Austria GmbH). Hera
cell 240 (MultiTemp Scientific AG), IG150 (Jouan; Thermo Fisher
Scientific, Inc.) and CB 53 (Binder GmbH) incubators were used for
cell culture. For normoxic conditions, cells were cultured in room
air with 5% CO2, whereas hypoxic incubation was
conducted with 1% O2 and 5% CO2; both at 37°C
in H2O-saturated atmosphere. MDA-MB468, DLD-1 and LNCaP
cells were authenticated by SNP typing (Multiplexion GmbH) and
approved for mycoplasma negativity using the VenorGeM Mycoplasma
PCR detection kit (Minerva Biolabs GmbH) prior to experiments.
Transient MB-knockdown cells for all three cell lines were
generated using small interfering (si)RNA. Cells at 50-60%
confluency were seeded in 24-well plates. After 24 h of incubation,
20 pmol MB siRNA (HS_MB_6, 2607575; anti-sense sequence, 5′-UGA UUA
AUC AGA CAA UUG CTA-3′; Qiagen GmbH) or scrambled (scr) RNA (cat.
no. 1022076; Qiagen GmbH) were diluted in Opti-MEM (cat. no.
31985062; Thermo Fisher Scientific, Inc.) for each well.
Lipofectamine® 2000 (1 µl; Thermo Fisher
Scientific, Inc.) was added to 50 µl Opti-MEM and incubated
for 5 min at room temperature. The two prepared solutions were then
gently mixed together and incubated for 20 min at room temperature.
The oligomer-Lipofectamine 2000 complexes were then added to the
cells. After 24 h of incubation, the culture medium was
changed.
RNA-Seq experiments
Following 72 h of incubation under 1% O2
or normoxia, RNA was extracted from cells using the RNeasy Mini kit
(Qiagen GmbH), including the RNase-Free DNase I treatment (Qiagen
GmbH) for DNA digestion. RNA integrity was confirmed using the
Agilent RNA 6000 Nano kit on a 2100 Bioanalyzer (Agilent
Technologies GmbH). RNA samples from four replicate cell passages
were pooled for each condition and cell line. Illumina TruSeq Total
RNA transcriptome libraries (Illumina, Inc.) were generated for the
pools of the siMB cell types (3 cell lines and 2
O2 conditions) and the respective MB+
controls (StarSEQ GmbH). The 50 bp single-end Illumina sequencing
was performed by the next generation sequencing core facility of
the Biology Department of Johannes Gutenberg University (Mainz,
Germany) on an Illumina HiSeq2500 sequencing platform.
Data processing
Using the CLC Genomics Workbench 8.0.1 sequence
trimmer (Qiagen GmbH), 12 terminal nucleotides from the 5′ end,
remaining Illumina adapters and low-quality sequences (below Phred
13) were removed from each read. The minimum sequence length was
set to 15 bp, allowing ≤2 ambiguous nucleotides per read. The reads
were then mapped to the annotated human genome hg19
(ftp.ensembl.org/pub/release-75/gtf/homo_sapiens/Homo_sapiens.GRCh37.75.
gtf.gz) with the CLC Genomics Workbench 8.0.1 RNA-Seq tool. Mapping
parameters were set as default, but included intergenic regions and
allowed ≤10 hits per read. Paired two-group comparisons were
conducted between the mapping results of siMB and
MB+ cells for the three cell lines with or
without hypoxia using the CLC Genomics Workbench 8.0.1 with the
original reads per kilobase of transcript per million mapped reads
(RPKM) values (30).
Proportion-based statistics were calculated with Kal's Z-tests
[Bonferroni- and false discovery rate (FDR)-corrected] to identify
statistically significant differentially expressed genes at
[−log10(p)]≥0.5 (31).
Variant detection
Low frequency variant detection was performed with
the CLC Genomics Workbench 8.5.1 at default parameters using a
minimum read count of 6, a minimum coverage of six reads and
including a read direction filter of 1%. Only variants of QUAL ≥100
(probability that a particular variant exists ≥0.9999999999) were
listed and annotated with human genome hg19 gene track overlap
information to infer potential non-synonymous amino acid
changes.
Interpretation of RNA-Seq data
To access the transcriptome-wide effects of MB
expression in epithelial cancer cells, all genes that were
differentially expressed between siMB and
MB+ cells were identified (Table I). A list of genes that were
differentially expressed depending on the MB status in at least
four of the six gene lists was compiled to filter general MB
functions common to the majority of the investigated cell types.
This merged gene list was used for gene set enrichment analysis
(hypergeometric tests; FDR-corrected P<0.05) using the Cytoscape
3 application BiNGO 3.0.3 (32)
to generate a map of significantly overrepresented Gene Ontology
(GO)-categories.
 | Table ISpecifications of RNA-Seq datasets
generated in this study. |
Table I
Specifications of RNA-Seq datasets
generated in this study.
| Dataset | Total mapped
reads | Differentially
expressed genes | Downregulation of
MB | Hypoxia induction
|
|---|
| LDHA | GLUT1 | VEGFA |
|---|
siMB MB468
Hx
MB+ MB468 Hx |
28,841,086
23,674,893 | 807 (224 up, 583
down) | −37.9-foldb | MB: 1.3a; MB+: 1.4b | siMB: 1.2;
MB+: 1.3 | siMB: 1.8;
MB+: 1.2 |
siMB MB468
Nx
MB+ MB468 Nx |
46,544,990
36,990,522 | 683 (241 up, 442
down) | −26.1-foldb | | | |
siMB DLD-1
Hx
MB+ DLD-1 Hx |
28,156,099
26,890,772 | 549 (276 up, 273
down) | −7.7-folda | siMB: 3.1b; MB+: 2.8b | siMB: 2.4b; MB+: 2.1b | siMB: 4.4b; MB+: 5.0b |
siMB DLD-1
Nx
MB+ DLD-1 Nx |
53,342,155
47,002,503 | 160 (77 up, 83
down) | −5.9-folda | | | |
siMB LNCaP
Hx
MB+ LNCaP Hx |
47,393,215
32,967,690 | 857 (371 up, 486
down) | −15.9-foldb | siMB: 2.5b; MB+: 1.7b | siMB: 1.7b; MB+: 1.5b | siMB: 4.1b; MB+: 5.5b |
siMB LNCaP
Nx
MB+ LNCaP Nx |
50,920,424
48,109,894 | 569 (284 up, 285
down) | −11.1-foldb | | | |
For a more detailed analysis of the impact of MB in
each cell line under each O2 condition, the six lists of
genes differentially expressed between siMB and
MB+ cells in matching conditions were further
analyzed for GO term enrichment (P<0.05) and gene enrichment in
KEGG and Biocarta pathways using the DAVID Bioinformatics Resources
6.7 functional annotation tool (33,34), choosing either the upregulated or
downregulated genes as inputs. Genes differentially expressed
between siMB and MB+ cells were further
annotated and interpreted by Core Ingenuity Pathway analysis (IPA)
(http://www.ingenuity.com). Analyses were
conducted using the fold-changes determined by CLC
two-group-comparisons, including the IPA a priori knowledge
of direct and indirect relationships between genes observed in all
human tissues. For visualization, a list of significantly active
upstream regulators in each condition was compiled based on the
direction of regulation of their target genes.
Results
RNA-Seq data generation
To investigate the function of endogenously
expressed MB in epithelial cancer cells, siRNA was used to
generate MB-knockdown breast (MDA-MB468), prostate (LNCaP)
and colon (DLD-1) cancer cells, and their transcriptome profiles
were compared to those of matching MB-wild-type cells
treated with scr siRNA as a control. Different tumor types were
selected for studying MB expression to discriminate
tumor-specific effects [e.g., ER status (27)] from common changes that may be
associated with MB expression throughout different tumor
types of epithelial origin. As MB can be either oxygenated or
deoxygenated, experiments for all three cell lines were conducted
in room air (normoxia) and 1% O2 (hypoxia), the latter
causing a fractional MB O2 desaturation of ~42%
(35). To specifically study the
impact of MB in cells adapted to long-term hypoxia,
mimicking tumors, the cells were incubated for 72 h at hypoxic vs.
normoxic conditions; previous experiments on MDA-MB468 siRNA
MB-knockdown cells demonstrated strong phenotypic effects at 72 h
(28). Using Illumina
transcriptome sequencing and read mapping to the annotated human
genome, gene expression profiles were generated for each cell line
and condition. The numbers of successfully mapped reads ranged
between 23.7 and 53.3 Mio (Table
I).
Functional annotation of differentially
regulated genes
Following RNAi, MB was downregulated 6- and
8-fold in DLD-1, 11- and 16-fold in LNCaP and 26- and 38-fold in
MDA-MB468 cells compared with the control cells in normoxic and
hypoxic conditions, respectively. In addition, between 160 and 857
genes were differentially expressed between siMB and
MB+ control cells under equivalent oxygen
conditions (Tables I and SI). This divergence implied differences
in the impact of MB on specific epithelial cell lines and
encouraged the investigation of the generic and cell-type specific
effects of MB expression in epithelial cancer cells. Differentially
expressed genes were subjected to GO term analysis, and
overrepresentations of GO terms within gene lists were
statistically evaluated.
The effects of MB expression common among the three
epithelial cancer cell lines were summarized by BiNGO analysis of a
subset of 145 genes, which were consistently differentially
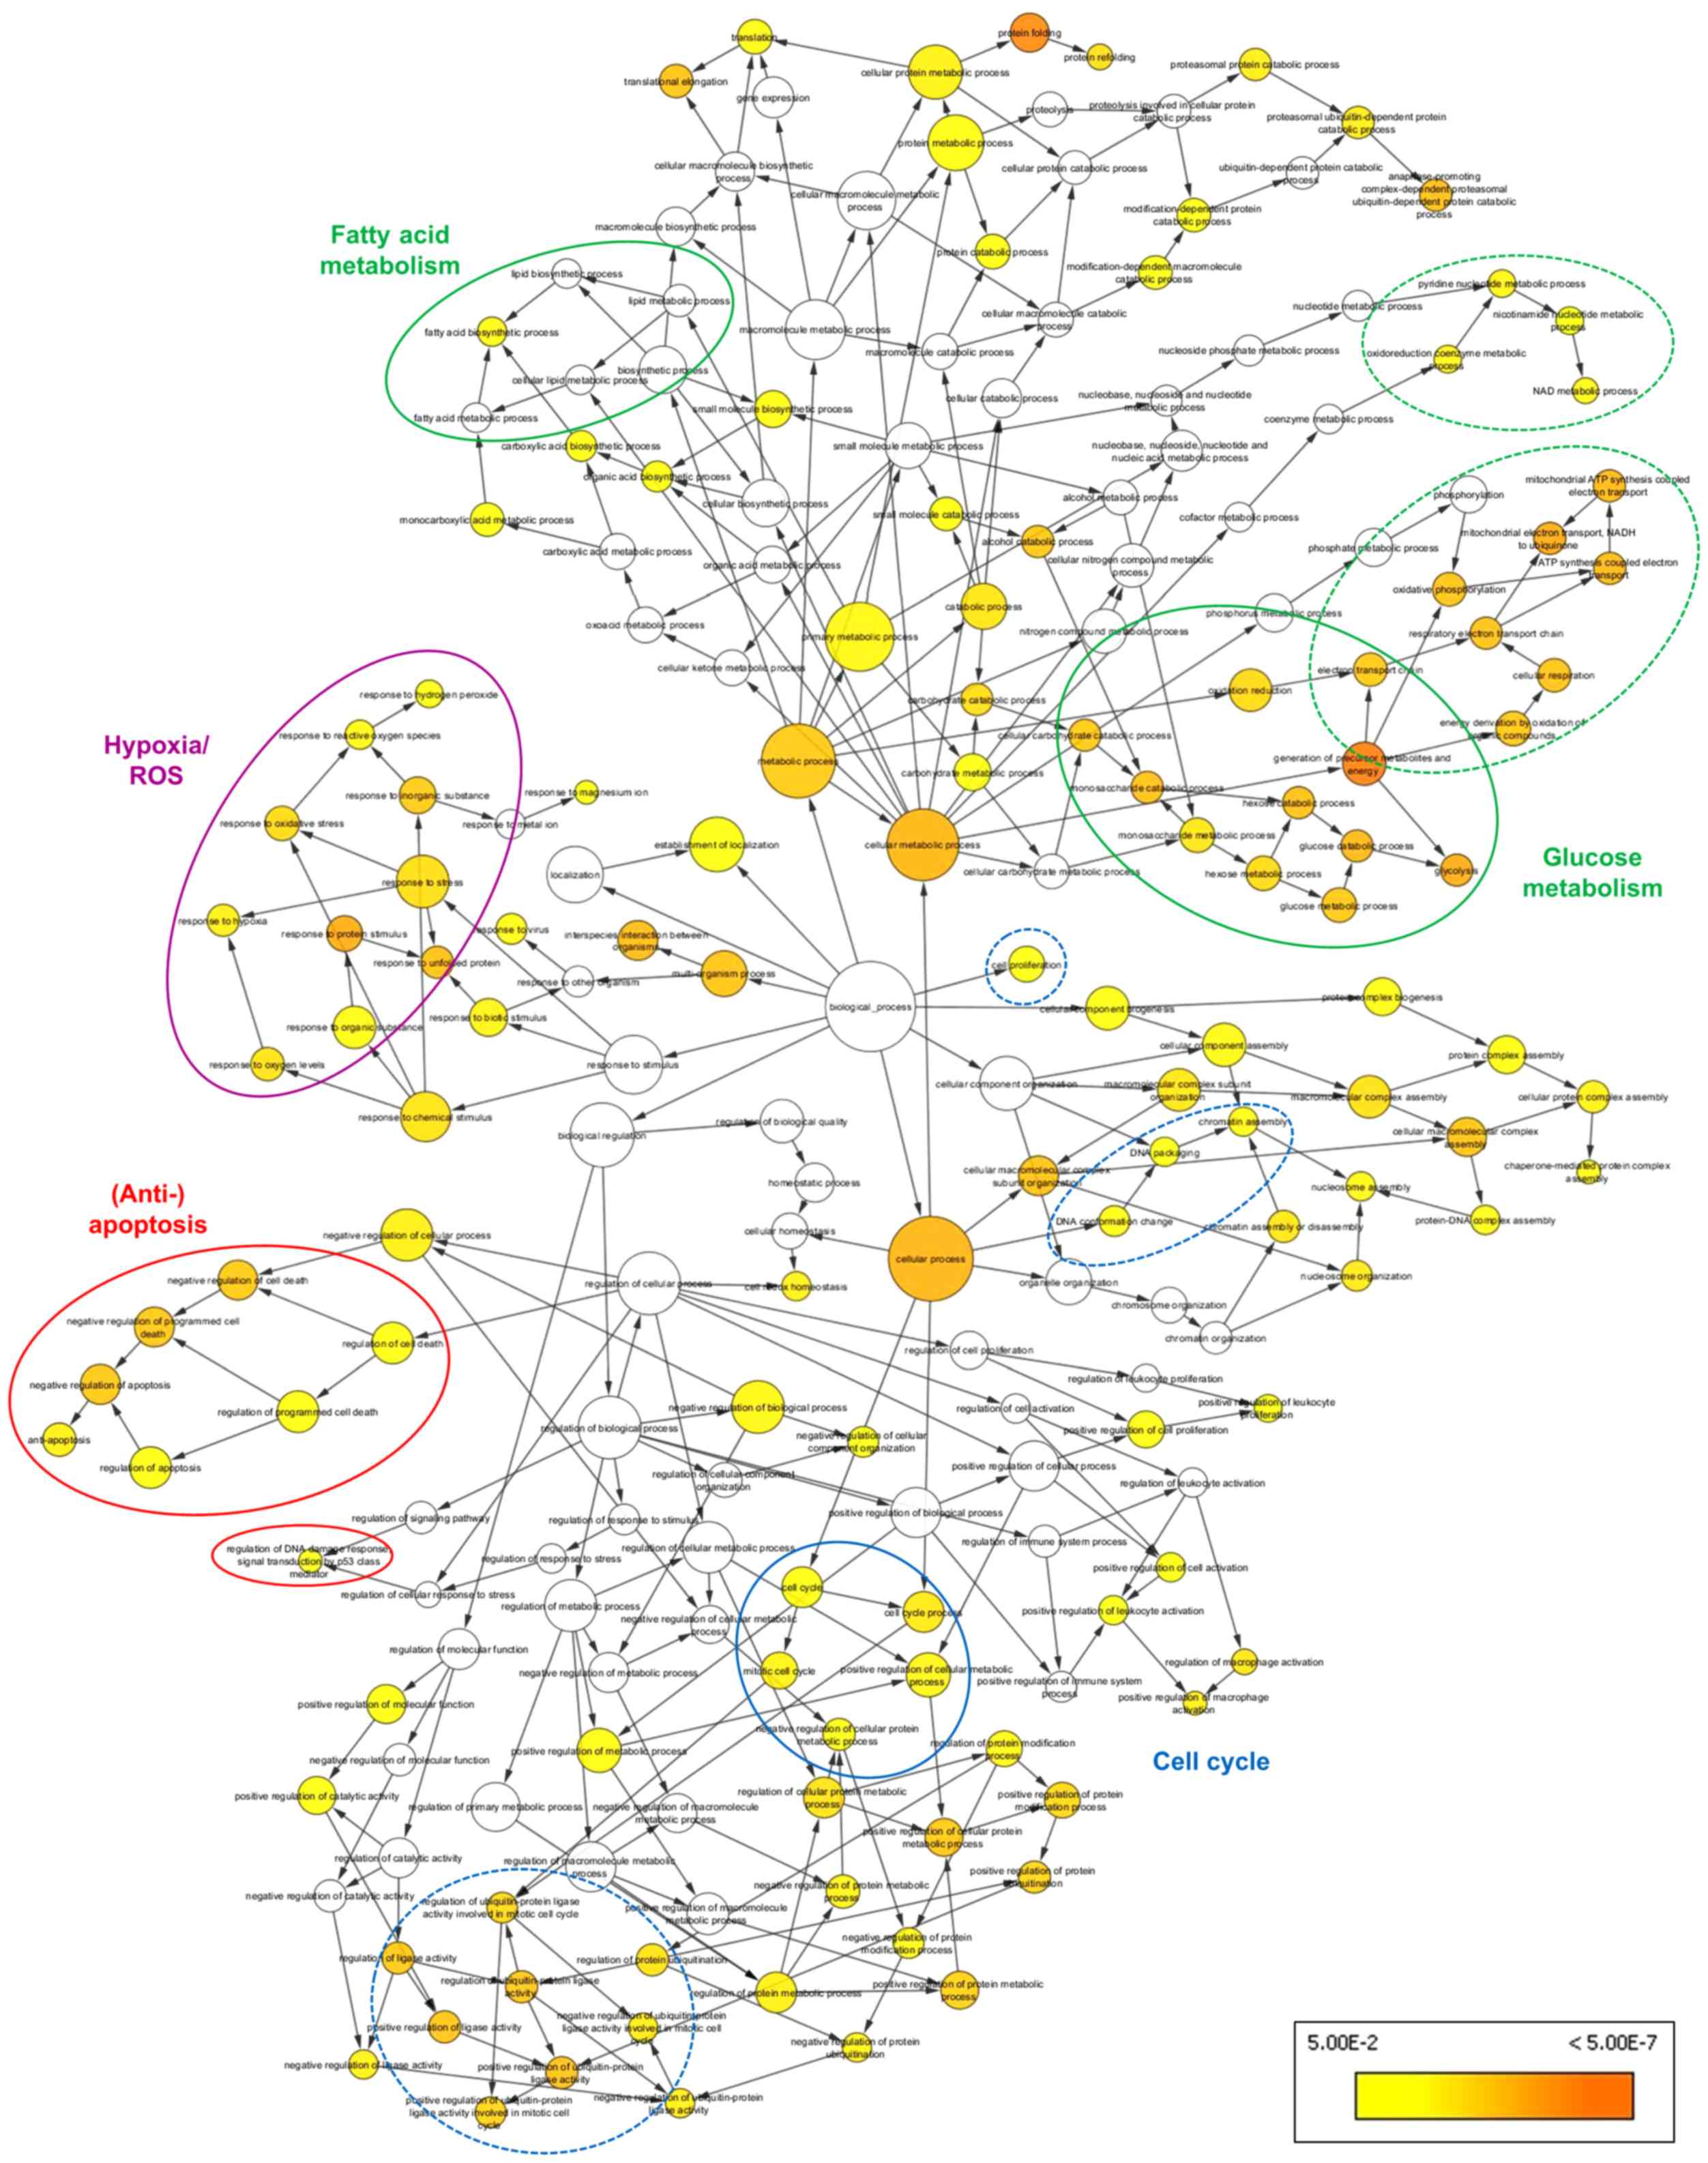
expressed in at least four of the six experimental groups (Table I). A number of overrepresented GO
terms, presented as colored nodes in Fig. 1, were associated with metabolic
shifts (i.e., 'glycolysis', 'fatty acid biosynthetic process',
'oxidative phosphorylation' and 'generation of precursor
metabolites and energy') and anti-apoptotic cell signaling (i.e.,
'anti-apoptosis', 'negative regulation of programmed cell death'
and 'regulation of DNA damage response', signaling transduction by
p53 class mediator'). These terms were linked to the
overrepresented nodes 'cell cycle' and 'protein ubiquiti-nation' in
the BiNGO graph. In addition, overrepresentation of the GO
categories 'response to hypoxia', 'response to oxidative stress'
and 'response to ROS' was observed, suggesting that MB also
participates in cellular response to oxidative stress.
The present study further aimed to identify
individual cell type- and O2 level-specific
characteristics in the three cancer cell lines (Table II). GO term and KEGG and Biocarta
pathway enrichment analyses were performed separately for each
subset of significantly upregulated and downregulated genes to
compare siMB and MB+ cells (Table SI). Lists of enriched GO terms
revealed a number of categories that repeatedly appeared across all
studied cell types. These functional terms were related to those
identified before in the global BiNGO analysis. In addition, the
terms were linked to a range of known molecular functions exerted
by MB. Several GO categories unique either to a certain cell type
or to the O2 level were also identified (Table II).
| Table IISummary of overrepresented Biological
Process GO categories. |
Table II
Summary of overrepresented Biological
Process GO categories.
| A, GO terms of
genes differentially expressed in siMB vs.
MB+ MDA-MB468 cells |
|---|
|
|---|
|
Hypoxia/ROS/NO· | Metabolism |
Apoptosis/Migration/Motion | Others |
|---|
| Response to
oxidative stress ↑↓H, ↑↓N | Glycolysis ↓H,
↓N | Induction of
programmed cell death ↑↓H
Induction of apoptosis ↑↓H | Translation ↑↓H,
↑↓N
Chromatin assembly ↑H, ↑N |
| Response to
hypoxia ↓H, ↓N | Lipid biosynthetic
process ↑H | Negative
regulation of programmed cell death ↓H, ↓N
Regulation of programmed cell death ↓H, ↑↓N | Cytoskeleton
organization ↑↓N
Regulation of cell proliferation ↓H, ↑↓N |
| Response to
O2 levels ↓H, ↓N | Steroid metabolic
process ↑H, ↑N | Negative
regulation of apoptosis ↓H, ↓N
Regulation of apoptosis ↓H, ↑↓N | Positive
regulation of cell proliferation ↓H, ↓N
Cell proliferation ↓N |
Response to ROS
↓H, ↓N
| Cholesterol
metabolic process ↑N
| Anti-apoptosis
↓H, ↓N
Apoptosis ↓H, ↓↑N | Negative
regulation of cell proliferation ↑↓H, ↑N
Inflammatory response ↑H, ↑↓N |
| O2
reduction ↓H, ↑↓N | Sterol metabolic
process ↑N
Unsaturated fatty acid metabolic process ↓N | Cell motion ↓H,
↓N
Cell migration ↓H, ↓N
Cell adhesion ↓H, ↓N | Mitotic cell
cycle ↓H, ↓N
Cell cycle process ↓H, ↓N
Regulation of cell cycle ↓H, ↓N |
| N compound
biosynthetic process ↓H | Unsaturated
fatty acid biosynthetic process ↓N | Positive
regulation of cell motion ↓H, ↓N
Positive regulation of cell migration ↓H, ↓N | Negative
regulation of ubiquitin protein
ligase activity during mitotic cell cycle
↓H, ↓N |
Regulation of
NO· biosynthetic
process ↓H, ↓N | Generation of
precursor metabolites & energy
↓H, ↓N | Negative
regulation of cell motion ↓H, ↓N
Negative regulation of cell migration ↓N | Positive
regulation of ubiquitin protein ligase activity during mitotic cell
cycle ↓H, ↓N |
|
| B, GO terms of
genes differentially expressed in siMB vs.
MB+ LNCaP cells |
|
|
Hypoxia/ROS/NO· | Metabolism |
Apoptosis/Migration/Motion | Others |
|
| Response to
oxidative stress ↓H, ↓N | Glycolysis ↓H,
↓N | Induction of
programmed cell death ↓H | Translation ↓H,
↓N |
| Response to
hypoxia ↓H, ↓N | Eicosanoid
metabolic process ↑H
Unsaturated fatty acid metabolic process ↑H | Induction of
apoptosis ↓H
Negative regulation of programmed cell death ↑↓H, ↓N | Chromatin
assembly ↑H, ↑N
Cytoskeleton organization ↑H, ↑N |
| Response to
O2 levels ↓H, ↓N | Unsaturated
fatty acid biosynthetic process ↑H
Fatty acid metabolic process ↑N | Apoptosis ↑H,
↑N
Cell motion ↑H, ↑N | Regulation of
cell proliferation ↑H, ↑N
Positive regulation of cell proliferation
↓H, ↓N |
| Response to ROS
↓H, ↓N | Fatty acid
biosynthetic process ↑H
Generation of precursor metabolites & energy ↓H, ↓N | Cell migration
↑H
Cell adhesion ↑H | Negative
regulation of cell proliferation ↑H, ↑N
Mitotic cell cycle ↓H, ↓N |
| O2
reduction ↑↓H, ↑↓N | Oxidative
phosphorylation ↓H, ↓N
Glycerophospholipid metabolic process ↑N | Negative
regulation of cell motion ↑H
Negative regulation of cell migration ↑H | Cell cycle
process ↓H, ↓N
Regulation of cell cycle ↓H, ↓N |
Positive regulation
of O2 & ROS
metabolic process ↑H | β-oxidation ↑N | Regulation of
programmed cell death ↑↓H, ↓N
Negative regulation of apoptosis ↑↓H, ↓N | Negative
regulation of ubiquitin protein ligase activity during mitotic cell
cycle ↓H, ↓N |
| N compound
biosynthetic process ↓H, ↓N | Sterol
biosynthetic process ↑N | Regulation of
apoptosis ↑↓H, ↓N
Anti-apoptosis ↑↓H, ↑↓N | Positive
regulation of ubiquitin protein ligase activity during mitotic cell
cycle ↓H, ↓N |
|
| C, GO terms of
genes differentially expressed in siMB vs.
MB+ DLD-1 cells |
|
|
Hypoxia/ROS/NO· | Metabolism |
Apoptosis/Migration/Motion | Others |
|
| Response to
oxidative stress ↓H, ↓N | Glycolysis
↑H
Cholesterol metabolic process ↓H | Induction of
programmed cell death ↑↓H
Induction of apoptosis ↑↓H
Negative regulation of programmed cell death ↑↓H, ↓N | Translation ↑↓H,
↑↓N
Cell cycle process ↑H, ↑N
Cell division ↑H, ↑N |
| Response to ROS
↓H, ↓N | Sterol metabolic
process ↓H | Regulation of
programmed cell death ↑↓H, ↓N
Negative regulation of apoptosis ↑↓H, ↓N | Regulation of
cell cycle ↓H
Cell cycle arrest ↓H |
| O2
reduction ↓N | Cholesterol
biosynthetic process ↓H | Regulation of
apoptosis ↑↓H, ↑↓N
Anti-apoptosis ↑↓H | Cytoskeleton
organization ↓H
Regulation of cell proliferation ↓H |
| N compound
biosynthetic process ↑H, ↓N | Sterol
biosynthetic process ↓H | Apoptosis ↑↓H,
↓N
Cell motion ↓N | Cell
proliferation ↑H, ↓N
Negative regulation of ubiquitin protein ligase activity during
mitotic cell cycle ↑↓H |
| Positive regulation
of N compound metabolic process ↓H | Gluconeogenesis
↑N | Positive
regulation of cell motion ↑H
Positive regulation of cell migration ↑H | Positive
regulation of ubiquitin protein ligase activity during mitotic cell
cycle ↑↓H, ↑N |
GO terms indicate a metabolic shift in
siMB cells
In prostate and breast cancer cells, the GO
categories 'response to O2 levels' and 'response to
hypoxia' were overrepresented in the set of downregulated genes in
siMB cells independent of the O2 conditions
(Table II). Since these genes
included a number of known hypoxia marker genes (Table SI), these results suggested that
MB may modulate the cellular hypoxia response in breast and
prostate cancer cell lines.
GO enrichment analysis further indicated a metabolic
shift towards a reduced rate of glycolysis in MB-knockdown
prostate and breast cancer cells under the two O2
conditions. This was evidenced by the downregulation of the
hypoxia-regulated lactate dehydrogenase A (LDHA) gene and
the glycolytic genes triosephospate isomerase 1 (TPI1),
GAPDH, protein kinase CGMP-dependent 1 (PGK1) and
glycerol-3-phosphate acyltransferase, mitochondrial (GPAM1).
By contrast, MB-knockdown in hypoxic colon cancer cells
resulted in an increase in glycolytic flux, as LDHA and the
glycolysis genes TPI1, PGK1, GPAM1 and enolase 1 were
upregulated (Tables SI and
SII).
In normoxic MB-knockdown breast cancer cells,
the GO categories 'unsaturated fatty acid metabolic process' and
'unsaturated fatty acid biosynthetic process' were overrepresented
in the set of downregulated genes (Table II), including fatty acid
desaturase 3 and δ4-desaturase, sphingolipid 1 (Tables SI and SIII). By contrast, genes
associated with sterol, cholesterol and steroid metabolic processes
were upregulated in MB-knockdown breast cancer cells, such
as sterol regulatory element binding transcription factor 1
(SREBF1), phosphomevalonate kinase, 24-dehydrocholesterol
reductase (DHCR24) and cytochrome P450 1B1 (Tables SI and SIII). These results
suggested that oxy-MB may stimulate the metabolism of unsaturated
fatty acids in oxygenated breast cancer cells. However, the globin
may also interfere with the synthesis of sterols.
In prostate cancer cells, siMB treatment
resulted in an increased ability to metabolize or synthetize fatty
acids, sterols and eicosanoids, indicated by the upregulation of
hydroxyacyl-CoA dehydrogenase trifunctional multienzyme complex β,
DHCR24, sterol-C5-desaturase, 15-hydroxypros-taglandin
dehydrogenase (HPGD), elongation of very long chain fatty
acids protein 5 (ELOVL5) and acyl-CoA synthetase long chain
family member 3 in normoxic siMB cells, and by upregulation
of ELOVL5, HPGD, fatty acid synthase and phospholipase A2
group V in siMB hypoxic cells (Tables SI and SIII). By contrast, in
hypoxic MB-knockdown colon cancer cells, the expression of
genes associated with cholesterol and sterol metabolism and
biosynthesis [DHCR7, 3-hydroxy-3-methylglutaryl-CoA synthase
1 (HMGCS1), farnesyl diphosphate synthase,
farnesyl-diphosphate farne-syltransferase 1 and SREBF1] was
decreased (Tables SI and SIII).
In summary, the results of the transcriptome analysis suggested
that MB may regulate fatty acid metabolism in a cell-type specific
manner.
MB expression is associated with
apoptosis and migration
The GO categories 'induction of programmed cell
death' and 'induction of apoptosis' were overrepresented in the set
of downregulated genes in hypoxic MB-knockdown prostate
cancer cells, suggesting that MB positivity may be associated with
the stimulation of apoptotic processes in these cells. One option
of maintaining apoptosis is by triggering cell cycle checkpoint
signaling (36). Accordingly, in
both normoxic and hypoxic siMB LNCaP cells, the GO
categories 'regulation of cell cycle' and 'positive regulation of
cell proliferation' were overrepresented among the downregulated
genes, whereas the category 'negative regulation of cell
proliferation' was enriched in the upregulated genes. In addition,
the G1/S cell cycle checkpoint regulator
cyclin-dependent kinase inhibitor 1a (CDKN1A, also termed
TP21) was downregulated in siMB LNCaP cells. These
results indicated direct or indirect involvement of MB in
TP21 expression and a possible induction of cell cycle
arrest in the presence of MB. However, this scenario is most
probably of a more complex nature, since a subset of cell cycle
progression-associated genes such as cyclin B1 (CCNB1) and
CCND1 were also downregulated in siMB LNCaP cells
(Tables SI and SIII). Enrichment
analyses also revealed that the GO categories 'cell motion' and
'cell migration' were significantly overrepresented among the
upregulated genes of siMB LNCaP cells (Table II), including activated leukocyte
cell adhesion molecule, CD9, RAC1, laminin subunit γ1
and thrombospondin (THBS1) under both O2
conditions (Tables SI and SIII).
These observations strengthened our hypothesis that MB induced
apoptosis and decreased the migratory and motion capacity of
prostate cancer cells.
In breast cancer cells, genes associated with
apoptosis were overrepresented in the sets of up- and downregulated
MDA-MB468 cells under both O2 conditions (Table II), which made it difficult to
discriminate the impact of MB on promoting or inhibiting apoptosis.
The GO terms 'mitotic cell cycle', 'cell cycle process' and
'positive regulation of cell proliferation' were overrepresented in
the downregulated genes of siMB cells, whereas only a
limited number of negative regulators of cell proliferation were
upregulated (including retinoic acid receptor responder 3,
prostaglandin E synthase and CDKN2C; Tables SI and SIII). These results may
imply increased proliferation rates in MB-positive breast cancer
cells. In addition, the GO terms 'cell motion' and 'cell migration'
were significantly overrepresented in the downregulated genes of
siMB cells (Table II), as
evidenced by the lower expression of THBS1, TNF receptor
superfamily member 12A, vinculin, moesin and tensin 3 (Tables SI and SIII). Thus, the
predictions made about the impact of MB on cell motion in hypoxic
and normoxic breast cancer cells contradicted the results observed
in prostate cancer cells.
In colon cancer cells, genes associated with
apoptosis were also overrepresented in both up- and downregulated
genes (Table II). The term 'cell
cycle process' was overrepresented in the upregulated genes of
hypoxic and normoxic siMB DLD-1 cells, including TPX2
microtubule nucleation factor, CDC20, non-SMC condensin I
complex subunit D2, family with sequence similarity 83 member D,
CCNB1 and CCNB2. In addition, the term 'cell cycle
arrest' was overrepresented in the downregulated genes of hypoxic
siMB samples (Table II)
due to the downregulation of genes such as CDKN1C,
CDKN1A, protein phosphatase 1 regulatory subunit 15A and DNA
damage inducible transcript 3 (Tables SI and SIII). Therefore, the
DLD-1 data suggested that MB expression may mediate the suppression
of cell cycle progression in colon cancer cells, possibly via
apoptotic pathways.
In line with the results of the prostate cancer cell
line, the GO term 'cell motion' was also overrepresented in the
down-regulated genes of normoxic siMB DLD-1 cells.
MB may impact on ROS and NO·
homeostasis in epithelial cancer cell lines
In hypoxic and normoxic MB-knockdown breast
cancer cells, the GO term 'regulation of NO·
biosynthetic process' and other GO categories referring to the
biosynthetic process of N-compounds were overrepresented in the
downregulated genes, suggesting an increased production of
NO· in hypoxic and normoxic MB-positive breast
cancer cells (Table SIII). This
dependency between MB expression and NO·-related GO
terms was also observed in prostate and colon cancer cells, which
suggested involvement of MB in NO· metabolism in all
three cell types. All siMB cells also exhibited enrichment
of the GO category 'response to ROS' in the downregulated genes
irrespective of the O2 culture conditions. Therefore, MB
may be involved in increasing ROS levels in all tested cell
lines.
MB expression may affect the activity of
key transcriptional regulators
To predict the differential activation of key
transcriptional regulators in siMB vs. MB+
cells, the mRNA expression of their target genes was examined using
bioinformatic IPA upstream regulator analysis (Table III). A subset of 40
transcription factors was suggested to be differentially active in
at least one cell line at hypoxia or normoxia, with high Z-scores
indicating strong activation, and low Z-scores indicating
transcription factor inhibition. All siMB cells subjected to
hypoxia and normoxic MDA-MB468 cells were predicted to exhibit
decreased HIF1α activity compared with the MB+
controls. This was supported by the downregulation of HIF1α target
genes in the siMB cell groups, including TP21 and
nucleophosmin 1 in all cell lines, LDHA in LNCaP and
MDA-MB468 cells, aldolase fructose-bisphosphate A and interleukin 8
in MDA-MB468 and DLD-1 cells, vascular endothelial growth factor A
in LNCaP cells and HIF1A, solute carrier family 2 member 1
and carbonic anhydrase 9 in MDA-MB468 cells (Table SI). Thus, MB may activate HIF1α
in breast cancer cells and, to a lesser extent, in prostate and
colon cancer cells.
| Table IIIIngenuity Pathway analysis of
upstream regulator activity inferred from differential target gene
expression. |
Table III
Ingenuity Pathway analysis of
upstream regulator activity inferred from differential target gene
expression.
| Upstream TF | MB468 Hx
| MB468 Nx
| DLD Hx
| DLD Nx
| LNCaP Hx
| LNCaP Nx
| Entrez gene
name |
|---|
| Fold ch | Z | Fold ch | Z | Fold ch | Z | Fold ch | Z | Fold ch | Z | Fold ch | Z |
|---|
| ATF3 | | | | | | −2.000 | | | | | | | Activating
transcription factor 3 |
| ATF4 | | −1.091 | | | | | 1.186 | 2.000 | | | | | Activating
transcription factor 4 |
| CDKN2A | | 0.447 | | 0.000 | | | | | | | | | Cyclin-dependent
kinase inhibitor 2A |
| CTNNB1 | | | | −0.218 | | | | | | −0.811 | | | Catenin
(cadherin-associated protein), beta 1, 88 kDa |
| EHF | | −0.302 | | 0.632 | | | | | | | | | ETS homologous
factor |
| ERG | | | | | | | | | | 2.000 | | | V-ets avian
erythroblastosis virus E26 oncogene homolog |
| ETV5 | | −1.000 | | | | | | | | | | | Ets variant 5 |
| FOXM1 | | | | | | 3.240 | | | | −1.165 | | | Forkhead box
M1 |
| FOXO1 | | −2.221 | | −2.621 | | 1.442 | | 1,969 | | −1.131 | | | Forkhead box
O1 |
| FOXO3 | | −2.003 | | −2.219 | −1.472 | −1.997 | | | | | | | Forkhead box
O3 |
| FOXO4 | | −1.218 | | | | | | | | | | | Forkhead box
O4 |
| GATA4 | | −0.351 | | | | | | | | | | | GATA binding
protein 4 |
| GLI1 | | 0.114 | | −0.671 | | −1.400 | | | | −1.154 | | | GLI family zinc
finger 1 |
| HAND2 | | −0.351 | | | | | | | | | | | Heart and neural
crest derivatives expressed 2 |
| HIF1A | −1.516 | −2.556 | −1.406 | −1.455 | | −0.391 | | | | −0.218 | | | Hypoxia inducible
factor 1, alpha subunit |
| HLX | | 1.000 | | 0.447 | | 0.378 | | 0.000 | | | | | H2.0-like
homeobox |
| HOXD10 | | 1.000 | | 1.633 | | | | | | | | | Homeobox D10 |
| IRF3 | | −2.208 | | −1.972 | | | | | | | | | Interferon
regulatory factor 3 |
| JUN | | −1.474 | | −1.622 | −1,653 | −1.000 | | | | | | | Jun
proto-oncogene |
| KDM5B | | 0.000 | | 0.832 | | −2.864 | | −0.816 | | 1.667 | | | Lysine (K)-specific
demethylase 5B |
| MDM2 | | −1.192 | | −2.000 | | | | | | −0.686 | | | MDM2
proto-oncogene, E3 ubiquitin protein ligase |
| MITF | | | | 1.000 | | | | | | | | |
Microphthalmia-associated transcription
factor |
| MYC | | 0.152 | | 0.555 | | | | | −1,568 | 0.849 | −1.631 | 1.067 | V-myc avian
myelocytomatosis viral oncogene homolog |
| MYOCD | | −0.612 | | | | | | | | | | | Myocardin |
| NANOG | | 0.707 | | | | | | | | | | | Nanog homeobox |
| NEUROG1 | | 1.000 | | 1.508 | | | | | | | | | Neurogenin 1 |
| NFIX | 1.407 | 0.655 | | | | | | | | | | | Nuclear factor I/X
(CCAAT-binding transcription factor) |
| RELA | | −2.564 | | −2.386 | | −1.913 | | −0.849 | | | | | V-rel avian
reticuloendotheliosis viral oncogene homolog A |
| SATB1 | | −1.494 | | −0.576 | | 0.984 | | −0.831 | | −1.987 | | −1.987 | SATB homeobox
1 |
| SMAD4 | | −1.000 | | −1.987 | | | | | | | | | SMAD family member
4 |
| SMARCA4 | | | | | | | | | | −1.980 | | | SWI/SNF related,
matrix associated, actin dependentregulator of chromatin |
| SNAI2 | | | | 0.854 | | | | | | | | | Snail family zinc
finger 2 |
| SP1 | | | | | | | | | | −1.000 | | | Sp1 transcription
factor |
| STAT1 | | −2.200 | | | | | | | | | | | Signal transducer
and activator of transcription 1, 91 kDa |
| STAT3 | | −1.653 | | −0.864 | | | | | | | | 0.640 | Signal transducer
and activator of transcription 3 |
| TBX5 | | −0.351 | | | | | | | | | | | T-box 5 |
| TP53 | | −2.756 | | −2.568 | | −1.480 | | −0.651 | | 0.492 | | | Tumor protein
p53 |
| TP63 | | 0.650 | | 1.349 | | 0.508 | | | | −0.654 | | 0.060 | Tumor protein
p63 |
| TP73 | | | | −1.230 | | −0.970 | | | | | | | Tumor protein
p73 |
| YAP1 | | −1.633 | | −1.633 | | | | | | | | | Yes-associated
protein 1 |
IPA upstream activator analysis also suggested the
involvement of p53 signaling in the three cancer cell lines
(Table III). Of note, in our
set up, only LNCaP cells encoded the TP53 wild-type-like
Pro72Arg variant, whereas the MDA-MB468 and DLD-1 cells carried
TP53 mutations Arg273His and Ser241Phe, respectively
(Table SII), which affected the
key residues of DNA-binding (37). RNA-Seq analysis of LNCaP cells
demonstrated that MB+ was associated with the
upregulation of p53 target genes including TP21,
BCL2-interacting killer and heme oxygenase 1 (HMOX1)
(Table SI), which suggested an
activation of p53 signaling by MB in the prostate cancer model. In
MDA-MB468 and DLD-1 cells expressing MB, even the mutant p53
was active, which was evidenced by the decreased expression of p63
target genes (Table III),
possibly due to lowered p63 activity by the binding of mutated p53
(38,39). Accordingly, IPA analysis results
suggested activation of p63 in MB+ hypoxic LNCaP
cells expressing the wild-type-like TP53 mutation Pro72Arg
(Table III). Another fitting
observation noted for the breast cancer cell line was enhanced
transcriptional activity predicted for the oncogenic factor RELA
(Table III), which is known to
be activated by mutant p53 (40).
In line with the observed metabolic shifts in
MB+ cancer cells, the gluconeogenesis and
adipogenesis regulator fork-head box O1 was another transcription
factor predicted to be dysregulated in the three cell models
(Table II).
Discussion
The respiratory protein MB, known for its prominent
presence in myocytes, is ectopically expressed in several cell
types and malignancies, including tumors of the breast, prostate,
lung, colon, kidney, bone, and head and neck (18-26).
Only a limited number of hypothesis-driven
experiments have been conducted thus far to elucidate the role of
MB in cancer cells (28,41,42). The present study used the
essentially unbiased approach of transcriptome analysis to reveal
functional consequences of MB expression vs. RNAi-mediated
MB knockdown in breast, prostate and colon cancer cells.
Cells were cultured either at 1% O2 or at room air
conditions for 72 h to reflect long-term hypoxia-adapted, poorly
vascularized hypoxic tumor areas and aerobic tissues with
oxygenated MB (35). By Illumina
transcriptome sequencing and bioinformatic read mapping,
differentially expressed genes between siMB and
MB+ cells were identified for all cell lines at
either oxygen level. Gene lists were subjected to analyses of gene
set enrichment to identify dysregulated biological processes and
differentially active gene regulators and pathways. As a main
observation, these results demonstrated increased cellular activity
of HIF1α signaling in MB+ vs. siMB
epithelial cancer cells; HIF1α is the major transcription factor of
the cellular hypoxia response (43). Multiple HIF1α target genes were
differentially expressed in all cell lines cultured under hypoxia,
and respective GO-categories were enriched. Of note, comparatively
less HIF2α target genes were differentially expressed in
MB+ vs. siMB cells, although HIF2α is
generally considered to be more active following long-term hypoxia
compared with HIF1α (44).
Therefore, although hypoxia was applied for 72 h, the function of
MB may be associated with the differential expression of HIF1α
targets and may possibly be triggered by HIF1α activity. Supporting
hypothetical interaction between MB and HIF1α, a positive
correlation of MB mRNA or protein and HIF1α target gene
expression was reported in breast, prostate and non-small cell lung
cancer (21,22,24,29). MB levels were also increased in
hypoxic, perinecrotic breast tumor regions (28). Additionally, in the present study,
MB expression was upregulated in LNCaP, MDA-MB468 and DLD-1
cells cultured under 1% O2. This may be a result of
HIF1α binding to a candidate hypoxia response enhancer element
(27,28). Thus, transcription of MB in
tumor cells may be triggered by a HIF-dependent transactivation.
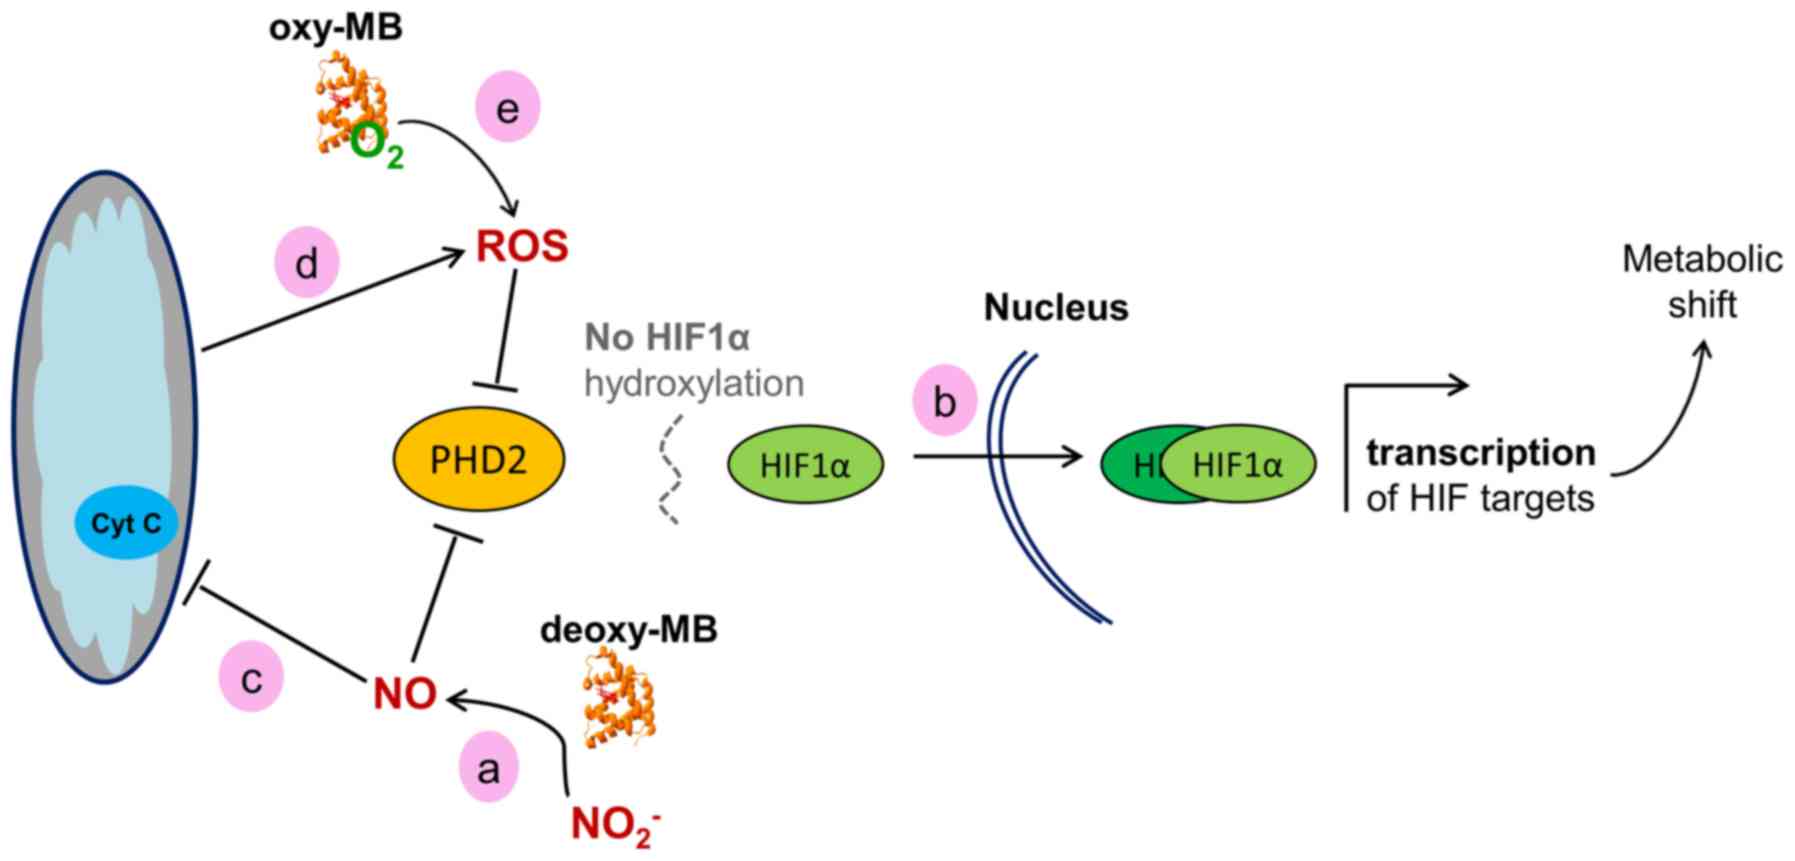
Based on the present gene expression data, a working model may be
proposed, linking the presence of MB to HIF1α activity. A scheme of
how this may be achieved is presented in Fig. 2. Deoxy-MB can produce
NO· through its nitrite reductase activity (12). This enzymatic activity may be
active in the cancer cell models used in the present study, since
the GO category 'N-compound biosynthetic processes' was enriched in
all MB+ cells. NO· inhibits the
activity of the sensor protein prolylhydroxylase 2 (PHD2), which is
the main PDH expressed in these cell models (45,46). This would lead to diminished
hydroxylation and increased stabilization of the HIF1α protein,
resulting in the increase of HIF1α target gene transcription
(47,48), as observed in the present
transcriptome data. Hypothetically, MB could counteract a fast
decay of the HIF1α response by constantly producing NO·
and decreasing PHD2 activity. As a formal alternative to this
working model, MB may interfere with HIF1α signaling by modulating
intracellular ROS levels. The ferrous iron of PHD2 can be oxidized
by H2O2, which prevents HIF1α degradation and
thus transiently increases HIF1α activity (49,50). Accordingly, the present
transcriptome data demonstrated an overrepresentation of the GO
category 'response to ROS' in all MB+ cells. In
summary, MB may stabilize HIF1α and support the hypoxia response in
epithelial cancer cells, which may reduce the formation of hypoxic
niches, resulting in a tumor-suppressing phenotype. Of note, the
activity of PHD2 could, to a certain extent, be replaced by PHD1
and PHD3 (51). However, the PHD2
expression levels were mostly higher compared with those of PHD1
and PHD3 based on their RPKM values. In addition, a strong
correlation of PHD2 and MB expression was previously reported in
breast cancer (29), making it
the prime candidate to potentially hydroxylate HIF1α in an
MB/NO-dependent manner. In agreement with the model established in
the present study, MB-generated NO· would simultaneously
also inhibit PHD1 and PHD3 activity (45).
A second major result of the present transcriptome
comparison of MB+ and siMB cancer cells
involved changes in metabolism. Breast and prostate
MB+ cells revealed upregulation of genes involved
in the energy-producing part of glycolysis and of LDHA,
which converts pyruvate into L-lactate and regenerates
NAD+ from NADH+ H+ to sustain
anaerobic substrate flux (52).
This was in line with the enhanced HIF1α signaling described above,
since the upregulated genes are known HIF1α targets (53). In contrast to the breast and
prostate cancer cell lines, hypoxic MB+ colon
cancer cells exhibited downregulation of glycolysis-related genes
and LDHA. GO term enrichment analyses of hypoxic colon
cancer cells revealed that MB may contribute to enhanced
cholesterol biosynthesis, previously described to occur in this
cell type (54). HMGCS1,
which induces cholesterol synthesis, was upregulated in
MB+ DLD-1 cells, whereas FOXO1, a negative
regulator of HMGCS1 expression and thus cholesterol
synthesis (55), was inactive.
The involvement of MB in cholesterol metabolism appears to be
unique to the colon cancer cell line cultured under hypoxia. By
contrast, the breast cancer line indicated a specific contribution
of MB to the metabolism of unsaturated fatty acids at normoxia, as
indicated by enrichment of the associated GO terms. This supported
previous in vitro studies demonstrating that oxy-MB was able
to bind palmitic and oleic acid with physiological binding
constants (13-15), potentially indicating a
non-canonical role of the globin in the intracellular transport of
unsaturated fatty acids. The observation that all three epithelial
cancer cell line transcriptomes indicated different metabolic
shifts in response to MB knockdown suggests that additional
cell type-specific properties need to be considered in order to
understand the distinct metabolic role of MB in different cancer
entities.
A third major finding of the present study was that
the GO categories associated with negative or positive p53-mediated
regulation of apoptosis and programmed cell death were
overrepresented in all three MB+ cell lines.
Since the three cell models differ in their p53 genotype, they
require separate interpretation of the transcriptome data.
LNCaP prostate cancer cells express the
wild-type-like TP53 mutation Pro72Arg, which has a higher
binding affinity to p73 and thus an increased potential to induce
apoptosis (56,57). In the prostate cancer cell line, a
multitude of p53 target genes were upregulated in
MB+ cells, including the elevated expression of
the p53 target gene TP21, which controls the G1/S
cell cycle checkpoint and inhibits cell cycle progression (58). The activity of p21 is enhanced by
increased ROS levels (59), as
implicated by the results of the GO term enrichment. Elevated ROS
levels, along with increased p53 activity, may trigger oxidative
damage-induced cell death and, as a result, selectively kill cancer
cells (60). As added indirect
evidence for the presence of ROS in the present cell model,
increased levels of HMOX1 were observed in
MB+ LNCaP; HMOX1 is an enzyme that can be
induced by oxidative stress and p53, and whose presence is also
associated with cell cycle arrest and reduced cancer cell viability
(60). This hypothetical
p53/p21-mediated tumor-suppressing effect was further substantiated
by the overrepresentation of GO categories associated with cell
motion and migration in siMB vs. MB+
cells. The transcriptome data of the prostate cancer model were
thus in agreement with the ameliorated survival prognoses of
patients with MB-positive prostate tumors (24). A hypothetical working model
explaining the potential impact of MB on p53 activity is presented
in Fig. 3.
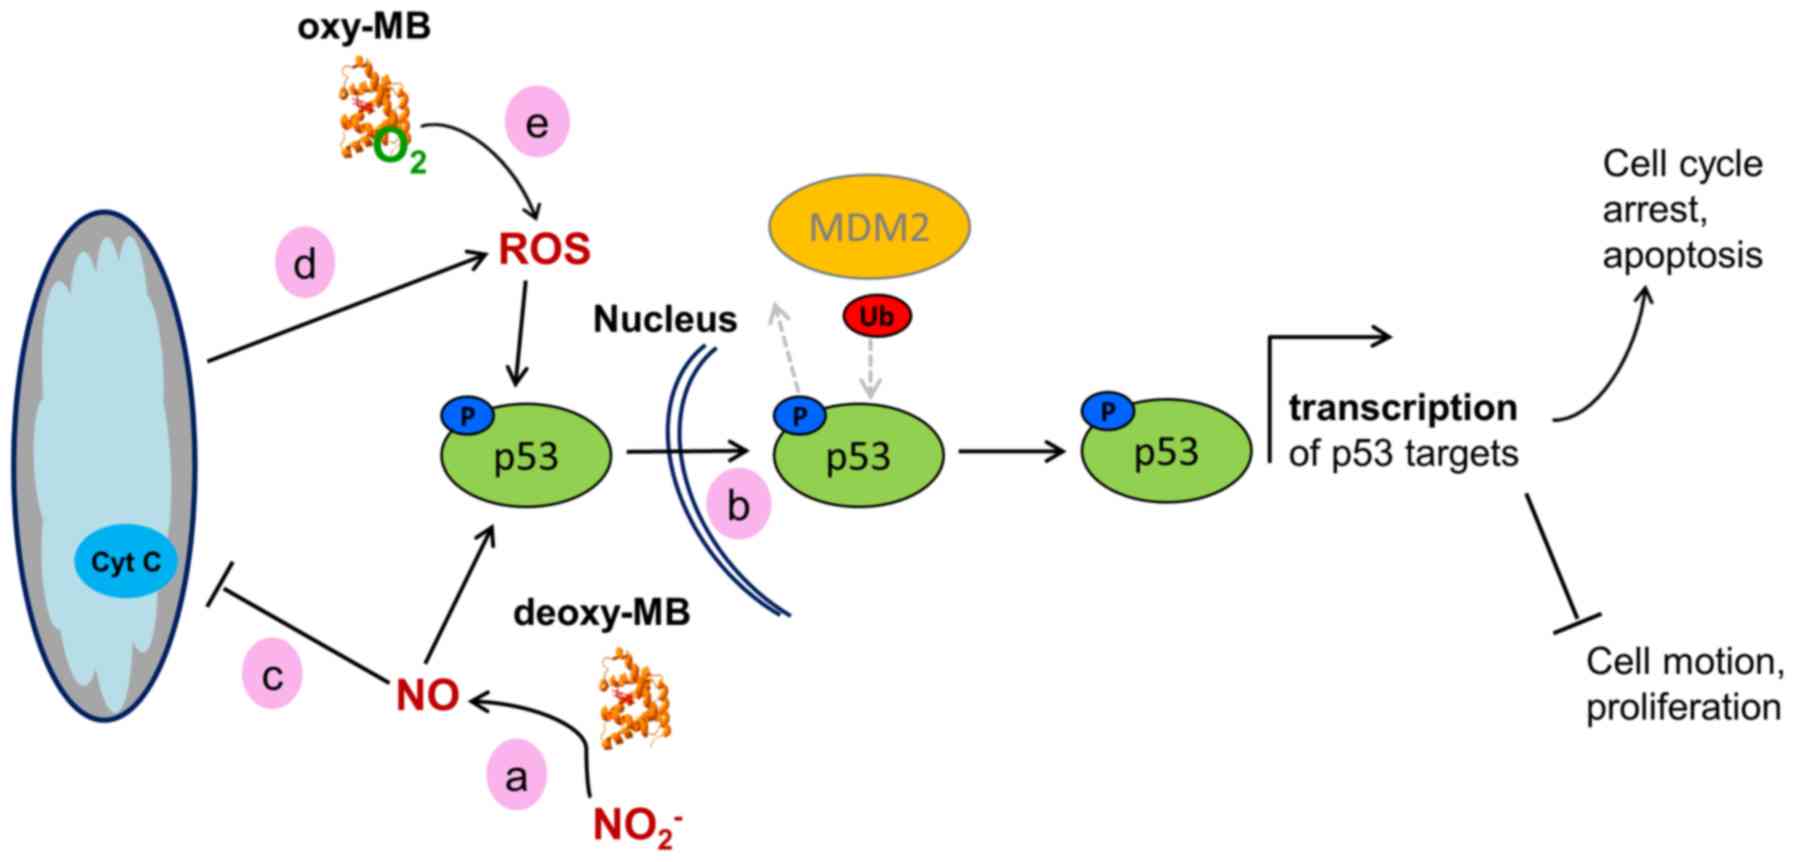 | Figure 3Working model of the hypothetical
effects of MB on the activity of WT p53 in cancer cells. (a)
Deoxy-MB may increase cellular NO· levels to facilitate
phosphorylation of p53. (b) Phosphorylated WT-p53 enters the
nucleus and, unless ubiquitinated by MDM2, facilitates
transcription of its target genes, resulting in a tumor-suppressor
cell phenotype. (c) NO· generated by deoxy-MB may
inhibit the mitochondrial respiratory chain, (d) which would result
in increased ROS levels. ROS could then affect p53 stabilization.
(e) Oxy-MB may also release ROS under hypoxia and mediate p53
stabilization. MB, myoglobin; WT, wild-type; NO·, nitric
oxide; ROS, reactive oxygen species; MDM2, MDM2 proto-oncogene; Ub,
ubiquitin; p, phosphorylated. |
As proposed previously in the HIF1α scenario,
deoxy-MB may enhance p53 action by producing NO· in
hypoxic LNCaP cells which, in turn, could induce the
phosphorylation of p53Pro72Arg and inhibit its nuclear
export by MDM2 proto-oncogene, resulting in nuclear retention and
subsequent activation (61).
Augmentation of p53Pro72Arg signaling may further be
maintained by stabilized HIF1α or by increased ROS levels (62,63), both of which may also be
associated with the action of deoxy-MB (Fig. 3).
In contrast to the prostate cancer line, the breast
cancer cell model MDA-MB468 encoded the gain-of-function
TP53 mutation Arg273His, which impairs p53 target site
binding (37). Despite the
inability to directly drive p53 target gene expression, mutated p53
could function by interacting with other proteins.
p53Arg273His may interact with and inactivate the tumor
suppressor p63 (39) in the cell
model used in the present study, as indicated by the observed
downregulation of p63 target genes in MB+ breast
cancer cells. This may lead to enhanced cell survival and decreased
apoptosis, which has been previously described in
TP53Arg273His vs. TP53-knockdown MDA-MB468
cells (38). In addition, mutated
p53 may act as a co-factor of the RELA proto-oncogene/NF-κB and
STAT3 complex to induce the transcription of NF-κB-regulated genes
(40). The present transcriptome
results suggested increased activity of p53Arg273His,
RELA and STAT3 in MB+ breast cancer cells.
Specifically for p53Arg273His expressing cell models, a
tumor-promoting effect of MB may be hypothesized, which could be
maintained, as proposed previously in terms of wild-type-like p53,
by MB-mediated activation and stabilization of
p53Arg273His via increased cellular NO·, ROS
and HIF1α levels (63).
In addition, GO-terms associated with cell
migration, motion, and adhesion were enriched in the genes
upregulated in MB+ MDA-MB468 cells. This finding
was in agreement with a previous study, which revealed increased
migratory potential, viability and proliferation rates in normoxia-
and hypoxia-cultured MB+ MDA-MB468 cells
(28), thus experimentally
validating our bioinformatics data. These in silico and
in vitro results from the MDA-MB468 breast cancer cell model
are contradictory to the beneficial prognostic outcome associated
with MB positivity in breast tumors (21). However, the published Kaplan-Meier
survival data lacked information about the patient p53 status. It
may be speculated that the observed prognostic correlation mainly
referred to wild-type-p53 cancer cases, but may result in the
opposite outcome if analyzing the prognostic impact of MB in
p53-gain-of-function mutated tumors. An alternative explanation is
the strong positive correlation of MB with ER-expression in breast
cancer, which itself is associated with better patient outcome. Of
note, MB expression had additive prognostic value to ER alone,
which raises the possibility of influences additional to the p53
status (21).
Transcription factor activity analyses also
suggested p53 to be active in MB+ DLD-1 colon
cancer cells, which encoded the TP53 mutation Ser241Phe.
Despite impaired target gene binding (37), p53Ser241Phe may also
hypothetically function via interaction with other proteins. In
analogy to MDA-MB468 cells, the predicted transcriptional
activation of RELA in MB+, p53-mutated
colon cancer cells suggested that the RELA/NF-κB/STAT3 complex may
be active and participate in the transcription of NF-κB target
genes (40).
However, in contrast to a tumor-promoting role of
MB in p53-mutated DLD-1 cells, upstream regulator analyses
indicated significantly decreased activity of FOXM1 in
MB+ DLD-1 cells, possibly indicating increased
G2/M arrest (64). In
addition, the transcription factor FOXO3, which acts as a tumor
suppressor by transcribing genes involved in cell cycle arrest and
DNA repair (65), was predicted
to be more active in MB+ DLD-1 cells. FOXO3 can be
trans-activated by HIF1α and induced by metabolic stress and
increased ROS levels (66), i.e.,
the conditions and transcription factors indicated to be active
with MB expression. Although the differential activity of mutant
p53 and RELA suggested tumor propagation by MB in DLD-1, the
results also indicated that MB expression may indirectly intervene
with cell cycle progression.
As an alternative scenario to a p53-driven cell
cycle arrest, oxy-MB was recently reported to decrease cell
proliferation by inducing mitochondrial fusion in p53-wild-type, as
well as in p53-gain-of-function-mutated and
p53-loss-of-function-mutated cell lines (42). In this network, oxy-MB was
described to produce ROS, which increased parkin oxidation and
inhibited the degradation of mitofusin 1 and 2. Thus, MB-positivity
was linked to an increase in mitochondrial fusion, resulting in
G1/S phase arrest. Although the results of the present
study also demonstrated enrichment of genes associated with
corresponding GO terms, the genes specifically involved in
ROS/parkin-driven cell cycle arrest were not differentially
expressed in any of the studied MB+ vs. siMB cell
transcriptomes.
In summary, the present study performed the first
transcriptome comparison of epithelial cancer cell models with
endogenous vs. knocked-down levels of MB mRNA expression.
The results of the present study revealed distinct changes in gene
expression following MB knockdown and suggested novel working
hypotheses to integrate MB function into metabolic pathways and
gene networks of epithelial cancer cells. Non-canonical enzymatic
functions, which have previously been reported for MB in myocytes,
seamlessly fit to explain a number of the present RNA-Seq results.
Thus, important starting points were identified for future
experimental work on the role of MB in tumors, e.g., by carefully
considering the p53 status when choosing cell models. The proposed
ability of MB to fine-tune levels of NO· and ROS
signaling molecules in epithelial cancer cells, if substantiated by
further biochemical research, may significantly improve our
understanding of cancer cell physiology.
Supplementary Data
Acknowledgments
Not applicable.
Funding
The present study was supported by Deutsche
Forschungsgemeinschaft (grant no. Ha2103/10-1) and intramural
grants by Johannes Gutenberg University Mainz (Stufe I) and the
Johannes Gutenberg University Center for Computer Studies
(CSM/SRFN). An Ingenuity Pathway Analysis license was provided by
the Naturwissenschaftlich-medizinisches Forschungszentrum (NMFZ)
and the University Medical Center Mainz. For cell culture, further
financial support was received from von-Muralt Stiftung für
Kleintiere, Switzerland.
Availability of data and materials
The datasets generated and analyzed during the
current study are available in the EBI repository as study
PRJEB31329 (https://www.ebi.ac.uk/ena/data/view/PRJEB31329).
Authors' contributions
AB processed and analyzed the RNA-Seq and wrote the
manuscript. TN analyzed the RNA-Seq data. DG and MAA conducted cell
culture experiments. GK and JF inspected the data and revised the
manuscript. TAG conducted cell culture experiments, inspected the
data and revised the manuscript. TH interpreted the data and wrote
the final manuscript. All authors read and approved the final
manuscript.
Ethics approval and consent to
participate
Not applicable.
Patient consent for publication
Not applicable.
Competing interests
The authors declare that they have no competing
interests.
References
|
1
|
Mac Munn CA: VI. Researches on myohamatin
and the histohæmatins. Phil. Trans R Soc. 177:267–298. 1886.
View Article : Google Scholar
|
|
2
|
Millikan GA: Experiments on muscle
hemoglobin in vivo; the instantaneous measurement of muscle
metabolism. Proc R Soc Lond B. 123:218–241. 1937. View Article : Google Scholar
|
|
3
|
Wittenberg BA and Wittenberg JB: Transport
of oxygen in muscle. Annu Rev Physiol. 51:857–878. 1989. View Article : Google Scholar : PubMed/NCBI
|
|
4
|
Wittenberg JB and Wittenberg BA: Myoglobin
function reassessed. J Exp Biol. 206:2011–2020. 2003. View Article : Google Scholar : PubMed/NCBI
|
|
5
|
Endeward V, Gros G and Jürgens KD:
Significance of myoglobin as an oxygen store and oxygen transporter
in the intermittently perfused human heart: A model study.
Cardiovasc Res. 87:22–29. 2010. View Article : Google Scholar : PubMed/NCBI
|
|
6
|
Gödecke A, Flögel U, Zanger K, Ding Z,
Hirchenhain J, Decking UK and Schrader J: Disruption of myoglobin
in mice induces multiple compensatory mechanisms. Proc Natl Acad
Sci USA. 96:10495–10500. 1999. View Article : Google Scholar : PubMed/NCBI
|
|
7
|
Grange RW, Meeson A, Chin E, Lau KS, Stull
JT, Shelton JM, Williams RS and Garry DJ: Functional and molecular
adaptations in skeletal muscle of myoglobin-mutant mice. Am J
Physiol Cell Physiol. 281:C1487–C1494. 2001. View Article : Google Scholar : PubMed/NCBI
|
|
8
|
Flögel U, Merx MW, Godecke A, Decking UK
and Schrader J: Myoglobin: A scavenger of bioactive NO. Proc Natl
Acad Sci USA. 98:735–740. 2001. View Article : Google Scholar : PubMed/NCBI
|
|
9
|
Flögel U, Gödecke A, Klotz LO and Schrader
J: Role of myoglobin in the antioxidant defense of the heart. FASEB
J. 18:1156–1158. 2004. View Article : Google Scholar : PubMed/NCBI
|
|
10
|
Helbo S, Dewilde S, Williams DR, Berghmans
H, Berenbrink M, Cossins AR and Fago A: Functional differentiation
of myoglobin isoforms in hypoxia-tolerant carp indicates
tissue-specific protective roles. Am J Physiol Regul Integr Comp
Physiol. 302:R693–R701. 2012. View Article : Google Scholar
|
|
11
|
Schlater AE, De Miranda MA Jr, Frye MA,
Trumble SJ and Kanatous SB: Changing the paradigm for myoglobin: A
novel link between lipids and myoglobin. J Appl Physiol 1985.
117:307–315. 2014. View Article : Google Scholar : PubMed/NCBI
|
|
12
|
Hendgen-Cotta UB, Kelm M and Rassaf T:
Myoglobin's novel role in nitrite-induced hypoxic vasodilation.
Trends Cardiovasc Med. 24:69–74. 2014. View Article : Google Scholar
|
|
13
|
Sriram R, Kreutzer U, Shih L and Jue T:
Interaction of fatty acid with myoglobin. FEBS Lett. 582:3643–3649.
2008. View Article : Google Scholar : PubMed/NCBI
|
|
14
|
Shih L, Chung Y, Sriram R and Jue T:
Interaction of myoglobin with oleic acid. Chem Phys Lipids.
191:115–122. 2015. View Article : Google Scholar : PubMed/NCBI
|
|
15
|
Chintapalli SV, Jayanthi S, Mallipeddi PL,
Gundampati R, Suresh Kumar TK, van Rossum DB, Anishkin A and Adams
SH: Novel molecular interactions of acylcarnitines and fatty acids
with myoglobin. J Biol Chem. 291:25133–25143. 2016. View Article : Google Scholar : PubMed/NCBI
|
|
16
|
Flögel U, Laussmann T, Gödecke A, Abanador
N, Schäfers M, Fingas CD, Metzger S, Levkau B, Jacoby C and
Schrader J: Lack of myoglobin causes a switch in cardiac substrate
selection. Circ Res. 96:e68–e75. 2005. View Article : Google Scholar : PubMed/NCBI
|
|
17
|
Hendgen-Cotta UB, Esfeld S, Coman C,
Ahrends R, Klein-Hitpass L, Flögel U, Rassaf T and Totzeck M: A
novel physiological role for cardiac myoglobin in lipid metabolism.
Sci Rep. 7:432192017. View Article : Google Scholar : PubMed/NCBI
|
|
18
|
Ruck P, Horny HP, Greschniok A, Wehrmann M
and Kaiserling E: Nonspecific immunostaining of blast cells of
acute leukemia by antibodies against nonhemopoietic antigens.
Hematol Pathol. 9:49–56. 1995.PubMed/NCBI
|
|
19
|
Zhang PJ, Goldblum JR, Pawel BR, Fisher C,
Pasha TL and Barr FG: Immunophenotype of desmoplastic small round
cell tumors as detected in cases with EWS-WT1 gene fusion product.
Mod Pathol. 16:229–235. 2003. View Article : Google Scholar : PubMed/NCBI
|
|
20
|
Flonta SE, Arena S, Pisacane A, Michieli P
and Bardelli A: Expression and functional regulation of myoglobin
in epithelial cancers. Am J Pathol. 175:201–206. 2009. View Article : Google Scholar : PubMed/NCBI
|
|
21
|
Kristiansen G, Rose M, Geisler C,
Fritzsche FR, Gerhardt J, Lüke C, Ladhoff AM, Knüchel R, Dietel M,
Moch H, et al: Endogenous myoglobin in human breast cancer is a
hallmark of luminal cancer phenotype. Br J Cancer. 102:1736–1745.
2010. View Article : Google Scholar : PubMed/NCBI
|
|
22
|
Oleksiewicz U, Daskoulidou N, Liloglou T,
Tasopoulou K, Bryan J, Gosney JR, Field JK and Xinarianos G:
Neuroglobin and myoglobin in non-small cell lung cancer:
Expression, regulation and prognosis. Lung Cancer. 74:411–418.
2011. View Article : Google Scholar : PubMed/NCBI
|
|
23
|
Behnes CL, Bedke J, Schneider S, Küffer S,
Strauss A, Bremmer F, Ströbel P and Radzun HJ: Myoglobin expression
in renal cell carcinoma is regulated by hypoxia. Exp Mol Pathol.
95:307–312. 2013. View Article : Google Scholar : PubMed/NCBI
|
|
24
|
Meller S, Bicker A, Montani M, Ikenberg K,
Rostamzadeh B, Sailer V, Wild P, Dietrich D, Uhl B, Sulser T, et
al: Myoglobin expression in prostate cancer is correlated to
androgen receptor expression and markers of tumor hypoxia. Virchows
Arch. 465:419–427. 2014. View Article : Google Scholar : PubMed/NCBI
|
|
25
|
Meller S, VAN Ellen A, Gevensleben H,
Bicker A, Hankeln T, Gorr TA, Sailer V, Dröge F, Schröck F, Bootz
F, et al: Ectopic myoglobin expression is associated with a
favourable outcome in head and neck squamous cell carcinoma
patients. Anticancer Res. 36:6235–6241. 2016. View Article : Google Scholar : PubMed/NCBI
|
|
26
|
Bicker A, Dietrich D, Gleixner E,
Kristiansen G, Gorr TA and Hankeln T: Extensive transcriptional
complexity during hypoxia-regulated expression of the myoglobin
gene in cancer. Hum Mol Genet. 23:479–490. 2014. View Article : Google Scholar
|
|
27
|
Bicker A, Brahmer AM, Meller S,
Kristiansen G, Gorr TA and Hankeln T: The distinct gene regulatory
network of myoglobin in prostate and breast cancer. PLoS One.
10:e01426622015. View Article : Google Scholar : PubMed/NCBI
|
|
28
|
Kristiansen G, Hu J, Wichmann D, Stiehl
DP, Rose M, Gerhardt J, Bohnert A, ten Haaf A, Moch H, Raleigh J,
et al: Endogenous myoglobin in breast cancer is hypoxia-inducible
by alternative transcription and functions to impair mitochondrial
activity: A role in tumor suppression. J Biol Chem.
286:43417–43428. 2011. View Article : Google Scholar : PubMed/NCBI
|
|
29
|
Gorr TA, Wichmann D, Pilarsky C,
Theurillat JP, Fabrizius A, Laufs T, Bauer T, Koslowski M, Horn S,
Burmester T, et al: Old proteins - new locations: Myoglobin,
haemoglobin, neuroglobin and cytoglobin in solid tumours and cancer
cells. Acta Physiol (Oxf). 202:563–581. 2011. View Article : Google Scholar
|
|
30
|
Mortazavi A, Williams BA, McCue K,
Schaeffer L and Wold B: Mapping and quantifying mammalian
transcriptomes by RNA-Seq. Nat Methods. 5:621–628. 2008. View Article : Google Scholar : PubMed/NCBI
|
|
31
|
Kal AJ, van Zonneveld AJ, Benes V, van den
Berg M, Koerkamp MG, Albermann K, Strack N, Ruijter JM, Richter A,
Dujon B, et al: Dynamics of gene expression revealed by comparison
of serial analysis of gene expression transcript profiles from
yeast grown on two different carbon sources. Mol Biol Cell.
10:1859–1872. 1999. View Article : Google Scholar : PubMed/NCBI
|
|
32
|
Maere S, Heymans K and Kuiper M: BiNGO: A
Cytoscape plugin to assess overrepresentation of gene ontology
categories in biological networks. Bioinformatics. 21:3448–3449.
2005. View Article : Google Scholar : PubMed/NCBI
|
|
33
|
Huang da W, Sherman BT and Lempicki RA:
Systematic and integrative analysis of large gene lists using DAVID
bioinformatics resources. Nat Protoc. 4:44–57. 2009. View Article : Google Scholar : PubMed/NCBI
|
|
34
|
Huang da W, Sherman BT and Lempicki RA:
Bioinformatics enrichment tools: Paths toward the comprehensive
functional analysis of large gene lists. Nucleic Acids Res.
37:1–13. 2009. View Article : Google Scholar
|
|
35
|
Totzeck M, Hendgen-Cotta UB, Kelm M and
Rassaf T: Crosstalk between nitrite, myoglobin and reactive oxygen
species to regulate vasodilation under hypoxia. PLoS One.
9:e1059512014. View Article : Google Scholar : PubMed/NCBI
|
|
36
|
Vousden KH and Prives C: Blinded by the
light: The growing complexity of p53. Cell. 137:413–431. 2009.
View Article : Google Scholar : PubMed/NCBI
|
|
37
|
Saha T, Kar RK and Sa G: Structural and
sequential context of p53: A review of experimental and theoretical
evidence. Prog Biophys Mol Biol. 117:250–263. 2015. View Article : Google Scholar : PubMed/NCBI
|
|
38
|
Lim LY, Vidnovic N, Ellisen LW and Leong
CO: Mutant p53 mediates survival of breast cancer cells. Br J
Cancer. 101:1606–1612. 2009. View Article : Google Scholar : PubMed/NCBI
|
|
39
|
Muller PA, Vousden KH and Norman JC: p53
and its mutants in tumor cell migration and invasion. J Cell Biol.
192:209–218. 2011. View Article : Google Scholar : PubMed/NCBI
|
|
40
|
Choy MK, Movassagh M, Siggens L, Vujic A,
Goddard M, Sánchez A, Perkins N, Figg N, Bennett M, Carroll J and
Foo R: High-throughput sequencing identifies STAT3 as the
DNA-associated factor for p53-NF-kappaB-complex-dependent gene
expression in human heart failure. Genome Med. 2:372010. View Article : Google Scholar : PubMed/NCBI
|
|
41
|
Galluzzo M, Pennacchietti S, Rosano S,
Comoglio PM and Michieli P: Prevention of hypoxia by myoglobin
expression in human tumor cells promotes differentiation and
inhibits metastasis. J Clin Invest. 119:865–875. 2009. View Article : Google Scholar : PubMed/NCBI
|
|
42
|
Braganza A, Quesnelle K, Bickta J, Reyes
C, Wang Y, Jessup M, St Croix C, Arlotti J, Singh SV and Shiva S:
Myoglobin induces mitochondrial fusion, thereby inhibiting breast
cancer cell proliferation. J Biol Chem. 294:7269–7282. 2019.
View Article : Google Scholar : PubMed/NCBI
|
|
43
|
Wang GL, Jiang BH, Rue EA and Semenza GL:
Hypoxia-inducible factor 1 is a basic-helix-loop-helix-PAS
heterodimer regulated by cellular O2 tension. Proc Natl Acad Sci
USA. 92:5510–5514. 1995. View Article : Google Scholar : PubMed/NCBI
|
|
44
|
Stiehl DP, Bordoli MR, Abreu-Rodríguez I,
Wollenick K, Schraml P, Gradin K, Poellinger L, Kristiansen G and
Wenger RH: Non-canonical HIF-2α function drives autonomous breast
cancer cell growth via an AREG-EGFR/ErbB4 autocrine loop. Oncogene.
31:2283–2297. 2012. View Article : Google Scholar
|
|
45
|
Metzen E, Zhou J, Jelkmann W, Fandrey J
and Brüne B: Nitric oxide impairs normoxic degradation of
HIF-1alpha by inhibition of prolyl hydroxylases. Mol Biol Cell.
14:3470–3481. 2003. View Article : Google Scholar : PubMed/NCBI
|
|
46
|
Berchner-Pfannschmidt U, Yamac H, Trinidad
B and Fandrey J: Nitric oxide modulates oxygen sensing by
hypoxia-inducible factor 1-dependent induction of prolyl
hydroxylase 2. J Biol Chem. 282:1788–1796. 2007. View Article : Google Scholar
|
|
47
|
Depping R, Steinhoff A, Schindler SG,
Friedrich B, Fagerlund R, Metzen E, Hartmann E and Köhler M:
Nuclear translocation of hypoxia-inducible factors (HIFs):
Involvement of the classical importin alpha/beta pathway. Biochim
Biophys Acta. 1783:394–404. 2008. View Article : Google Scholar : PubMed/NCBI
|
|
48
|
Berchner-Pfannschmidt U, Tug S, Kirsch M
and Fandrey J: Oxygen-sensing under the influence of nitric oxide.
Cell Signal. 22:349–356. 2010. View Article : Google Scholar
|
|
49
|
Hagen T: Oxygen versus reactive oxygen in
the regulation of HIF-1α: The balance tips. Biochem Res Int.
2012:4369812012. View Article : Google Scholar
|
|
50
|
Niecknig H, Tug S, Reyes BD, Kirsch M,
Fandrey J and Berchner-Pfannschmidt U: Role of reactive oxygen
species in the regulation of HIF-1 by prolyl hydroxylase 2 under
mild hypoxia. Free Radic Res. 46:705–717. 2012. View Article : Google Scholar : PubMed/NCBI
|
|
51
|
Appelhoff RJ, Tian YM, Raval RR, Turley H,
Harris AL, Pugh CW, Ratcliffe PJ and Gleadle JM: Differential
function of the prolyl hydroxylases PHD1, PHD2, and PHD3 in the
regulation of hypoxia-inducible factor. J Biol Chem.
279:38458–38465. 2004. View Article : Google Scholar : PubMed/NCBI
|
|
52
|
Rossignol R, Gilkerson R, Aggeler R,
Yamagata K, Remington SJ and Capaldi RA: Energy substrate modulates
mitochondrial structure and oxidative capacity in cancer cells.
Cancer Res. 64:985–993. 2004. View Article : Google Scholar : PubMed/NCBI
|
|
53
|
Semenza GL, Roth PH, Fang HM and Wang GL:
Transcriptional regulation of genes encoding glycolytic enzymes by
hypoxia-inducible factor 1. J Biol Chem. 269:23757–23763.
1994.PubMed/NCBI
|
|
54
|
Notarnicola M, Messa C, Pricci M, Guerra
V, Altomare DF, Montemurro S and Caruso MG: Up-regulation of
3-hydroxy-3-meth-ylglutaryl coenzyme A reductase activity in
left-sided human colon cancer. Anticancer Res. 24:3837–3842.
2004.
|
|
55
|
Liu Z, Rudd MD, Hernandez-Gonzalez I,
Gonzalez-Robayna I, Fan HY, Zeleznik AJ and Richards JS: FSH and
FOXO1 regulate genes in the sterol/steroid and lipid biosynthetic
pathways in granulosa cells. Mol Endocrinol. 23:649–661. 2009.
View Article : Google Scholar : PubMed/NCBI
|
|
56
|
Marin MC, Jost CA, Brooks LA, Irwin MS,
O'Nions J, Tidy JA, James N, McGregor JM, Harwood CA, Yulug IG, et
al: A common polymorphism acts as an intragenic modifier of mutant
p53 behaviour. Nat Genet. 25:47–54. 2000. View Article : Google Scholar : PubMed/NCBI
|
|
57
|
Dumont P, Leu JI, Della Pietra AC III,
George DL and Murphy M: The codon 72 polymorphic variants of p53
have markedly different apoptotic potential. Nat Genet. 33:357–365.
2003. View
Article : Google Scholar : PubMed/NCBI
|
|
58
|
Deng C, Zhang P, Harper JW, Elledge SJ and
Leder P: Mice lacking p21CIP1/WAF1 undergo normal development, but
are defective in G1 checkpoint control. Cell. 82:675–684. 1995.
View Article : Google Scholar : PubMed/NCBI
|
|
59
|
Vurusaner B, Poli G and Basaga H: Tumor
suppressor genes and ROS: Complex networks of interactions. Free
Radic Biol Med. 52:7–18. 2012. View Article : Google Scholar
|
|
60
|
Andrés NC, Fermento ME, Gandini NA, Romero
AL, Ferro A, Donna LG, Curino AC and Facchinetti MM: Heme
oxygenase-1 has antitumoral effects in colorectal cancer:
Involvement of p53. Exp Mol Pathol. 97:321–331. 2014. View Article : Google Scholar : PubMed/NCBI
|
|
61
|
Wang X, Zalcenstein A and Oren M: Nitric
oxide promotes p53 nuclear retention and sensitizes neuroblastoma
cells to apoptosis by ionizing radiation. Cell Death Differ.
10:468–476. 2003. View Article : Google Scholar : PubMed/NCBI
|
|
62
|
Chen D, Li M, Luo J and Gu W: Direct
interactions between HIF-1 alpha and Mdm2 modulate p53 function. J
Biol Chem. 278:13595–13598. 2003. View Article : Google Scholar : PubMed/NCBI
|
|
63
|
Sermeus A and Michiels C: Reciprocal
influence of the p53 and the hypoxic pathways. Cell Death Dis.
2:e1642011. View Article : Google Scholar : PubMed/NCBI
|
|
64
|
Gartel AL: FOXM1 in cancer: Interactions
and vulnerabilities. Cancer Res. 77:3135–3139. 2017. View Article : Google Scholar : PubMed/NCBI
|
|
65
|
Renault VM, Thekkat PU, Hoang KL, White
JL, Brady CA, Kenzelmann Broz D, Venturelli OS, Johnson TM, Oskoui
PR, Xuan Z, et al: The prolongevity gene FoxO3 is a direct target
of the p53 tumor suppressor. Oncogene. 30:3207–3221. 2011.
View Article : Google Scholar : PubMed/NCBI
|
|
66
|
Klotz LO, Sánchez-Ramos C, Prieto-Arroyo
I, Urbánek P, Steinbrenner H and Monsalve M: Redox regulation of
FoxO transcription factors. Redox Biol. 6:51–72. 2015. View Article : Google Scholar : PubMed/NCBI
|