Introduction
Oral squamous cell carcinoma (OSCC) is the sixth
most common cancer worldwide and often invades tissues locally and
metastasizes to cervical lymph nodes (1–3).
Oncogene overexpression or inactivation mechanisms on tumor
suppressor genes through mutations, loss of heterozygosity,
deletions, or epigenetic modifications have been the major factors
in its development, local invasion and local metastasis (1,4).
The homeobox genes encode transcription factors that
acts either by activating or repressing downstream target genes
essential to cell growth and differentiation. It is estimated that
the human genome includes at least 200 homeobox genes, 39 of which
belong to the HOX family. These genes are functionally
important during embryonic morphogenesis and also regulate the
adult tissue architecture, identity and homeostasis, cell-cell
interactions and cell-extracellular matrix interactions (5).
In cancer, normal HOX gene expression is
disrupted, affecting various pathways that promote tumorigenesis
and metastasis, including the activation of anti-apoptotic pathways
and suppression of differentiation (6). HOX genes have been found to be
aberrantly expressed in a variety of solid tumors such as lymphoma
(7,8), melanoma (9), breast (10,11),
endometrial (10), liver (12), lung (13,14),
thyroid (15) and esophagus cancer
(16). Aberrant expression of
HOX genes was also observed in OSCC; however, how they
contribute to oral cancer phenotype and its tissue-specific
features remains unclear (17–19).
Detection of OSCC is currently based on expert
clinical examination and histological analysis of suspicious areas,
but it may be undetectable in hidden sites. Therefore, sensitive
and specific biomarkers for OSCC may be helpful to screening
high-risk patients (20). While
several studies proposed the identification of gene expression
patterns in head and neck cancer (21–24),
just a few investigated the differential expression profile of
homeobox genes family in OSCC (17,25–27)
as well as their correlation to tumor behavior, clinical parameters
and survival rates (25,26), obtaining significant results.
Thus, the purpose of the present study was to search
for distinct pattern of homeobox gene expression through a
genome-wide analysis. Some up- and down-regulated homeobox genes
were chosen for further validation by qRT-PCR and correlated with
prognosis. Up-regulated homeobox genes were also validated on OSCC
cell lines.
Materials and methods
Tissue samples
Specimens were obtained during surgical resection
from patients aged ≥40 years, admitted for diagnosis and treatment
at Arnaldo Vieira de Carvalho Cancer Institute, Hospital Heliópolis
and Hospital das Clínicas of São Paulo University Medical School.
Histopathological diagnosis was performed according to the WHO
classification of tumors by the Department of Pathology of each
Institution. Clinicopathological staging was determined by the TNM
classification of the IUCC (28).
The study was approved by the Ethics Committee of each Institution
and was based on the criteria of the Helsinki convention.
Fresh surgical samples of primary OSCC and their
corresponding non-neoplastic margin tissues were immediately
snap-frozen in liquid nitrogen upon surgical removal. After
histological confirmation, all tissue samples were checked prior to
RNA extraction so that each OSCC sample contained at least 70%
tumor cells and the corresponding surgical margins were reported as
‘tumor-free’. GENCAPO (Head and Neck Genome Project) Consortium was
responsible for sample collection and initial processing, clinical
data collection, providing of histopathological analysis of tissue
samples, and informed consent acquisition of each patient.
Cell lines and cell culture
SCC-4, -9, -15 and -25 (OSCC cell lines) were
obtained from the American Type Culture Collection (ATCC, Manassas,
VA, USA) and kindly provided by Professor Ricardo Della Coletta
(School of Dentistry, UNICAMP). OSCC as well as HaCat cell lines
were grown as described previously (25). Normal oral keratinocytes (NOK) were
obtained from oral epithelial fragments under enzymatic digestion
method, kindly provided by Dr Maria Fatima Guarizo Klingbeil
(29).
RNA extraction and cDNA synthesis
Total cellular RNA was extracted using
TRIzol® Reagent (Invitrogen, Carlsbad, CA, USA)
according to the manufacturer's instructions and the RNA integrity
was evaluated based on the intensity of 28S and 18S rRNA bands in
1% agarose gels and on A260/280 ratio between 1.8 and 2.0.
RNA obtained from tissue samples (1 μg) and cell
lines (4 μg) was reverse transcribed to single-stranded cDNA using
High Capacity cDNA Reverse Transcription kit (Applied Biosystems™,
Foster City, CA, USA) and Superscript III™ with oligo(dT) primers
and RNase OUT (Invitrogen), respectively, after incubation with
DNAse I (Invitrogen).
Microarray hybridization
Ten tissue samples of primary OSCC of tongue and
floor of the mouth, as well as a pool of non-neoplastic surgical
margins were used for microarray analysis. Experiments were carried
out as described in Severino et al (30) using CodeLink Whole Genome Bioarrays
(GE Healthcare, Piscataway, NJ, USA) representing 55,000 human
transcripts and arrays were scanned on a GenePix 4000B Array
Scanner (Axon Instruments), according to the recommended scanning
procedures and settings. The data were treated with Code-Link
feature extraction software v.4.0. A normalized signal for each
transcript was obtained through quantile normalization (31). For global homeobox gene expression
visualization, a hierarchical clustering using the Euclidean
distance and the average linkage algorithm was performed
(MeV® MultiExperiment Viewer software version 4.1,
Boston, MA, USA) (32,33).
Individual homeobox gene expression profile in OSCC
samples and their respective non-neoplastic oral tissues were
compared with each other. Differentially expressed genes were
identified by calculating the ratio of the mean normalized
fluorescence values obtained from each sample group. Results were
expressed as fold variation, and genes displaying greater than
2-fold changes in transcript abundance in all tumor samples were
selected. The array design and raw data files are available at the
Gene Expression Omnibus database (GEO) under the accession number
GSE9792. The most up-regulated homeobox genes were selected and
analyzed by qRT-PCR.
qRT-PCR
Samples of OSCC tissues and non-neoplastic margins
were assessed for the expression levels of selected homeobox genes
(HOXA5, n=36; HOXD10 and HOXD11, n=39). The
same was performed for all cell lines described above. Endogenous
housekeeping gene coding for the hypoxanthine guanine
phosphoribosyltransferase gene (HPRT; NM_000194.2; F:
ccaccaccctgttgctgta and R: tcccctgttgactggtcat; 119 bp) was used
for data normalization and relative quantification was performed
using relative standard curve analysis with a 7500 real-time PCR
System (Applied Biosystems, Foster City, CA). Amplification of
specific PCR products was detected using the SYBR Green PCR Master
Mix (Applied Biosystems) according to the manufacturer's protocol.
Each run was completed with a melting curve analysis to confirm the
specificity of amplification and lack of primer dimers.
HOXA5 primer sequences (NM_019102.2) were designed from a
specified exon-exon junction of the gene of interest (F:
gcgcccgccatgtcctac and R: agaccggcgcctgggcc; 151 bp), using
GeneTool 2.0 software (Biotools, Edmonton, AB, Canada).
HOXD10 (NM_002148.3) and HOXD11 (NM_021192.2) primers
were purchased from SuperArray Biosciences™ (Frederick, MD, USA,
RT2 qPCR Primer Assay, cat# PPH11616A; 147 bp and PPH19882A; 155
bp, respectively). All qPCR reactions were performed in a total
volume of 25 μL, containing 1 μL of cDNA sample, 10 ρmol of each
primer (400 nM) or 1.0 μL of RT2 PCR primer set and 12.5 μL of SYBR
Green Master Mix® (Applied Biosystems). The thermal
cycling was carried out by starting with 95˚C for 10 min hold,
followed by 40 amplification cycles of 95˚C for 10 sec and 60˚C for
1 min.
Statistical analysis
The differences in gene expression levels in tissue
samples and OSCC cell lines were analyzed by Wilcoxon
non-parametric test and one-way ANOVA with Tukey's post-test,
respectively. The differential expression of HOXA5,
HOXD10 and HOXD11 in tissue samples was divided into
two groups (higher versus lower) according to the value obtained
from qRT-PCR. The cut-off value was set up at the median expression
level. Fisher's exact test was used to estimate statistical
difference between HOX genes expression levels and
clinicopathological parameters such as mean age, tumor location,
tumor size-pT, nodal metastasis-pN, pathological grade, lymphatic
and/or perineural invasion and recurrence. For this analysis, only
OSCC samples paired with their respective non-neoplastic margins in
which HOX genes exhibited detectable expression by qRT-PCR
were used (HOXA5, n=35; HOXD10 and HOXD11,
n=34). Kaplan-Meier product-limit estimation with log-rank
(P<0.05) was used for survival analysis from life-time data
according to gene expression levels, in view of investigating the
most relevant gene or gene sets to predict tumor prognosis, as well
as anatomic site, histopathological grade of differentiation,
perineural and/or lymphatic infiltration. Overall survival was
defined as time from surgery to the day of death or last follow-up.
Statistical package GraphPad Prism 5 (GraphPad Software, Inc., CA,
USA) was used for the statistics.
Results
HOX genes expression patterns in OSCC
tissues and cell lines
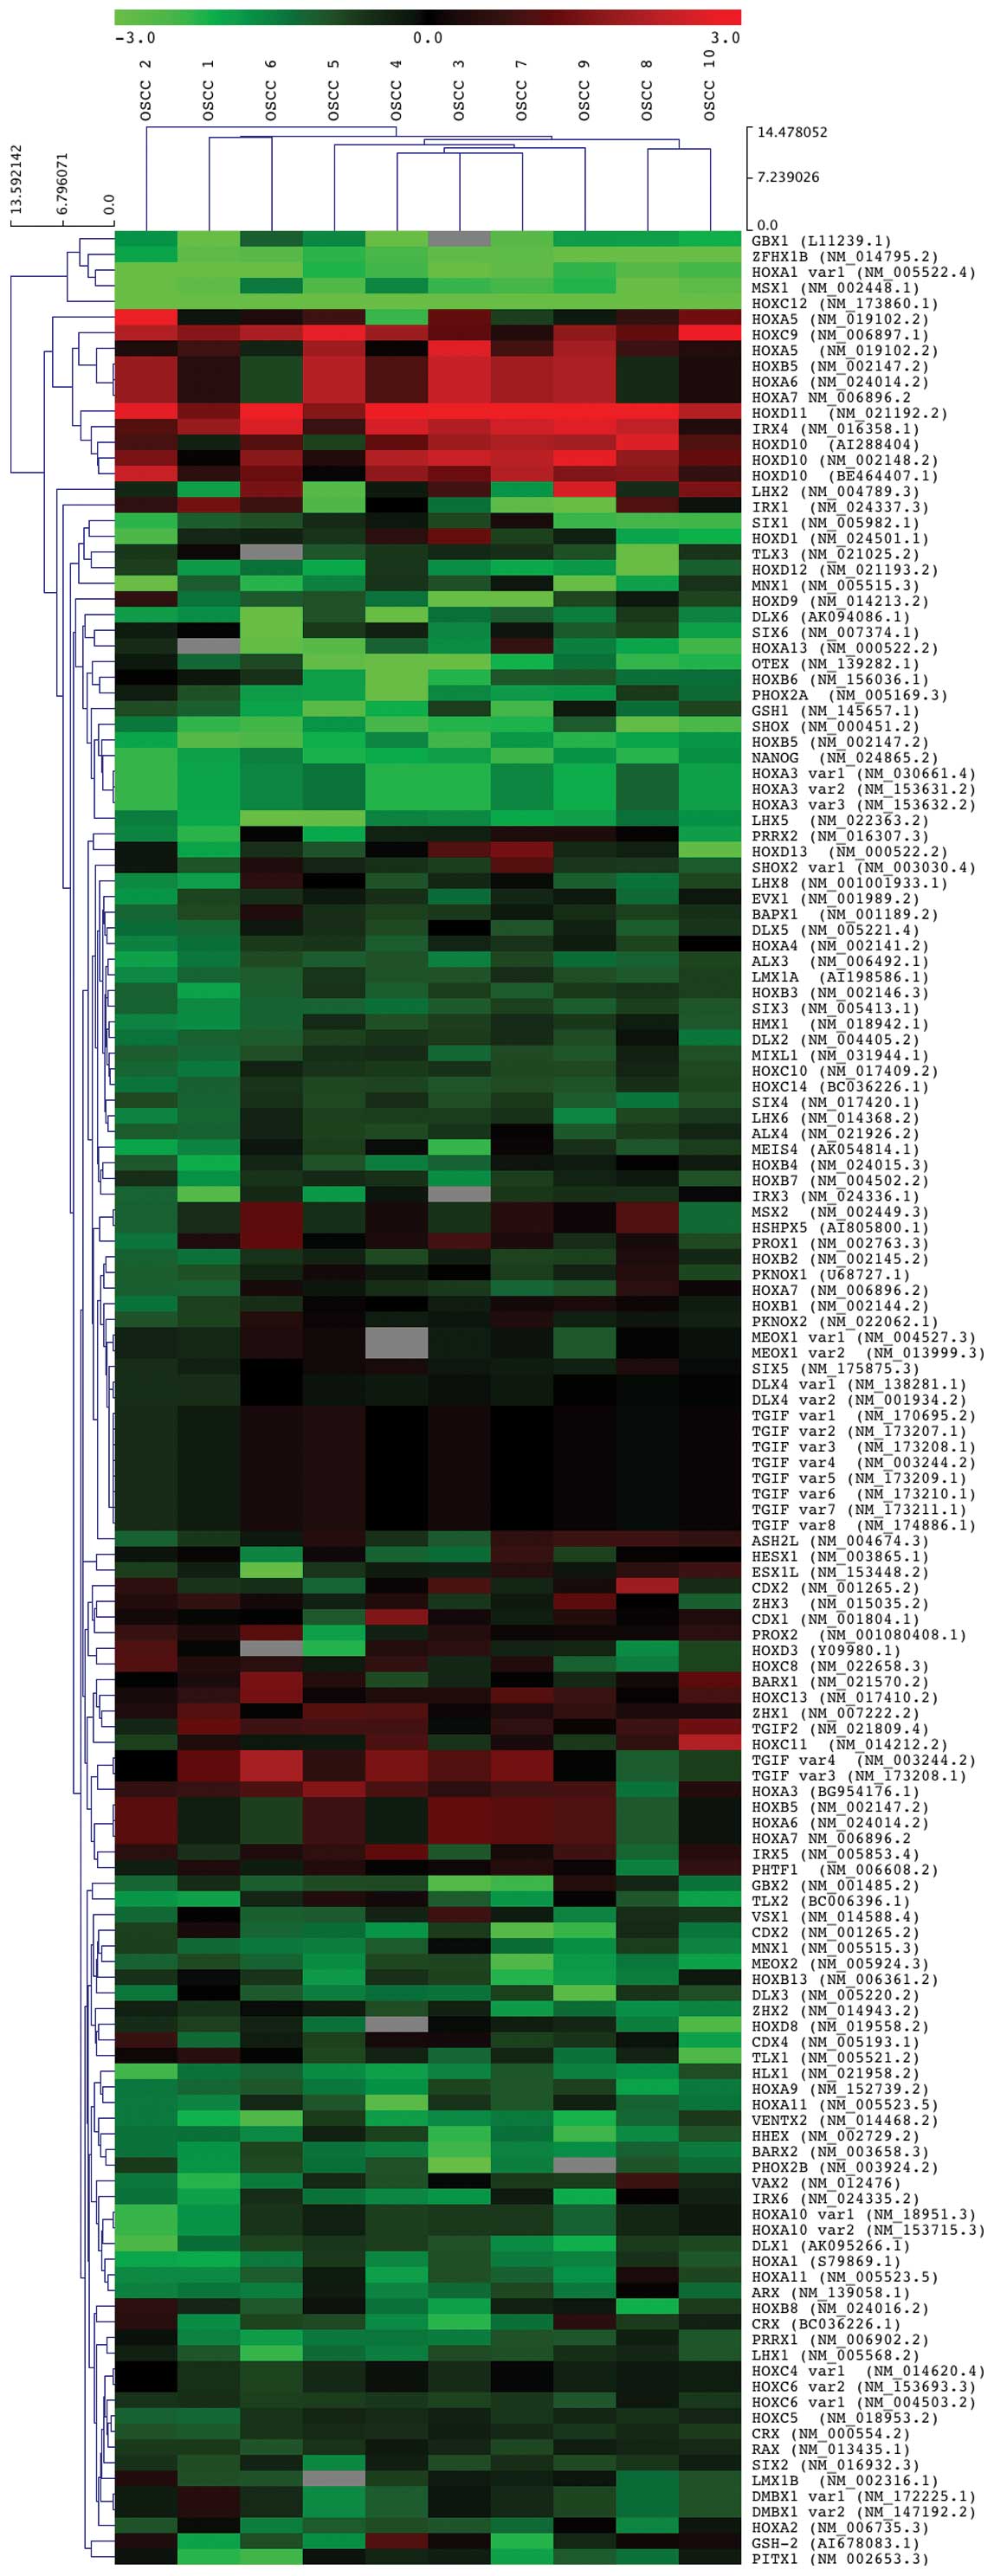
The profile of expression of the homeobox genes
through microarray analysis was performed and Fig. 1 shows up- and down-regulated
homeobox genes in tumors in relation to their non-tumoral
counterparts. A general analysis of microarray data revealed that,
among 147 homeobox genes evaluated, two sets of homeobox genes with
relatively homogeneous expression patterns were found, in which a
set of homeobox genes were predominantly down-regulated while the
other set was predominantly up-regulated. The other homeobox genes
showed differential expression patterns greatly variable between
OSCC tissue samples.
The set of at least 2-fold up-regulated homeobox
genes in OSCC samples included 6 genes (Table I) while the set of at least 2-fold
down-regulated homeobox genes included 34 genes. Considering the
technique resolution (noise) as well as the most viable clinical
application, the set of homeobox genes predominantly up-regulated
was chosen for validation.
 | Table IUp-regulated genes (≥2-fold) in OSCC
samples relative to non-neoplastic tissue as indicated by
microarray analysis. |
Table I
Up-regulated genes (≥2-fold) in OSCC
samples relative to non-neoplastic tissue as indicated by
microarray analysis.
| Gene | Mean
fold-change | NCBI access |
|---|
| HOXD11 | 8.88 | NM_021192.2 |
| HOXD10 | 8.88 | NM_002148.3 |
| HOXA5 | 8.21 | NM_019102.2 |
| IRX4 | 4.15 | NM_016358.2 |
| HOXC9 | 3.82 | NM_006897.1 |
| HOXA6 | 2.69 | NM_024014.2 |
Among the 6 up-regulated homeobox genes,
HOXA5, HOXD10 and HOXD11 showed the highest
expression levels (average: 8.65-fold). These genes were selected
for further analysis and validation by qRT-PCR in a larger cohort
of patients (HOXA5, n=36; HOXD10 and HOXD11,
n=39) and OSCC cell lines. When analyzing the frequency of
detectable gene expression per tumor sample (presence/absence), no
detectable expression of HOXA5 was observed in one case,
while absence of amplification of either HOXD10 or
HOXD11 transcripts was observed in two cases. However, when
comparing OSCC tissue samples with the paired non-neoplasic margins
(HOXA5, n=35; HOXD10 and HOXD11, n=34), high
mRNA expression levels of HOXA5, HOXD10 and
HOXD11 were consistently detected by qRT-PCR, with
statistical significance (P<0.001, P<0.001 and P<0.005,
respectively), as shown in Table
II and Fig. 2.
| Table IIMedian (range) expression levels of
HOXA5, HOXD10 and HOXD11 homeobox genes by
qRT-PCR in OSCC samples and non-tumoral margins. |
Table II
Median (range) expression levels of
HOXA5, HOXD10 and HOXD11 homeobox genes by
qRT-PCR in OSCC samples and non-tumoral margins.
| Gene | OSCC (min-max) | Non-tumoral margin
(min-max) | P-valuea |
|---|
| HOXA5 | 3.24
(0.05–119.70) | 0.85
(0.06–25.76) | P<0.001 |
| HOXD10 | 15.09
(0.03–251.00) | 2.13
(0.001–58.25) | P<0.001 |
| HOXD11 | 50.29
(0.0002–855.60) | 2.51
(0.0006–639.00) | P<0.005 |
Sample characterization and the correlation of
HOXA5, HOXD10 and HOXD11 expression levels
with clinicopathological features and disease outcome were examined
and are shown on Table III. In
general, there was no significant association between HOXA5,
HOXD10 and HOXD11 expression levels and age group,
tumor location, pTNM classification, pathological grade, lymphatic
and/or perineural invasion and local recurrence. However, although
not statistically significant, moderately differentiated tumors
showed higher levels of HOXD11 expression (P=0.08).
| Table IIIAssociation of HOXA5,
HOXD10 and HOXD11 homeobox genes expression levels
with OSCC clinicopathological features (P-value according to
Fisher's exact test). |
Table III
Association of HOXA5,
HOXD10 and HOXD11 homeobox genes expression levels
with OSCC clinicopathological features (P-value according to
Fisher's exact test).
| Clinicopathological
features | No. of
casesb | HOXA5
expression | | HOXD10
expression | | HOXD11
expression | |
|---|
| Higher | Lower | P-value | Higher | Lower | P-value | Higher | Lower | P-value |
|---|
| Age |
| 40–60 years | 25 | 11 | 15 | 0.26 | 14 | 11 | 0.70 | 13 | 12 | 1.00 |
| >60 years | 9 | 6 | 3 | 4 | 5 | 5 | 4 |
| Tumor location |
| Tongue | 12 | 6 | 7 | 1.00 | 5 | 7 | 0.47 | 6 | 6 | 0.72 |
| Floor of
mouth | 22 | 11 | 11 | 13 | 9 | 13 | 9 |
| pT
classification |
| T1 | 3 | 3 | 1 | 1.00 | 2 | 1 | 0.73 | 2 | 1 | 1.00 |
| T2 | 11 | 4 | 7 | 6 | 5 | 4 | 7 |
| T3 | 13 | 6 | 7 | 7 | 6 | 11 | 2 |
| T4 | 7 | 4 | 3 | 3 | 4 | 2 | 5 |
| pN
classification |
| N+ | 14 | 7 | 8 | 1.00 | 8 | 6 | 0.73 | 6 | 8 | 1.00 |
| N0 | 20 | 10 | 10 | 10 | 10 | 13 | 7 |
| Pathological
grade |
| Well
differentiated | 16 | 9 | 8 | 0.73 | 8 | 8 | 1.00 | 6 | 10 | 0.08 |
| Moderately
differentiated | 18 | 8 | 10 | 10 | 8 | 13 | 5 |
| Lymphatic invasion
(LI)a |
| LI− | 21 | 11 | 11 | 0.72 | 12 | 9 | 0.73 | 12 | 9 | 1.00 |
| LI+ | 12 | 5 | 7 | 6 | 6 | 7 | |
| Perineural invasion
(PI) |
| PI− | 16 | 7 | 9 | 0.73 | 10 | 6 | 0.32 | 9 | 7 | 1.00 |
| PI+ | 18 | 10 | 9 | 8 | 10 | 10 | 8 |
| Local
recurrence |
| Present | 6 | 4 | 3 | 0.68 | 2 | 4 | 0.38 | 2 | 4 | 0.36 |
| Absent | 28 | 13 | 16 | 16 | 12 | 17 | 11 |
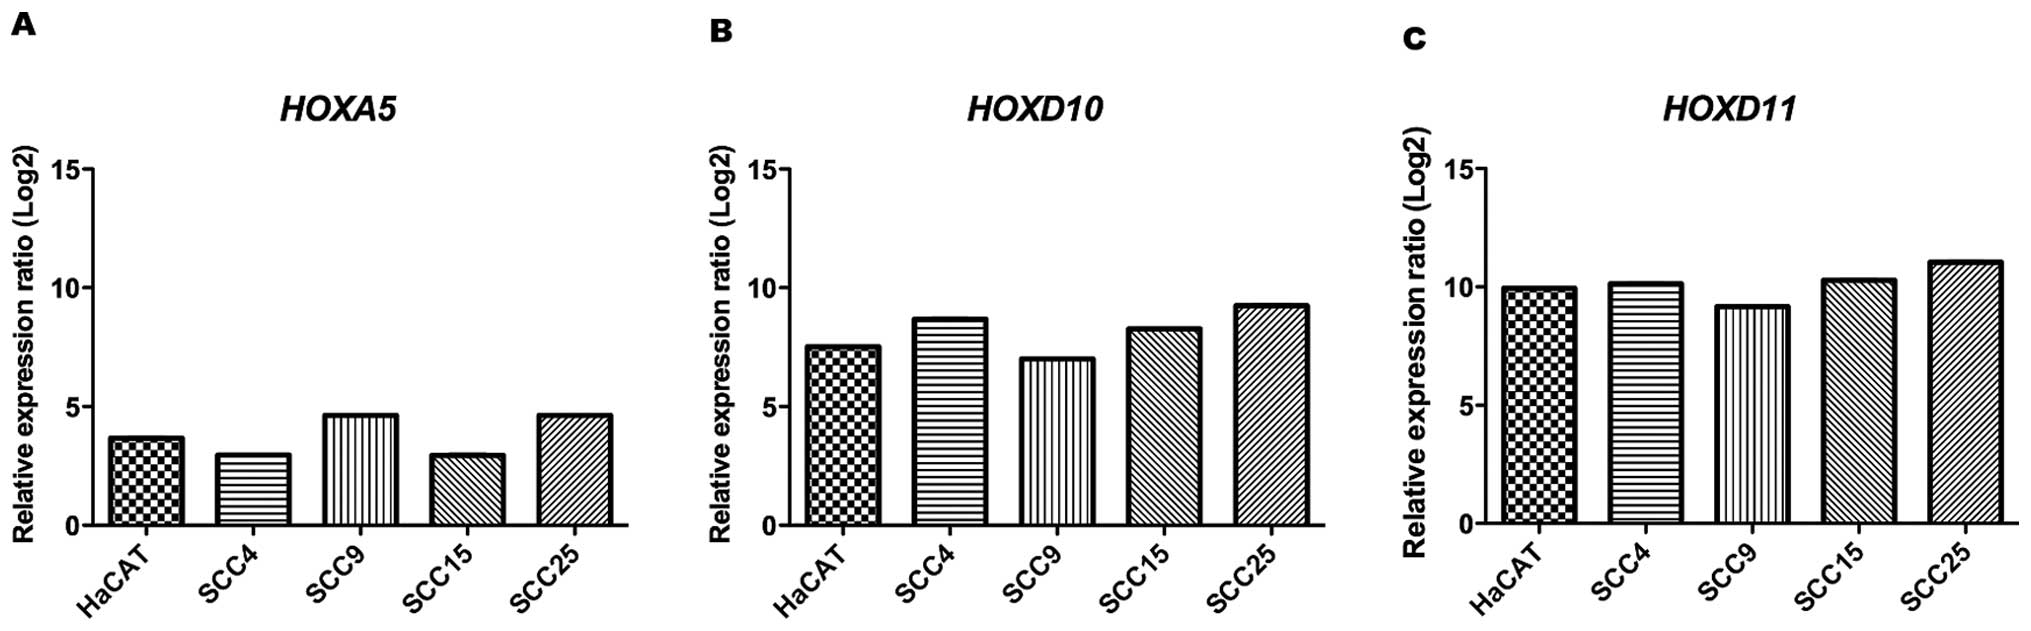
Additionally, the status of HOXA5,
HOXD10 and HOXD11 mRNA expression levels were
evaluated in HaCat and OSCC cell lines by qRT-PCR. Relative
quantitation analysis revealed that these genes were significantly
up-regulated in all cell lines when compared to NOK (calibrator
sample, gene expression level =1), showing mean levels of 4-fold,
8-fold and 10-fold higher (P<0.001) than NOK regarding
HOXA5, HOXD10 and HOXD11 expression,
respectively (Fig. 3). These data
confirm that the up-regulation of the genes observed in OSCC cell
lines were also in accordance to the microarray analysis of tissue
OSCC samples.
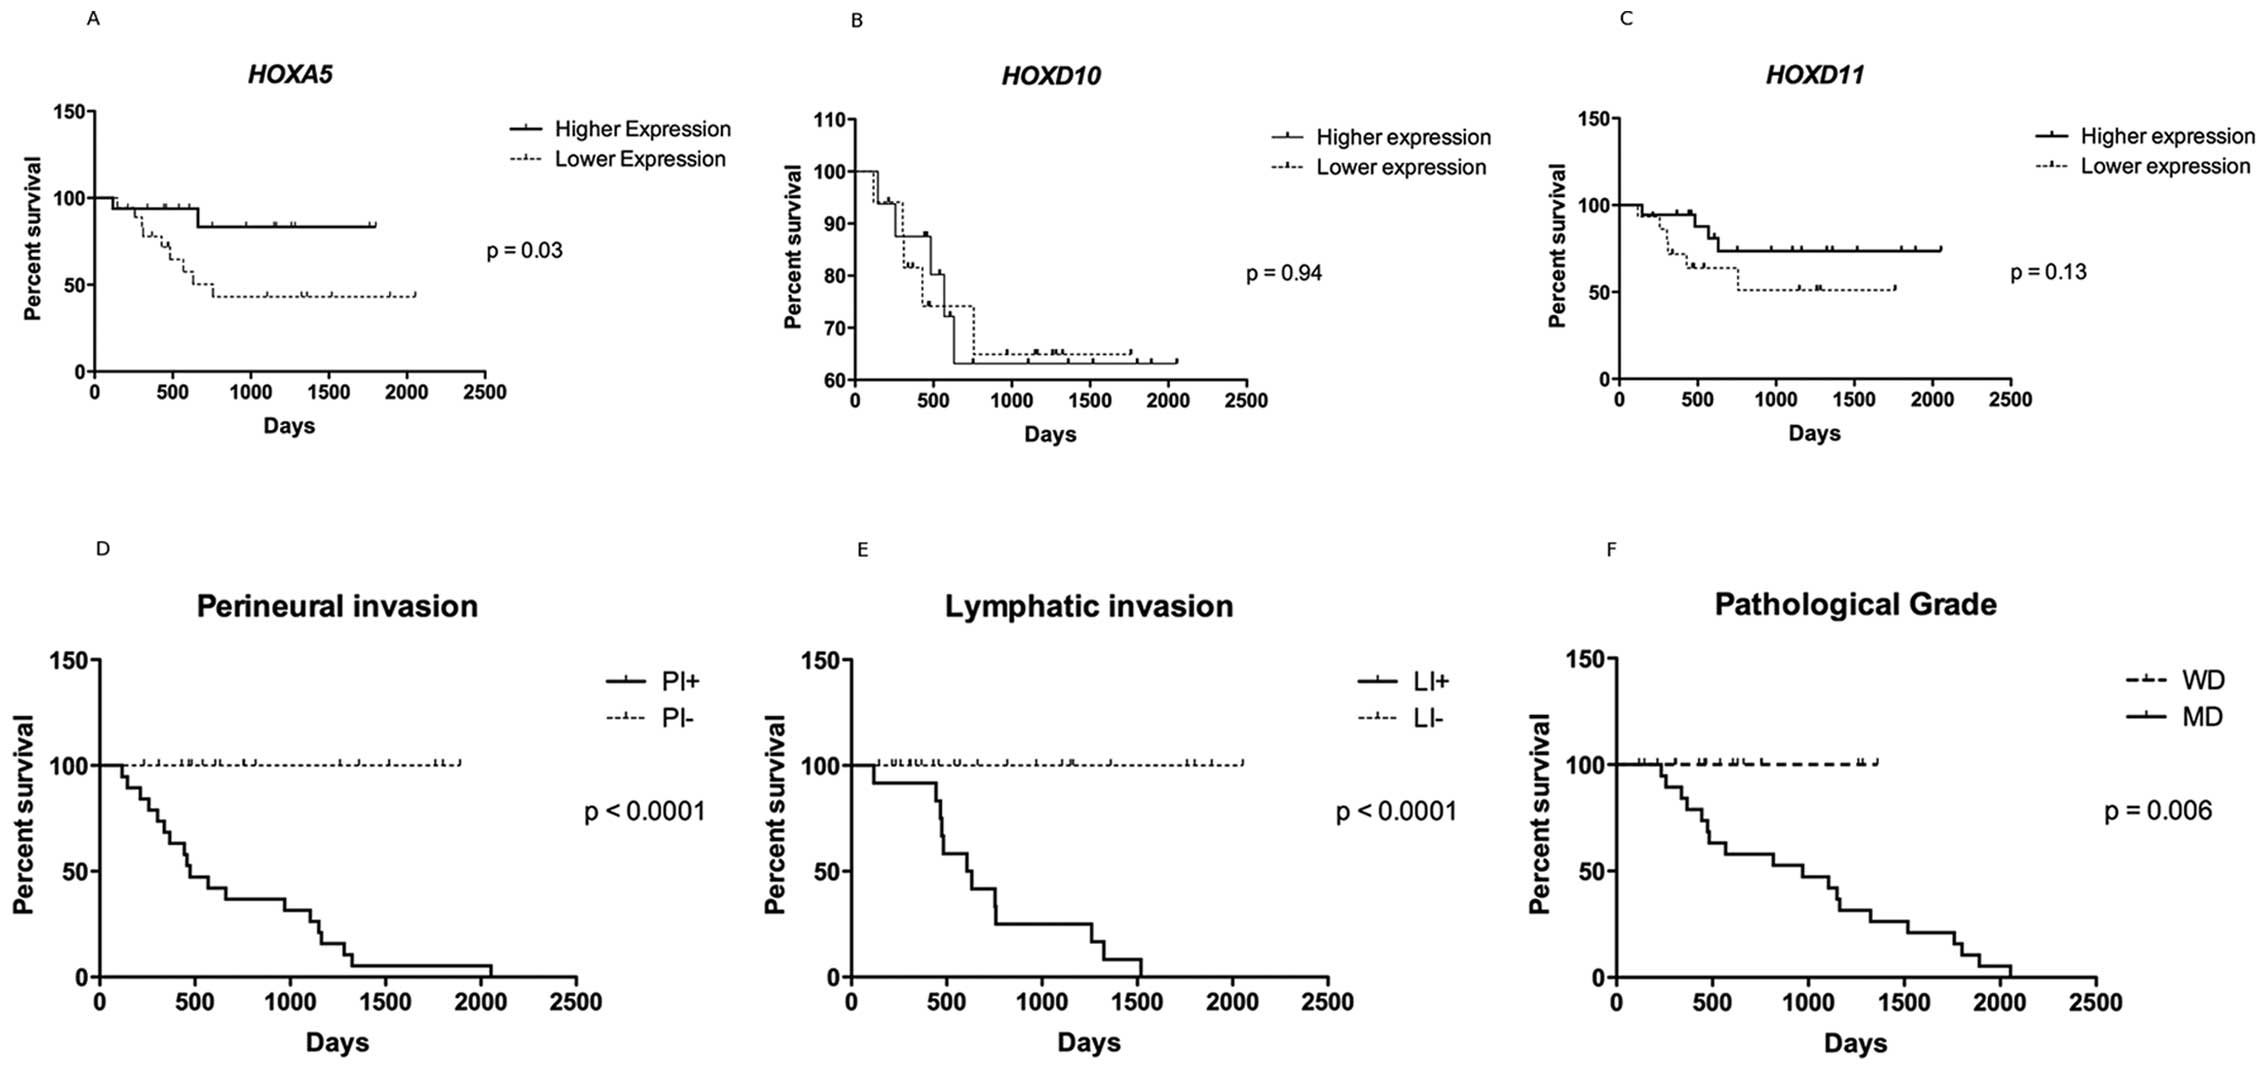
HOXA5 expression level is associated with
the survival rate
Although HOXA5, HOXD10 and
HOXD11 genes were all up-regulated, a cut-off value for the
expression level was set up at the median expression level,
defining samples with higher and lower expression levels. The
P-value for the survival curve, determined by the log-rank test,
showed statistically significant difference in the survival rates
only between higher and lower expressions of HOXA5 (P=0.03).
Patients with higher expression of HOXA5 (the 5-year
survival rate of 16 patients was 83.3%) had much more favorable
prognosis than those with lower expression (the 5-year survival
rate of 18 patients was 43%). HOXD10 and HOXD11
expression was not related to overall survival (Fig. 4A–C).
A higher overall survival rate was observed in cases
presenting no lymphatic as well as perineural infiltration
(P<0.0001) and those microscopically classified as well
differentiated (P=0.006) tumors (Fig.
4D–F).
Discussion
Since many homeobox genes normally expressed by
embryonic tissues are aberrantly activated or re-expressed in
tumors, some speculate that these genes may act as oncogenes in
solid tumors. However, homeobox genes may also be down-regulated in
malignant cells of tissues in which a particular gene is normally
expressed in a complete differentiated state, what is consistent
with a tumor suppressor gene.
In the present study, the difference in homeobox
gene expression levels were investigated in OSCC tissue samples in
relation to their non-tumoral counterparts as well as in OSCC and
NOK cell lines. Regarding control tissue samples, field
cancerization (34) is a widely
accepted theory meaning that the margin mucosa may present some
tumor-related molecular changes despite its normal morphological
appearance. However, non-tumoral margins were undertaken as control
samples in the present study in order to avoid questioning if that
the observed differences in gene expression could be related to
possible individual variability. Inter-individual differences in
phenotype, whether associated with disease or not, are generally
assumed to reflect inter-individual differences in the expression
of genes. According to Turan et al (35) one of the most surprising
observations to emerge from human transcriptome profiling is the
very high level of inter-individual variability found in steady
state mRNA levels of many genes. Moreover, the ideal control tissue
in a study should be obtained from the same patient and from the
same tumor site (in our case tongue and floor of the mouth).
In view of the above, consistent differences in
expression levels of HOXD11, HOXD10, HOXA5,
IRX4, HOXC9 and HOXA6 were observed in OSCC
samples in relation to the non-tumoral counterparts after
microarray analysis. HOXA5, HOXD10 and HOXD11
showed the highest expression levels and their up-regulation was
then validated by qRT-PCR in tumor samples as well as in cell
lines. Levels of HOXA5 below the cut-off value (lower
expression) were also associated with poor prognosis of OSCC.
Others also identified transcripts studied herein as
differentially expressed in primary tumors from sites other than
oral cavity. Evidence of altered expression of HOXD10 is
strong in breast and endometrial cancer, in which HOXD10
expression is progressively reduced in epithelial cells as
malignancy increases. Also, after restoring HOXD10
expression in malignant breast tumor cells, cell migration was
significantly impaired and their ability to form tumors in mouse
xenografts was inhibited (10).
Reddy et al (36) observed
that loss of HOXD10 expression is related to micro-RNA miR-7
and contributes to increased invasiveness in breast cancer. While
these findings suggest that HOXD10 has tumor-suppressive
functions for mammary epithelial cells, a different scenario is
observed for esophageal (37) and
oral cancer.
In the present study, although the expression levels
of HOXD10 did not influence the overall survival rate, it
was significantly up-regulated in OSCC samples (median value
>8-fold) in relation to non-tumoral tissues as well as in OSCC
cell lines. This is in agreement with Hassan et al (17) who revealed significantly higher
expression levels of HOXD10 in OSCC compared to those in
normal oral mucosa, as well as higher expression levels in
dysplasia tissues compared to normal oral mucosa tissues,
suggesting that HOXD10 expression sequentially alters from
normal mucosa, to dysplasia and OSCC.
A similar heterogeneous pattern is observed
regarding HOXD11 expression. This gene seems to be silenced
in breast cancer (38), ovarian
cancer (39) and melanoma
(9), suggesting that a specific
methylation pattern of a group of genes, involving HOXD11,
may be useful as diagnostic and prognostic biomarkers. On the other
hand, HOXD11 is transcribed in gastric carcinoma in an
abnormal manner suggesting an important role in the development of
this disease (40). The same
occurs in OSCC, as observed in the present study and others
(17). Here, a significantly
higher expression level of HOXD11 was detected by qRT-PCR in
OSCC tissue samples (median value of 5-fold) and OSCC cell lines,
although with no correlation to survival rates.
HOXA5 also presents the same variable pattern
of expression. In primary breast carcinoma, HOXA5 has also
been implicated as a tumor suppressor gene since its expression is
lost in >60% breast cancer cell lines and primary tumors
(41,42). In agreement, HOXA5 is also
down-regulated in the vast majority of non-small cell lung cancer,
which is associated with a borderline significantly worse survival
in patients with stage I disease (43). Nevertheless, Yang et al
(44) observed that homeobox genes
from cluster A (HOXA4, HOXA5, HOXA7,
HOXA9 and HOXA13) were highly expressed in gastric
cancer cell lines and suggested that the mechanism of gastric
carcinogenesis possibly involves specific chromosomal rearrangement
and up-regulation of HOX genes. Similar findings were
observed here, showing the validation by qRT-PCR of HOXA5
higher expression in OSCC tissues (median value >3-fold) and
cell lines.
There are few studies that investigated the
differential expression profile of homeobox genes in OSCC (17,25–27)
and their correlation with tumor behavior, clinical parameters and
survival rates (25,26). De Souza Setúbal Destro et al
(25) showed the overexpression of
HOXB7 in tumor samples and its association with tumor size,
lymph node state and clinical stage of disease, reflecting a lower
overall and disease-free survival rates. Yamatoji et al
(26) also associated
HOXA10 overexpression with tumor differentiation grade,
aggressiveness and prognosis, describing HOXA10
up-regulation as a putative prognostic marker of lower overall and
disease-free survival rates.
As expected, a higher overall survival rate was
observed in the present study for cases presenting no lymphatic as
well as perineural infiltration and those microscopically
classified as well differentiated tumors. Considering that
HOXA5, D10 and D11 were significantly
over-expressed in OSCC samples, we could expect to correlate these
gene expression levels with some of those clinicopathological
features of the tumors. A possible explanation for the lack of
correlation may be due to the fact that, except from perineural
invasion, histopathological grade and lymphatic invasion are
considered limited independent prognostic factors (45). Although WHO (46) recommends the use of the categories
well-, moderately- and poorly-differentiated this grading system
usually depends on a subjective assessment, being considered by
most authorities as a poor indicator of outcome and response to
treatment (47–50). Also, the prognostic value of
lymphovascular invasion is questionable since it is difficult to
define and recognize with certainty in routinely stained tissues
(50).
The results presented here and by others (17) support the hypothesis that aberrant
expression of HOX genes is associated with the development
of OSCC. Nevertheless, although the expression levels of
HOXD10 and HOXD11 did not influence overall survival
rates in the present study, a significant association was found for
HOXA5. Our results revealed that patients with higher
expression of HOXA5 had much more favorable prognosis than
those with lower expression.
It was demonstrated that reduction or loss of
HOXA5 expression correlates with reduced p53 levels in
breast tumors, suggesting that loss of HOXA5 expression is
an important step in tumorigenesis (41). In addition, there is coordinated
loss of both HOXA5 and retinoic acid receptor (RARb) expression
during neoplastic transformation and progression in a breast
epithelial cell model. Knockdown of HOXA5 expression
partially abrogates retinoid-induced apoptosis and promotes cell
survival upon retinoic acid treatment. These results strongly
suggest that HOXA5 acts directly downstream of RARb and may
contribute to retinoid-induced anticancer and chemopreventive
effects (51).
Target genes for the homeobox transcription factors
are either homeobox genes themselves or other genes that are
critical to controlling cell division, adhesion and migration,
morphological differentiation and apoptosis. Currently, there are
no well-established specific target genes for the studied homeobox
genes. From what is known so far, homeobox proteins interact with
numerous regulatory pathways, including FGF (fibroblastic growth
factor), BMP (bone morphogenetic protein), retinoic acid, sex
steroid signaling (52) and
proteins involved in cell-matrix interaction, such as integrins and
ICAM (intercellular adhesion molecule) (53). In gastric cancer, HOXD11 is
expected to exert a regulating role in αV integrin gene, even if
its expression pattern in tumors contrasts with the functions that
this protein seems to have in neoplastic cells, mainly promoting
cell migration and survival (40).
In conclusion, this study is the first to
investigate the expression profile of homeobox genes in OSCC based
on differentially expressed genes identified through a microarray
genome-wide screening. The present results confirmed the presence
of three significantly up-regulated (>4-fold) homeobox genes
(HOXA5, HOXD10 and HOXD11) in OSCC that may
play a significant role in the pathogenesis of these tumors and
that deserve further functional investigation to understand the
cellular processes involved. Moreover, it was shown that lower
levels of HOXA5 predict poor prognosis for patients with
OSCC after surgery, suggesting that this gene may be a novel
candidate for development of OSCC therapeutic strategies.
Aknowledgements
The study was supported by Fundação de Amparo à
Pesquisa do Estado de São Paulo/FAPESP (Grants 04/12054-9,
04/14029-1 and 06/04738-8) and Coordenação de Aperfeiçoamento de
Pessoal de Nível Superior (CAPES). We are also grateful for the
research fellowships from Instituto Israelita de Ensino e Pesquisa
Albert Einstein and The Ludwig Institute for Cancer Research. We
thank Professor Ricardo Della Coletta (School of Dentistry, State
University of Campinas) and Dr Maria de Fátima Klingbeil (School of
Dentistry, University of São Paulo), who kindly provided OSCC and
NOK cell lines, respectively. We acknowledge the GENCAPO (Head and
Neck Genome Project) Consortium in the name of its members (listed
in the Appendix) for sample
collection and initial processing, clinical data collection,
providing of histopathological analysis of tissue samples and
informed consent acquisition of each patient, as well as comments
on the draft.
Appendices
Appendix
The GENCAPO (Head and Neck Genome) Project members
are the following: Cury PM3, De Carvalho MB7,
Dias-Neto E1, Figueiredo DLA8, Fukuyama
EE5, Góis-Filho JF5, Leopoldino
AM12, Mamede RCM8, Michaluart-Junior
P1, Moreira-Filho CA1, Moyses RA1,
Nóbrega FG4, Nóbrega MP4, Nunes
FD6, Ojopi EPB1, Okamoto OK11,
Serafini LN8, Severino P2, Silva
AMA7, Silva WA Jr8, Silveira
NJF10, Souza SCOM6, Tajara EH3,
Wünsch-Filho V9, Zago MA8, Amar
A7, Arap SS1, Araújo NSS1,
Araújo-Filho V1, Barbieri RB7, Bandeira
CM4, Bastos AU7, Bogossian AP4,
Braconi MA4, Brandão LG1, Brandão
RM8, Canto AL4, Carvalho-Neto PB7,
Casemiro AF7, Cerione M5, Cernea
CR1, Cicco R5, Chagas MJ4, Chedid
H7, Chiappini PBO7, Correia LA7,
Costa A9, Costa ACW7, Cunha BR3,
Curioni OA7, Dias THG1, Durazzo
M1, Ferraz AR1, Figueiredo RO9,
Fortes CS9, Franzi SA7, Frizzera
APZ3, Gallo J1, Gazito D7,
Guimarães PEM1, Gutierres AP7, Inamine
R9, Kaneto CM8, Lehn CN7, López
RVM9, Macarenco R4, Magalhães RP1,
Martins AE7, Meneses C4, Mercante
AMC7, Montenegro FLM1, Pinheiro
DG8, Polachini GM3, Porsani AF7,
Rapoport A7, Rodini CO6, Rodrigues
AN9, Rodrigues-Lisoni FC3, Rodrigues
RV3, Rossi L7, Santos ARD8, Santos
M7, Settani F5, Silva FAM12, Silva
IT8, Silva-Filho GB1, Smith RB1,
Souza TB7, Stabenow E1, Takamori
JT7, Tavares MR1, Turcano R1,
Valentim PJ5, Volpi EM1, Xavier
FCA6, Yamagushi F5, Cominato ML5,
Correa PMS4, Mendes GS5, Paiva R5,
Ramos O1, Silva C1, Silva MJ5 and
Tarlá MVC8.
Affiliations: 1School of Medicine, USP,
São Paulo; 2The Albert Einstein Jewish Teaching and
Research Institute (IIEP), São Paulo; 3School of
Medicine of São José do Rio Preto; 4São José dos Campos
Dental School, UNESP; 5Cancer Institute Arnaldo Vieira
de Carvalho, São Paulo; 6School of Dentistry, USP, São
Paulo; 7Heliópolis Hospital, São Paulo;
8School of Medicine of Ribeirão Preto, USP;
9School of Public Health, USP, São Paulo;
10University of Vale do Paraíba, São José dos Campos;
11School of Medicine, UNIFESP, São Paulo;
12Faculty of Pharmaceutical Sciences of Ribeirão Preto,
USP, SP, Brazil.
References
|
1
|
Choi S and Myers JN: Molecular
pathogenesis of oral squamous cell carcinoma: implications for
therapy. J Dent Res. 87:14–32. 2008. View Article : Google Scholar : PubMed/NCBI
|
|
2
|
Jemal A, Bray F, Center MM, et al: Global
cancer statistics. CA Cancer J Clin. 61:69–90. 2011. View Article : Google Scholar
|
|
3
|
Parkin DM, Bray F, Ferlay J, et al: Global
cancer statistics, 2002. CA Cancer J Clin. 55:74–108. 2005.
View Article : Google Scholar
|
|
4
|
Perez-Sayans M, Somoza-Martin JM,
Barros-Angueira F, et al: Genetic and molecular alterations
associated with oral squamous cell cancer (Review). Oncol Rep.
22:1277–1282. 2009. View Article : Google Scholar : PubMed/NCBI
|
|
5
|
Rubin E, Wu X, Zhu T, et al: A role for
the HOXB7 homeodomain protein in DNA repair. Cancer Res.
67:1527–1535. 2007. View Article : Google Scholar : PubMed/NCBI
|
|
6
|
Shah N and Sukumar S: The Hox genes and
their roles in oncogenesis. Nat Rev Cancer. 10:361–371. 2010.
View Article : Google Scholar : PubMed/NCBI
|
|
7
|
Nagai H, Kinoshita T, Suzuki H, et al:
Identification and mapping of novel tumor suppressor loci on 6p in
diffuse large B-cell non-Hodgkin's lymphoma. Genes Chromosomes
Cancer. 25:277–283. 1999. View Article : Google Scholar : PubMed/NCBI
|
|
8
|
Nagai H, Li Y, Hatano S, et al: Mutations
and aberrant DNA methylation of the PROX1 gene in hematologic
malignancies. Genes Chromosomes Cancer. 38:13–21. 2003. View Article : Google Scholar : PubMed/NCBI
|
|
9
|
Furuta J, Nobeyama Y, Umebayashi Y, et al:
Silencing of Peroxiredoxin 2 and aberrant methylation of 33 CpG
islands in putative promoter regions in human malignant melanomas.
Cancer Res. 66:6080–6086. 2006. View Article : Google Scholar : PubMed/NCBI
|
|
10
|
Carrio M, Arderiu G, Myers C, et al:
Homeobox D10 induces phenotypic reversion of breast tumor cells in
a three-dimensional culture model. Cancer Res. 65:7177–7185. 2005.
View Article : Google Scholar : PubMed/NCBI
|
|
11
|
Lewis MT: Homeobox genes in mammary gland
development and neoplasia. Breast Cancer Res. 2:158–169. 2000.
View Article : Google Scholar : PubMed/NCBI
|
|
12
|
Shimoda M, Takahashi M, Yoshimoto T, et
al: A homeobox protein, prox1, is involved in the differentiation,
proliferation, and prognosis in hepatocellular carcinoma. Clin
Cancer Res. 12:6005–6011. 2006. View Article : Google Scholar : PubMed/NCBI
|
|
13
|
Lechner JF, Fugaro JM, Wong Y, et al:
Perspective: cell differentiation theory may advance early
detection of and therapy for lung cancer. Radiat Res. 155:235–238.
2001. View Article : Google Scholar : PubMed/NCBI
|
|
14
|
Tiberio C, Barba P, Magli MC, et al: HOX
gene expression in human small-cell lung cancers xenografted into
nude mice. Int J Cancer. 58:608–615. 1994. View Article : Google Scholar : PubMed/NCBI
|
|
15
|
Takahashi Y, Hamada J, Murakawa K, et al:
Expression profiles of 39 HOX genes in normal human adult organs
and anaplastic thyroid cancer cell lines by quantitative real-time
RT-PCR system. Exp Cell Res. 293:144–153. 2004. View Article : Google Scholar : PubMed/NCBI
|
|
16
|
Takahashi O, Hamada J, Abe M, et al:
Dysregulated expression of HOX and ParaHOX genes in human
esophageal squamous cell carcinoma. Oncol Rep. 17:753–760.
2007.PubMed/NCBI
|
|
17
|
Hassan NM, Hamada J, Murai T, et al:
Aberrant expression of HOX genes in oral dysplasia and squamous
cell carcinoma tissues. Oncol Res. 16:217–224. 2006.PubMed/NCBI
|
|
18
|
Lopez R, Garrido E, Pina P, et al: HOXB
homeobox gene expression in cervical carcinoma. Int J Gynecol
Cancer. 16:329–335. 2006. View Article : Google Scholar : PubMed/NCBI
|
|
19
|
Zhu F, Li J, Li WX, et al: Overexpression
and clinicopathological significance of homeobox gene Quox-1 in
oral squamous cell carcinoma. J Biochem Mol Biol. 37:671–675. 2004.
View Article : Google Scholar : PubMed/NCBI
|
|
20
|
Wu JY, Yi C, Chung HR, et al: Potential
biomarkers in saliva for oral squamous cell carcinoma. Oral Oncol.
46:226–231. 2010. View Article : Google Scholar : PubMed/NCBI
|
|
21
|
Arora S, Matta A, Shukla NK, et al:
Identification of differentially expressed genes in oral squamous
cell carcinoma. Mol Carcinog. 42:97–108. 2005. View Article : Google Scholar : PubMed/NCBI
|
|
22
|
Kuo WP, Hasina R, Ohno-Machado L, et al:
Classification and identification of genes associated with oral
cancer based on gene expression profiles. A preliminary study. N Y
State Dent J. 69:23–26. 2003.PubMed/NCBI
|
|
23
|
Mendez LE, Manci N, Cantuaria G, et al:
Expression of glucose transporter-1 in cervical cancer and its
precursors. Gynecol Oncol. 86:138–143. 2002. View Article : Google Scholar : PubMed/NCBI
|
|
24
|
Ziober AF, Patel KR, Alawi F, et al:
Identification of a gene signature for rapid screening of oral
squamous cell carcinoma. Clin Cancer Res. 12:5960–5971. 2006.
View Article : Google Scholar : PubMed/NCBI
|
|
25
|
De Souza Setubal Destro MF, Bitu CC,
Zecchin KG, et al: Over-expression of HOXB7 homeobox gene in oral
cancer induces cellular proliferation and is associated with poor
prognosis. Int J Oncol. 36:141–149. 2010.PubMed/NCBI
|
|
26
|
Yamatoji M, Kasamatsu A, Yamano Y, et al:
State of homeobox A10 expression as a putative prognostic marker
for oral squamous cell carcinoma. Oncol Rep. 23:61–67.
2010.PubMed/NCBI
|
|
27
|
Zhou SX, Sun X and Lu ZH: The progress in
complex homeobox domains. Yi Chuan. 26:984–990. 2004.PubMed/NCBI
|
|
28
|
Greene FL and Sobin LH: A worldwide
approach to the TNM staging system: collaborative efforts of the
AJCC and UICC. J Surg Oncol. 99:269–272. 2009. View Article : Google Scholar : PubMed/NCBI
|
|
29
|
Klingbeil MF, Herson MR, Cristo EB, et al:
Comparison of two cellular harvesting methods for primary human
oral culture of keratinocytes. Cell Tissue Bank. 10:197–204. 2009.
View Article : Google Scholar : PubMed/NCBI
|
|
30
|
Severino P, Alvares AM, Michaluart P Jr,
et al: Global gene expression profiling of oral cavity cancers
suggests molecular heterogeneity within anatomic subsites. BMC Res
Notes. 1:1132008. View Article : Google Scholar : PubMed/NCBI
|
|
31
|
Bolstad BM, Irizarry RA, Astrand M, et al:
A comparison of normalization methods for high density
oligonucleotide array data based on variance and bias.
Bioinformatics. 19:185–193. 2003. View Article : Google Scholar : PubMed/NCBI
|
|
32
|
Saeed AI, Sharov V, White J, et al: TM4: a
free, open-source system for microarray data management and
analysis. Biotechniques. 34:374–378. 2003.PubMed/NCBI
|
|
33
|
Saeed AI, Bhagabati NK, Braisted JC, et
al: TM4 microarray software suite. Methods Enzymol. 411:134–193.
2006. View Article : Google Scholar : PubMed/NCBI
|
|
34
|
Slaughter DP, Southwick HW and Smejkal W:
Field cancerization in oral stratified squamous epithelium;
clinical implications of multicentric origin. Cancer. 6:963–968.
1953. View Article : Google Scholar : PubMed/NCBI
|
|
35
|
Turan N, Katari S, Coutifaris C, et al:
Explaining inter-individual variability in phenotype: is
epigenetics up to the challenge? Epigenetics. 5:16–19. 2010.
View Article : Google Scholar : PubMed/NCBI
|
|
36
|
Reddy SD, Ohshiro K, Rayala SK, et al:
MicroRNA-7, a homeobox D10 target, inhibits p21-activated kinase 1
and regulates its functions. Cancer Res. 68:8195–8200. 2008.
View Article : Google Scholar : PubMed/NCBI
|
|
37
|
Chen KN, Gu ZD, Ke Y, et al: Expression of
11 HOX genes is deregulated in esophageal squamous cell carcinoma.
Clin Cancer Res. 11:1044–1049. 2005.PubMed/NCBI
|
|
38
|
Miyamoto K, Fukutomi T, Akashi-Tanaka S,
et al: Identification of 20 genes aberrantly methylated in human
breast cancers. Int J Cancer. 116:407–414. 2005. View Article : Google Scholar : PubMed/NCBI
|
|
39
|
Cai LY, Abe M, Izumi S, et al:
Identification of PRTFDC1 silencing and aberrant promoter
methylation of GPR150, ITGA8 and HOXD11 in ovarian cancers. Life
Sci. 80:1458–1465. 2007. View Article : Google Scholar : PubMed/NCBI
|
|
40
|
Rossi DD, Castiglione F, Buccoliero AM, et
al: Quantitative expression of the homeobox and integrin genes in
human gastric carcinoma. Int J Mol Med. 20:621–629. 2007.PubMed/NCBI
|
|
41
|
Raman V, Martensen SA, Reisman D, et al:
Compromised HOXA5 function can limit p53 expression in human breast
tumours. Nature. 405:974–978. 2000. View Article : Google Scholar : PubMed/NCBI
|
|
42
|
Raman V, Tamori A, Vali M, et al: HOXA5
regulates expression of the progesterone receptor. J Biol Chem.
275:26551–26555. 2000. View Article : Google Scholar : PubMed/NCBI
|
|
43
|
Kim DS, Kim MJ, Lee JY, et al: Epigenetic
inactivation of Homeobox A5 gene in nonsmall cell lung cancer and
its relationship with clinicopathological features. Mol Carcinog.
48:1109–1115. 2009. View Article : Google Scholar : PubMed/NCBI
|
|
44
|
Yang YC, Wang SW, Wu IC, et al: A
tumorigenic homeobox (HOX) gene expressing human gastric cell line
derived from putative gastric stem cell. Eur J Gastroenterol
Hepatol. 21:1016–1023. 2009. View Article : Google Scholar : PubMed/NCBI
|
|
45
|
Bello IO, Soini Y and Salo T: Prognostic
evaluation of oral tongue cancer: means, markers and perspectives
(II). Oral Oncol. 46:636–643. 2010. View Article : Google Scholar
|
|
46
|
World Health Organization. Pathology and
Genetics of Head and Neck Tumours. 2005
|
|
47
|
Al-Rajhi N, Khafaga Y, El-Husseiny J, et
al: Early stage carcinoma of oral tongue: prognostic factors for
local control and survival. Oral Oncol. 36:508–514. 2000.
View Article : Google Scholar : PubMed/NCBI
|
|
48
|
Charoenrat P, Pillai G, Patel S, et al:
Tumour thickness predicts cervical nodal metastases and survival in
early oral tongue cancer. Oral Oncol. 39:386–390. 2003. View Article : Google Scholar : PubMed/NCBI
|
|
49
|
Okamoto M, Nishimine M, Kishi M, et al:
Prediction of delayed neck metastasis in patients with stage I/II
squamous cell carcinoma of the tongue. J Oral Pathol Med.
31:227–233. 2002. View Article : Google Scholar : PubMed/NCBI
|
|
50
|
Woolgar JA: Histopathological
prognosticators in oral and oropharyngeal squamous cell carcinoma.
Oral Oncol. 42:229–239. 2006. View Article : Google Scholar : PubMed/NCBI
|
|
51
|
Chen H, Zhang H, Lee J, et al: HOXA5 acts
directly downstream of retinoic acid receptor beta and contributes
to retinoic acid-induced apoptosis and growth inhibition. Cancer
Res. 67:8007–8013. 2007.PubMed/NCBI
|
|
52
|
Svingen T and Tonissen KF: Hox
transcription factors and their elusive mammalian gene targets.
Heredity. 97:88–96. 2006. View Article : Google Scholar : PubMed/NCBI
|
|
53
|
Cillo C, Cantile M, Mortarini R, et al:
Differential patterns of HOX gene expression are associated with
specific integrin and ICAM profiles in clonal populations isolated
from a single human melanoma metastasis. Int J Cancer. 66:692–697.
1996.PubMed/NCBI
|