Introduction
Breast cancer is the neoplasia with the highest
incidence and mortality affecting women worldwide with 1.38 million
of new cases diagnosed in 2008 (1). In the same period, 185,000 new cases
and 40,000 deaths were estimated only in the USA (2). Breast carcinomas represent a
heterogeneous group of tumors that are diverse in behavior,
outcome, and response to therapy. Despite advances in screening,
diagnosis, and therapies, causes of this disease still remain
unknown. Current routine clinical management of breast cancer
patients relies on clinical and pathological prognostic and
predictive factors to support treatment decisions (3). In order to assess prognosis and
therapy, oncologic patients are categorized into risk groups based
on a combination of prognostic variables (staging based in tumor
size, lymph node stage, and extent of tumor spread) and biological
prognostic and predictive variables. Biological variables include
tumor grade and molecular markers, such as estrogen and
progesterone receptors in combination with human epidermal growth
factor receptor 2 (HER2, c-erbB2/neu) status (4). Tumor grade is one of the
well-established prognostic factors in breast cancer, which
represents the morphological assessment of tumor biological
characteristics and has been shown to generate information related
to the clinical behavior, including aggressiveness, mitotic
activity, and overall survival (5). However, molecular markers associated
to tumor grade and other prognostic and biological variables are
scarce. Because of genetic heterogeneity of breast carcinomas, the
role of these classifiers in determining prognosis and evaluating
risk in an individual patient is more limited. Therefore,
innovative methods to identify novel informative biomarkers
according to the molecular features of tumors are required to
better assess prognosis and determine the most appropriate
treatment for each patient.
High throughput molecular technologies, such as
genome-wide expression profiling, have been increasingly used to
define the molecular classification of tumors and assess prognosis
and response to therapy in breast cancer (6,7).
These genomic studies based on DNA microarrays technology greatly
contributed to the understanding of breast cancer heterogeneity and
its clinical management, as they provide multigene classifiers
represented as molecular fingerprints that have the potential to
complement the traditional clinical prognostic and predictive
factors (8,9). However, protein-level information is
needed for the understanding of cancer proteins function and
translation of molecular knowledge into oncological clinical
practice. Thus proteomics technologies represent an attractive and
complementary approach in biomarkers discovery area. Oncoproteomics
has the potential to complement the information generated by
genomic profiling because mRNA levels do not always correlate with
protein abundance. Contributions of post-translational
modifications, such as phosphorylation, acetylation, and
glycosylation, are not detectable at mRNA level although they play
an important role in the stability, localization and interactions
of proteins (10). Moreover,
proteins represent more easily accessible therapeutic targets in
comparison to nucleic acids. The identification of cancer proteins
based in two-dimensional (2-D) electrophoresis, differential in gel
electrophoresis (DIGE) and SELDI-TOF strategies has important
achievements in the study of breast cancer. Increasing reports
using tumor tissues from patients have demonstrated the feasibility
of proteomics-based studies in the identification of novel
diagnostic markers and therapeutic targets. For instance, previous
studies reported the identification of proteins secreted by
estrogen-stimulated cell lines as cathepsin D (11), and the differential expression of
keratins between normal and malignant cells (12). Through 2-D techniques, it has been
shown that extracellular matrix protein inter-α-trypsin inhibitor
is negatively regulated in breast cancer (13). Proteomics has also been
successfully applied for the identification of proteins involved in
the mechanisms of tamoxifen resistance (14,15).
In order to contribute to the identification and implementation of
novel prognostic markers in breast cancer, we reported here the
identification of a set of differentially-expressed proteins in
normal and tumoral mammary tissues from Mexican women. We show that
glyoxalase 1 (GLO1), an enzyme involved in detoxification of
methylglyoxal, which is a cytotoxic product of glycolysis, is
frequently up-regulated in tumoral mammary tissues and cell lines.
In addition, tissue microarrays-based validation of GLO1 expression
evidenced for the first time a correlation with advanced tumoral
grade and consequently, with an increased proliferative activity of
tumors.
Materials and methods
Cell lines
Cancer cell lines were obtained from the American
Type Culture Collection (ATCC). Breast cancer cell lines MCF7,
MDA-MB-231, MDA-MB-453 and ZR-75, and lung cancer cell lines A549
and Calu1 were grown in Dulbecco’s modified Eagle’s medium DMEM-F12
(Gibco, Invitrogen). Cervical cancer cell lines HeLa and SiHa, and
colon cancer cell line SW480 were grown in MEM (Gibco, Invitrogen).
All culture media were supplemented with 10% fetal bovine serum
(FBS), 100 U/ml penicillin and 100 μg/ml streptomycin (Gibco,
Invitrogen). Cell lines culture were maintained at 37°C in a
humidified environment with 5% CO2 and 95% air. The
adherent cells in culture were harvested by trypsinization at 37°C
for 5–10 min with trypsin-EDTA solution (Sigma) and washed with PBS
buffer before proteins extraction.
Clinical tumor samples
Human primary tumor tissues and healthy breast
biopsies were kindly provided by the Institute of Breast
Diseases-FUCAM, Mexico. Tumor and healthy surrounding breast
tissues were obtained from the same breast cancer patient after
stringent selection following the regulations approved by the FUCAM
Ethics Committee, including patient informed consent and
anonymatization prior to release for research use. None of the
patients recruited in this study received any anti-neoplastic
therapy prior to surgery. After tumor resection, specimens were
embedded in Tissue-Tek and snap frozen in liquid nitrogen at −80°C
until analysis. Pathologist confirmed the existence of at least 80%
tumor cells in specimens. Tumors were classified according to
hormonal receptors and HER2 status. For proteomic studies, which
were carried out in triplicate to ensure results reproducibility,
we carefully selected seven tumors, controlling for histological
type (all ductal invasive), classification (all luminal A), and
nuclear grade (almost all grade 2). For tissue microarrays (TMA)
validation studies, a cohort of 98 breast cancer patients was
recruited in this study. Mammary specimens obtained from normal
adjacent tissues were conjointly analyzed in order to obtain a
master gel, and to minimize the misinterpretation of protein
profiles arising from random differences in gene expression of
different tumors.
Protein extraction and separation by
two-dimensional electrophoresis
Frozen breast tumors and healthy tissues were
disrupted using a TissueRuptor (Qiagen) handheld rotor stator
homogenizer. Protein samples were extracted from tissues using 500
μl TNTE buffer (50 mM Tris-HCl pH 7.4, 150 mM NaCl, 0.5% Triton
X-100, 5 mM EDTA) in the presence of 40 μl/ml Complete proteases
inhibitor cocktail (Roche) at 4°C. Samples were centrifuged at
14,000 rpm for 5 min at 4°C. Supernatant was retrieved and cleaned
using the ReadyPrep 2D Clean Up kit (Bio-Rad) according to the
manufacturer’s protocol. Then, proteins were re-dissolved in 100 μl
sample buffer (7 M urea, 2% CHAPS, 40 mM dithiotreitol (DTT), 0.5%
Triton X-100). Protein concentrations were determined using the
Bradford method. For the first-dimension, proteins (200 μg)
obtained from tumoral and non-tumoral mammary tissues were mixed
with 120 μl rehydration solution containing 7 M urea, 2% CHAPS, 40
mM dithiotreitol, 0.5% ampholines pH 3.0–10, and 0.002% blue
bromophenol and loaded onto 11 cm ReadyStrip IPG strips (linear pH
gradient 4.0–7.0, Bio-Rad). IPG strips were passively hydrated for
16 h at room temperature. Then, proteins were isoelectrically
focused using the Protean IEF Cell (Bio-Rad) in four steps: an
initial gradient from 1 to 150 V for 2 h, followed by a gradual
increase up to 8,000 V for 3 h, for a total of 35,000 Vh. Finally,
a hold step at 100 V was applied. Then, IPG strips were
equilibrated for reduction and alkylation in equilibration buffer
(6 M urea, 2% SDS, 0.375 M Tris-HCl pH 8.8, 20% glycerol) with 2%
DTT and 2.5% iodoacetamide in first and second washes,
respectively, for 10 min at room temperature. For second-dimension,
proteins were resolved by 12% SDS-PAGE. Gels were run in running
buffer (25 mM Tris-HCl, 192 mM glycine, 0.1% SDS) at 50 V for 20
min and 200 V until samples reach the bottom of gel. Protein gels
were overnight stained with Sypro-Ruby dye (Invitrogen) according
to manufacturer’s protocol; then, images from 2-D gels were
documented in a FLA-5100 Fuji Film scanner and adjusted using the
Multigauge software. PD-Quest Advanced software version 8.0
(Bio-Rad) was used for comparative analyses of images corresponding
to proteins obtained from tumor and non-tumor biopsies. For 2-D
spots selection, images of gels from normal and tumor tissues were
used to create a match-set. Spots were detected and automatically
matched to a master gel selected by the PDQuest software. The spot
detection, spot boundary tool and matching were manually edited.
The spots were checked and manually added to the master gel to
allow matching of unique spots present in the individual gels. Spot
quantities were normalized to remove variations non-related to
expression changes. The criterion of a differential expression of
any particular protein between the subset of tissues was set as at
least a 2-fold change in spot volume between matched sets in
triplicates. All these spots were selected for subsequent
analysis.
Tandem mass spectrometry
(LC/ESI-MS/MS)
Protein spots were excised from Sypro-Ruby stained
gels, washed with 50% (v/v) methanol, 5% (v/v) acetic acid for 2 h
and then, with deionized water 3 times, 10 min each. The destained
gels were soaked for 10 min in 100 mM ammonium bicarbonate, cut
into small pieces, completely dehydrated with 100% acetonitrile and
vacuum-dried. In gel digestion was performed by adding 30 μl of
modified porcine trypsin solution (Promega, Madison, WI, USA)
containing 20 ng/μl in 50 mM ammonium bicarbonate followed by
overnight incubation at room temperature. Peptides were extracted
with 50% (v/v) acetonitrile, 5% (v/v) formic acid twice for 30 min,
and each time with sonication. The volume of the extracts was
reduced by evaporation in a vacuum centrifuge and then adjusted to
20 μl with 1% (v/v) formic acid.
Mass spectrometric analysis was carried out on a
3200 Q TRAP hybrid tandem mass spectrometer (Applied Biosystems/MDS
Sciex, Concord, ON, Canada), equipped with a nano electrospray ion
source (NanoSpray II) and a MicroIonSpray II head. The instrument
was coupled on-line to a nanoAcquity Ultra Performance LC system
(Waters Corporations, Milford, MA). Mass calibration of the hybrid
triple quadrupole linear ion trap spectrometer was done with
polypropylene glycol standard solutions. The instrument was then
tuned and tested using [Glu1]-fibrinopeptide B (Sigma). Samples
were desalted by injection onto a Symmetry C18 UPLC
trapping column (5 μm, 180 μm × 20 mm, Waters Corporations) and
washed with 0.1% formic acid in 100% Milli Q water at a flow rate
of 15 μl/min. After 3 min, the trap column was switched in-line
with the analytical column. Peptides were separated on a BEH,
C18 UPLC column (1.7 μm, 75 μm x 100 mm, Waters
Corporations) equilibrated with 2% acetonitrile, 0.1% formic acid
using a linear gradient of 2–70% acetonitrile, 0.1% formic acid
over a 60-min period, at a flow rate of 0.25 μl/min. Spectra were
acquired in automated mode using information dependent acquisition
(IDA), which involves switching from MS to MS/MS mode on detection
of +2 to +4 charged species. The precursor ions were fragmented by
collisionally-activated dissociation (CAD) in the Q2 collision
cell. Collision voltages were automatically adjusted based upon the
ion charge state and mass using rolling collision energy. Other
instrument operation conditions were as described previously
(16).
Data interpretation and protein identification were
performed with the MS/MS spectra data sets using the MASCOT search
algorithm (version 1.6b9, Matrix Science, London, UK available at
http://www.matrixscience.com). Searches
were conducted using the Homo sapiens subset of the National
Center for Biotechnology Information non-redundant database
(NCBInr, http://www.ncbi.nih.gov). Trypsin was
used as the specific protease and one missed cleavage was allowed
with tolerances of 0.5 Da for the precursor and 0.3 Da for the
fragment ion masses. Carbamidomethyl-cysteine and methionine
oxidation were used as the fixed and variable modifications,
respectively. A protein ‘hit’ was accepted as a valid
identification when at least two MS/MS spectrum matched at the 95%
level of confidence (p<0.05). Ion score is
−10*Log(P), where P is the probability that the observed
match is a random event. The threshold ion score in the above
conditions was 41 for p<0.05.
Western blot assays
GLO1 expression in breast tumor and normal tissues,
and cancer cell lines from breast (MCF7, MDA-MB-231, MDA-MB-453,
ZR-75), lung (A549, Calu1), cervix (SiHa, HeLa), and colon (SW480)
was evaluated by western blot assays. Confluent cell cultures and
tissues samples were lysed using SDS-buffer containing a complete
mini-protease inhibitor cocktail tablet (Roche Molecular
Bio-chemicals). Total protein concentration was estimated using the
Bradford protein assay (Bio-Rad). Protein extracts (35 μg) were
separated by 15% SDS-PAGE and electrotransferred to a PVDF membrane
(Millipore). Membranes were probed with 0.5 μg/ml anti-GLO1
monoclonal antibody (AbCam ab85420) in 5% non-fat dry milk and
0.05% Tween-20 in PBS pH 7.4 overnight at 4°C. For detection,
membranes were incubated with peroxidase-conjugated anti-mouse
(Molecular Probes, Invitrogen) secondary antibodies (1:5,000) in 5%
non-fat dry milk and 0.05% Tween-20 in PBS pH 7.4 and
immunocomplexes were developed using the ECL chemiluminescence
system (Amersham Pharmacia Biotech). Finally, membranes were
subjected to strip and re-blot using antibodies raised against
β-actin as control.
Immunohistochemistry on tissue
microarrays
High throughput analysis of 98 breast tumors and 20
normal mammary tissues was performed using a home-made tissue
microarray (TMA, Tissue Microarrayer ATA100 Chemicon) and
immunohistochemistry. Briefly, sections of 0.3 mm thickness from
both tumoral and non-tumoral specimens were deparafinized in xylene
and rehydrated in graded ethanol and water. Antigen unmasking was
performed using 0.01 M sodium citrate pH 6.0 for 10 min. Endogenous
peroxidases were removed using 3% hydrogen peroxide for 30 min at
room temperature in humid chamber. Samples were blocked for 1 h at
room temperature with 1% albumin. Then, sections were incubated
overnight at 4°C with anti-GLO1 antibodies (1:50) followed by
incubation with universal secondary antibodies for 15 min and
detection using Trek avidin-HRP for 10 min and DAB
(3,3′-diaminobenzidine tetrahydrochloride)-substrate chromagen
solution for 15 sec (Detection System, StarTrek, HRP universal
kit). Nuclei were stained with Mayer’s hematoxylin before imaging,
and slides were mounted with Permont reactive. The staining level
of GLO1 protein was scored as negative (0), weak (1), moderate (2), and strong (3).
Statistical analysis
The mean of logarithmic ratios method was used for
normalization. It calculates the normalization factor of a gel by
calculating the mean of all log ratios of all matched spots (master
gel versus gel). Spots down- and up-regulated were analyzed with
quantity-test for 2.0-fold and with the t-test with intervals of
95%. For clinical correlation and GLO1 expression, a 2×2 and 3×3
χ2 test was utilized to assess significance among
categorical variables. Tumor grade variable was determined as
p<0.01.
Results
Proteomic identification of deregulated
proteins in sporadic ductal breast tumors
To identify differentially-expressed proteins in
sporadic breast cancer, we compared the proteomic profiles from
seven ductal invasive carcinomas and five non-tumor mammary
tissues. Clinical features of breast tumors including hormonal
receptor status, tumor size, histology, clinical stage, and tumoral
grade are summarized in Table I.
Protein extracts were analyzed using IPG strips with a pH 4.0–7.0
linear gradient, which resulted in a better separation of protein
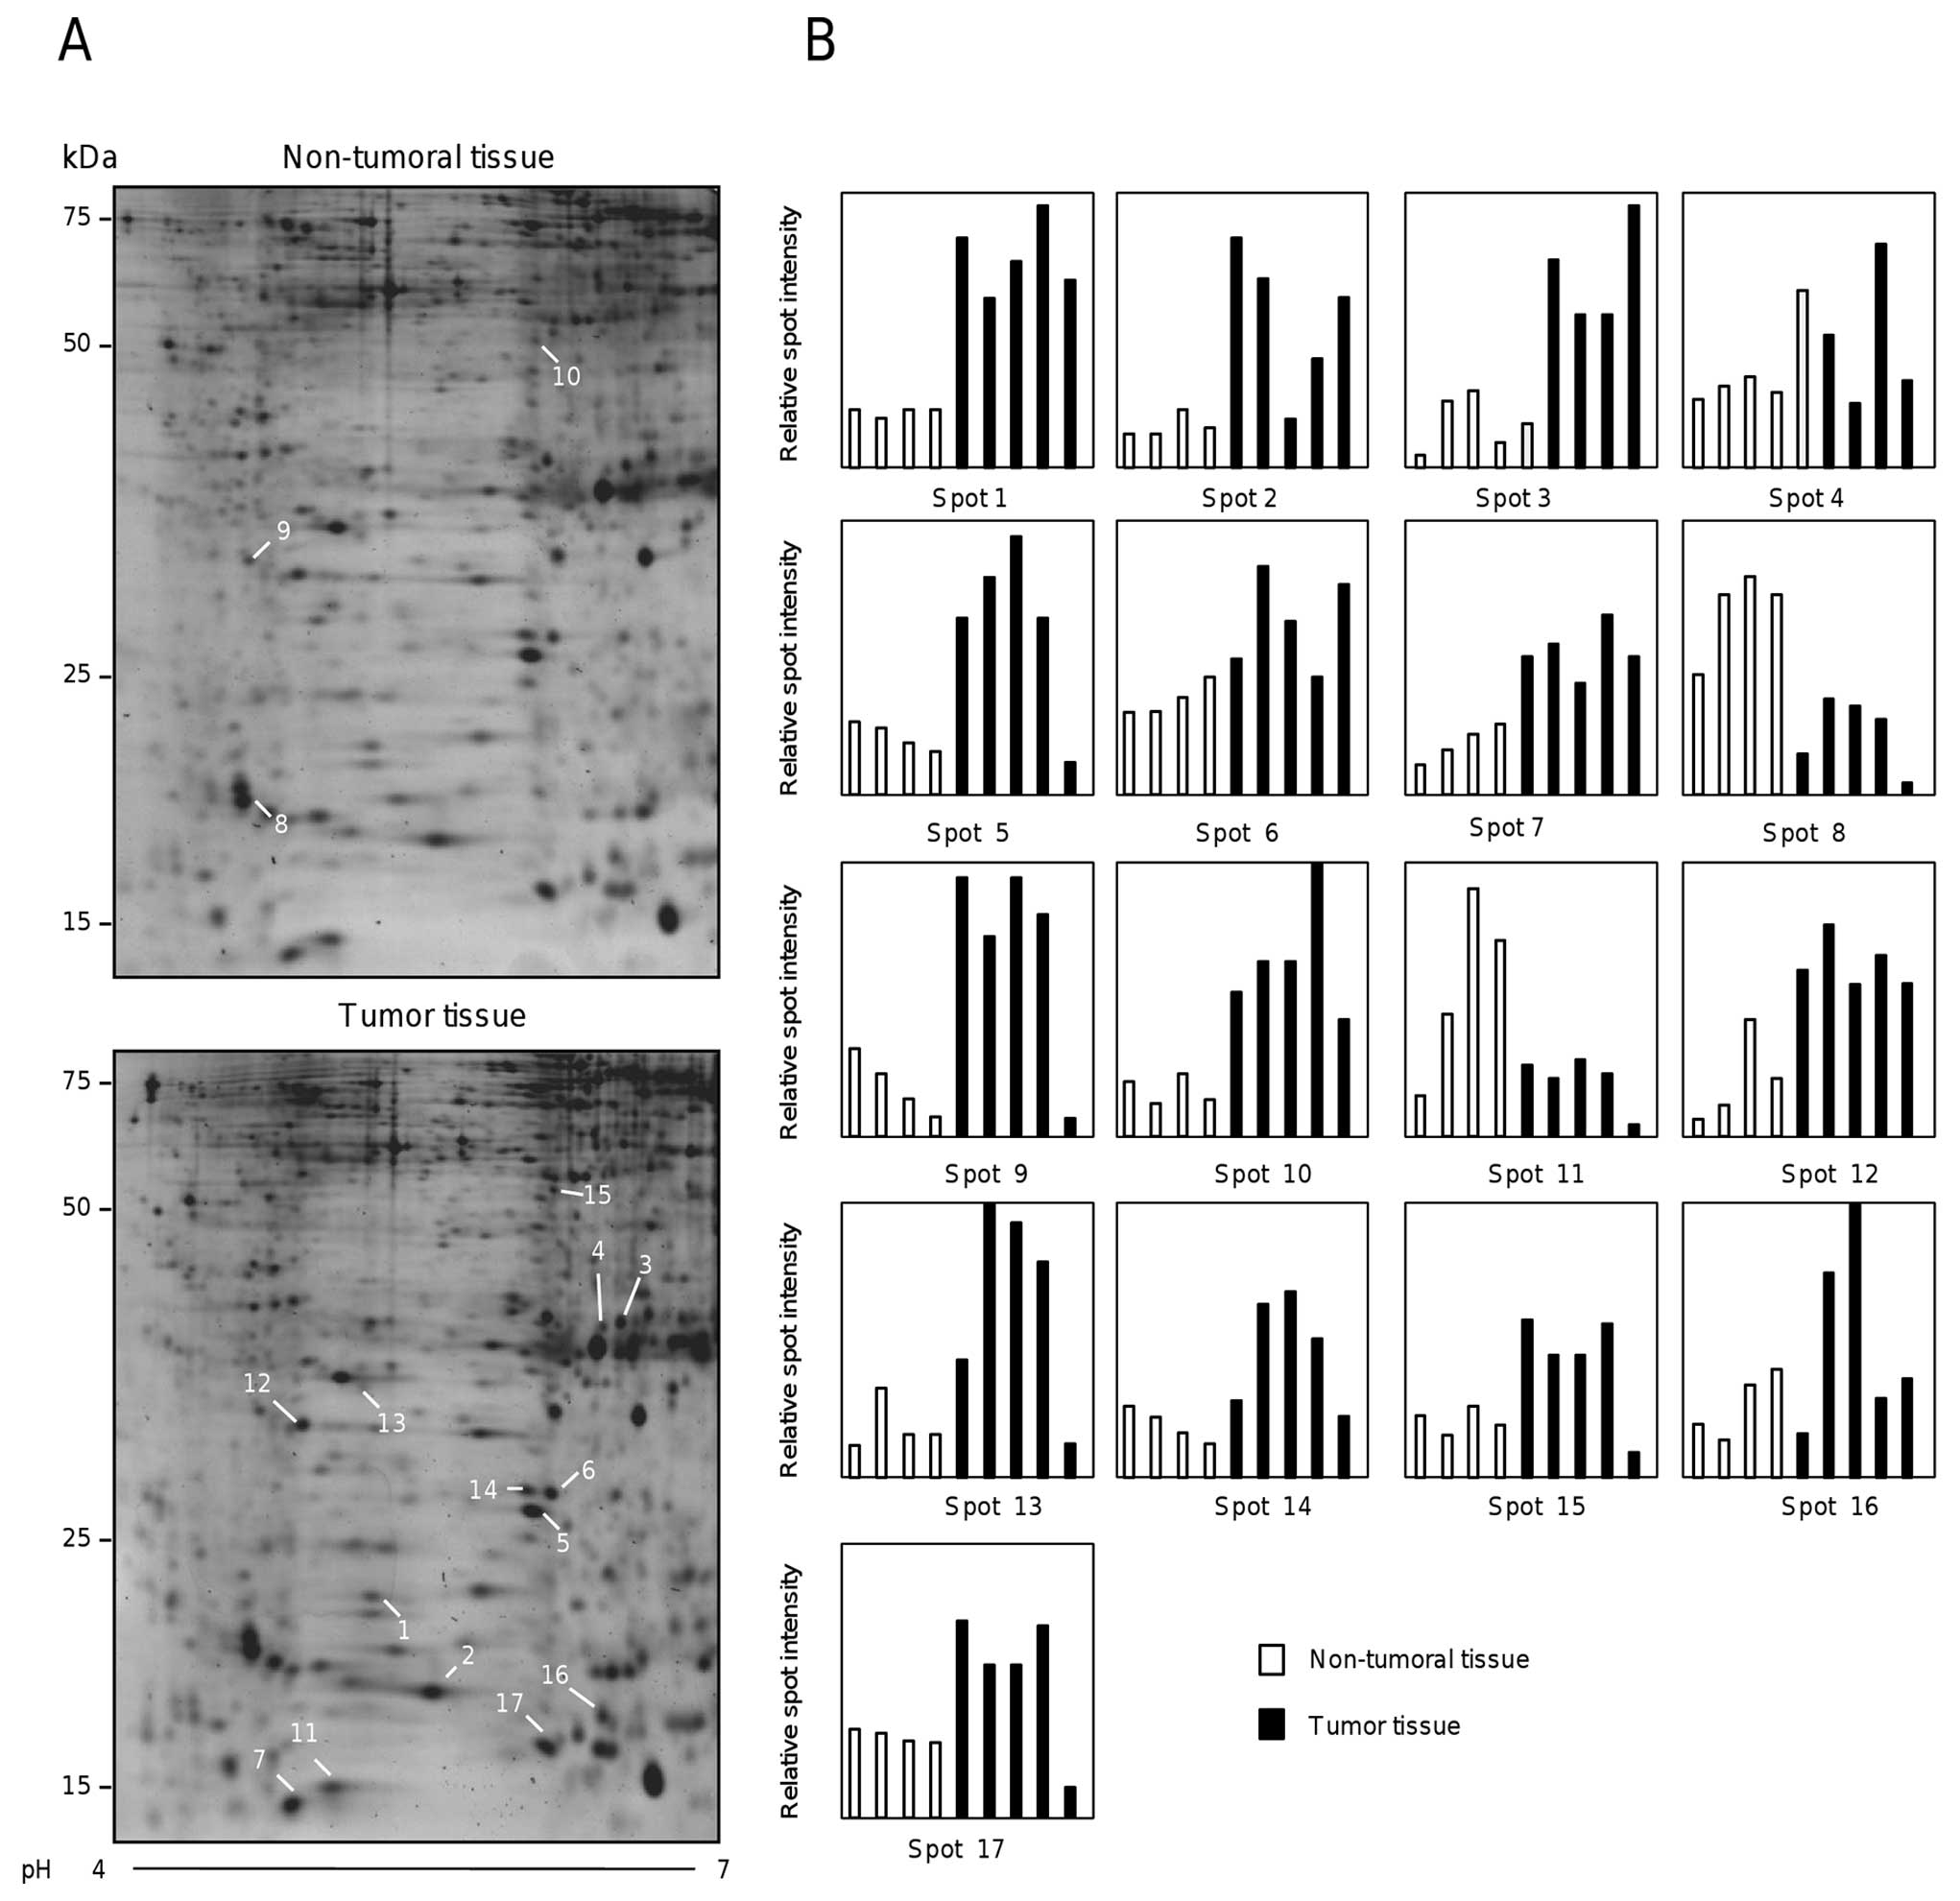
spots. Fig. 1A shows two
representative two-dimensional electrophoresis gels from non-tumor
(upper panel) and tumor (lower panel) tissues. The proteomic
profiles obtained for the total of specimens were highly
reproducible (data not shown). Densitometric analysis of 17
selected spots from healthy and tumor tissues evidenced the
differential protein expression between both proteomic profiles
(Fig. 1B).
 | Table IClinical features of breast tumors
analyzed by two-dimensional gels in this study. |
Table I
Clinical features of breast tumors
analyzed by two-dimensional gels in this study.
| Patient | Age | ER | PR | HER2 | Tumor size
(mm) | Histology | Classification | Clinical stage
(TNM) | Tumor grade |
|---|
| 115 | 45 | + | + | − | 10 | Ductal
invasive | Luminal A | IIA | 2 |
| 116 | 92 | + | − | − | 80 | Ductal
invasive | Luminal A | IIIB | 2 |
| 125 | 57 | + | − | − | 25 | Ductal
invasive | Luminal A | IIB | 2 |
| 129 | 53 | + | + | − | 13 | Ductal
invasive | Luminal A | IIA | Unknown |
| 133 | 61 | + | + | − | 17 | Ductal
invasive | Luminal A | IIIA | 2 |
| 151 | 64 | + | + | − | 25 | Ductal
invasive | Luminal A | IIA | 2 |
| 158 | 56 | + | + | − | 23 | Ductal
invasive | Luminal A | IIA | 2 |
The comparative analysis of images obtained from 2-D
gels using the PD-Quest software (Bio-Rad), allowed the detection
of 28 differentially-expressed proteins in the set of biopsies
(>2.0-fold change, p<0.05). Among these, 21 proteins were
up-regulated and 7 were down-regulated in tumors. After spots
picking, trypsin in-gel digestion, LC/ESI-MS/MS tandem mass
spectrometry analysis and NCBI database search, 17 modulated
proteins were identified.
The identity and function of proteins, Mascot
scores, sequence coverage, and MS/MS peptide sequences (ion score)
are summarized in Table II. These
included proteins with redox and detoxification functions (spot 1,
GLO1; spot 3, PRDX6; spot 14, SOD1; spot 12, DJ-1), a
stress-associated protein (spot 5, HSP27), a protein involved in
intermediary metabolism (spot 4, ECHS1), two molecular chaperones
(spot 2, TBCA; spot 15, HSP70), a exocytosis protein (spot 17,
ANXA1), a signaling transduction factor (spot 13, RhoGDI-2), a
neural survival factor (spot 11, DCD), a platelet aggregation
protein (spot 10, FGB), and a cell proliferation and metastasis
protein (spot 6, nm23), among others. Notably, all these proteins
have been previously related to breast cancer development,
progression, and invasion (17–28).
| Table IIModulated proteins in breast tumors
identified by MS/MS. |
Table II
Modulated proteins in breast tumors
identified by MS/MS.
| Up-regulated
proteins Protein (spot number) | Molecular
mass/pI | Gene symbola | Accession
numberb | Mascot score | No. of matched
peptides | Sequence coverage
(%) | MS/MS peptide
sequence (ion scores) | Function |
|
| Glyoxalase I
(1) | 20861/5.1 | GLO1 | Q04760 | 353 | 9 | 37 |
67FSLYFLAYEDKNDIPK82
(98)
123GFGHIGIAVPDVYSACK139 (56)
28DFLLQQTMLR37 (56) | Detoxificacion |
| Tubulin-specific
chaperone A (2) | 12904/5.2 | TBCA | NP_004598 | 235 | 22 | 53 |
42AEDGENYDIK51
(52)
70RLEAAYLDLQR80 (61)
81ILENEKDLEEAEEYKEAR98 (137) | Folding
cofactor |
| Peroxiredoxin-6
(3) | 25133/6.0 | PRDX6 | NP_004896 | 306 | 11 | 37 |
2PGGLLLGDVAPNFEANTTVGR22
(78)
145LSILYPATTGR155 (51)
156NFDEILR162 (40) | Redox regulation of
the cell |
| Enoyl-CoA hydratase
(4) | 31807/8.3 | ECHS1 | CAA66808 | 546 | 19 | 53 |
28ASGANFEYIIAEK40
(65)
186SLAMEMVLTGDR197 (74)
262LFYSTFATDDRK273 (56) | Celular
metabolism |
| Heat shock protein
27 (5) | 22427/7.8 | HSPB1 (HSP27) | AAA62175 | 162 | 5 | 30 |
28LFDQAFGLPR37
(47)
80QLSSGVSEIR89 (62)
172LATQSNEITIPVTFESR188 (70) | Involved in stress
resistance |
| Nm23-nucleoside
diphosphate kinase A (6) | 20740/7.0 | NME1 | CAA35621 | 203 | 7 | 33 |
35TFIAIKPDGVQR46
(58)
117VMLGETNPADSKPGTIR133 (50)
143NIIHGSDSVESAEK156 (56) | Involved in cell
proliferation, differentiation and development |
| SH3 domain-binding
glutamic acid-rich-like protein (7) | 12766/5.2 | SH3BGR | NP_003013 | 421 | 14 | 84 |
5VYIASSSGSTAIK17
(73)
20QQDVLGFLEANK31 (81)
87ENNAVYAFLGLTAPPGSK104 (84) | Thioredoxin fold
protein |
| Dermcidin
prepro-protein (11) | 11277/6.0 | DCD | NP_444513 | 69 | 2 | 12 |
83LGKDAVEDLESVGK96
(50) | Antimicrobial
protein: neural survival factor |
| DJ-1 (12) | 20001/6.3 | PARK7 | 1SOA_A | 375 | 50 | 67 |
33VTVAGLAGKDPVQCSR48
(82)
64EGPYDVVVLPGGNLGAQNLSESAAVK89 (90)
107AGPTALLAHEIGFGSK122 (128) | Oxidative stress
and cell death |
| Rho
GDP-dissociation inhibitor 2 (13) | 23031/5.1 | ARHGDIB | NP_001166 | 176 | 13 | 59 |
5APEPHVEEDDDDELDSK21
(45)
34ELQEMDKDDESLIK47 (74)
72LTLVCESAPGPITMDLTGDLEALKK96 (160) | Inhibition of the
dissociation of GDP from Rho proteins |
| Superoxide
dismutase (Cu-Zn) (14) | 16154/5.8 | SOD1 | NP_000445 | 315 | 16 | 48 |
11GDGPVQGIINFEQK24
(76)
81HVGDLGNVTADK92 (85)
93DGVADVSIEDSVISLSGDHCIIGR116 (49) | Convertion of
ROS |
| Hsp70 (15) | 42075/6.4 | HSPA1A | 3D2E_B | 342 | 11 | 21 |
26VEIIANDQGNR36
(70)
57NQVALNPQNTVFDAK71 (77)
172IINEPTAAAIAYGLDR187 (109) | Stabilize proteins
and mediate the folding |
| β globin
(hemoglobin subunit β) (16) | 15984/7.8 | HBB | AAA35597 | 170 | 8 | 49 |
10SAVTALWGK18
(42)
68VLGAFSDGLAHLDNLK83 (71)
134VVAGVANALAHK145 (86) | Involved in oxygen
transport |
| Annexin A1
(17) | 38918/6.5 | ANXA1 | NP_000691 | 279 | 8 | 23 |
59GVDEATIIDILTK71
(79)
82AAYLQETGKPLDETLKK98 (76)
114TPAQFDADELR124 (90) | Involved in
exocytosis |
|
| Down-regulated
proteins Protein (spot number) | Molecular
mass/pI | Gene symbola | Accession
numberb | Mascot score | No. of matched
peptides | Sequence
coverage | MS/MS peptide
sequence (ion scores) | Function |
|
| Smooth muscle
myosin alkali light chain (8) | 17601/4.5 | MYL6 | AAA20643 | 117 | 4 | 22 |
20EAFQLFDR27
(52)
44ALGQNPTNAEVLK56 (77)
86NKDQGTYEDYVEGLR100 (45) | Regulatory light
chain of myosin |
| Ig J-chain (9) | 15585/4.6 | IGJ | AAA58902 | 109 | 6 | 30 |
25SSEDPNEDIVER36
(97)
40IIVPLNNR47 (47)
109CYTAVVPLVYGGETK123 (60) | Serves to link two
monomer units of either IgM or IgA |
| Fibrin β (10) | 50731/7.9 | FGB | 0401173A | 128 | 6 | 18 |
120DNENVVNEYSSELEK134
(58)
204GGETSEMYLIQPDSSVKPYR223 (53)
257QGFGNVATNTDGK269 (96) | Monomers polymerize
into fibrin and acting as a cofactor in platelet aggregation |
GLO1 is overexpressed in breast tumors
and in diverse cancer cell lines
One of the most abundant up-regulated proteins
corresponded to glyoxalase 1 {GLO1 [lactoylglutathione lyase (EC
4.4.1.5)]}, which participates in detoxification of methylglyoxal,
a cytotoxic bioproduct of glycolysis, by catalyzing the conversion
of toxic α-oxo-aldehydes into the corresponding α-hydroxy acids
using L-glutathione (GSH) as cofactor (28). Although GLO1 expression has been
reported in several human cancer types, its clinical relevance in
breast cancer is poorly understood.
To analyze the expression of GLO1 in breast tumors,
we first analyzed the individual proteomic profiles obtained from
tumor and non-tumor breast tissues and observed a consistent
up-regulation of this protein (Fig. 2A
and B). GLO1 overexpression was further validated by western
blot assays in a panel of six paired tumor and non-tumor mammary
tissues grouped by clinical stages (I–III). Results showed that
GLO1 was up-regulated in 50% of tumor specimens with a higher
expression in clinical stage III (Fig.
2C and D). In addition, we investigated the GLO1 expression in
four breast cancer cell lines (MCF7, MDA-MB-231, MDA-MB-453,
ZR-75), two lung cancer cell lines (A549, Calu1), two cervical
cancer cell lines (SiHa, HeLa), and a colon cancer cells (SW480) by
western blot analysis. Results showed that GLO1 expression was
variable in the different cell lines (Fig. 2E and F). In breast cancer MCF7 and
MDA-MB-231 cell lines, GLO1 was abundantly expressed in comparison
with MDA-MB-453 and ZR-75. In addition, HeLa cervix tumor cells
exhibited high levels of GLO1 expression. In contrast, lung cancer
A549 and Calu1, cervical cancer SiHa and colon cancer SW480 cells
exhibited low GLO1 expression levels. These data indicate that GLO1
overexpression is not confined for breast tumors and suggested that
GLO1 aberrant expression is frequent in some human cancers.
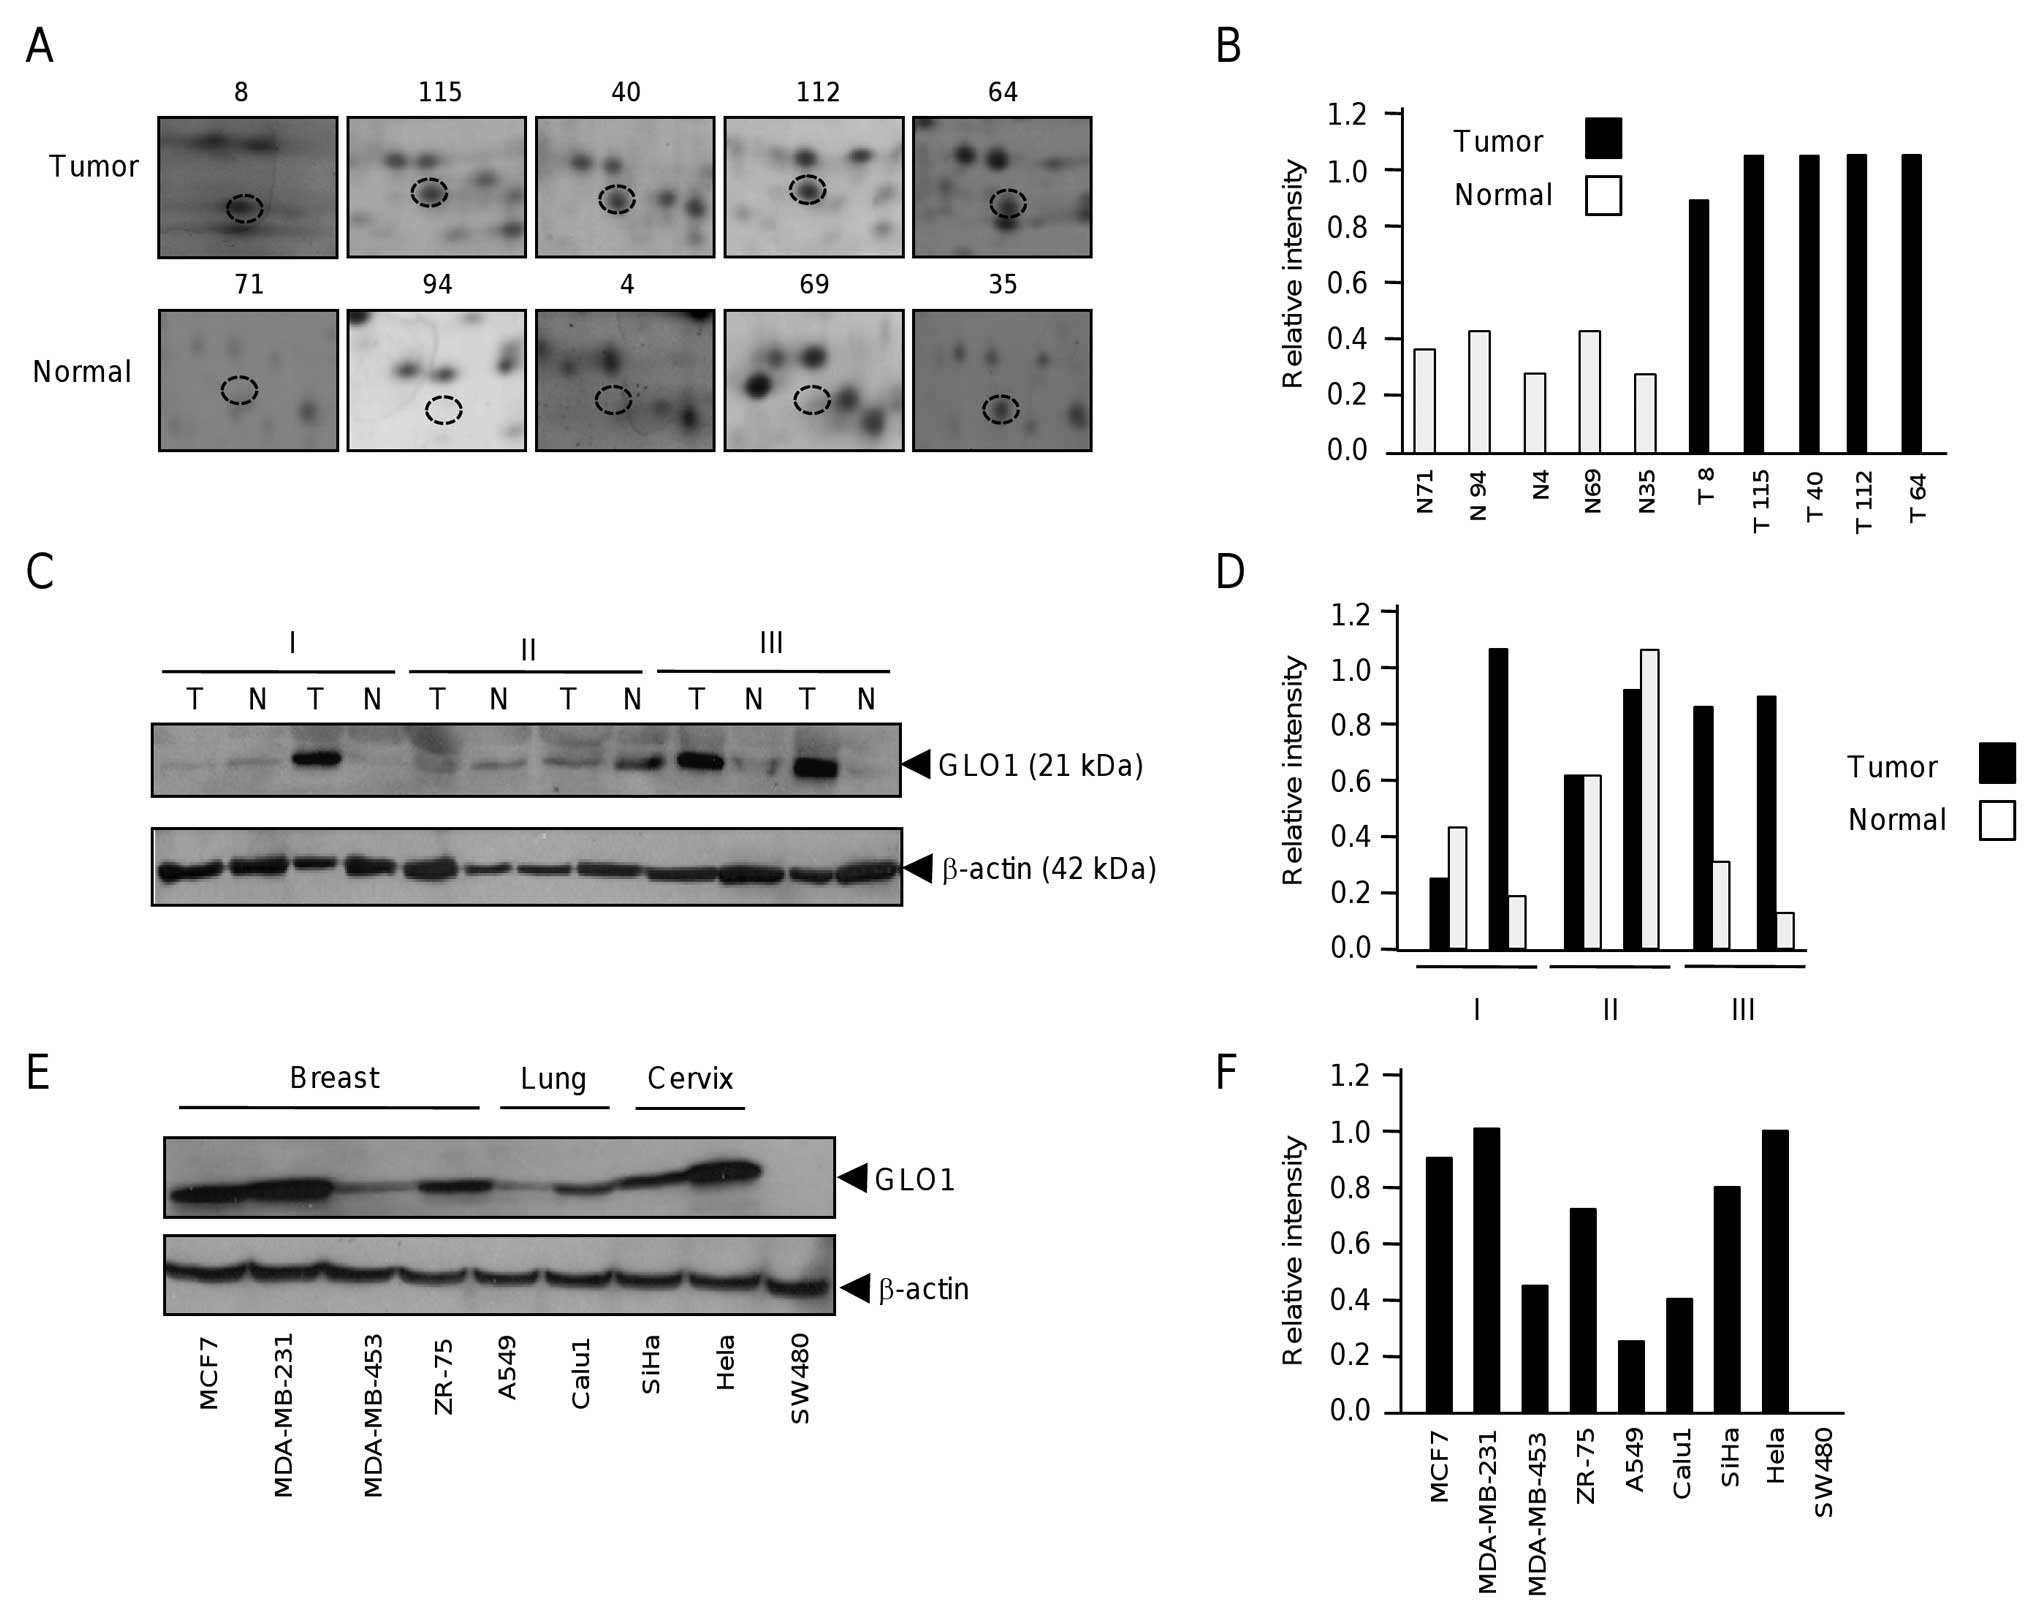 | Figure 2Expression of glyoxalase 1 in tumor
and healthy adjacent mammary tissues. (A), Cropped representative
2-D gel images of GLO1 spots (denoted as discontinuous circles) in
four healthy and seven tumor tissues. (B), Densitometric
quantification of GLO1 spots in each individual tissue sample
depicted in (A). Each bar graph represents the specimen number as
normal (N) and tumoral (T). (C), GLO1 expression in six matched
mammary biopsies. Protein lysates from (T) tumor and (N) normal
were analyzed by western blot assay using anti-GLO1 monoclonal
antibodies. β-actin was probed as an internal loading control.
Roman numbers indicates the clinical stage of each specimen. (D),
Densitometric quantification of GLO1 bands depicted in (C). (E),
Western blot assay for GLO1 expression in nine human cancer cell
lines. Protein lysates from breast (MCF7, MDA-MB-231, MDA-MB-453,
ZR-75), lung (A549, Calu1), cervix (SiHa, HeLa), and colon (SW480)
cancers were separated by 12% SDS-PAGE, transferred to nylon
membranes and blotted with anti-GLO1 monoclonal antibodies. β-actin
was probed as an internal loading control. (F), Densitometric
quantification of GLO1 bands depicted in (E). |
GLOI overexpression correlates with tumor
grade
In order to validate the 2-D results initially
obtained from a limited set of biopsies, we analyzed GLO1
expression in a panel of 98 breast tumors and 20 healthy specimens
by immunohistochemistry using TMA. Clinical characteristics of
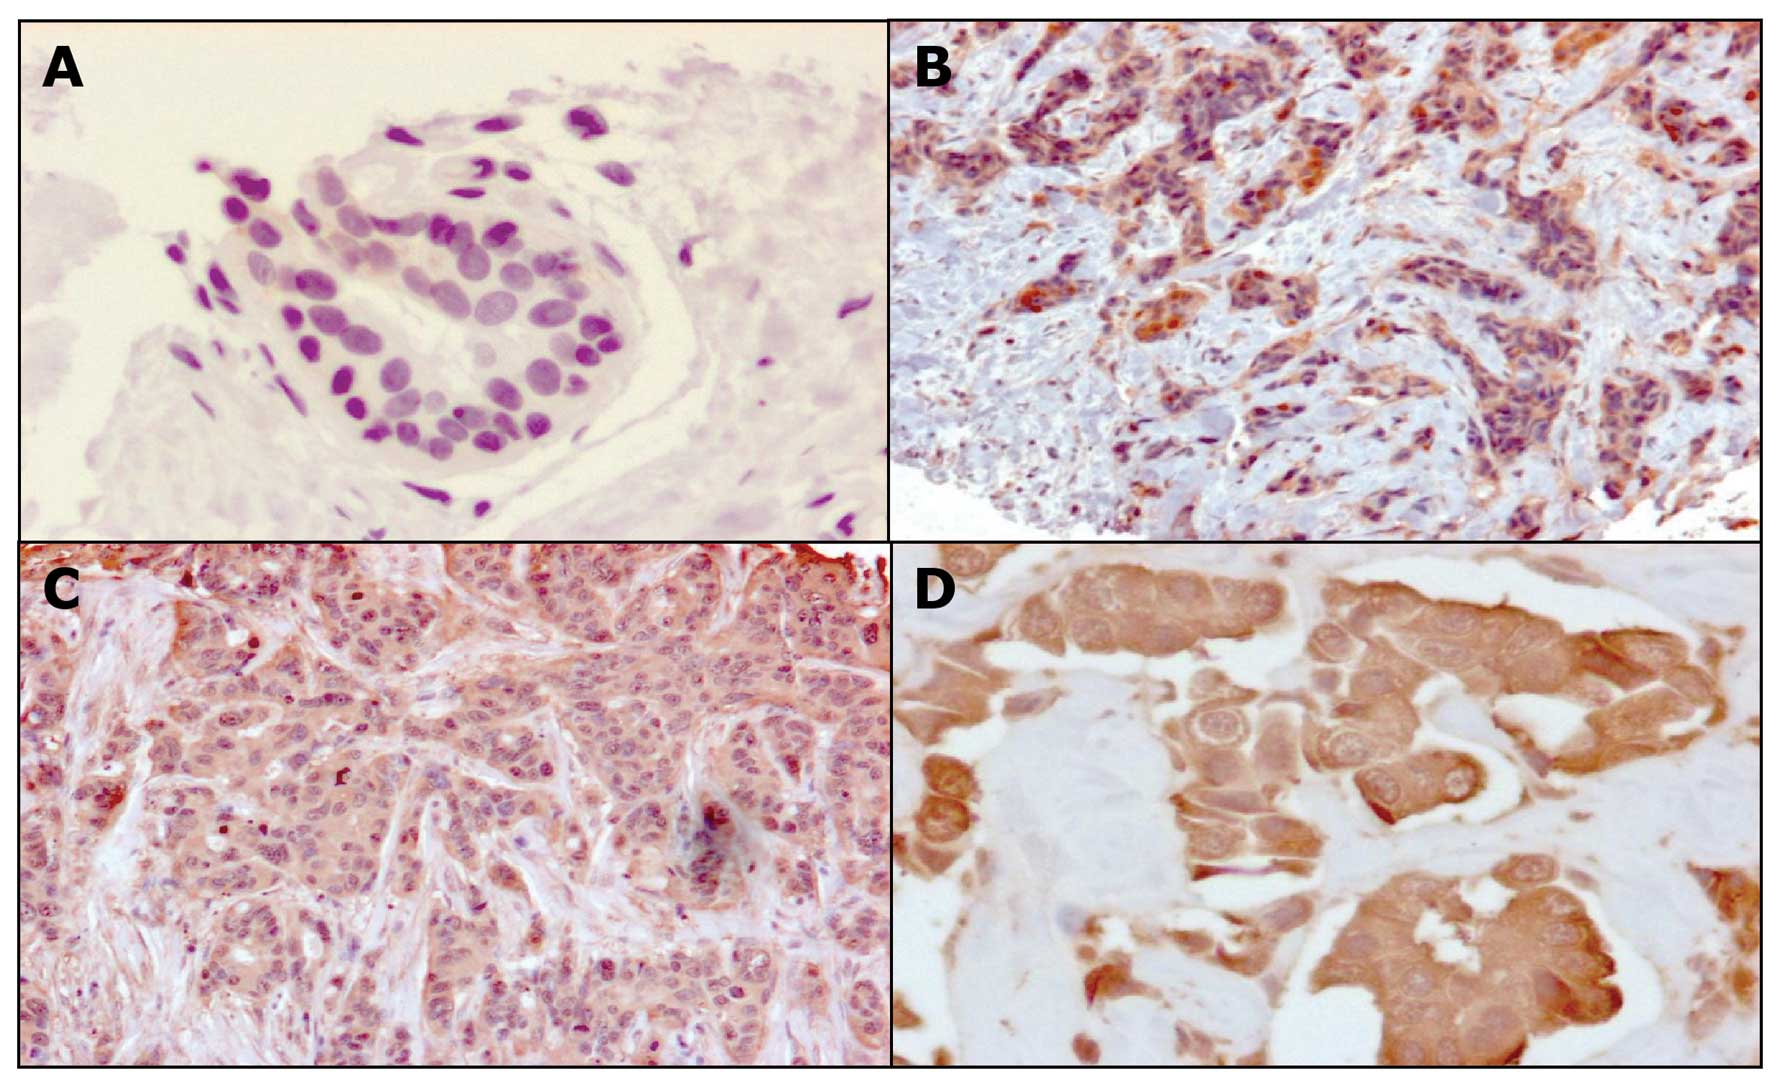
breast tumors analyzed are summarized in Table III. Results indicated that all the
healthy specimens showed a weak staining (0–1 score) for GLO1
protein, which representing the basal levels of GLO1 expression.
Interestingly, we observed that about 79% of the tumor tissues on
TMA sections showed from moderate to strong intensity staining by
anti-GLO1 monoclonal antibodies (Fig.
3 and Table IV). In previous
studies no correlation between GLO1 expression and
clinicopathological data was reported, thus here we established its
clinical relevance by searching for an association between GLO1
expression and clinical characteristics of patients, mainly tumor
size, nodal status, clinical stage, hormonal receptors, the
presence of lymph and tumor grade. Results evidenced that there was
a statistically significant correlation between GLO1 expression and
advanced tumor grade (Table V,
p<0.05).
| Table IIICharacteristics of breast tumors
analyzed in tissue microarrays. |
Table III
Characteristics of breast tumors
analyzed in tissue microarrays.
|
Characteristics | Total | (%) |
|---|
| No. of
patients | 98 | (100) |
| Age (years) |
| 30–39 | 6 | (6.12) |
| 40–59 | 48 | (48.97) |
| >60 | 27 | (27.55) |
| Unknown | 17 | (17.34) |
| Mean | 54.78 | |
| Primary
surgery | 98 | (100) |
| Histological
type |
| Ductal in
situ | 1 | (1.02) |
| Ductal
invasive | 58 | (59.18) |
| Lobular
invasive | 8 | (8.16) |
| Other | 15 | (15.30) |
| Unknown | 16 | (16.32) |
| Clinical stage |
| 0–I | 14 | (14.28) |
| II | 56 | (57.14) |
| III | 9 | (9.81) |
| Unknown | 19 | (19.38) |
| Tumor size
(cm) |
| <2 | 9 | (9.18) |
| ≥2 | 49 | (50) |
| ≥4 | 21 | (21.42) |
| Unknown | 19 | (19.38) |
| Nodal status |
| N0 | 60 | (61.22) |
| ≥N1 | 19 | (19.38) |
| Unknown | 19 | (19.38) |
| Metastasis |
| No detected | 98 | (100) |
| Hormonal
receptors |
| ER | 54 | (55.10) |
| PR | 46 | (46.93) |
| Her2 | 15 | (15.30) |
| Absent | 14 | (14.28) |
| SBR |
| 5 | 5 | (5.10) |
| 6 | 33 | (33.67) |
| 7–9 | 25 | (25.51) |
| Unknown | 35 | (35.71) |
| Nuclear grade |
| 1 | 6 | (6.12) |
| 2 | 56 | (57.14) |
| 3 | 16 | (16.32) |
| Unknown | 20 | (20.40) |
| Table IVInmunohistochemical analysis of GLO1
expression in breast tumor and non-tumor tissues using tissue
microarrays. |
Table IV
Inmunohistochemical analysis of GLO1
expression in breast tumor and non-tumor tissues using tissue
microarrays.
| Staining
scores | Tumors (n=98) | Normal (n=20) |
|---|
| Negative | 0 | 0 |
| Weak | 21 (21.4%) | 20 (100%) |
| Moderate | 43 (43.87%) | 0 |
| Strong | 34 (34.69%) | 0 |
| Table VCorrelation of GLO1 expression with
tumor grade in breast tumors. |
Table V
Correlation of GLO1 expression with
tumor grade in breast tumors.
| GLO1 expression
| |
|---|
| Tumoral grade | Weak | Moderate | Strong | Total |
|---|
| 1 | 2 | 4 | 0 | 6 |
| 2 | 11 | 31 | 14 | 56 |
| 3 | 0 | 2 | 14 | 16 |
| Total | 13 | 37 | 28 | 78 |
Discussion
Previous transcriptomic studies using DNA
microarrays have allowed the identification of a large number of
genes that are differentially-expressed between human normal and
tumor mammary tissues (6–9). However, few of those identified genes
have been translated into valid protein markers that can help in
diagnosis and effective treatment (29,30).
Therefore, protein-level information represents a complementary
approach to the understanding of cancer proteins function and
translation of molecular knowledge into oncological clinical
practice. In particular, oncoproteomics technologies offer an
attractive and complementary approach in biomarkers discovery. In
this study, we performed traditional two-dimensional gel
electrophoresis in order to contribute to the identification of
novel potential markers with clinical value in breast cancer in
Mexican women. The proteomic profiles exhibited similitudes and
differences with those found previously by several authors in other
geographic populations. Coincidences include the overexpression of
nm23, perodoxin-6, Hsp27, and DJ-1 proteins, which have been
previously reported in several human cancer types. For instance, it
has been shown that serum levels of DJ-1 are increased in breast
cancer patients in comparison with healthy subjects. In addition
DJ-1 is a recognized androgen receptor coactivator (31), and is overexpressed in human
prostate cancer (32). Moreover,
DJ-1 has been considered as a prognostic value in ovarian carcinoma
with effusions.
Particularly, we observed the overexpression of GLO1
in breast tumor tissues, as it has been previously reported in
several human cancers. The glutathione-dependent glyoxalase system,
composed of GLO1 and GLO2 enzymes is involved in the detoxification
of methylglyoxal, a side toxic product of glycolysis that may react
with DNA, RNA, and proteins and cause cell apoptosis if accumulated
(28). This endogenous metabolite
causes glycation of nucleotides to form advanced glycation
end-products (AGEs) which induce single-strand breaks, DNA-protein
cross-link and cytotoxicity. Alterations in GLO1 enzyme expression
and activity have been previously reported in human cancers
(33–37). Sakamoto et al showed that
GLO1 is involved in apoptosis resistance to antitumor agents in
human leukemia cells, and that use of GLO1 inhibitors sensitizes
cells to chemotherapeutic agents (38). Particularly, the glo1 gene
was amplified in 8/37 (22%) of breast tumors (39). These events may reflect a response
of tumor cells to elevated cellular methylglyoxal stress associated
with glycolytic adaptations referred as the ‘Warburg’ effect
(40).
In the studies mentioned above, no correlation with
clinicopathological data was done, thus clinical relevance of GLO1
overproduction was unknown until the present work. Data from
immunohistochemistry on TMA confirmed that GLO1 protein was
overexpressed in most breast tumors, suggesting that gene
expression regulation mechanisms may be occurring at RNA and
protein level. In addition, they evidenced the up-regulation of
GLO1 enzyme in sporadic ductal breast cancer and established a
strong correlation with tumor grade 3. Notably, our findings from
2-D analysis of breast tumors and non-tumor tissues, and the
validation in a cohort of 98 patients, showed that GLO1
overexpression does not correlate with hormonal receptor status,
neither HER2-positive tumors. In fact, all the tumors analyzed by
conventional 2-D electrophoresis were HER2-negative. In contrast,
Zhang et al reported that GLO1 was exclusively overexpressed
in HER2-positive breast tumors by using TMA (17). These differences may be due to
genetic differences between Singapore and Mexico women populations
studied in these reports, which could represent the high
heterogeneity of breast cancer.
GLO1 overexpression was positively correlated with
high tumor grade. Grade refers to a ‘score’ that tells us how
different the cancer cell appearance and growth patterns are from
those of normal healthy cells, and it has predictive prognosis
value. Implications of these findings are important for patient
prognosis, because grade 3 tumors seem to be undifferentiated,
aggressive, with loss of tubules and high mitotic activity
(41). Unfortunately, 5-year
overall survival of patients with grade 3 tumors is only 50% in
comparison with grade 1 and 2 tumors, which is estimated as 90 and
75%, respectively. These findings point out for the potential use
of GLO1 as a novel marker for tumor grade with a prognostic value.
Additionally, GLO1 could be used to distinguish between aggressive
and less aggressive tumors. Intriguingly, we observed the presence
of GLO1 inside the nucleus in about 10% of tumors, which has not
been previously reported. These findings suggest a potential
nuclear function of GLO1 in detoxification of methylglyoxal to
prevent formation of nuclear advanced glycation end-products,
allowing cell survival. Overexpression of GLO1 could indicate a
defense response of tumor cells to elevated levels of methylglyoxal
associated with high glycolytic rates referred as the ‘Warburg’
effect. Our data suggested that GLO1 up-regulation is a common
event in cancer and the potential use of GLO1 inhibitors as useful
adjunct anticancer drugs deserve further validation.
Acknowledgements
The authors gratefully acknowledge the
financial support from the National Council of Science and
Technology, CONACyT Mexico (grants 112454 and 115306), and The
Institute of Science and Technology, ICyT-DF, Mexico (grant no.
PIFUTP09-269). This work was also supported by UACM (Mexico), and
COFAA-IPN (Mexico). We also acknowledge Dr Sonia Labastida
Almendaro for support in statistical analysis.
References
|
1
|
Ferlay J, Shin HR, Bray F, Forman D,
Mathers C and Parkin DM: Estimates of worldwide burden of cancer in
2008: GLOBOCAN 2008. Int J Cancer. 127:2893–2917. 2010. View Article : Google Scholar : PubMed/NCBI
|
|
2
|
Jemal A, Siegel R, Ward E, Hao Y, Xu J,
Murray T and Thun MJ: Cancer Statistics, 2008. CA Cancer J Clin.
58:71–96. 2008. View Article : Google Scholar
|
|
3
|
Schnitt SJ: Classification and prognosis
of invasive breast cancer: from morphology to molecular taxonomy.
Mod Pathol. 23:S60–S64. 2010. View Article : Google Scholar : PubMed/NCBI
|
|
4
|
Rakha EA and Ellis IO: Modern
classification of breast cancer: should we stick with morphology or
convert to molecular profile characteristics. Adv Anat Pathol.
18:255–267. 2011. View Article : Google Scholar : PubMed/NCBI
|
|
5
|
Rakha EA, Reis-Filho JS, Baehner F, et al:
Breast cancer prognostic classification in the molecular era: the
role of histological grade. Breast Cancer Res.
12:2072010.PubMed/NCBI
|
|
6
|
Perou CM, Sørlie T, Eisen MB, et al:
Molecular portraits of human breast tumours. Nature. 406:747–752.
2000. View
Article : Google Scholar : PubMed/NCBI
|
|
7
|
Murphy N, Millar E and Lee CS: Gene
expression profiling in breast cancer: towards individualising
patient management. Pathology. 37:271–277. 2005. View Article : Google Scholar : PubMed/NCBI
|
|
8
|
Correa Geyer F and Reis-Filho JS:
Microarray-based gene expression profiling as a clinical tool for
breast cancer management: are we there yet? Int J Surg Pathol.
17:285–302. 2009.PubMed/NCBI
|
|
9
|
Tyers M and Mann M: From genomics to
proteomics. Nature. 422:193–197. 2003. View Article : Google Scholar
|
|
10
|
Bertucci F, Birnbaum D and Goncalves A:
Proteomics of breast cancer: principles and potential clinical
applications. Mol Cell Proteomics. 5:1772–1786. 2006. View Article : Google Scholar : PubMed/NCBI
|
|
11
|
Westley B and Rochefort H: A secreted
glycoprotein induced by estrogen in human breast cancer cell lines.
Cell. 20:353–362. 1980. View Article : Google Scholar : PubMed/NCBI
|
|
12
|
Trask DK, Band V, Zajchowski DA, Yaswen P,
Suh T and Sager R: Keratins as markers that distinguish normal and
tumor-derived mammary epithelial cells. Proc Natl Acad Sci USA.
87:2319–2323. 1990. View Article : Google Scholar : PubMed/NCBI
|
|
13
|
Stein RC and Zvelebil MJ: The application
of 2-D gel-based proteomics methods to the study of breast cancer.
J Mammary Gland Biol Neoplasia. 7:385–393. 2002. View Article : Google Scholar : PubMed/NCBI
|
|
14
|
Umar A, Kang H, Timmermans AM, et al:
Identification of a putative protein profile associated with
tamoxifen therapy resistance in breast cancer. Mol Cell Proteomics.
8:1278–1294. 2009. View Article : Google Scholar : PubMed/NCBI
|
|
15
|
Besada V, Diaz M, Becker M, Ramos Y,
Castellanos-Serra L and Fichtner I: Proteomics of xenografted human
breast cancer indicates novel targets related to tamoxifen
resistance. Proteomics. 6:1038–1048. 2006. View Article : Google Scholar : PubMed/NCBI
|
|
16
|
González-Zamorano M, Mendoza-Hernández G,
Xolalpa W, Parada C, Vallecillo AJ, Bigi F and Espitia C:
Mycobacterium tuberculosis glycoproteomics based on
ConA-lectin affinity capture of mannosylated proteins. J Proteome
Res. 8:721–733. 2009.
|
|
17
|
Zhang D, Tai LK, Wong LL, Chiu LL, Sethi
SK and Koay ES: Proteomic study reveals that proteins involved in
metabolic and detoxification pathways are highly expressed in
HER-2/neu-positive breast cancer. Mol Cell Proteomics. 4:1686–1696.
2005. View Article : Google Scholar : PubMed/NCBI
|
|
18
|
Chang XZ, Li DQ, Hou YF, Wu J, Lu JS, Di
GH, Jin W, Ou ZL, Shen ZZ and Shao ZM: Identification of the
functional role of peroxiredoxin 6 in the progression of breast
cancer. Breast Cancer Res. 9:R762007. View
Article : Google Scholar : PubMed/NCBI
|
|
19
|
Le Naour F, Misek DE, Krause MC, Deneux L,
Giordano TJ, Scholl S and Hanash SM: Proteomics-based
identification of RS/DJ-1 as a novel circulating tumor antigen in
breast cancer. Clin Cancer Res. 7:3328–3335. 2001.PubMed/NCBI
|
|
20
|
Bianchi MS, Bianchi NO and Bolzán AD:
Superoxide dismutase activity and superoxide dismutase-1 gene
methylation in normal and tumoral human breast tissues. Cancer
Genet Cytogenet. 59:26–29. 1992. View Article : Google Scholar : PubMed/NCBI
|
|
21
|
Wei L, Liu TT, Wang HH, Hong HM, Yu AL,
Feng HP and Chang WW: Hsp27 participates in the maintenance of
breast cancer stem cells through regulation of
epithelial-mesenchymal transition and nuclear factor-kappa B.
Breast Cancer Res. 13:R1012011. View
Article : Google Scholar : PubMed/NCBI
|
|
22
|
Sims JD, McCready J and Jay DG:
Extracellular heat shock protein (Hsp)70 and Hsp90α assist in
matrix metalloproteinase-2 activation and breast cancer cell
migration and invasion. PLoS One. 6:e188482011.
|
|
23
|
Wang LP, Bi J, Yao C, Xu XD, Li XX, Wang
SM, Li ZL, Zhang DY, Wang M and Chang GQ: Annexin A1 expression and
its prognostic significance in human breast cancer. Neoplasma.
57:253–259. 2010. View Article : Google Scholar : PubMed/NCBI
|
|
24
|
Porter D, Weremowicz S, Chin K, et al: A
neural survival factor is a candidate oncogene in breast cancer.
Proc Natl Acad Sci USA. 100:10931–10936. 2003. View Article : Google Scholar : PubMed/NCBI
|
|
25
|
Sahni A, Arévalo MT, Sahni SK and
Simpson-Haidaris PJ: The VE-cadherin binding domain of fibrinogen
induces endothelial barrier permeability and enhances
transendothelial migration of malignant breast epithelial cells.
Int J Cancer. 125:577–584. 2009. View Article : Google Scholar
|
|
26
|
Moon HG, Jeong SH, Ju YT, Jeong CY, Lee
JS, Lee YJ, Hong SC, Choi SK, Ha WS, Park ST and Jung EJ:
Up-regulation of RhoGDI2 in human breast cancer and its prognostic
implications. Cancer Res Treat. 42:151–156. 2010. View Article : Google Scholar : PubMed/NCBI
|
|
27
|
Steeg PS, De la Rosa A, Flatow U,
MacDonald NJ, Benedict M and Leone A: Nm23 and breast cancer
metastasis. Breast Cancer Res Treat. 25:175–187. 1993. View Article : Google Scholar : PubMed/NCBI
|
|
28
|
Thornalley PJ: Protecting the genome:
defence against nucleotide glycation and emerging role of
glyoxalase I overexpression in multidrug resistance in cancer
chemotherapy. Biochem Soc Trans. 31:1372–1377. 2003. View Article : Google Scholar : PubMed/NCBI
|
|
29
|
Knauer M, Cardoso F, Wesseling J, Bedard
PL, Linn SC, Rutgers EJ and van’t Veer LJ: Identification of a
low-risk subgroup of HER-2-positive breast cancer by the 70-gene
prognosis signature. Br J Cancer. 103:1788–1793. 2010. View Article : Google Scholar : PubMed/NCBI
|
|
30
|
Toi M, Iwata H, Yamanaka T, et al Japan
Breast Cancer Research Group-Translational Research Group: Clinical
significance of the 21-gene signature (Oncotype DX) in hormone
receptor-positive early stage primary breast cancer in the Japanese
population. Cancer. 116:3112–3118. 2010. View Article : Google Scholar : PubMed/NCBI
|
|
31
|
Pitkanen-Arsiola T, Tillman J, Gu G, et
al: Androgen and anti-androgen treatment modulates androgen
receptor activity and DJ-1 stability. Prostate. 66:1177–1193. 2006.
View Article : Google Scholar : PubMed/NCBI
|
|
32
|
Tillman J, Yuan J, Gu G, et al: DJ-1 binds
androgen receptor directly and mediates its activity in hormonally
treated prostate cancer cells. Cancer Res. 67:4630–4637. 2007.
View Article : Google Scholar : PubMed/NCBI
|
|
33
|
Ranganathan S and Tew KD: Analysis of
glyoxalase-I from normal and tumor tissue from human colon. Biochim
Biophys Acta. 1182:311–316. 1993. View Article : Google Scholar : PubMed/NCBI
|
|
34
|
Di Ilio C, Angelucci S, Pennelli A, Zezza
A, Tenaglia R and Sacchetta P: Glyoxalase activities in tumor and
non-tumor human urogenital tissues. Cancer Lett. 96:189–193.
1995.PubMed/NCBI
|
|
35
|
Davidson SD, Cherry JP, Choudhury MS,
Tazaki H, Mallouh C and Konno S: Glyoxalase I activity in human
prostate cancer: a potential marker and importance in chemotherapy.
J Urol. 161:690–691. 1999. View Article : Google Scholar : PubMed/NCBI
|
|
36
|
Rulli A, Carli L, Romani R, Baroni T,
Giovannini E, Rosi G and Talesa V: Expression of glyoxalase I and
II in normal and breast cancer tissues. Breast Cancer Res Treat.
66:67–72. 2001. View Article : Google Scholar : PubMed/NCBI
|
|
37
|
Bair WB III, Cabello CM, Uchida K, Bause
AS and Wondra GT: GLO1 overexpression in human malignant melanoma.
Melanoma Res. 20:85–96. 2010. View Article : Google Scholar : PubMed/NCBI
|
|
38
|
Sakamoto H, Mashima T, Kizaki A, Dan S,
Hashimoto Y, Naito M and Tsuruo T: Glyoxalase I is involved in
resistance of human leukemia cells to antitumor agent-induced
apoptosis. Blood. 95:3214–3218. 2000.PubMed/NCBI
|
|
39
|
Santarius T, Bignell GR, Greenman CD, et
al: GLO1 - a novel amplified gene in human cancer. Genes
Chromosomes Cancer. 49:711–725. 2010. View Article : Google Scholar : PubMed/NCBI
|
|
40
|
Van der Heiden MG, Cantley LC and Thompson
CB: Understanding the Warburg effect: the metabolic requirements of
cell proliferation. Science. 324:1029–1033. 2009.PubMed/NCBI
|
|
41
|
Ross JS and Harbeck N: Prognostic and
predictive factors overview. Molecular Oncology of Breast Cancer.
Ross JS and Hortobagyi GN: Jones and Bartlett Publishers; Sudbury,
MA: 2005
|