Introduction
Inhibins and activins, members of the transforming
growth factor-β (TGF-β) superfamily, are polypeptides that were
originally isolated from ovarian fluid, based on their effect on
pituitary follicle-stimulating hormone (FSH) production and
secretion. Inhibins are heterodimers that are composed of a common
α subunit and one of two homologous β subunits (βA and
βB). Activins are either heterodimers or homodimers of
the inhibin β subunits (βAβA,
βBβB, and βAβB)
(1–3). Activin βC, βD,
βE chains, and partially characterized activin
AC(βAβC) and activin
BC(βBβC) proteins have also been reported
(4–6).
Besides their classical endocrine function in
suppressing of FSH production and secretion, inhibins are thought
to act in an autocrine or paracrine manner within reproductive
tissues. In females, inhibins appear to influence folliculogenesis
by regulating granulose cell maturation and proliferation, steroid
hormone production and oocyte maturation within the ovary (7–10).
Reduced production of inhibins or production of mutant forms of
inhibins is linked to several ovarian diseases, including premature
ovarian failure (11) and
polycystic syndrome (12), whereas
increased inhibin is found in pre-eclampsia (13) and in certain ovarian cancers
(14,15). Overexpression of inhibin-α in mice
results in abnormal reproductive function including decreased
litter size (16) and decreased
embryo size (17). In males,
inhibins are potential autocrine or paracrine regulators of Leydig
and Sertoli cell proliferation, differentiation and steroidogenesis
(18).
More recently, inhibins and activins have both been
implicated in endocrine-related cancers (19). The inhibin-α gene was identified as
a tumor suppressor gene in the gonads and adrenals by functional
studies using knockout mice (20–22).
This has raised the question of whether it plays a broader role as
a tumor suppressor outside the reproductive axis. A second
interesting model has been prostate carcinoma, where it was
observed that hypermethylation of the inhibin-α gene promoter and
LOH at 2q32-36, the chromosome region harboring the inhibin-α gene,
occurred in 42% of prostate carcinomas (23). Moreover, there was a positive
correlation between loss of inhibin expression and malignancy of
these human prostate carcinomas cells (24). Recently, seemingly conflicting
functions of the inhibin-α gene in the prostate were reported.
Inhibin-α expression was reduced in early-stage tumors but
increased in late-stage, metastatic prostate cancers, suggesting
that inhibins act as tumor suppressors during early tumorigenesis
but might act as tumor promoters during late-stage disease
(24,25). Moreover, it was reported that
inhibin negatively regulated matrix metalloproteinase (MMP) levels
and MMPs have an integral role in the increased metastatic and
invasive potential of cancer cells (26–28).
Thus considerable evidence supports roles of inhibin-α beyond the
gonad and adrenal gland and indicates its importance in regulating
cell growth. Whether or not inhibin-α has a general function in
cancerous cells and tissues other than prostate is not yet clear.
Having the long-term goal of addressing this question, we studied
inhibin-α gene expression changes in human gastric cancer carcinoma
cells.
Materials and methods
Cell cultures
Human gastric cancer cell lines AGS and KATO III
were purchased from the American Tissue Culture Collection
(Manassas, VA, USA). SNU-1, SNU-5, SNU-16, SNU-484, SNU-601,
SNU-638, SNU-668, and SNU-719 cell lines were supplied by the
Korean Cell Line Bank (Cancer Research Center, Seoul, Korea). Cells
were cultured in RPMI-1640 medium (Gibco-BRL, Carlsbad, CA, USA)
containing 10% fetal bovine serum (FBS), 100 U/ml penicillin and
100 μg/ml streptomycin at 37°C in a humidified atmosphere of
5% CO2 in 95% air.
Bisulfite modification
The methylation status of the promoter CpG islands
of the inhibin-α gene in all sample DNAs was analyzed by PCR on the
sodium-bisulfite converted DNA (29). Genomic DNA was extracted by the
Wizard Genomic DNA purification kit (Promega Corporation, Madison,
WI, USA). DNA (2 μg) in a volume of a 50 μl was
denatured with NaOH (final concentration, 0.2 M) and incubated at
37°C for 15 min, then 30 μl of 10 mM hydroquinone and 520
μl of 3 M sodium bisulfite (Sigma-Aldrich, St. Louis, MO,
USA) at pH 5.0 were added into the tube. After mixing, samples were
incubated under mineral oil at 55°C for 16 h. Then, DNA was
desalted with Wizard DNA Clean-Up system (Promega), desulfonated by
addition of NaOH (final concentration, 0.3 M), and incubated at
37°C for 15 min. The solution was neutralized by addition of
ammonium acetate (final concentration, 3.0 M), and the DNA was
ethanol-precipitated, dried, and re-suspended in 20 μl of
water and used immediately or stored at −20°C.
Detection of methylation
Methylation was assessed by PCR and sequence
analysis of bisulfite-treated DNA. The bisulfite reaction converted
unmethylated cytosines to uracil, whereas methylated cytosines were
unchanged. The 5′-UTR region of inhibin-α was amplified by nested
PCR using primers designed to the bisulfite-converted sequence
(23). Primer sequence 1
(5′-GATAAGAGTTTAGATTGGTTTTATTGGTT-3′) and 2
(5′-ACACCATAACTCACCTAACCCTACTAATAA-3′) were used for the first
round of PCR and primer sequences 3
(5′-ACCCCTTCTACCAAAATCTACCCAAAA-3′) and 4
(5′-GAAGGTGTTGTATGTTTGTATGTGTGAGTT-3′) were used for the second
round of PCR. The first round of PCR was performed in 25 μl
reactions with 2 μl of bisulfite-converted DNA, 1X PCR
buffer (10 mM Tris, pH 8.3, 50 mM KCl, 1.5 mM MgCl2),
200 μM of each dNTPs, 10 pmol of each primer 1 and 2, and 1
unit of AmpliTaq Gold DNA polymerase (Applied Biosystems, Carlsbad,
CA, USA). PCR cycles consisted of 95°C for 15 min followed by 5
cycles of 95°C for 1 min, 50°C for 2 min, and 72°C for 3 min and
followed by 30 cycles of 95°C for 1 min, 55°C for 2 min, and 72°C
for 2 min with a final incubation step of 72°C for 10 min. A sample
of 2 μl from the first PCR was amplified in a 25 μl
reaction as above except that primer 3 and 4 were used. PCR cycling
conditions were as for the first reaction, with the exception that
the annealing temperature was increased to 60°C. PCR products were
gel purified, ligated into the PCR 2.1 cloning vector, and cloned
using the TOPO® TA Cloning® Kit according to
the manufacturer’s instructions (Invitrogen, Carlsbad, CA, USA).
For each PCR, 10 clones were sequenced and the methylation at each
of the seven CpGs in the inhibin-α proximal promoter was
determined.
DNA analysis
DNA was isolated from cultured cells by standard
methods. Two regions of inhibin-α gene were amplified from genomic
DNA by PCR with specific oligonucleotide primers (30). The first region of 240 bp (fragment
A), which includes 140 bp of 5′-UTR and 100 bp of exon 1, was
amplified by primers AF (5′-GACTGGGGAAGACTGGATGA-3′) and AR
(5′-TCACCTTGGCCAGAACAAGT-3′). The second region of 396 bp (fragment
B), which comprises part of exon 2, was amplified by primers BF
(5′-AGCAGCCTCCAATAGCTCTG-3′) and BR (5′-AGCTCCTGGAAGGAGATGTTC-3′).
Genomic DNA (200 ng) was amplified in a 50 μl volume
reaction containing 1X PCR buffer, 2 mM MgCl2, 2.5%
DMSO, 0.2 mM of each dNTP, 20 pmol of each specific primer and 1.5
units of AmpliTaq Gold DNA polymerase. The condition for
amplification was as follows: first after denaturation at 95°C for
14 min, then denaturation at 95°C for 40 sec, annealing at 57°C for
30 sec, and extension at 72°C for 1 min for 35 cycles and final
extension at 72°C for 7 min. Polymorphism −16C>T in the 5′-UTR
was screened in the samples by restriction enzyme analysis using
SpeI (New England Biolabs, Ipswich, MA, USA). Briefly, fragment A
was amplified by PCR and 5 μl of purified PCR product was
digested overnight at 37°C with 5 units of SpeI, electrophoresed on
8% polyacrylamide gels, stained with ethidium bromide and
visualized by using a Gel Doc 1,000 Gel Documentation System
(Bio-Rad, Hercules, CA, USA). Presence of the 240 bp fragment
indicated a homozygous variant for wild-type, whereas presence of
two fragments of 120 bp corresponded to homozygous variant T.
Substitution 769G>A of exon 2 was analyzed by digestion of
fragment B with different restriction enzymes. Five microliters of
purified PCR product was digested overnight at 37°C with 5 units of
BsrFI (New England Biolabs) and analyzed as described above. The
restriction site that renders two fragments of 340 and 56 bp is
abolished in the variant allele. In addition, 5 μl of
purified PCR product were digested overnight at 37°C with 5 units
of Fnu4HI (New England Biolabs), electrophoresed on 15%
polyacrylamide gels, stained with ethidium bromide and visualized
by image analysis. The 396 bp fragment renders four fragments of
153, 107, 51, and 25 bp, among others of lower molecular weight, in
the wild-type allele, whereas the allele with substitution
769G>A renders four fragments of 153, 107, 76 and 51 bp, among
others of lower molecular weight.
Loss of heterozygosity (LOH)
analysis
LOH was determined using microsatellite markers on
2q32-q33 (D2S389) and 2q33-q36 (D2S128) which were previously
described (23,31). Oligonucleotide primer sequences
were D2S389 (5′-TAAAGCCTAGTGGAAGATCATC-3′,
5′-GCTGAGTTAACAGTTATCAACAATT-3′) and D2S128
(5′-AAACTGAGATTTGTCTAAGGGG-3′, 5′-AGCCAGGAATTTTTGCTATT-3′). PCR was
performed in 20 μl reactions consisting of 200 ng of DNA, 1X
PCR buffer, 0.2 mM dNTPs, 10 pmol of each primer, and 1 unit of
AmpliTaq Gold DNA polymerase. The condition for amplification was
as follows: after denaturation at 95°C for 14 min, then
denaturation at 95°C for 1 min, annealing at 55°C for 1 min, and
extension at 72°C for 1 min for 35 cycles and final extension at
72°C for 10 min. Ten microliters of PCR products was mixed with 10
μl of stop solution containing 95% formamide, 10 mM NaOH,
0.25% bromophenol blue and 0.25% xylene cyanol FF. The mixture was
denatured at 95°C for 5 min, put onto ice for 5 min,
electrophoresed on 12% polyacrylamide gels containing 10% glycerol
with 1X TBE buffer and stained with ethidium bromide. LOH was
defined as reduction of the intensity of the signal of a single
allele by >50% in the tumor DNA by direct visualization when
compared with the corresponding DNA of peripheral blood
lymphocytes.
RNA extraction and RT-PCR procedures
Total-RNA was extracted from cultured cells using
the RNA-Bee solution kit following the manufacturer’s protocol
(Tel-Test, Friendswood, TX, USA). Total-RNA was treated with RQ1
RNase-free DNase (1 μl/μg) (Promega) at 37°C for 30
min and added 1 μl of RQ1 DNase stop solution to terminate
the reaction, followed by heat inactivation at 65°C for 10 min. The
RNA was purified with a phenol/chloroform extraction and
precipitated with ethanol. First-strand cDNA synthesis was
performed with 2 μg of DNase-treated mRNA. The cDNA was made
with random hexamers using a reverse transcription system (Promega)
according to the manufacturer’s protocol. PCR was performed with 2
μl cDNA in a 25 μl reaction mixture of 1X PCR buffer,
0.2 mM each dNTP, 10 pmol of each primer inhibin-α
(5′-AGGAAGAGGAGGATGTCTCC-3′, 5′-GAGTAACCTCCATCCGAGGT-3′; 823 bp),
betaglycan (5′-ACATGGATAAGAAGCGATTCAGC-3′,
5′-AACGCAATGCCCATCACGGTTAG-3′; 331 bp), and β-actin
(5′-CTTCTACAATGAGCTGCGTG-3′, 5′-TCATGAGGTAGTCAGTCAGG-3′; 305 bp)
and 1 unit of AmpliTaq Gold DNA polymerase. The reactions were
carried out in a thermal cycler with an initial denaturation step
at 95°C for 14 min followed by 35 cycles (30 cycles for betaglycan
and 22 cycles for β-actin) of denaturation at 95°C for 1 min,
primer annealing at 50°C (inhibin-α), 64°C (betaglycan), and 55°C
(β-actin) for 1 min, and extension at 72°C for 1 min. The reaction
was terminated at 72°C for 10 min and samples were stored at 4°C.
Ten microliters of PCR products was separated by electrophoresis on
a 2% agarose gel containing ethidium bromide (0.5 μg/ml) and
visualized by image analysis.
Immunohistochemical staining for the
inhibin-α protein
Monolayer cell lines were seeded in eight-well
Lab-Tek II chamber slides with covers (Nalgene, Rochester, NY, USA)
and the cells were treated with 5-AzaC. At the end of the treatment
period, suspension cell lines were attached on collagen
coated-slides by cytospin. After a PBS wash, the cells were fixed
on the slides using −10°C methanol for 5 min and air dried. The
chambers were taken off before the immunostaining procedure. After
incubation with 0.3% H2O2 for 10 min to block
the endogenous peroxidase, the cells were incubated for 1 h with
human inhibin-α mouse monoclonal antibody diluted to 5 μg/ml
(Serotec, Kidlington, England). Subsequently, the biotin-conjugated
secondary antibody was incubated for 30 min using mouse ABC
staining systems according to the manufacturer’s protocol (Santa
Cruz Biothechnology, Santa Cruz, CA, USA), and incubated with
horseradish peroxidase (HRP)-streptavidin complex for 30 min and
visualized by reaction with diaminobenzidine (DAB) for 5 min.
Slides were stained with Mayer’s haematoxylin and dehydrated
through ethanol and xylene. Concentration-matched mouse
IgG2a was used as a negative control.
Flow cytometric analysis
The cultured cells were detached with 0.05%
trypsin-EDTA solution. After washing with cold PBS, cells were then
incubated with a 1:50 dilution of anti-inhibin-α goat polyclonal
antibody (Santa Cruz Biotechnology) or normal goat serum as a
negative control for 30 min at 4°C. After being washed three times
with cold PBS, cells were stained with fluorescein isothiocyanate
(FITC)-labeled donkey antibody to 1:50 diluted rabbit
immunoglobulin for 30 min at 4°C. Washing was repeated in the same
manner and cell surface immunofluorescence was analyzed using a
FACSCalibur with CellQuest software (Becton Dickinson, Franklin
Lakes, NJ, USA).
5-aza-2′-deoxycytidine (5-AzaC)
treatment
Cells were seeded at a density of 5×10⁵
cells and then allowed to attach during a 24-h period, and treated
with 5-AzaC (Sigma, St. Louis, MO, USA) at 10 μM for 5 days,
which was consistent with another report (32). For the doubling time experiment,
5-AzaC was used at 5 μM. The medium and the drug were
replaced every 2 day. At the end of the treatment period, the
medium was removed and the cell pellets were used for analysis.
Determination of cell doubling time
Cells were treated with 5-AzaC and washed with PBS.
Cells were seeded at 2×10⁴ cells/ml in 12-well plates
with culture medium, and cell number/dish was counted with a trypan
blue assay each day for 5 consecutive days. Untreated cells were
analyzed under similar conditions as a control. The average cell
number from two plates was determined, and the mean cell numbers
were plotted to define the cell population doubling times. The cell
population doubling time was calibrated by a formula of Kuchler
(33).
Cell cycle analysis
Cells (5×10⁵/100-mm dish) were treated
with 5-AzaC. At the end of the treatment period, cells were
harvested and washed with PBS. Cells were fixed with 70% ethanol
for 1 h, treated with RNasin (20 μg/ml) at 37°C for 1 h,
stained with PI (50 μg/ml) (Sigma). DNA content at each cell
cycle stage was analyzed using a FACSCalibur with CellQuest
software (Becton Dickinson).
Results
Methylation status of the inhibin-α gene
in human gastric cancer cell lines
Transcriptional silencing of tumor suppressor genes
mediated by hypermethylation is a common feature of human cancer
(23,34). As well, change in promoter
methylation has been reported as a potential regulatory mechanism
for the inhibin-α gene in prostate tumors (23). Thus, the methylation state of
inhibin-α gene was investigated in human gastric cancer cells.
Methylation was determined at the seven CpG sites which are located
−149 to −284 bp from the ATG site of the inhibin-α gene, using
bisulfite DNA sequencing (23)
(Fig. 1A). We observed that
inhibin-α promoter was heavily methylated in the SNU-1, SNU-5, and
SNU-484 cell lines. The promoter was moderately methylated in
SNU-719, AGS, and KATO III cell lines. In contrast, the promoters
were largely unmethylated in the SNU-16, SNU-601, SNU-638 and
SNU-668 cell lines. The promoter of inhibin-α in normal epithelium
(N. Epithelium) was relatively unmethylated whereas that in normal
peripheral blood leukocytes (N. PBL) was heavily methylated
(Fig. 1B). To determine how
methylation status might affect the growth characteristics of these
cells (reported in a later section), the lines were treated with
5-AzaC, a demethylating agent. The result was that many CpG sites
were unmethylated after treatment with 5-AzaC in SNU-1, SNU-5,
SNU-484 and SNU-719 although the degree of methylation loss was
different for each line. Of interest was that specifically CpG 5
site was strongly influenced by 5-AzaC (Fig. 1C).
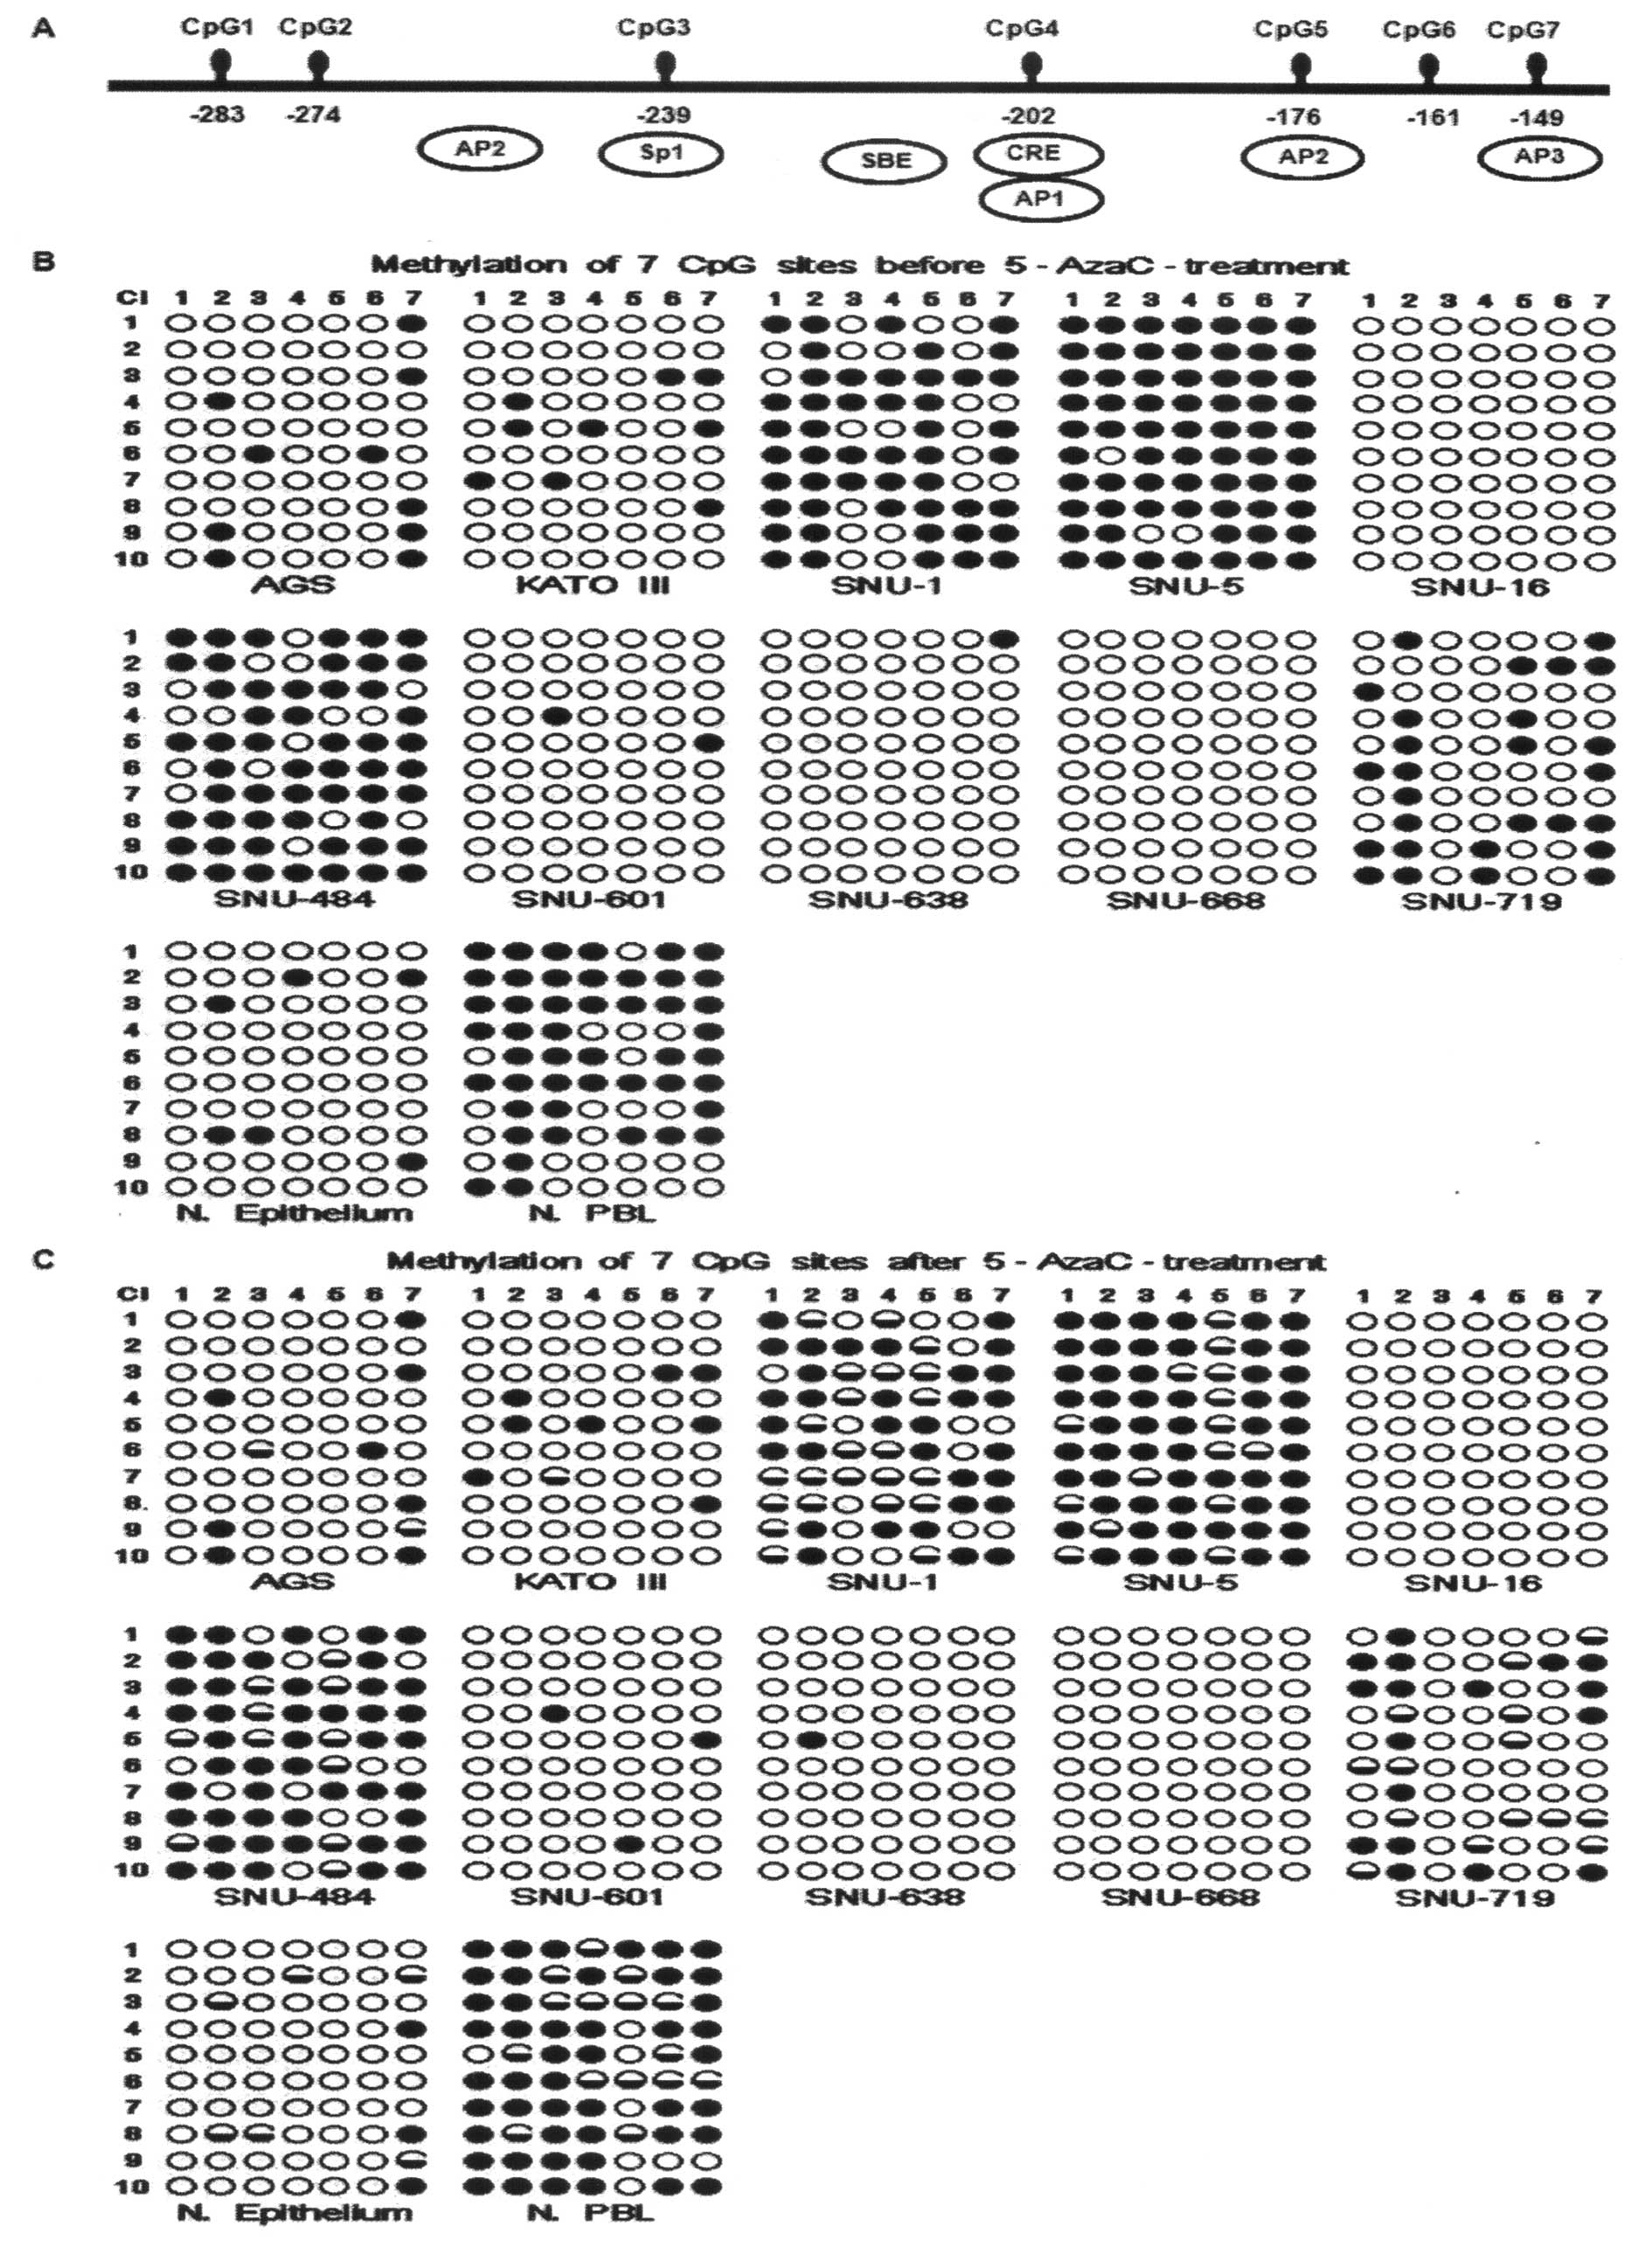 | Figure 1Methylation analysis of the inhibin-α
promoter region. (A) Map of the seven CpG sites in the inhibin-α
promoter within a 135 bp regions from −149 to −284 of the ATG
start. (B) Methylation profile of the inhibin-α promoter region in
human gastric cancer cell lines. (C) Methylation profile of the
inhibin-α promoter region in human gastric cancer cell lines after
5-AzaC treatment. Cells were exposed to 5-AzaC for 5 days.
Methylation levels were determined by sequencing of 10 independent
clones derived from amplified bisulfite-treated DNA isolated from
cancer cell lines. Methylated and unmethylated CpGs are represented
by closed and open circles, respectively. Demethylated CpGs after
5-AzaC treatment are represented by half-closed circles. AP1, 2,
and 3, activator proteins 1, 2, and 3; CRE, cAMP response element;
SP1, specific protein 1, SBE; Smad binding element; N. Epithelium,
normal epithelium; N. PBL, normal peripheral blood leukocytes. |
LOH and mutation of the inhibin-α gene in
human gastric cancer cell lines
Transcriptional silencing of tumor suppressor genes
can also occur through LOH of the gene (23,35).
Thus, we investigated the LOH of inhibin-α gene in human gastric
cancer cells. Microsatellite markers on 2q32-q33 (D2S389) and
2q33-q36 (D2S128) was amplified by PCR. The result was that LOH
occurred with at least one microsatellite marker at 2q32-33 in
SNU-5 and SNU-484 whereas LOH at 2q33-36 was observed in AGS, KATO
III and SNU-484. Interestingly, LOH both at 2q32-33 and 2q33-36 was
observed in SNU-484. In addition, allelic imbalances were observed
both at 2q32-33 locus in SNU-16, SNU-601, and SNU-719 and at
2q33-36 locus in SNU-1, SNU-5, SNU-16, SNU-601, SNU-638, and
SNU-719 (Fig. 2A).
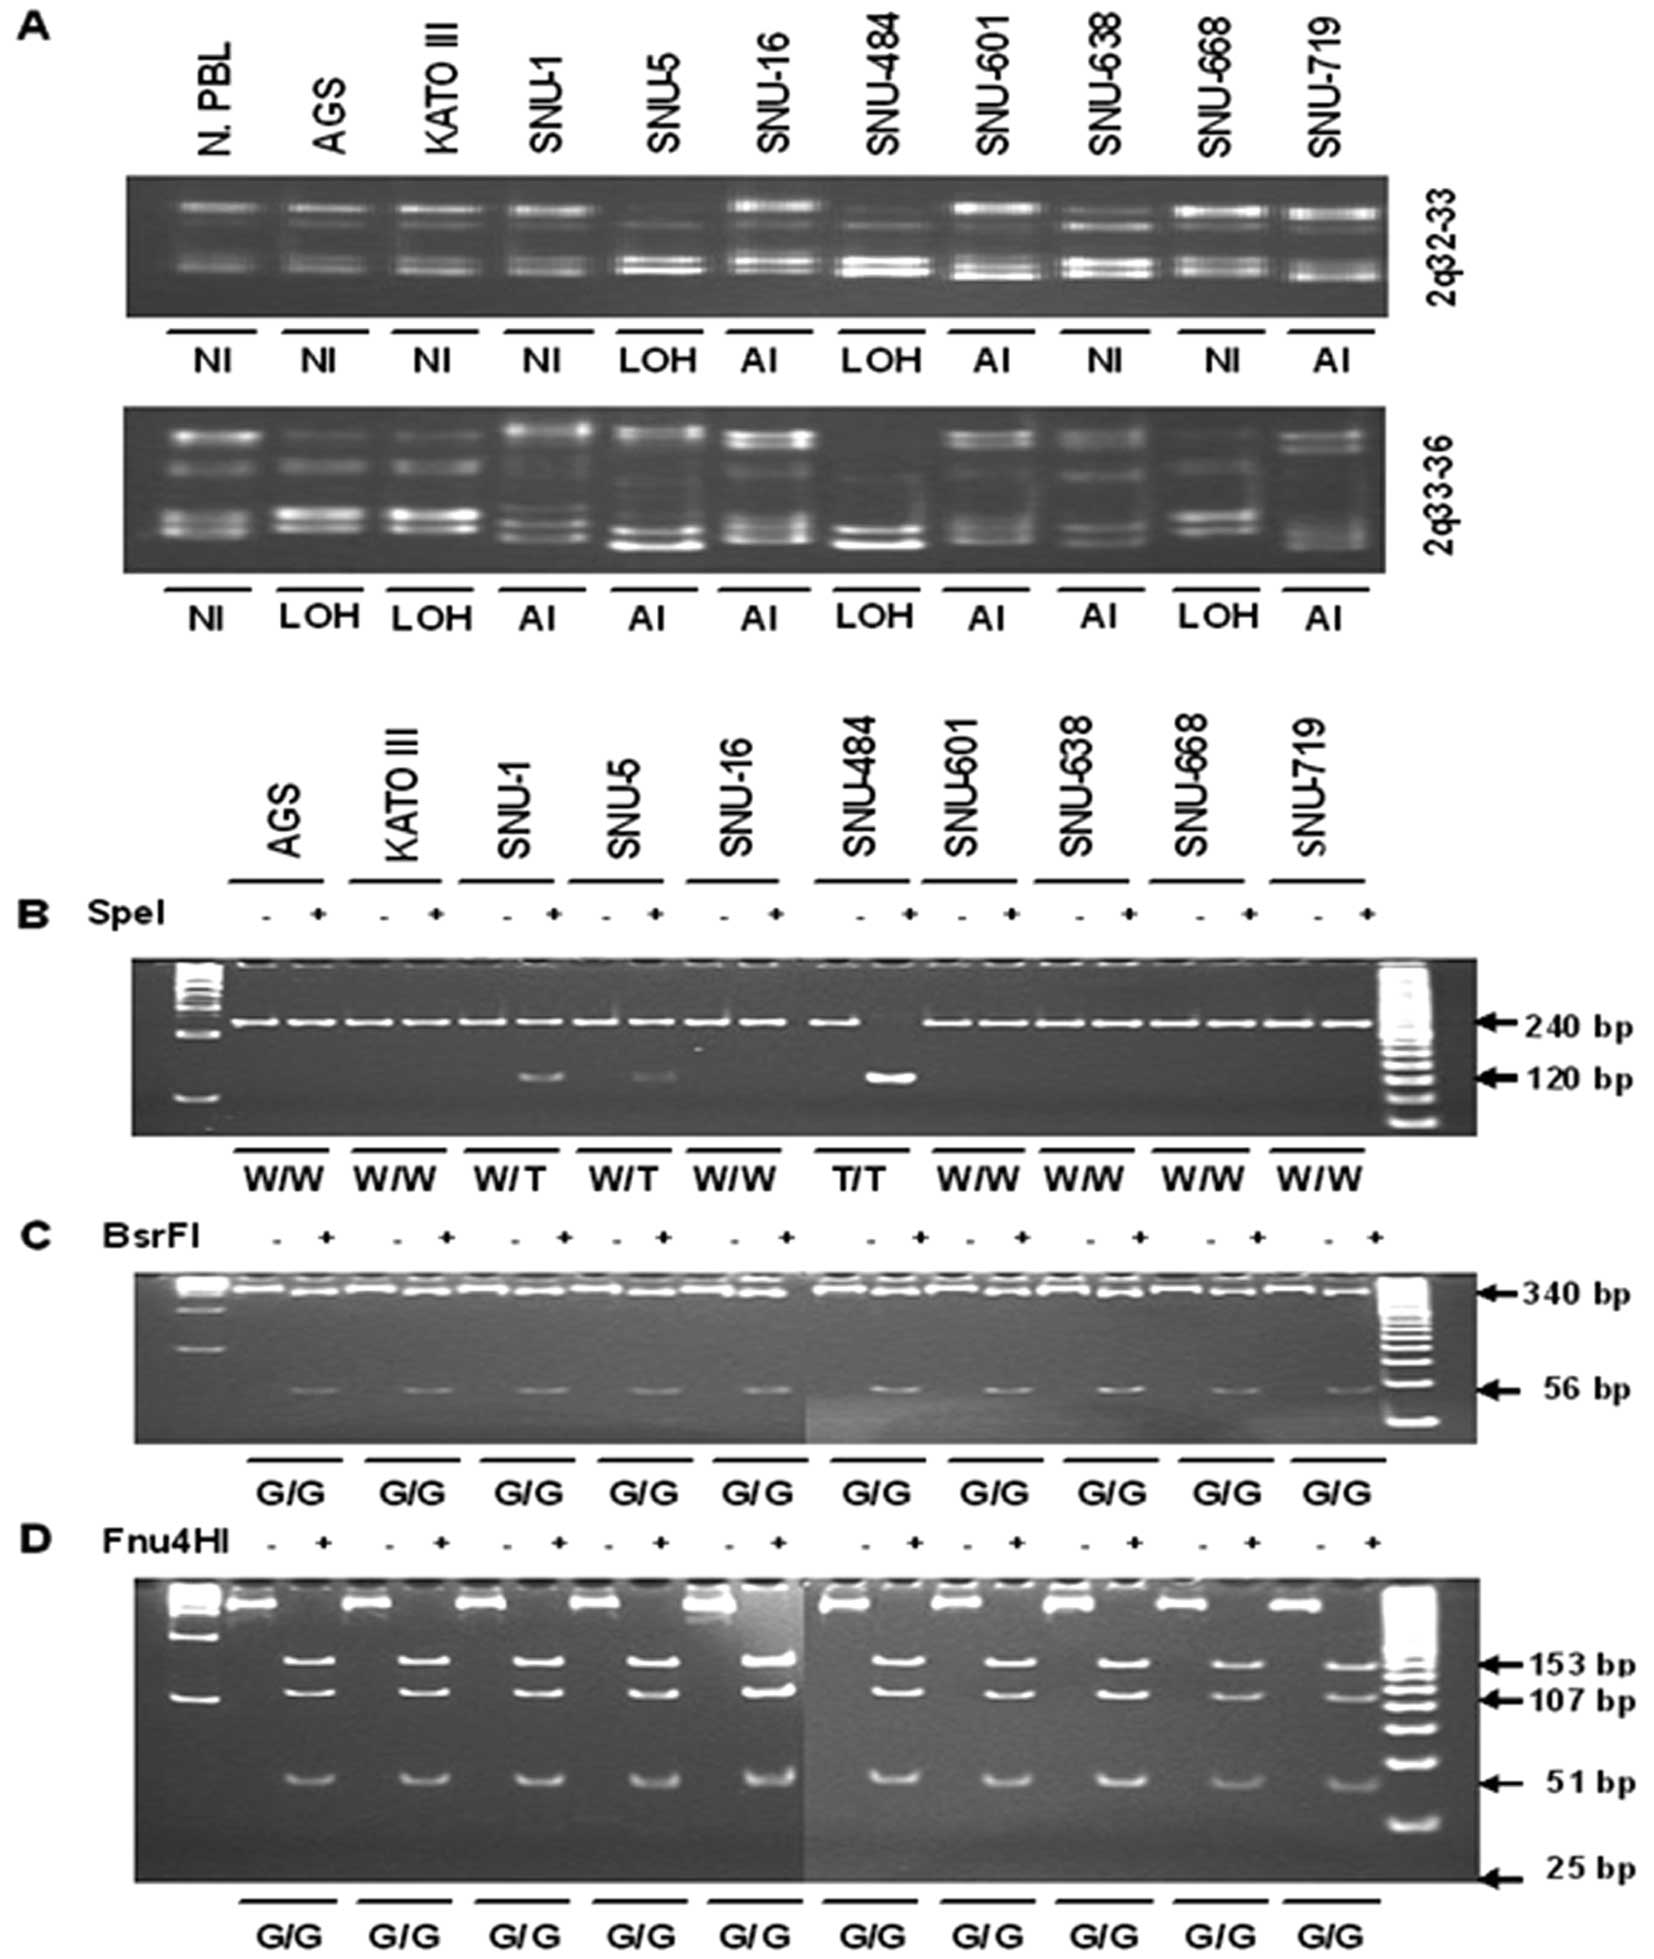 | Figure 2(A) LOH analysis of chromosome 2q and
(B–D) mutation analysis at the sites of −16 bp of 5′-UTR and +769
bp of exon 2. (A) Genomic DNAs obtained from human gastric cancer
cell lines were amplified using PCR with primers as described in
Materials and methods. Primers covered the microsatellite markers
on 2q32-q33 and 2q33-q36. PCR product was separated on 12%
polyacrylamide gels, stained with ethidium bromide, and visualized
by image analysis. LOH was expressed when band intensity was
decreased below 50% compared with normal band. AI was expressed
when band size was different from normal allele. NI, not
informative; LOH, loss of heterozygosity; AI, allelic imbalance.
(B) Fragment A (240 bp) which contained region of −16 bp of 5′-UTR
was digested with SpeI after PCR as described in Materials and
methods. Fragment of 240 bp indicated a wild-type allele, whereas
two fragments of 120 bp corresponded to an allele which contains T
at −16 bp of 5′-UTR. (C) Fragment B (396 bp) which contained region
of 769G>A of exon 2 digested with BsrFI after PCR as described
in Materials and methods. PCR product rendered two fragments of 340
and 56 bp in wild-type allele G and remained intact in the mutated
allele A which was not observed. (D) Fragment B was digested with
Fnu4HI. PCR product rendered four fragments of 153, 107, 51 and 25
bp in the wild-type allele, whereas the allele with substituted
769G>A rendered four fragments of 153, 107, 76 and 51 bp. The
result of (C) and (D) revealed that substituted 769G>A of exon 2
was not occurred in the human gastric cancer cell lines. PCR
product incubated with restriction enzyme overnight and separated
on 8 and 15% polyacrylamide gels, stained with ethidium bromide,
and visualized by image analysis. +E, with restriction enzyme; −E,
without restriction enzyme. |
Transcriptional silencing of tumor suppressor genes
can also occur through mutation of the gene. Two polymorphic sites
were indentified in the inhibin-α gene: −16C>T in the 5′-UTR
(30) and 769G>A in exon 2 in
previous report (11,30,36).
Thus, we investigated these variants of the inhibin-α gene in human
gastric cancer cells. The first investigated region was located at
the 5′-UTR region (Fig. 2B). The
second investigated region was located at 769 bp within exon 2
region (Fig. 2C and D). Thus, the
single base change at 769G>A of exon 2 was not found in all
human gastric cancer cell lines.
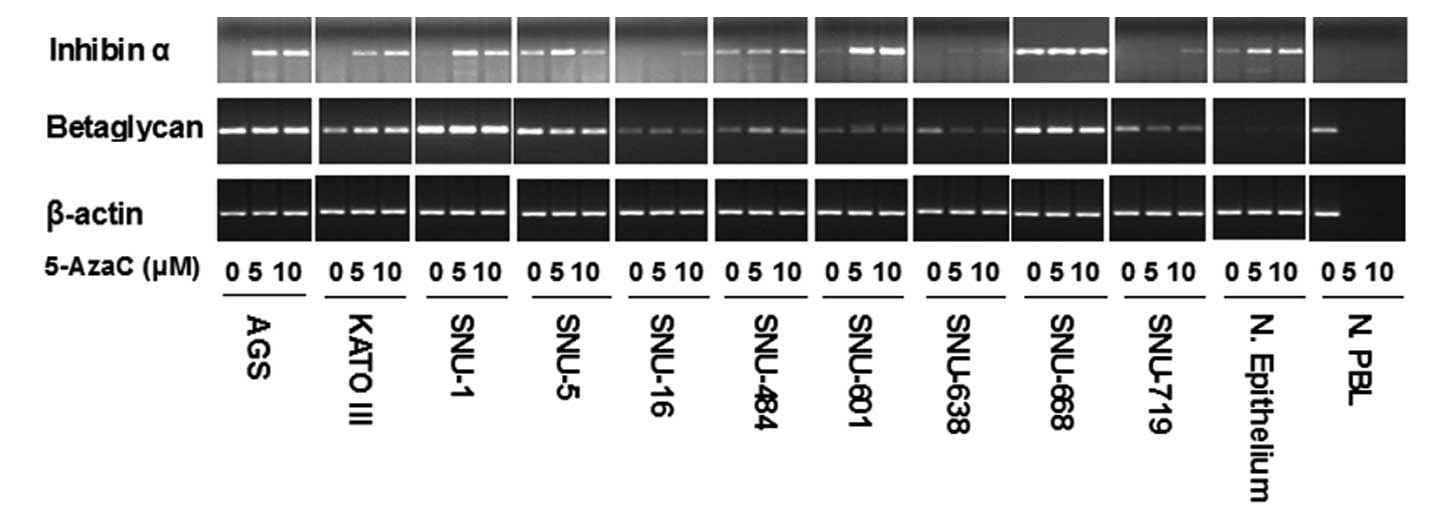
The low levels of mRNA and protein of
inhibin-α in human gastric cancer cell lines
To determine how the observed differences in
promoter DNA methylation or LOH might relate to differences in
inhibin-α gene expression among cell lines, we measured inhibin-α
mRNA levels by PCR, and observed low or undetectable levels of mRNA
in all gastric cancer cell lines except in SNU-668. In most lines,
the low level of mRNA was increased following 5-AzaC treatment
(Fig. 3). Recently, inhibin-α was
shown to act through a betaglycan signaling system (28). When we measured the level of mRNA
of beta-glycan, it was not closely associated with the mRNA level
of inhibin-α. Moreover, mRNA level of betaglycan was not changed
with 5-AzaC treatment in contrast to inhibin-α (Fig. 3).
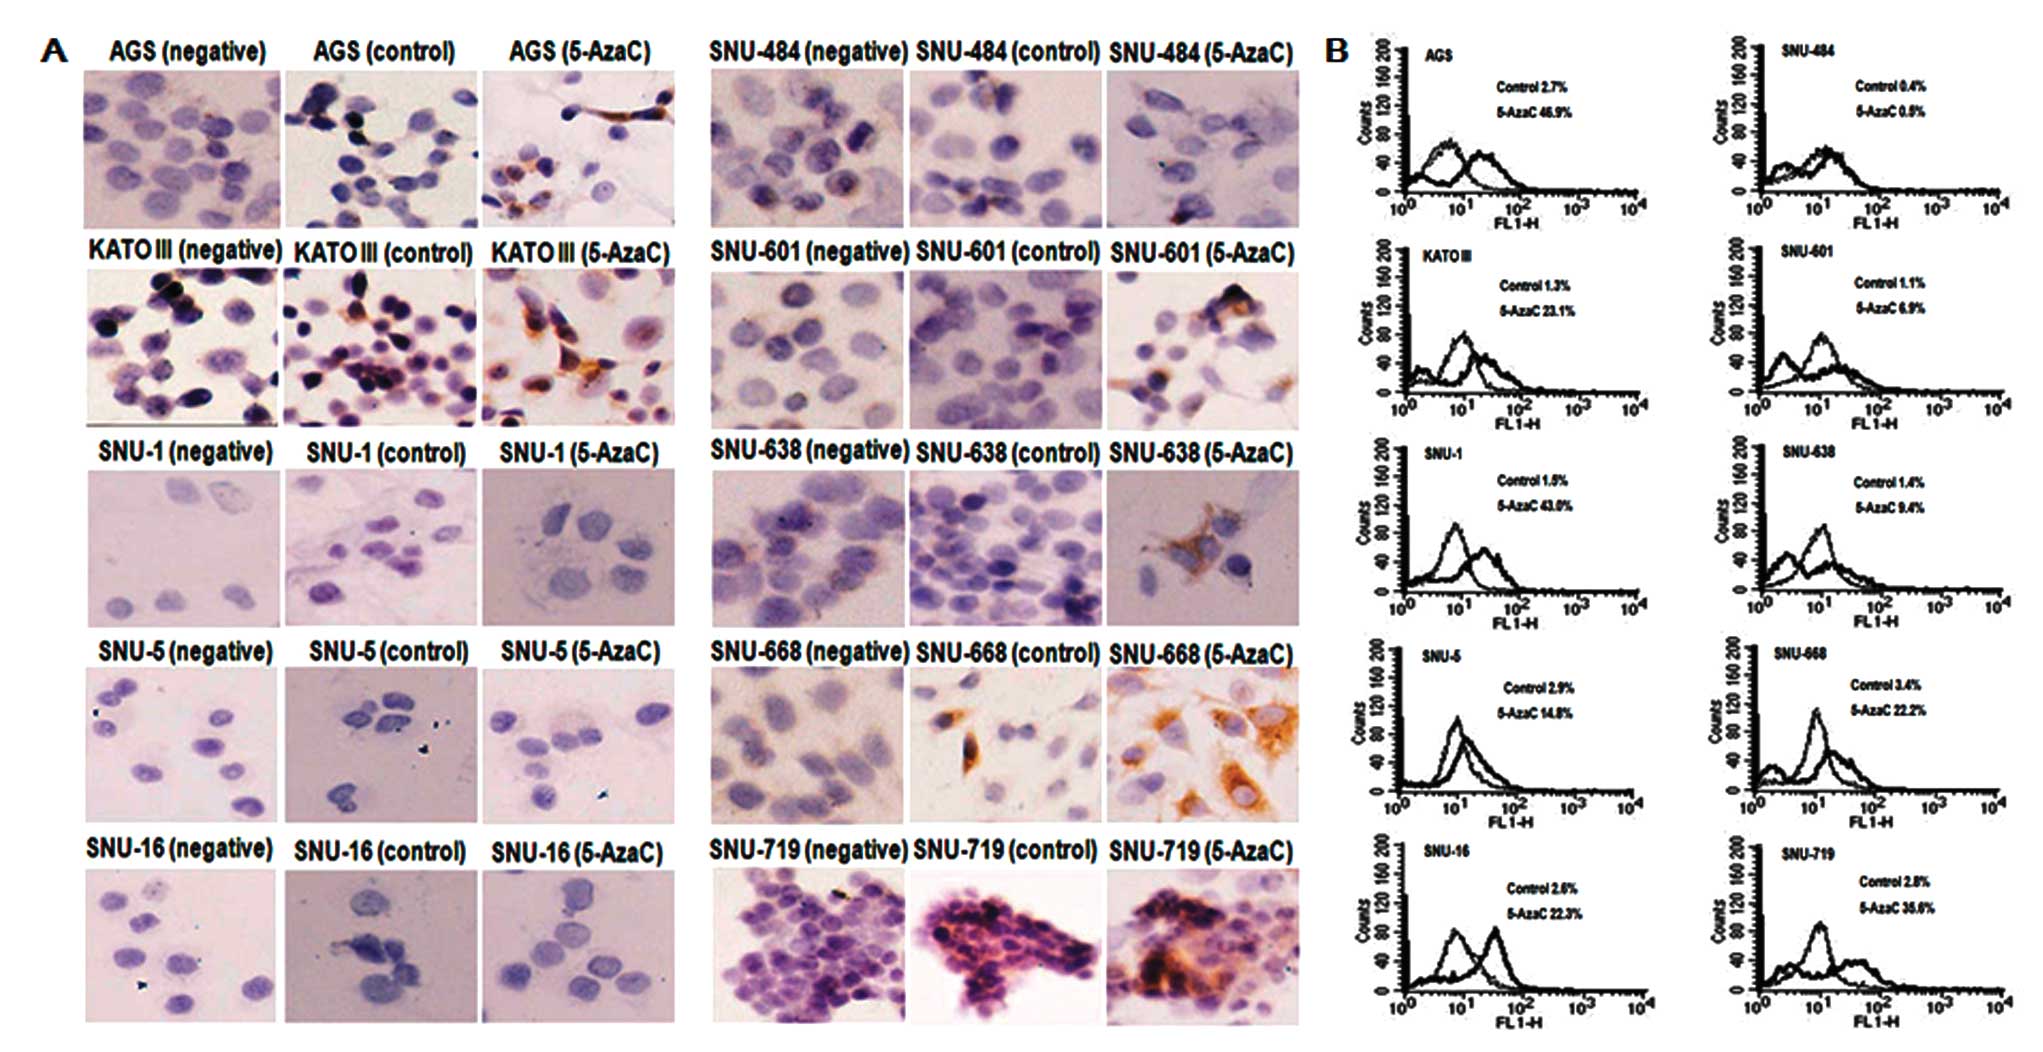
The low level of mRNA of inhibin-α in most cell
lines is expected to result in low levels of inhibin-α protein.
When we measured the inhibin-α protein by IHC using a monoclonal
inhibin-α antibody, faint signals which meant very low level of
inhibin-α was observed in all human gastric cell lines. The low
level of inhibin-α could be increased with 5-AzaC treatment at
detectable levels in AGS, SNU-601, SNU-638, SNU-668 and SNU-719
(monolayer cell lines) and KATO III (suspension cell line). Other
suspension cell line such as SNU-1, SNU-5 and SNU-16 were not
immunostained both on collagen-coated slide and poly-D-lysine
coated slide, resulting in no signals (Fig. 4A). The protein profile was
reinvestigated using flow cytometry. When we measured inhibin-α at
5 days after 5-AzaC treatment, the levels of inhibin-α protein were
increased between 1.25 and 28.67-fold compared with control among
the various cell lines (Table II).
Fluorescence intensities after 5-AzaC treatment were particularly
higher in AGS, KATO III, SNU-1, SNU-16, SNU-668 and SNU-719
compared to control (Fig. 4B).
 | Table IISummary. |
Table II
Summary.
| | | Chromosome
| mRNA expression
| Protein expression
(flow cytometry)
| Apoptosis
| G0/G1
|
|---|
| Cell lines | Methylation
status | Mutation in 5′
UTR | 2q32-33 | 2q33-36 | Control | 5-AzaC (fold) | Control | 5-AzaC (fold) | Control | 5-AzaC (fold) | Control (%) | 5-AzaC (%)
(fold) |
|---|
| AGS | | Wild | NI | LOH | 0.10 | 0.69 (6.90) | 2.7 | 46.9 (17.37) | 7.1 | 17.3 (2.44) | 33.9 | 11.8 (0.34) |
| KATO III | | Wild | NI | LOH | 0.30 | 0.74 (2.47) | 1.3 | 23.1 (17.77) | 2.6 | 10.3 (3.96) | 40.5 | 18.4 (0.45) |
| SNU-1 | Hyper | M (hetero) | NI | AI | 0.45 | 0.90 (2.00) | 1.5 | 43.0 (28.67) | 9.6 | 45.3 (4.72) | 57.4 | 39.0 (0.68) |
| SNU-5 | Hyper | M (hetero) | LOH | AI | 0.76 | 0.81 (1.07) | 2.9 | 14.8 (5.10) | 2.2 | 34.6 (15.73) | 59.2 | 30.3 (0.51) |
| SNU-16 | Un | Wild | AI | AI | 0.03 | 0.36 (12.00) | 2.6 | 22.3 (8.58) | 3.1 | 26.8 (8.65) | 41.3 | 20.6 (0.50) |
| SNU 484 | Hyper | M (homo) | LOH | LOH | 0.56 | 0.66 (1.18) | 0.4 | 0.50 (1.25) | 18.4 | 28.0 (1.52) | 43.1 | 32.5 (0.75) |
| SNU-601 | Un | Wild | AI | AI | 0.06 | 0.61 (10.17) | 1.1 | 6.90 (6.27) | 4.6 | 33.7 (7.33) | 45.4 | 22.0 (0.48) |
| SNU-638 | Un | Wild | NI | AI | 0.11 | 0.24 (2.18) | 1.4 | 9.40 (6.71) | 4.2 | 32.3 (7.69) | 51.1 | 33.8 (0.66) |
| SNU-668 | Un | Wild | NI | LOH | 0.99 | 1.03 (1.04) | 3.4 | 22.2 (6.56) | 4.0 | 14.8 (3.70) | 56.8 | 36.0 (0.63) |
| SNU-719 | | Wild | AI | AI | 0.04 | 0.14 (3.50) | 2.8 | 35.6 (12.71) | 5.0 | 22.2 (4.44) | 62.5 | 41.1 (0.66) |
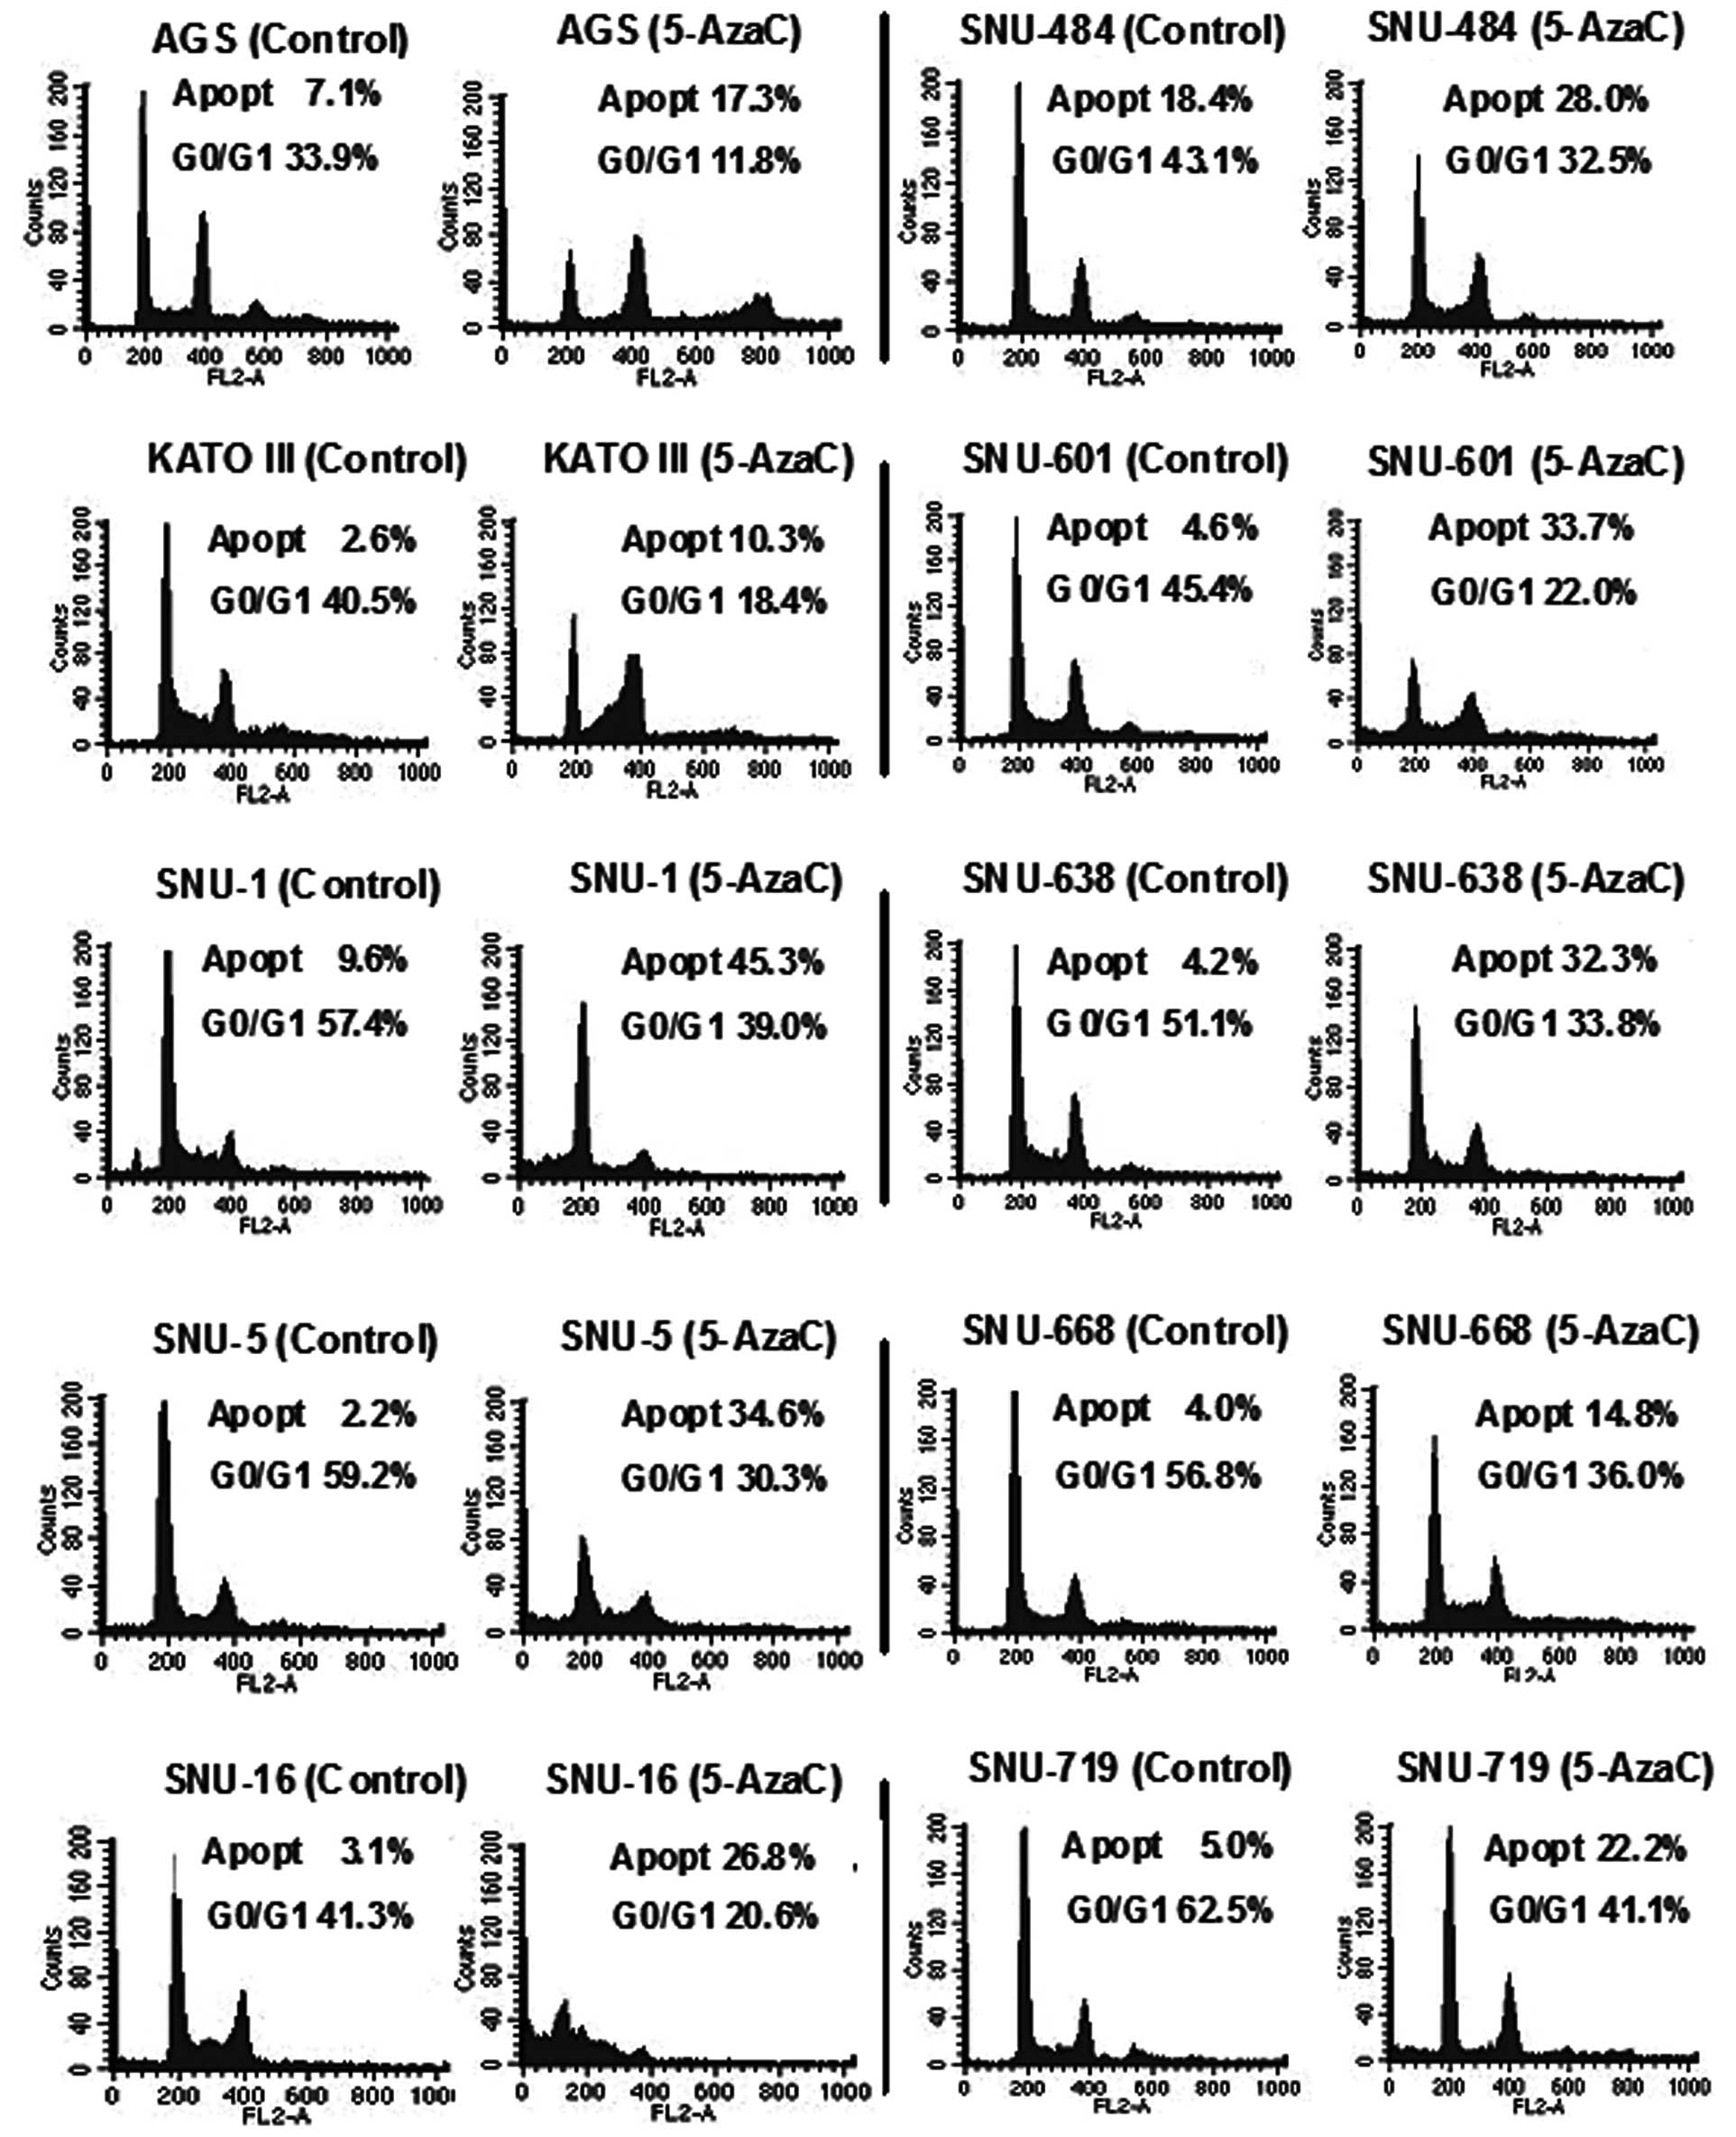
Cell growth suppression and apoptosis
induced by 5-AzaC
Low levels of inhibin-α were expected in cells
undergoing rapid division since inhibin-α is known as a tumor
suppressor. Reactivation of the inhibin-α gene was observed after
5-AzaC treatment, so we sought to determine if this altered the
growth characteristics of the cells. When we measured cell
viability after 5-AzaC treatment (5 μM) it was decreased
between 47.6% in SNU-5 and 35.6% in SNU-638 (Table I). When we measured the doubling
time after 5-AzaC treatment it was increased 1.24 (SNU-484) to
2.56-fold (SNU-16) (Table I).
Related to the low cell viability, apoptosis was also investigated.
When we analyzed cancer cells using flow cytometry, apoptosis was
increased 1.52 to 15.73-fold in human gastric cancer cells after
5-AzaC treatment. In addition, the G0/G1 phase was decreased from
0.34 (AGS) to 0.75-fold (SNU-484) (Fig. 5, Table
II).
| Table IEffects of 5-AzaC on growth
suppression. |
Table I
Effects of 5-AzaC on growth
suppression.
| Viability (%)
5-AzaC
| Doubling time (h)
5-AzaC
| Growth suppression
(fold) |
|---|
| Gastric cancer cell
lines | 0 μM | 5 μM | 10 μM | 0 μM | 5 μM | |
|---|
| AGS | 100 | 34.4 | 33.9 | 20 | 50 | 2.50 |
| KATO III | 100 | 39.4 | 38.9 | 36 | 68 | 1.89 |
| SNU-1 | 100 | 41.0 | 30.7 | 26 | 57 | 2.19 |
| SNU-5 | 100 | 47.6 | 22.2 | 34 | 55 | 1.62 |
| SNU-16 | 100 | 45.5 | 25.4 | 27 | 69 | 2.56 |
| SNU-484 | 100 | 47.4 | 27.4 | 67 | 83 | 1.24 |
| SNU-601 | 100 | 37.0 | 26.0 | 47 | 84 | 1.79 |
| SNU-638 | 100 | 35.6 | 28.8 | 58 | 82 | 1.41 |
| SNU-668 | 100 | 46.1 | 32.7 | 74 | 135 | 1.82 |
| SNU-719 | 100 | 46.0 | 23.3 | 184 | 412 | 2.24 |
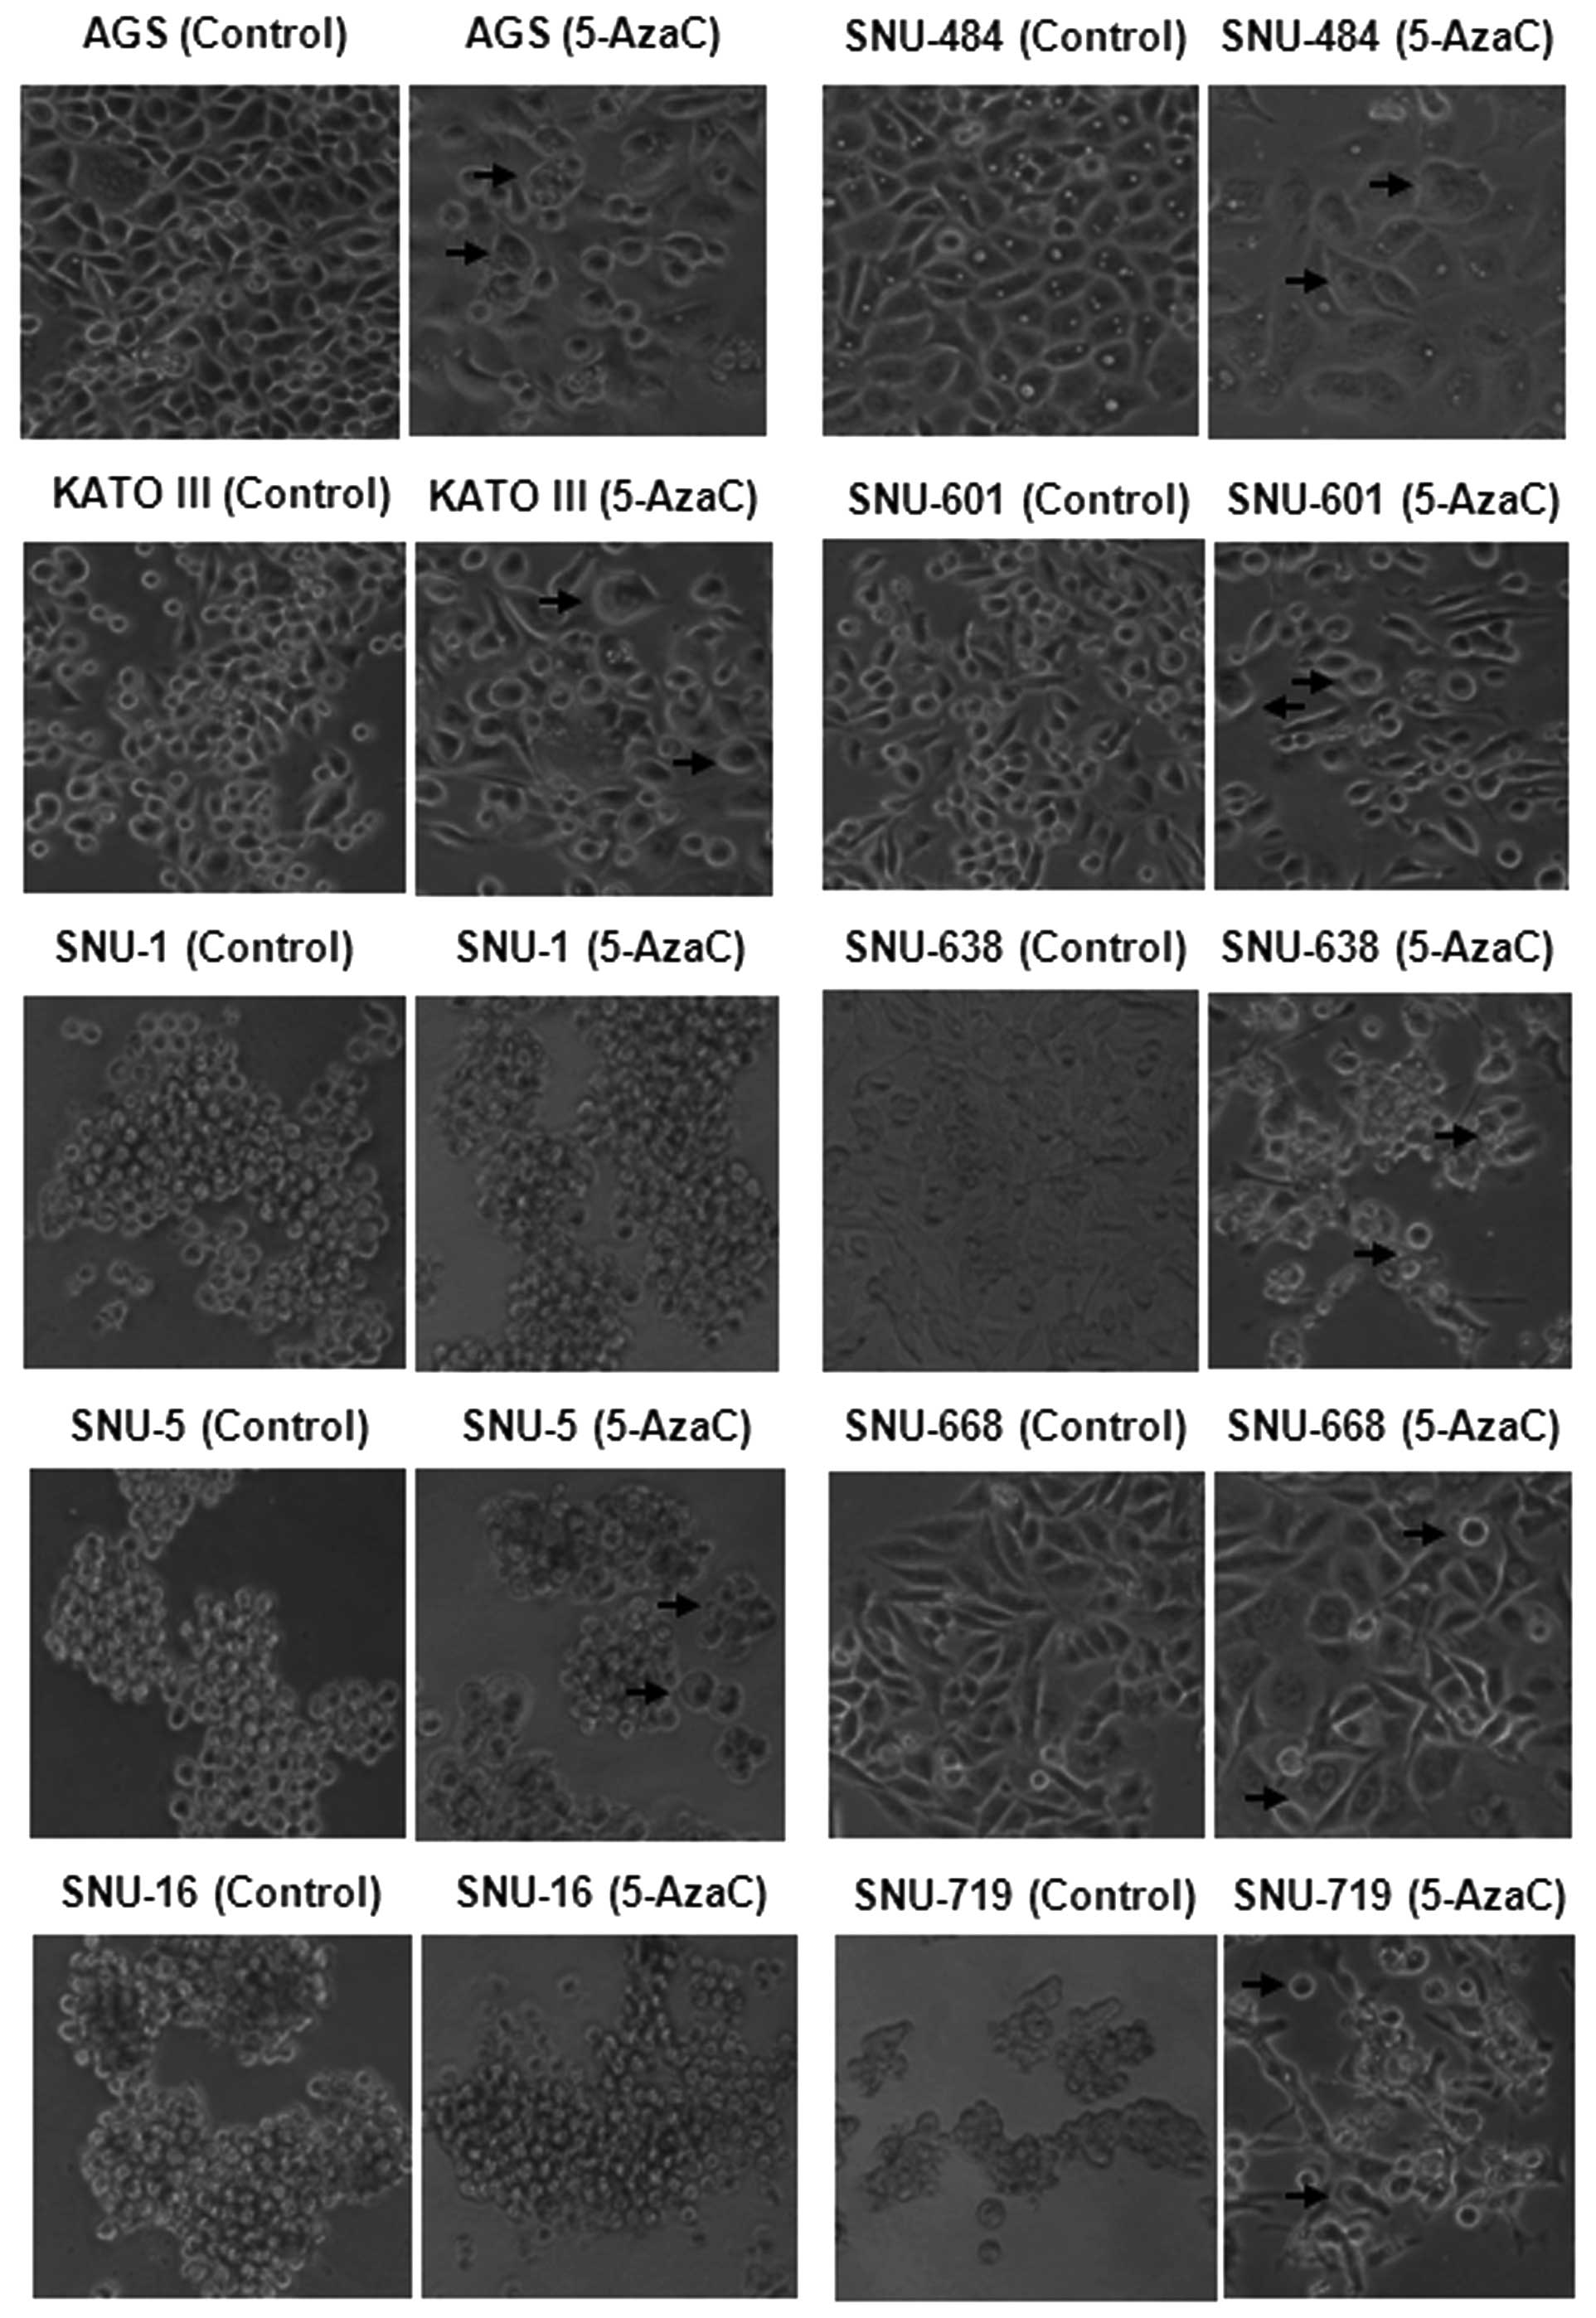
When the cells undergoing apoptosis and cell cycle
changes were investigated by microscopy, morphological changes were
observed in epithelial-like cells (AGS, SNU-484, SNU-601, SNU-638,
SNU-668 and SNU-719) and spherical cells (KATO III) after 5-AzaC
treatment. Minor morphological changes were observed in
lymphoblast-like cells (SNU-1, SNU-5 and SNU-16) (Fig. 6).
Discussion
Numerous reports link the inhibin-α gene with cancer
since it was initially identified as a tumor suppressor gene in the
gonads and adrenals by functional studies using inhibin-α deficient
mice (20–22). Roles for inhibin-α in cell growth
have been proposed in prostate, endometrium, and breast, with loss
of inhibin expression or sensitivity linked to tumor initiation and
progression and to poor patient survival (37). Although it was suggested that
inhibin-α acts as a tumor suppressor during early tumorigenesis, it
might also act as a tumor promoter during late-stage disease in
prostate cancer (24,25).
Hypermethylation, LOH, and polymorphisms of
inhibin-α were investigated in this study. Hypermethylation of the
inhibin-α gene promoter was observed in several human gastric
cancer cell lines although the degree of methylation varied
substantially among cell lines. Heavy methylation was found in
SNU-1, SNU-5 and SNU-484 whereas moderate methylation was observed
in SNU-719, AGS and KATO III. Little or no methylation was observed
in SNU-16, SNU-601, SNU-638 and SNU-668. Demethylation colud be
induced by 5-AzaC in heavily or moderately methylated CpG sites in
SNU-1, SNU-5, SNU-484 and SNU-719. In these cells, all CpG sites
were influenced by 5-AzaC, but CpG5 was more strongly influenced by
5-AzaC than other sites (Fig. 1).
Previously, it was reported that the inhibin-α gene promoter was
hypermethylated in prostate cancer (23). In this report, four CpG sites
(CpG1, CpG2, CpG5 and CpG6) were unique in human whereas three CpG
sites (CpG3, CpG4 and CpG7) were conserved between species. CpG5
differed from the bovine, rat, and mouse sequence (23). Of interest is that this site that
varies among species corresponds to the site that is strongly
influenced by 5-AzaC.
LOH of the inhibin-α gene locus was also
investigated. Initially, LOH was observed in inactivation of tumor
suppressor genes (23). In this
study, LOH at 2q32-33 was observed in SNU-5 and SNU-484 whereas LOH
at 2q33-36 was observed in AGS, KATO III and SNU-484 (Fig. 2A). LOH at 2q32-36 contains the
chromosome region harboring the inhibin-α gene (38). LOH at the inhibin-α locus on
chromosome 2q was also reported in 6% granulosa cell tumors
(35) and in 42% of prostate
carcinomas (23).
Mutation of the inhibin-α gene was investigated.
Mutation at −16 bp site of the 5′-UTR was observed in SNU-1 (one
allele), SNU-5 (one allele) and SNU-484 (both alleles). However,
mutation at 769 bp site within exon 2 region was not observed
(Fig. 2B–D). Although controversy
exists, mutation at −16, and 769 of the inhibin-α gene has been
related to premature ovarian failure (POF) (11,30,36).
The observed DNA changes directly influences the inhibin-α mRNA
levels. In our study, it was observed that all human gastric cancer
cell lines had at least one of the discussed DNA alterations
including methylation, allelic imbalance including LOH, and
nucleotide mutation, and these lines all exhibit low inhibin-α
expression.
It was reported that levels of mRNA and protein of
tumor suppressor gene were very low in cancer cells (24,39).
In this study, low level of inhibin-α gene transcript existed in
human gastric cancer cell lines except SNU-668 (Fig. 3). Parallel with this, low level of
inhibin-α protein was observed in most of cell lines (Fig. 4A and B). Consistent with this, it
was reported that malignant tissues lacked inhibin-α gene
transcripts and protein whereas non-malignant regions of human
primary prostate carcinomas expressed inhibin-α (24). These low levels of mRNA and protein
inhibin-α could be increased to some degree with 5-AzaC treatment,
consistent with the view that hypermethylation contributes to
suppression of inhibin-α expression. These low levels of mRNA and
protein of inhibin-α seemed to be correlated with the cancer state,
whereas there was no such correlation to betaglycan mRNA levels.
The levels of betaglycan mRNA were not changed after treatment of
5-AzaC (Fig. 3).
5-AzaC treatment enhanced apoptosis 1.52 to
15.73-fold compared to the controls (Fig. 5, Table
II) and 5-AzaC suppressed cell growth by increasing the
doubling time 1.24 to 2.56-fold (Table
I). Morphology of the cells was changed after 5-AzaC treatment
as presented in Fig. 6. The cell
can be influenced by inhibin-α induced by 5-AzaC or 5-AzaC itself.
It was reported that inhibin-α influences cell proliferation, cell
growth, and metastasis (25,40,41).
In normal cells, it was reported that inhibin A increased apoptosis
in early ovarian antral follicles (40). It was also reported that
overexpressed inhibin-α (1–32 amino acid) fragment inhibited bovine
granulose cell (GC) proliferation and induced apoptosis in GC
(42). Inhibin-α decreased the
proliferation of ovarian cancer cell lines such as SKOV3, OCC1,
OVCAR3 and A2780-s (41).
Inhibin-α reduced tumor growth in LNCaP which is androgen-dependent
prostate cancer (PCa) whereas inhibin-α increased tumor growth and
metastasis in PC3 which is androgen-independent PCa (25). Importantly, targeted disruption of
the inhibin-α gene resulted in an ovarian phenotype of granulosa
cell tumors (20,43). Combined with our results and
previous reports (20,43), it is evident that inhibin-α must be
maintained at low levels in many cancerous cell types. These
results suggest that inhibin-α has a critical function at the
cellular level. 5-AzaC itself is known to have a cytotoxic effect.
However, it was reported that this occurs through DNA
methyltransferase (Dnmt) 3a, Dnmt3b (44) and caspase-8 (45). Moreover, it was reported that
5-AzaC altered the expression of several proteins involved in cell
cycle regulation, apoptosis, and survival (32,46).
In our study, it seemed that 5-AzaC influenced the cell through
inhibin-α induction as well as other known gene induction.
As to the mechanism of action of inhibin-α in the
process of carcinogenesis, there is little data and much to be
learned. Carcinogenesis is a complex process whereby malignant
transformation occurs through a sequence of events. The hallmarks
of cancer include sustaining proliferation, evading growth
suppressors, resisting cell death, enabling replicative
immortality, inducing angiogenesis, and activating invasion and
metastasis. Underlying these hallmarks are genome instability and
inflammation (47). Our result
suggested that inhibin-α acts at steps including sustaining
proliferation, evading growth suppressors, and altering cell death.
Among these steps, apoptosis has been relatively well studied. In
cancer cells, inhibin-α is maintained at low level and there is
little apoptosis to maintain cancer state. If we limit the function
of inhibin-α within apoptosis, two routes are possible. One
possibility is that inhibin-α itself reduce apoptosis. Another
possible is that inhibin-α reduce apoptosis through inhibin A. In
both cases, however, inhibin-α or inhibin A seem to act without
changeing betaglycan levels since there was no change in betaglycan
mRNA level after 5-AzaC treatment (Fig. 3).
Acknowledgements
We thank Professor Kelly E. Mayo
(Northwestern University) for helpful suggestion and discussion.
This study was supported by the Research Fund, 2010 of The Catholic
University of Korea.
References
|
1
|
Ying SY: Inhibins and activins: chemical
properties and biological activity. Proc Soc Exp Biol Med.
186:253–264. 1987. View Article : Google Scholar : PubMed/NCBI
|
|
2
|
Ying SY: Inhibins, activins, follistatins:
gonadal proteins modulating the secretion of follicle-stimulating
hormone. Endocr Rev. 9:267–293. 1988. View Article : Google Scholar : PubMed/NCBI
|
|
3
|
Robertson DM, Giacometti M, Foulds LM,
Lahnstein J, Goss NH, Hearn MTW and de Kretser DM: Isolation of
inhibin α-subunit precursor proteins from bovine follicular fluid.
Endocrinology. 125:2141–2149. 1989.
|
|
4
|
Hotten G, Neidhardt H, Schneider C and
Pohl J: Cloning of a new member of the TGF-β family: a putative new
activin βC chain. Biochem Biophys Res Commun.
206:608–613. 1995.
|
|
5
|
Oda S, Nishimatsu S, Murakami K and Ueno
N: Molecular cloning and functional analysis of a new activin β
subunit: a dorsal mesoderm-inducing activity in Xenopus.
Biochem Biophys Res Commun. 210:581–588. 1995.
|
|
6
|
Fang J, Yin W, Smiley E, Wang SQ and
Bonadio J: Molecular cloning of the mouse activin βE
subunit gene. Biochem Biophys Res Commun. 228:669–674. 1996.
|
|
7
|
de Kretser DM, Hedger MP, Loveland KL and
Phillips DJ: Inhibins, activins and follistatin in reproduction.
Hum Reprod Update. 8:529–541. 2002.PubMed/NCBI
|
|
8
|
Findlay JK, Drummond AE, Dyson ML, Baillie
AJ, Robertson DM and Ethier JF: Recruitment and development of the
follicle; the roles of the transforming growth factor-β
superfamily. Mol Cell Endocrinol. 191:35–43. 2002.
|
|
9
|
Juengel JL and McNatty KP: The role of
proteins of the transforming growth factor-β superfamily in the
intraovarian regulation of follicular development. Hum Reprod
Update. 11:144–161. 2005.
|
|
10
|
Knight PG and Glister C: TGF-β superfamily
members and ovarian follicle development. Reproduction.
132:191–206. 2006.
|
|
11
|
Chand AL, Ooi GT, Harrison CA, Shelling AN
and Robertson DM: Functional analysis of the human inhibin α
subunit variant A257T and its potential role in premature ovarian
failure. Hum Reprod. 22:3241–3248. 2007.
|
|
12
|
Welt CK, Taylor AE, Fox J, Messerlian GM,
Adams JM and Schneyer AL: Follicular arrest in polycystic ovary
syndrome is associated with deficient inhibin A and B biosynthesis.
J Clin Endocrinol Metab. 90:5582–5587. 2005. View Article : Google Scholar : PubMed/NCBI
|
|
13
|
Hamar BD, Buhimschi IA, Sfakianaki AK,
Pettker CM, Magloire LK, Funai EF, Copel JA and Buhimschi CS: Serum
and urine inhibin A but not free activin A are endocrine biomarkers
of severe pre-eclampsia. Am J Obstet Gynecol. 195:1636–1645. 2006.
View Article : Google Scholar : PubMed/NCBI
|
|
14
|
Tsigkou A, Marrelli D, Reis FM, et al:
Total inhibin is a potential serum marker for epithelial ovarian
cancer. J Clin Endocrinol Metab. 92:2526–2531. 2007. View Article : Google Scholar : PubMed/NCBI
|
|
15
|
Tsigkou A, Luisi S, Reis FM and Petraglia
F: Inhibins as diagnostic markers in human reproduction. Adv Clin
Chem. 45:1–29. 2008. View Article : Google Scholar : PubMed/NCBI
|
|
16
|
Cho BN, McMullen ML, Pei L, Yates CJ and
Mayo KE: Reproductive deficiencies in transgenic mice expressing
the rat inhibin α-subunit gene. Endocrinology. 142:4994–5004.
2001.PubMed/NCBI
|
|
17
|
Ahn JM, Jung HK, Cho C, Choi D, Mayo KE
and Cho BN: Changes in the reproductive functions of mice due to
injection of a plasmid expressing an inhibin α-subunit into muscle:
a transient transgenic model. Mol Cell. 18:79–86. 2004.PubMed/NCBI
|
|
18
|
Luisi S, Florio P, Reis FM and Petraglia
F: Inhibins in female and male reproductive physiology: role in
gametogenesis, conception, implantation and early pregnancy. Hum
Reprod Update. 11:123–135. 2005. View Article : Google Scholar : PubMed/NCBI
|
|
19
|
Risbridger GP, Schmitt JF and Robertson
DM: Activins and inhibins in endocrine and other tumors. Endocr
Rev. 22:836–858. 2001. View Article : Google Scholar : PubMed/NCBI
|
|
20
|
Matzuk MM, Finegold MJ, Su JG, Hsueh AJ
and Bradley A: α-inhibin is a tumour-suppressor gene with gonadal
specificity in mice. Nature. 360:313–319. 1992.
|
|
21
|
Matzuk MM and Bradley A: Identification
and analysis of tumor suppressor genes using transgenic mouse
models. Semin Cancer Biol. 5:37–45. 1994.PubMed/NCBI
|
|
22
|
Matzuk MM, Finegold MJ, Mather JP, Krummen
L, Lu H and Bradley A: Development of cancer cachexia-like syndrome
and adrenal tumors in inhibin-deficient mice. Proc Natl Acad Sci
USA. 91:8817–8821. 1994. View Article : Google Scholar : PubMed/NCBI
|
|
23
|
Schmitt JF, Millar DS, Pedersen JS, et al:
Hypermethylation of the inhibin α-subunit gene in prostate
carcinoma. Mol Endocrinol. 16:213–220. 2002.
|
|
24
|
Balanathan P, Ball EMA, Wang H, Harris SE,
Shelling AN and Risbridger GP: Epigenetic regulation of inhibin
α-subunit gene in prostate cancer cell lines. J Mol Endocrinol.
32:55–67. 2004.
|
|
25
|
Balanathan P, Williams ED, Wang H, et al:
Elevated level of inhibin-α subunit is pro-tumourigenic and
pro-metastatic and associated with extracapsular spread in advanced
prostate cancer. Br J Cancer. 100:1784–1793. 2009.
|
|
26
|
Imai K, Khandoker MAM, Yonai M, et al:
Matrix metalloproteinases-2 and -9 activities in bovine follicular
fluid of different-sized follicles: relationship to
intra-follicular inhibin and steroid concentrations. Domest Anim
Endocrinol. 24:171–183. 2003. View Article : Google Scholar
|
|
27
|
Jones RL, Findlay JK, Farnworth PG,
Robertson DM, Wallace E and Salamonsen LA: Activin A and inhibin A
differentially regulate human uterine matrix metalloproteinases:
potential interactions during decidualization and trophoblast
invasion. Endocrinology. 147:724–732. 2006. View Article : Google Scholar
|
|
28
|
Hempel N, How T, Dong M, Murphy SK, Fields
TA and Blobe GC: Loss of betaglycan expression in ovarian cancer:
role in motility and invasion. Cancer Res. 67:5231–5238. 2007.
View Article : Google Scholar : PubMed/NCBI
|
|
29
|
Clark SJ, Harrison J, Paul CL and Frommer
M: High sensitivity mapping of methylated cytosines. Nucleic Acids
Res. 22:2990–2997. 1994. View Article : Google Scholar : PubMed/NCBI
|
|
30
|
Sundblad V, Chiauzzi VA, Andreone L, Campo
S, Charreau EH and Dain L: Controversial role of inhibin α-subunit
gene in the aetiology of premature ovarian failure. Hum Reprod.
21:1154–1160. 2006.
|
|
31
|
Jones PA and Baylin SB: 2002.The
fundamental role of epigenetic events in cancer. Nat Rev Genet.
3:415–428. 2002.PubMed/NCBI
|
|
32
|
Song SH, Jong HS, Choi HH, Inoue H, Tanabe
T, Kim NK and Bang YJ: Transcriptional silencing of
cyclooxygenase-2 by hyper-methylation of the 5′ CpG island in human
gastric carcinoma cells. Cancer Res. 61:4628–4635. 2001.PubMed/NCBI
|
|
33
|
Kuchler RJ: Development of animal cell
populations in vitro. Biochemical Methods in Cell Culture and
Virology. Kuchler RJ: Dowden, Hutchinson and Ross Inc. Press;
Stroudsburg, PA: pp. 90–113. 1977
|
|
34
|
Garinis GA, Patrinos GP, Spanakis NE and
Menounos PG: DNA hypermethylation: when tumour suppressor genes go
silent. Hum Genet. 111:115–127. 2002. View Article : Google Scholar : PubMed/NCBI
|
|
35
|
Watson RH, Roy WJ, Davis M, Hitchcock A
and Campbell IG: Loss of heterozygosity at the α-inhibin locus on
chromosome 2q is not a feature of human granulosa cell tumors.
Gynecol Oncol. 65:387–390. 1997.
|
|
36
|
Marozzi A, Porta C, Vegetti W, Crosignani
PG, Tibiletti MG, Dalpra L and Ginelli E: Mutation analysis of the
inhibin alpha gene in a cohort of Italian women affected by ovarian
failure. Hum Reprod. 17:1741–1745. 2002. View Article : Google Scholar : PubMed/NCBI
|
|
37
|
Stenvers KL and Findlay JK: Inhibins: from
reproductive hormones to tumor suppressors. Trends Endocrinol
Metab. 21:174–180. 2010. View Article : Google Scholar : PubMed/NCBI
|
|
38
|
Barton DE, Yang-Feng TL, Mason AJ, Seeburg
PH and Francke U: Mapping of genes for inhibin subunits α,
βA, and βB on human and mouse chromosomes and
studies of jsd mice. Genomics. 5:91–99. 1898.
|
|
39
|
Mellor SL, Richards MG, Pedersen JS,
Robertson DM and Risbridger GP: Loss of the expression and
localization of inhibin α-subunit in high grade prostate cancer. J
Clin Endocrinol Metab. 83:969–975. 1998.
|
|
40
|
Vitale AM, Gonzalez OM, Parborell F,
Irusta G, Campo S and Tesone M: Inhibin A increases apoptosis in
early ovarian antral follicles of diethylstilbestrol-treated rats.
Biol Reprod. 67:1989–1995. 2002. View Article : Google Scholar : PubMed/NCBI
|
|
41
|
Steller MD, Shaw TJ, Vanderhyden BC and
Ethier JF: Inhibin resistance is associated with aggressive
tumorigenicity of ovarian cancer cells. Mol Cancer Res. 3:50–61.
2005.PubMed/NCBI
|
|
42
|
Geng LY, Fang M, Yi JM, Jiang F,
Moeen-ud-Din M and Yang LG: Effect of overexpression of inhibin α
(1–32) fragment on bovine granulosa cell proliferation, apoptosis,
steroidogenesis, and development of co-cultured oocytes.
Theriogenology. 70:35–43. 2008.
|
|
43
|
Myers M, Middlebrook BS, Matzuk MM and
Pangas SA: Loss of inhibin alpha uncouples oocyte-granulosa cell
dynamics and disrupts postnatal folliculogenesis. Dev Biol.
334:458–467. 2009. View Article : Google Scholar : PubMed/NCBI
|
|
44
|
Oka M, Meacham AM, Hamazaki T, Rodić N,
Chang LJ and Terada N: De novo DNA methyltransferases Dnmt3a
and Dnmt3b primarily mediate the cytotoxic effect of
5-aza-2′-deoxycytidine. Oncogene. 24:3091–3099. 2005. View Article : Google Scholar
|
|
45
|
Fulda S and Debatin KM:
5-Aza-2′-deoxycytidine and IFN-γ cooperate to sensitize for
TRAIL-induced apoptosis by upregulating caspase-8. Oncogene.
25:5125–5133. 2006.
|
|
46
|
Valdez BC, Li Y, Murray D, Corn P,
Champlin RE and Andersson BS: 5-Aza-2′-deoxycytidine sensitizes
busulfan-resistant myeloid leukemia cells by regulating expression
of genes involved in cell cycle checkpoint and apoptosis. Leuk Res.
34:364–372. 2010.
|
|
47
|
Hanahan D and Weinberg RA: Hallmarks of
cancer: the next generation. Cell. 144:646–674. 2011. View Article : Google Scholar : PubMed/NCBI
|