Introduction
Angiogenesis plays a critical role in tumor
progression, invasion and metastasis (1,2).
Thus, several anti-angiogenic agents are currently approved by the
US Food and Drug Administration for use in cancer therapies that
inhibit the VEGF pathways (3).
Despite the fact that anti-angiogenic agent monotherapy has been
proven effective for certain types of cancer (e.g., recurrent
glioblastoma or ovarian cancer), it has shown only a modest target
response rate in many cases (4,5). On
the other hand, multiple clinical trials of metastatic colorectal
cancer (6–8) and non-small cell lung cancer
(9,10) have all confirmed that combination
therapy with an anti-angiogenic agent and conventional chemotherapy
or radiotherapy significantly improves outcomes in patients. The
different responses to anti-angiogenic therapy have been clarified
by two conflicting strategies using anti-angiogenic agents.
Conventionally, in anti-angiogenic therapy,
inhibition of new vessel formation or destruction of existing
vessels to reduce blood flow and starve the tumor (of its
nutrients) to death is attempted (11). However, as evidence against this
tumor starvation strategy, several preclinical studies have
recently shown that direct or indirect blockade of VEGF signaling
with pharmacological agents can transiently repair tumor vascular
abnormalities, improve tumor oxygenation and blood flow and
decrease interstitial fluid pressure (this process is referred to
as vascular normalization strategy) (12,13).
When an anti-angiogenic agent is able to starve tumor cells, it is
considered effective for monotherapy. On the other hand, when an
anti-angiogenic agent is able to normalize intratumoral blood flow,
it is considered to have an enhancive effect in combination
therapy. For example, vascular normalization increases the
sensitivity to radiotherapy owing to the reoxygenation of tumor
tissues (14), and improves drug
delivery to target sites in chemotherapy owing to the increase in
intratumoral blood flow. Thus, the mechanistic dissociation between
tumor starvation and vascular normalization following
anti-angiogenic therapy is a subject of intense debate in the field
of cancer therapy and is the focus of much ongoing experimental
research (15). The accurate
evaluation of tumor responses after anti-angiogenic therapy is
important for optimizing treatment strategy (16). However, the changes in the tumor
microenvironment after anti-angiogenic therapy have yet to be
clarified.
Recent advances in molecular imaging technologies
have enabled us to non-invasively image tumor hypoxia using
radiolabeled probes. Hypoxia imaging may reflect changes in the
tumor microenvironment after anti-angiogenic therapy. However, only
few studies by hypoxia imaging have been performed following
anti-angiogenic therapy (16,17).
Moreover, the associations between the findings of hypoxia imaging
and changes in tumor microenvironment after anti-angiogenic therapy
have yet to be clarified.
With the above background, the purpose of the
present study was twofold: i) to clarify the changes in the tumor
microenvironment at early time-points following anti-angiogenic
therapy and ii) to determine whether
18F-fluoromisonidazole (18F-FMISO) hypoxia
imaging can detect the changes in the tumor microenvironment after
anti-angiogenic therapy.
Therefore, we evaluated the changes in the tumor
microenvironment at early time-points after sorafenib treatment in
RCC xenografts by sequential histological study and
18F-FMISO autoradiography (ARG).
Materials and methods
Cell lines and tumor xenograft
models
The human clear cell RCC (A498) cell line, which is
the von Hippel-Lindau (VHL) mutant, was obtained from the European
Collection of Cell Cultures (Salisbury, UK). Cells were maintained
in RPMI-1640 medium (Invitrogen Life Technologies, Inc., Carlsbad,
CA, USA) supplemented with 10% fetal bovine serum,
penicillin-streptomycin and 0.03% glutamine and incubated in an
atmosphere of 5% CO2 and 95% air at 37°C. All
experimental protocols were approved by the Laboratory Animal Care
and Use Committee of Hokkaido University. Nine-week-old male BALB/c
athymic nude mice (Japan SLC, Inc., Hamamatsu, Japan) were used in
all experiments. A human RCC xenograft model was established using
the A498 cell line (1×10⁷ cells/0.l ml) by subcutaneous
inoculation into the right flank of mice. When the tumors grew to
12 mm in diameter, the mice were randomly assigned to two groups
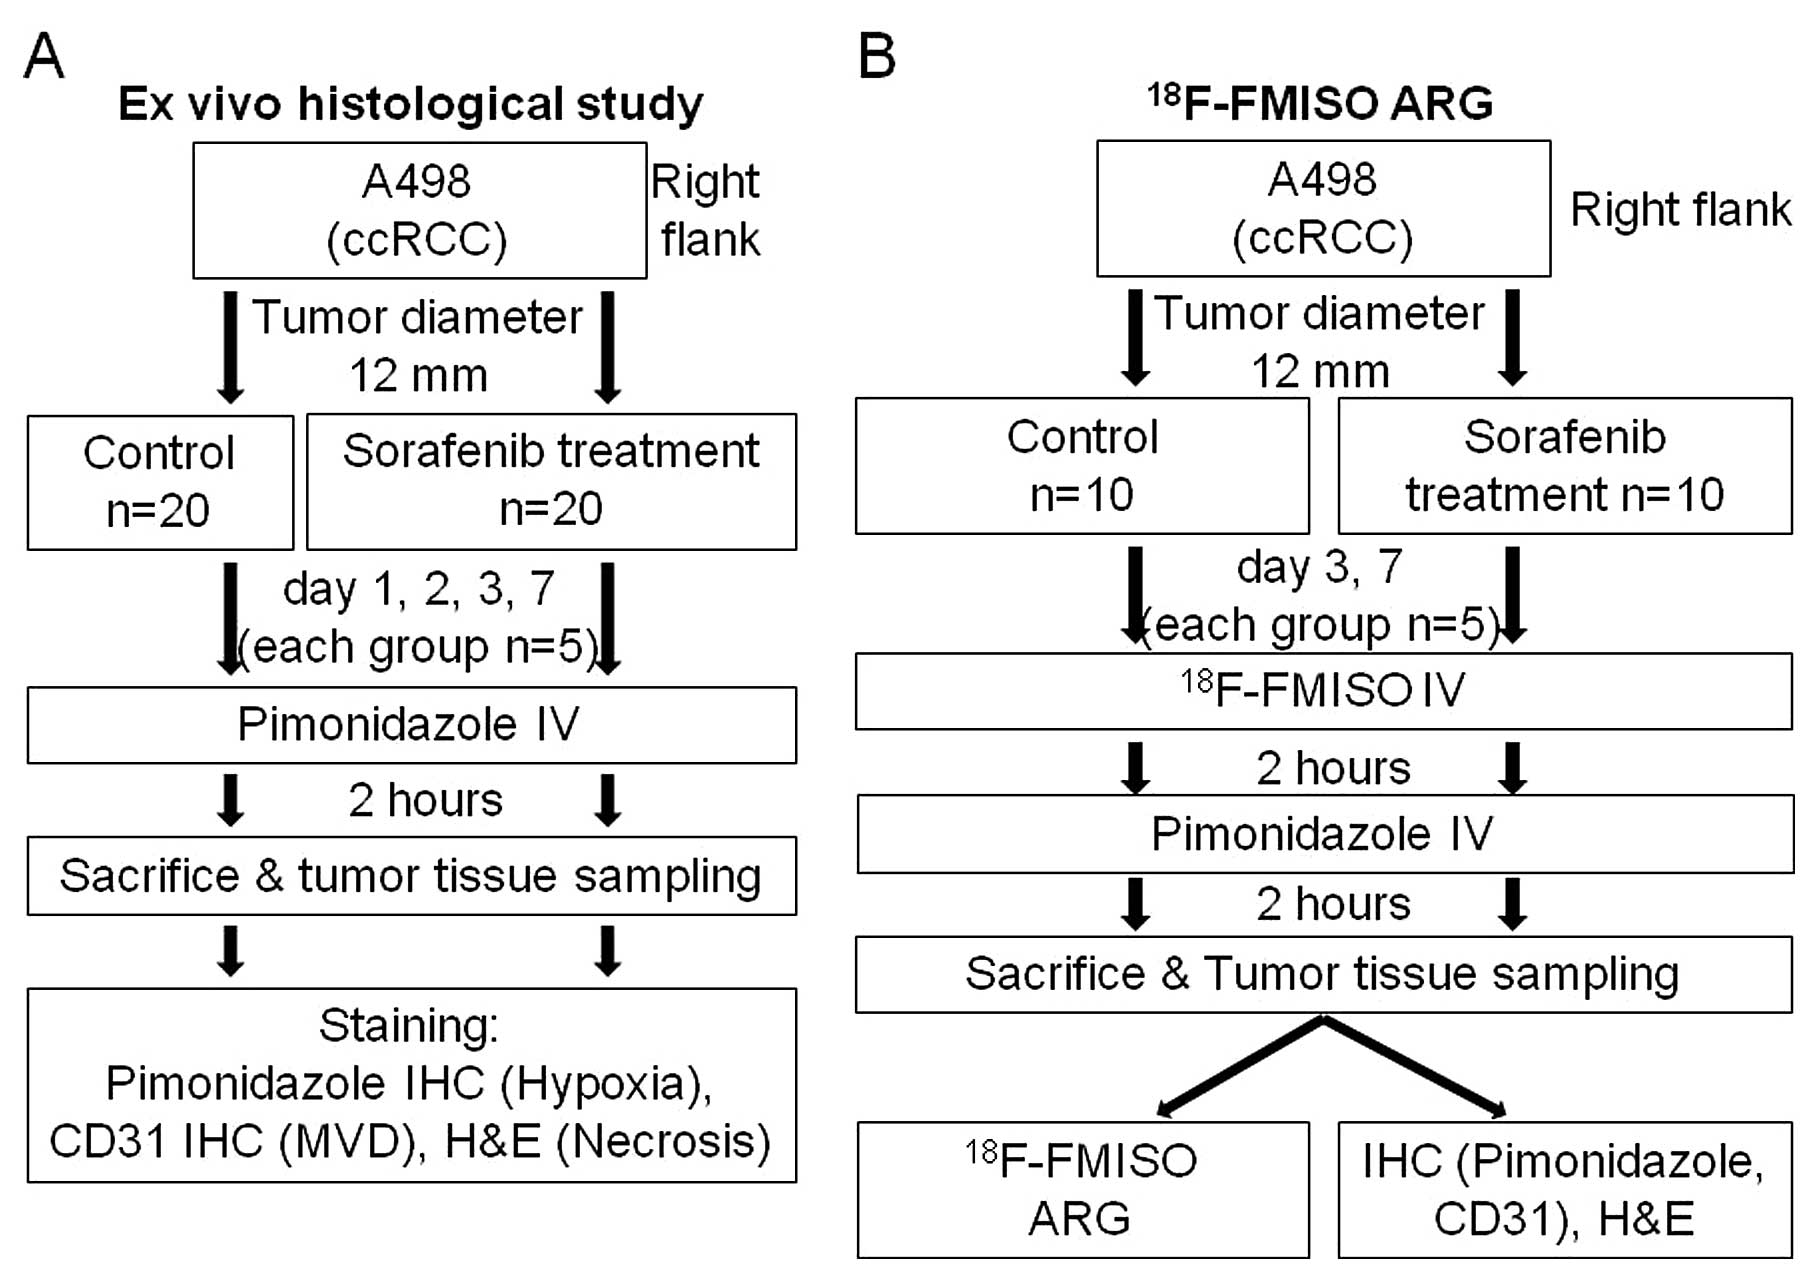
(Fig. 1) for ex vivo
histological study (n=40) and ARG study (n=20). Mice in the two
groups were further assigned to the control and sorafenib treatment
groups. Tumor growth curve was derived on Day 7 in the groups for
ex vivo histological study. Tumor size was measured using a
caliper every day prior to the treatment and tumor volume was
calculated by the following formula: π/6 x larger diameter x
(smaller diameter)2.
Treatment
Sorafenib (Nexavar; Bayer Pharmaceuticals Corp.,
West Haven, CT, USA), was used in all studies. Sorafenib (80 mg/kg)
in a cremophor EL (Sigma, St. Louis, MO, USA)/ethanol (Pharmaco
Products, Brookfield, CT, USA)/water (12.5:12.5:75) solution was
administered daily by oral gavage. The cremophor EL/ethanol/water
(12.5:12.5:75) solution was administered as the vehicle in the
control groups.
Ex vivo histological study
The mice were randomly assigned to the control
(n=20) and treatment groups (n=20) (Fig. 1): 4 time-points for each group
(Days 1, 2, 3 and 7; n=5 for each time-point). The mice were
anesthetized by diethyl ether inhalation and injected with
pimonidazole hydrochloride [Hypoxyprobe™-1, 60 mg/kg; (Hypoxyprobe,
Inc.; Burlington, MA, USA)] in the tail vein. Two hours later,
these mice were sacrificed and the tumors were excised. The excised
tumors were formalin-fixed and paraffin-embedded for subsequent
histochemical staining.
Quantitative evaluation of
histological staining
Formalin-fixed, paraffin-embedded, 4-μm
sections of the tumor were stained immunohistochemically with
pimonidazole to assess hypoxia and with CD31 to assess microvessel
density. Hematoxylin and eosin (H&E) staining was also
performed to assess necrosis. To assess hypoxia, a Hypoxyprobe-1
Omni kit (Hypoxyprobe, Inc.) was used. Briefly, after
deparaffinization and rehydration, the slides were initially
immersed in a 10-mM citrate buffer solution and heated in boiled
water for 20 min. After antigen retrieval, endogenous peroxidase
activity was blocked for 10 min in methanol containing 0.3%
hydrogen peroxide. Thereafter, sections were incubated with a
rabbit polyclonal anti-pimonidazole antibody (PAb2627AP) diluted at
1:200 for 60 min. To assess microvessels, following
deparaffinization and rehydration, the slides were initially
immersed in a target retrieval solution (pH 9.0; Dako, Glostrup,
Denmark) and heated in boiled water for 20 min. Following antigen
retrieval, endogenous peroxidase activity was blocked for 10 min in
methanol containing 0.3% hydrogen peroxide. Sections were then
incubated with a rabbit polyclonal antibody to CD31 (ab28364)
(Abcam; Cambridge, UK) diluted at 1:50 for 30 min. In
immunohistochemical staining with both antibodies, the bound
antibodies were visualized using the avidin/biotin conjugate
immunoperoxidase procedure with a Histofine SAB-PO kit (Nichirei,
Tokyo, Japan) and 3,3′-diaminobenzi-dine tetrahydrochloride. The
slides were counterstained with Mayer’s hematoxylin solution (Wako,
Osaka, Japan). To assess necrosis, H&E staining was performed.
For the quantitative analysis of hypoxia, the percentage of the
area positively stained by pimonidazole in the entire tumor cross
section was calculated as the hypoxic fraction (%
pimonidazole-positive area) using Image J. For the quantitative
analysis of microvessel density, CD31-positive intratumoral
microvessels were counted blindly under a microscope field (x400
objective magnification, 0.644 mm2 per field). More than
10 fields per section were randomly analyzed, excluding peripheral
connective tissue and central necrotic tissue. Single CD31-positive
endothelial cells without any visible lumen were not counted. The
number of CD31-positive intratumoral microvessels was expressed as
mean vessel density (MVD, vessels/field). Necrosis area was
determined from H&E-stained consecutive sections using Image
J.
18F-FMISO
autoradiography
In ARG, the mice were randomly assigned to the
control group (n=10) and the treatment group (n=10): two
time-points for each group (Days 3 and 7, n=5 for each time-point).
The mice were anesthetized by diethyl ether inhalation and injected
with 18.5 MBq of 18F-FMISO, which was synthesized as
previously described (18,19). Two hours after 18F-FMISO
injection, the mice were anesthetized by diethyl ether inhalation
again and injected with pimonidazole (60 mg/kg) in the tail vein.
Two hours after pimonidazole injection, these mice were sacrificed
and the tumors were quickly excised. Each excised tumor was then
sectioned to obtain two adjacent slices. One slice was embedded in
Tissue-Tek medium (Sakura Finetechnical Co., Ltd., Tokyo, Japan)
with the calf muscle a short distance away from the tumor slice and
frozen in isopentane/dry ice for ARG. Formalin-fixed,
paraffin-embedded specimens were prepared using the other slice for
the subsequent quantitative staining analysis. For ARG, the frozen
specimens were cut into 10-μm sections with a
CM3050-Cryostat (Leica Microsystems, Wetzlar, Germany) at 20°C. The
tumor sections were placed in a phosphor image plate cassette,
together with a set of calibrated standards (20) and an overnight ARG exposure was
performed to detect the distribution of 18F-FMISO. The
tumor sections (5 μm) were stained with H&E for use as
the reference to determine the regions of interest (ROIs) on the
obtained autoradiograms. ARG images were analyzed using a
computerized imaging analysis system (FLA 7000 Bio-Imaging
Analyzer; Fuji Photo Film Co., Ltd., Tokyo, Japan). To
quantitatively evaluate 18F-FMISO radioactivity, ROIs
were placed to cover entire tumor tissues and muscles on each ARG
image with reference to H&E-stained sections. The radioactivity
in each ROI was calculated using the activity of the standards and
converted to the percentage injected dose per kilogram body weight
per square meter of tissue (% ID/m2 × kg body weight)
(21,22).
Statistical analysis
All statistical analyses were carried out using
StatView version 5.0 (SAS Institute, Inc.). All values are
expressed as mean ± SD. One-factor repeated measures ANOVA was used
to assess the significance of differences in trends of tumor volume
between the control and treatment groups. In the evaluation of
staining and 18F-FMISO ARG, the Mann-Whitney U test was
used to assess the significance of differences between the control
and treatment groups at each time-point. A p<0.05 was considered
to indicate statistically significant differences.
Results
Ex vivo histological study
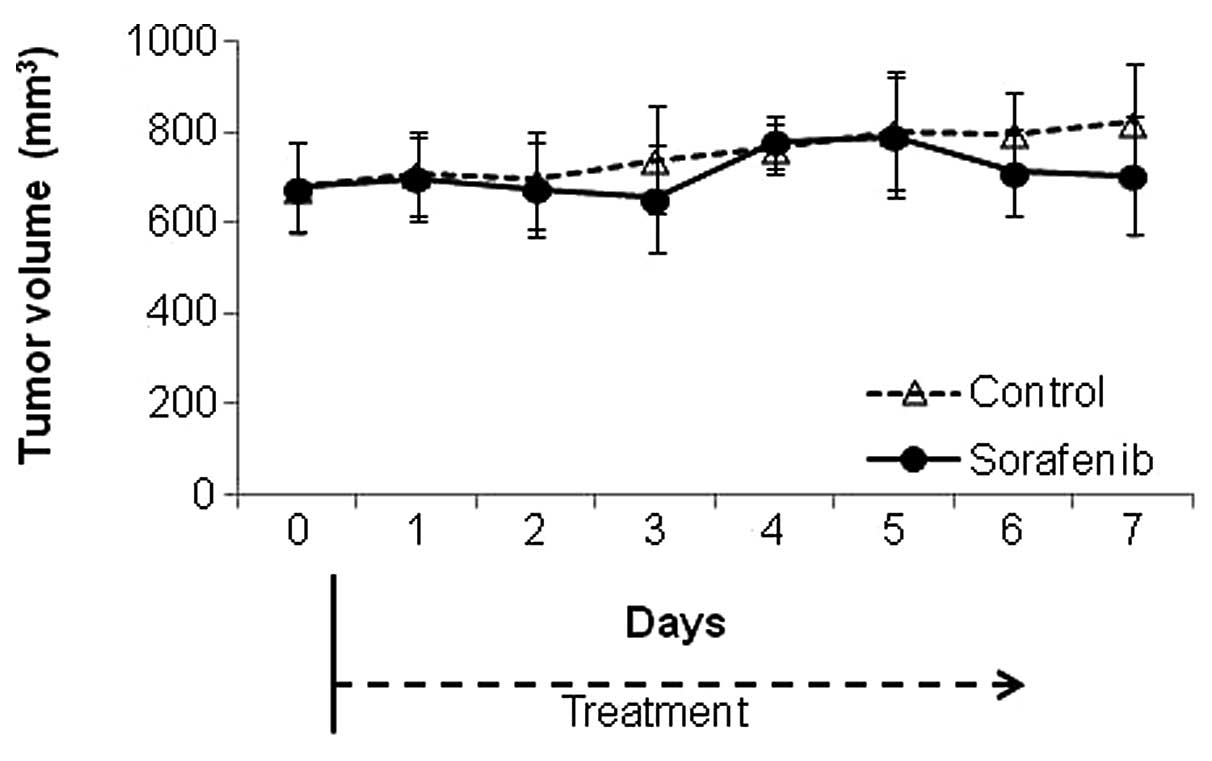
Tumor volume change
The tumor growth curve is shown in Fig. 2. There was no significant
difference in tumor volume between the control and
sorafenib-treated groups during the study period until Day 7
(p=0.24).
Quantitative evaluation of
histological staining
Fig. 3 shows
representative images and the quantitative evaluation of hypoxia in
tumor tissues on Days 1, 2, 3 and 7 after the treatment with the
vehicle or sorafenib. In the sorafenib-treated groups, apparent
pimonidazole-positive hypoxic areas were visually observed at
various time-points (Fig. 3A). In
the control group, even in tumors that were sufficiently large,
only few hypoxic regions were detectable at any time-point
(Fig. 3A). The hypoxic fractions
(% pimonidazole-positive cells) were significantly increased by
5.4-, 4.2-and 4.7-fold on Days 2, 3 and 7 after treatment with
sorafenib, respectively, compared with the control group (Fig. 3A). The hypoxic fractions in tumors
were 4.9±2.5 and 12.0±7.5 (%) on Day 1 (p= 0.17), 2.1±1.2 and
11.3±4.0 (%) on Day 2 (p<0.01), 2.6±1.9 and 10.8±2.3 (%) on Day
3 (p<0.01) and 1.8±1.5 and 8.4±3.2 (%) on Day 7 (p<0.05) in
the control and sorafenib-treated groups, respectively (Fig. 3B).
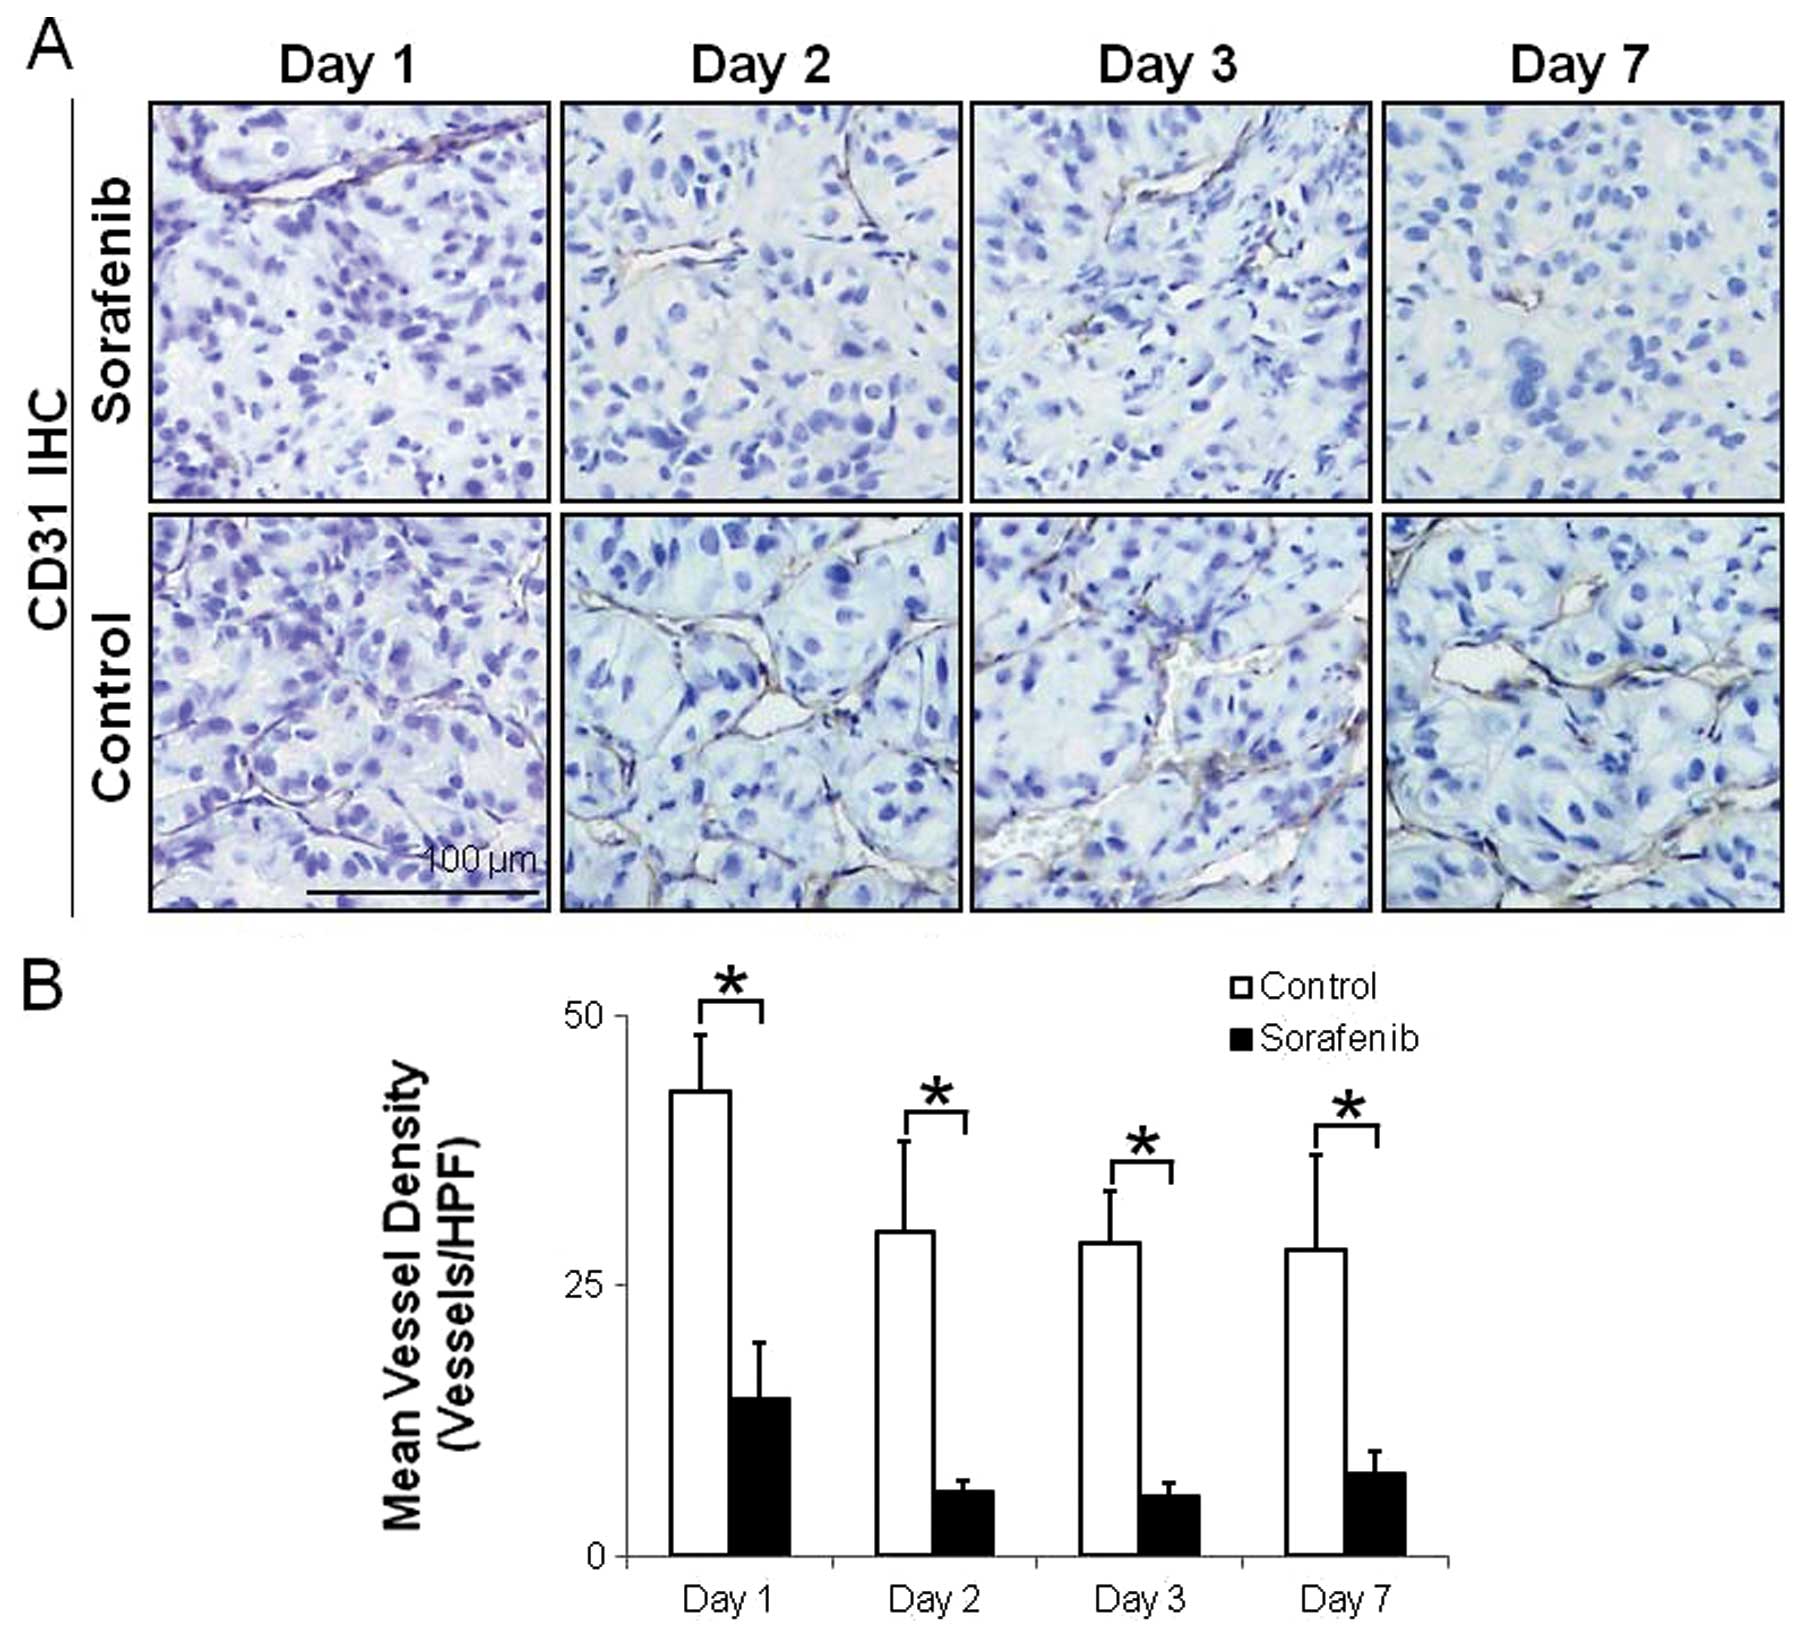
Fig. 4 shows
representative images and the quantitative evaluation of
microvessels. The number of CD31-positive intratumoral microvessels
was markedly high in the control group (Fig. 4A). The MVDs significantly decreased
by 66, 80, 81 and 73% on Days 1, 2, 3 and 7 after treatment with
sorafenib, respectively, compared with the control group (Fig. 4A). The MVDs in tumors were 43.0±5.3
(vessels/HPF) and 14.5±5.4 (vessels/HPF) on Day 1 (p<0.01),
30.0±8.3 (vessels/HPF) and 5.9±1.0 (vessels/HPF) on Day 2
(p<0.01), 29.0±4.8 (vessels/HPF) and 5.5±1.2 (vessels/HPF) on
Day 3 (p<0.01) and 28.2±8.9 (vessels/HPF) and 7.5±2.1
(vessels/HPF) on Day 7 (p<0.05) in the control and
sorafenib-treated groups, respectively (Fig. 4B).
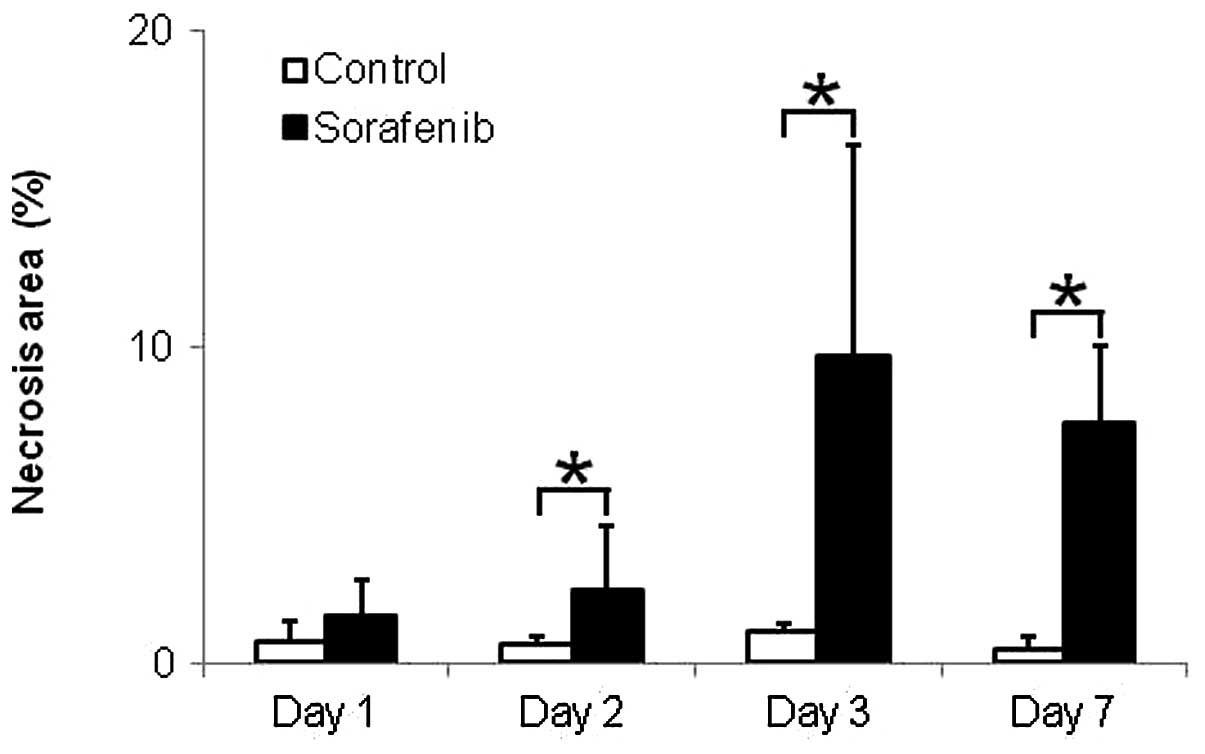
Fig. 5 shows the
quantitative evaluation of necrosis in tumor tissues. The necrosis
areas were significantly increased by 3.8-, 9.7- and 15.2-fold on
Days 2, 3 and 7 after treatment with sorafenib, respectively,
compared with those in the control group (Fig. 5). The necrosis areas in tumors were
0.7±0.6 (%) and 1.5±1.2 (%) on Day 1 (p<0.60), 0.6±0.2 (%) and
2.3±2.0 (%) on Day 2 (p<0.05), 1.0±0.3 (%) and 9.7±6.7 (%) on
Day 3 (p<0.01) and 0.5±0.4 (%) and 7.6±2.5 (%) on Day 7
(p<0.05) in the control and sorafenib-treated groups,
respectively (Fig. 5).
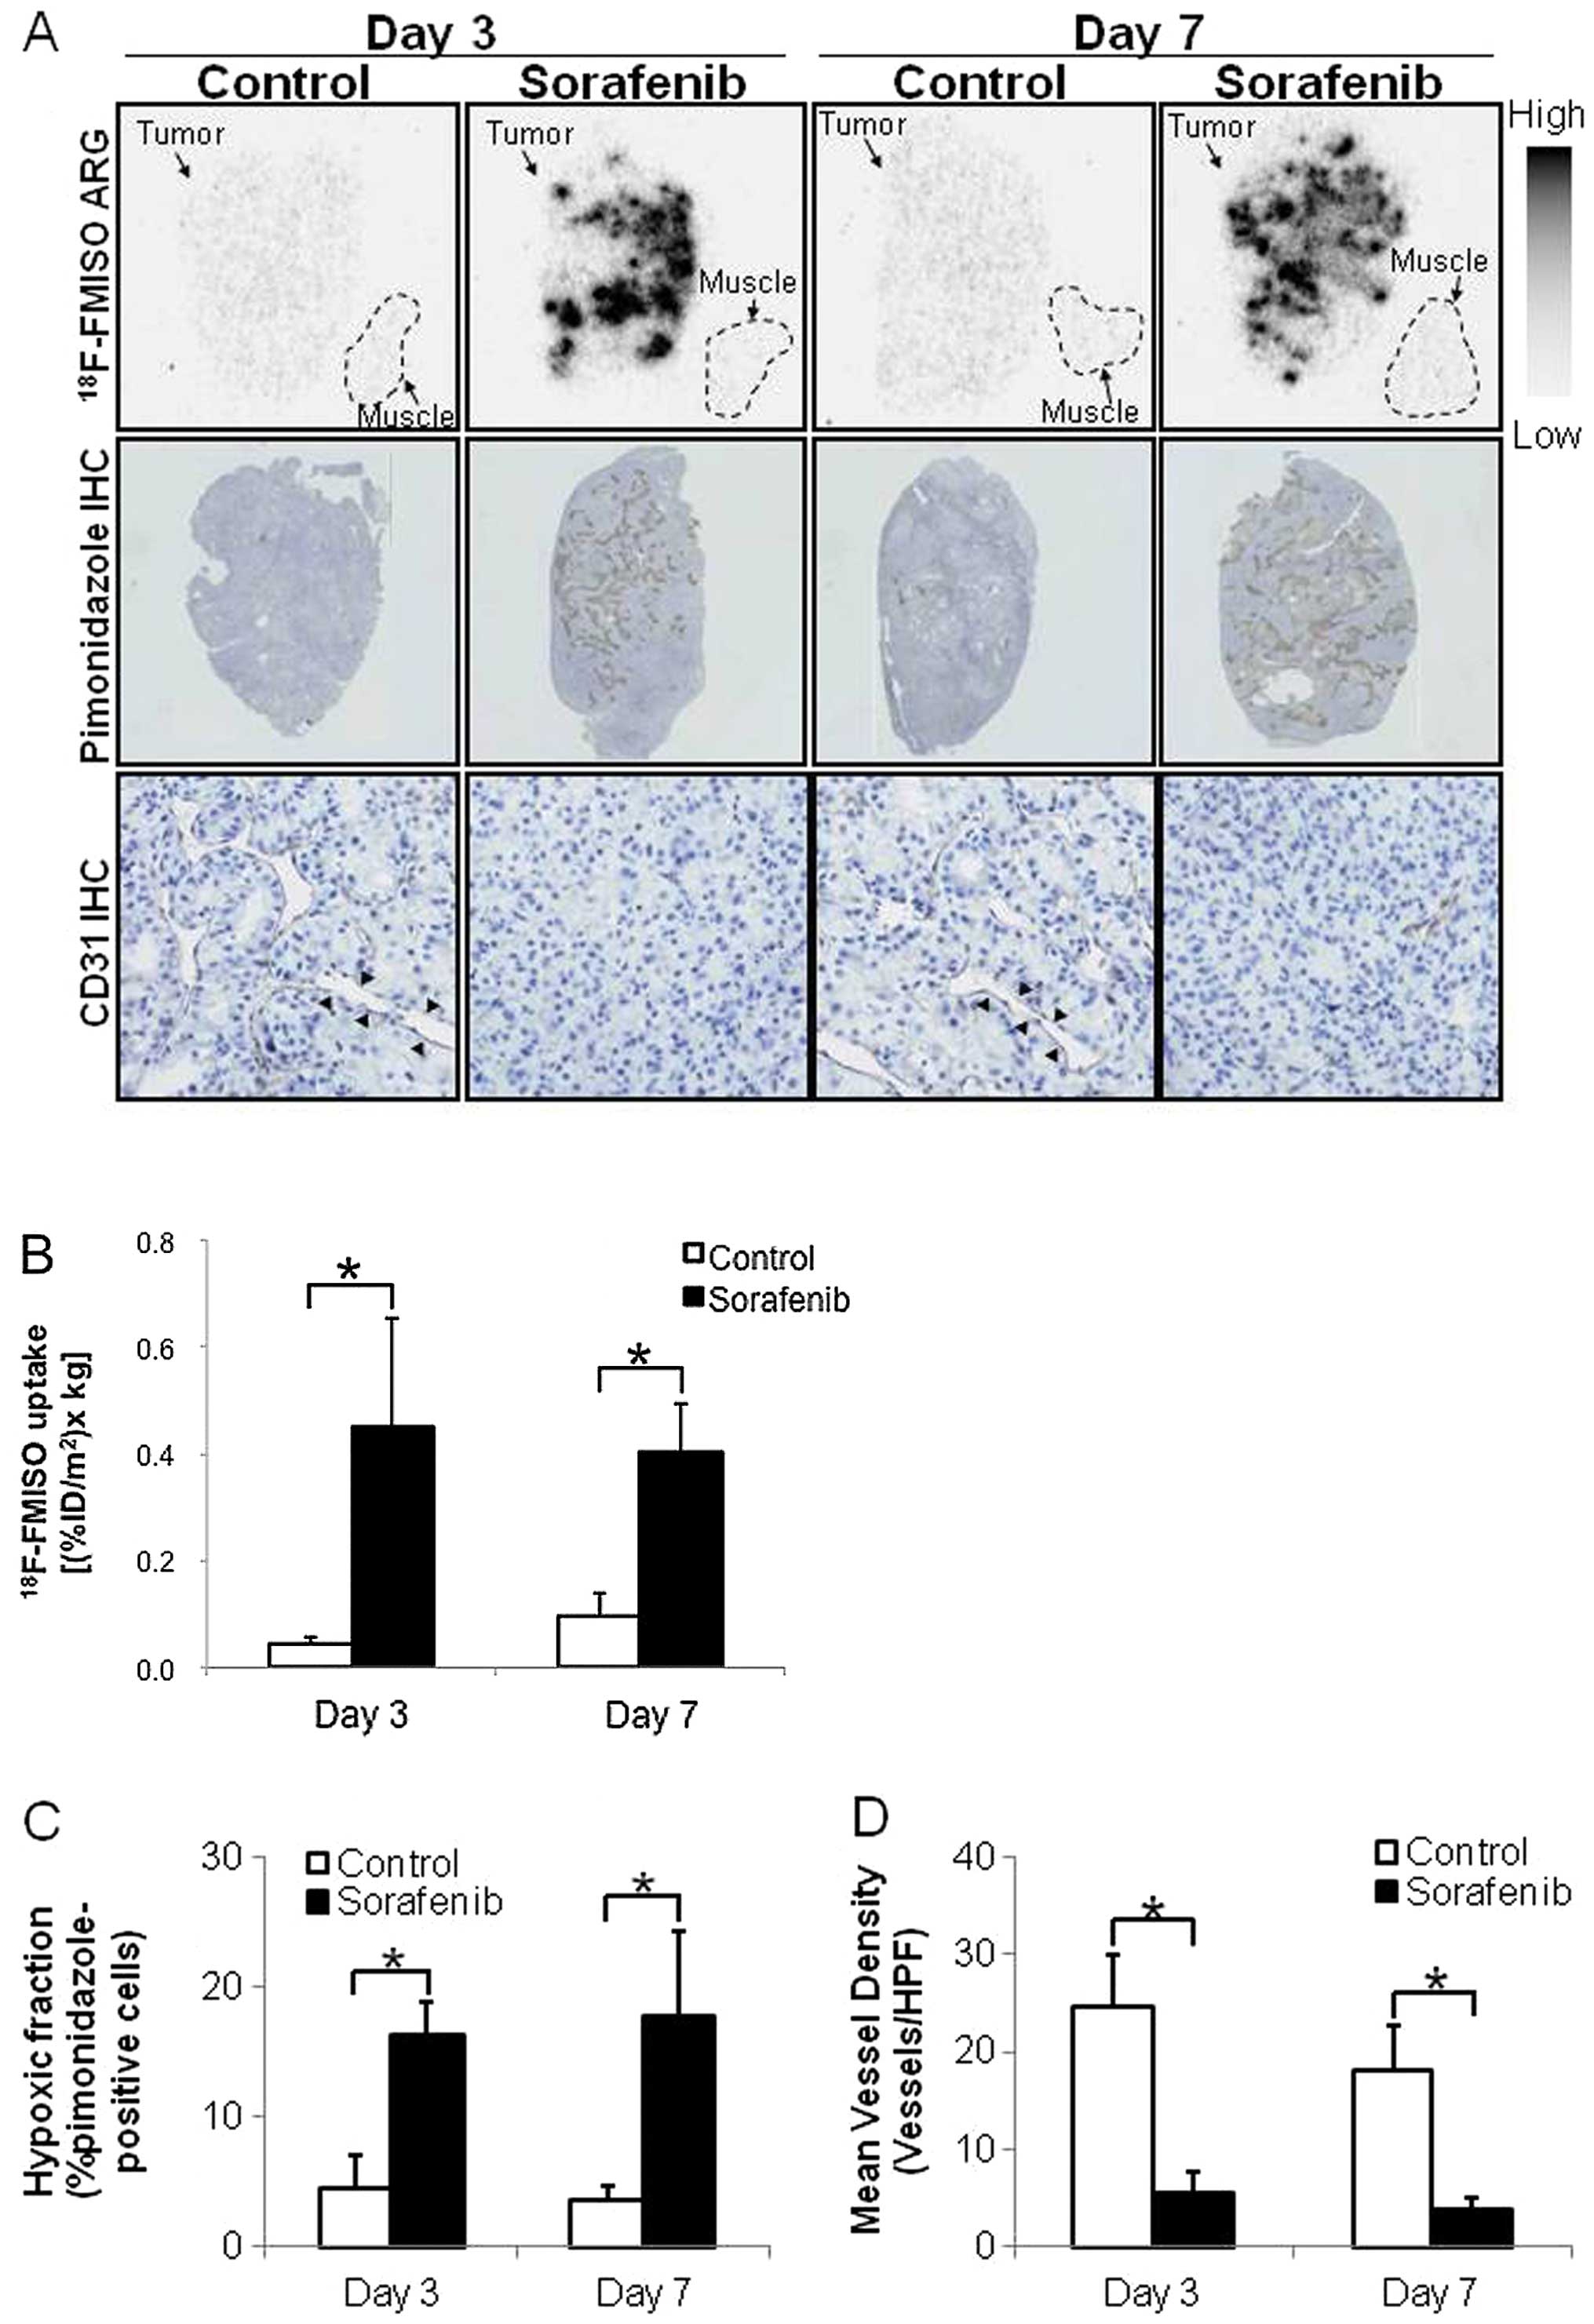
18F-FMISO ARG
Considering the results of the ex vivo
histological studies, 18F-FMISO ARG was performed on
Days 3 and 7 after the treatment. Fig.
6 shows representative images and quantitative evaluation by
18F-FMISO ARG. Hypoxia and microvessel density were also
evaluated using sections adjacent to those used in ARG (Fig. 6C and D). 18F-FMISO ARG
showed visually the increase in tumor hypoxic area, which is
similar to the finding of pimonidazole IHC (Fig. 6A). CD31 IHC showed a decrease in
tumor microvessel density after treatment with sorafenib (Fig. 6A). In the control groups,
18F-FMISO ARG showed a low extent of intratumoral
18F-FMISO distribution, which was similar to that of
muscle (Fig. 6A). The intratumoral
18F-FMISO distribution extent significantly increased by
10.2- and 4.1-fold on Days 3 and 7 after treatment with sorafenib,
respectively, compared with the control group (Fig. 6B). The levels of
18F-FMISO accumulation in tumors were 0.044±0.013 and
0.451±0.201 (% ID/m2 x kg body weight) on Day 3
(p<0.01) and 0.097±0.040 and 0.400±0.094 (% ID/m2 x
kg body weight) on Day 7 (p<0.01) in the control and
sorafenib-treated groups, respectively (Fig 6B). The hypoxic fractions (%
pimonidazole-positive cells) in tumor tissues significantly
increased by 3.5- and 4.8-fold on Days 3 and 7 after treatment with
sorafenib, respectively, compared with the control group (Fig. 6C). The hypoxic fractions in tumors
were 4.6±2.4 and 17.8±6.5 (%) on Day 3 (p<0.01) and 4.6±2.4 and
16.2±2.5 (%) on Day 7 (p<0.01) in the control and
sorafenib-treated groups, respectively (Fig. 6C). The MVDs in tumor tissues
significantly decreased by 77 and 78% on Days 3 and 7 after
treatment with sorafenib, respectively, compared with the control
groups (Fig. 6D). The MVDs in
tumor tissues were 24.7±5.2 and 5.6±2.2 (vessels/HPF) on Day 3
(p<0.01) and 18.0±4.7 and 3.9±1.2 (vessels/HPF) on Day 7
(p<0.01) in the control and sorafenib-treated groups,
respectively (Fig. 6D).
Discussion
There are two major findings of this study. First,
we showed that the tumor hypoxic fraction increased significantly
after only 2 days of sorafenib treatment, following the markedly
reduced tumor microvessel density after only 1 day of sorafenib
treatment in A498 xenografts (Figs.
3 and 4). Subsequently, the
necrosis area increased after 2–3 days of sorafenib treatment in
A498 xenografts (Fig. 5), although
tumor volume did not change after sorafenib treatment, at least
after 7 days of sorafenib treatment (Fig. 2). This finding indicates that tumor
starvation by anti-angiogenic therapy occurs following sorafenib
treatment in A498 xenografts and it is detected as tumor hypoxia.
Second, we showed that 18F-FMISO ARG detects the changes
in the tumor microenvironment as shown by a significant enhancement
of tumor hypoxia after 3 and 7 days of sorafenib treatment in A498
xenografts (Fig. 6). This finding
indicates that 18F-FMISO can detect the tumor starvation
process after anti-angiogenic therapy from a rapid enhancement of
tumor hypoxia. Therefore, findings of this study suggest that
18F-FMISO PET is a promising tool for non-invasive
evaluation of tumor starvation after anti-angiogenic sorafenib
treatment in highly vascularized RCC tumor xenografts.
Conventionally, the therapeutic responses of tumor
have been assessed by serial tumor size measurements, most notably
using the Response Evaluation Criteria in Solid Tumors guidelines
(23). However, preclinical
assessment of anti-angiogenic agents has highlighted limitations
associated with standard morphologic measurements. Thus, tumor
responses may be better assessed by functional measurements, which
may be more appropriate than size measurements (17,24,25).
In the evaluation of functional measurements, which
reflect tumor responses after anti-angiogenic therapy, two
conflicting hypotheses about changes in the tumor microenvironment
following anti-angiogenic therapy raise a problem. First is the
conventional tumor starvation strategy, by which inhibition of new
vessel formation or destruction of existing vessels to starve the
tumor from its nutrients and oxygen delivery is attempted (11). Previous studies also showed an
enhancement of tumor hypoxia after treatment with anti-angiogenic
agents including sorafenib (16,17,26).
The other is a new vascular normalization theory, which states that
pruning hyperpermeable immature tumor vessels can transiently
repair these vascular abnormalities and improve tumor oxygenation
after treatment with several anti-angiogenic agents including
bevacizumab and sunitinib (12,27).
Although the mechanisms underlying these conflicting processes in
the tumor microenvironment following anti-angiogenic therapy remain
unclear, changes in the tumor oxygen status and/or vascular
function may distinguish these conflicting processes.
In the present study, changes in the hypoxia status
examined by pimonidazole immunohistochemical analysis occurred at a
very early time-point, i.e., after only 2 days of sorafenib
treatment ex vivo (Fig. 3).
The number of tumor microvessels significantly decreased after only
1 day of sorafenib treatment (Fig.
4). As a result, the necrosis area significantly increased
after 2 days of sorafenib treatment (p<0.05) and the increase
was more obvious after 3 days of sorafenib treatment (p<0.01)
(Fig. 5). Since necrosis
development following an acute decrease in the count of
microvessels after anti-angiogenic therapy indicates tumor
starvation (28–31), the sequential changes in the tumor
microenvironment observed in the present study indicate the
existence of tumor starvation and tumor hypoxia may reflect the
tumor starvation status. Our findings are in line with those of
Chang et al, who showed the enhancement of tumor hypoxia and
decrease in the number of microvessels after 3 days of sorafenib
treatment in VHL mutant 786-O ccRCC xenografts (26). However, our study is the first to
show the sequential changes in the tumor microenvironments, which
start from the decrease in the number of microvessels to induce
tumor hypoxia and necrosis at early time-points after sorafenib
treatment in highly vascularized RCC xenografts. Thus, the present
sequential histological analyses of microvessels, hypoxia and
necrosis may clarify the tumor starvation process following
anti-angiogenic therapy.
Two experimental materials appear to contribute to
the rapid increase in tumor hypoxia. The first is the A498 cell
line, which is a VHL tumor suppressor gene mutant and in which
hypoxia-inducible factor (HIF)-2α is activated, although HIF-1α is
absent (32). A hallmark of RCC is
the frequent loss of VHL, which is a key regulator of HIF (33–35)
and VEGF production (36). Loss of
VHL results in the upregulation of VEGF production and induction of
tumor angiogenesis (37). Thus,
RCC with loss of VHL is a highly vascularized and
treatment-resistant tumor (38)
and is one of the most studied tumors treated with anti-angiogenic
therapy (39,40). Since A498 is highly vascularized,
anti-angiogenic therapy tends to induce acute tumor hypoxia. The
other material is sorafenib, which is a small-molecule multikinase
inhibitor that has been approved for treating advanced RCC
(41). As sorafenib has a strong
anti-angiogenic effect with suppression of the vascular endothelial
growth factor receptor (VEGFR) and platelet-derived growth factor
receptor (PDGFR), it is markedly effective for RCC (26,42).
It is indicated that this strong anti-angiogenic agent induces
acute tumor hypoxia in this highly vascularized tumor. The results
of the present study show that the rapid enhancement of tumor
hypoxia almost exclusively reflects tumor starvation status and
tumor hypoxia evaluation has great possibility in that it reflects
direct anti-angiogenic treatment effect and is useful for
determining patient-specific treatment protocols.
To identify predictive biomarkers for
anti-angiogenic therapy, various imaging techniques are being
examined, including perfusion imaging in dynamic contrast-enhanced
magnetic resonance imaging (DCE-MRI) (43,44).
Several clinical trials have shown a decrease in tumor perfusion in
response to anti-angiogenic treatment (45). Perfusion imaging is suitable for
evaluating the vascular status. However, DCE-MRI does not directly
assess the cellular statuses including tumor hypoxia and necrosis.
Hypoxia imaging may directly evaluate tumor cell status and may
distinguish tumor hypoxic areas from necrotic areas. Thus, both
perfusion and hypoxia imaging techniques should promote our
understanding of the tumor microenvironment following
anti-angiogenic therapy and an optimum imaging modality should be
chosen according to the purpose and situation.
There are several methods that indicate the tumor
oxygen status. One of the most reliable methods of evaluation of
hypoxia in tumor is pimonidazole immunohistochemical analysis
(46). However, pimonidazole
immunohistochemical analysis is an invasive and two-dimensional
qualitative method. 18F-FMISO is the most widely used
PET probe for imaging tumor hypoxia. Both the hypoxia probes
18F-FMISO and pimonidazole are imidazole derivatives.
The 2-nitroimidazole moiety in these compounds is considered to be
reduced by nitroreductase enzymes in a hypoxic environment and
trapped in hypoxic tumor cells; therefore, 18F-FMISO and
pimonidazole accumulate in similar regions in tumors (47,48).
Thus, 18F-FMISO PET can quantitatively evaluate
three-dimensional hypoxia regions (49,50).
As mentioned above, the present findings on the intratumoral
18F-FMISO distribution indicate the significant
enhancement of tumor hypoxia after sorafenib treatment in A498
xenografts, which is consistent with the findings of the concurrent
histological and ex vivo histological analyses (Fig. 6). Thus, 18F-FMISO PET
findings may reflect tumor starvation after anti-angiogenic therapy
in vivo at an early time-point.
In conclusion, the sequential histological changes
of the tumor microenvironment clarified tumor starvation in A498
tumor xenografts treated with sorafenib and 18F-FMISO
hypoxia imaging confirmed this tumor starvation. Unlike vascular
normalization, which shows an attenuation of tumor hypoxia, the
rapid enhancement of tumor hypoxia directly reflects the effect of
treatment with sorafenib alone. Thus, the assessment of tumor
hypoxia following anti-angiogenic therapy is important for
selecting optimum treatment protocols, i.e., between
anti-angiogenic therapy alone and combination therapy.
18F-FMISO PET may be used to assess tumor hypoxia
following anti-angiogenic therapy and may contribute to determining
optimum treatment protocols for cancer patients on anti-angiogenic
therapy.
Acknowledgements
This study was partially supported by
the ‘Project for Developing Innovation Systems: Creation of
Innovation Centers for Advanced Interdisciplinary Research Areas
Program’ from the Ministry of Education, Culture, Sports, Science
and Technology, the Japanese Government. This study was also
partially supported by JSPS KAKENHI grant no. 23591732. The authors
are grateful to the staff of the Department of Nuclear Medicine,
Central Institute of Isotope Science and Veterinary Internal
Medicine, Hokkaido University.
References
|
1.
|
N FerraraRS KerbelAngiogenesis as a
therapeutic
targetNature438967974200510.1038/nature0448316355214
|
|
2.
|
P CarmelietAngiogenesis in health and
diseaseNat Med9653660200310.1038/nm0603-65312778163
|
|
3.
|
AS ChungJ LeeN FerraraTargeting the tumour
vasculature: insights from physiological angiogenesisNat Rev
Cancer10505514201010.1038/nrc286820574450
|
|
4.
|
P CarmelietRK JainMolecular mechanisms and
clinical applications of
angiogenesisNature473298307201110.1038/nature1014421593862
|
|
5.
|
RK JainDG DudaJW ClarkJS LoefflerLessons
from phase III clinical trials on anti-VEGF therapy for cancerNat
Clin Pract Oncol32440200610.1038/ncponc040316407877
|
|
6.
|
H HurwitzL FehrenbacherW
NovotnyBevacizumab plus irinotecan, fluorouracil and leucovorin for
metastatic colorectal cancerN Engl J
Med35023352342200410.1056/NEJMoa03269115175435
|
|
7.
|
LB SaltzS ClarkeE Díaz-RubioBevacizumab in
combination with oxaliplatin-based chemotherapy as first-line
therapy in metastatic colorectal cancer: a randomized phase III
studyJ Clin Oncol2620132019200810.1200/JCO.2007.14.993018421054
|
|
8.
|
NC TebbuttK WilsonVJ GebskiCapecitabine,
bevacizumab and mitomycin in first-line treatment of metastatic
colorectal cancer: results of the Australasian Gastrointestinal
Trials Group Randomized Phase III MAX StudyJ Clin
Oncol2831913198201010.1200/JCO.2009.27.7723
|
|
9.
|
M ReckJ von PawelP ZatloukalPhase III
trial of cisplatin plus gemcitabine with either placebo or
bevacizumab as first-line therapy for nonsquamous non-small-cell
lung cancer: AVAilJ Clin
Oncol2712271234200910.1200/JCO.2007.14.546619188680
|
|
10.
|
A SandlerR GrayMC
PerryPaclitaxel-carboplatin alone or with bevacizumab for
non-small-cell lung cancerN Engl J
Med35525422550200610.1056/NEJMoa06188417167137
|
|
11.
|
J FolkmanTumor angiogenesis: therapeutic
implicationsN Engl J
Med28511821186197110.1056/NEJM1971111828521084938153
|
|
12.
|
S GoelDG DudaL XuNormalization of the
vasculature for treatment of cancer and other diseasesPhysiol
Rev9110711121201110.1152/physrev.00038.201021742796
|
|
13.
|
RK JainNormalization of tumor vasculature:
an emerging concept in antiangiogenic
therapyScience3075862200510.1126/science.110481915637262
|
|
14.
|
LH GrayAD CongerM EbertS HornseyOC
ScottThe concentration of oxygen dissolved in tissues at the time
of irradiation as a factor in radiotherapyBr J
Radiol26638648195310.1259/0007-1285-26-312-63813106296
|
|
15.
|
S OffermannsW RosenthalEncyclopedia of
Molecular Pharmacology2nd
editionSpringer-VerlagBerlin200810.1007/978-3-540-38918-7
|
|
16.
|
C OehlerJA O’DonoghueJ
Russell18F-fluromisonidazole PET imaging as a biomarker
for the response to 5,6-dimethylxanthenone-4-acetic acid in
colorectal xenograft tumorsJ Nucl
Med52437444201110.2967/jnumed.110.081372
|
|
17.
|
M YangH GaoX SunMultiplexed PET probes for
imaging breast cancer early response to VEGF121/rGel
treatmentMol Pharm8621628201110.1021/mp100446t21280671
|
|
18.
|
G TangM WangX TangM GanL LuoFully
automated one-pot synthesis of
[18F]fluoromisonidazoleNucl Med Biol325535582005
|
|
19.
|
SJ OhDY ChiC MosdzianowskiFully automated
synthesis of [18F]fluoromisonidazole using a
conventional [18F]FDG moduleNucl Med
Biol328999052005
|
|
20.
|
S ZhaoY KugeT MochizukiBiologic correlates
of intratumoral heterogeneity in 18F-FDG distribution
with regional expression of glucose transporters and hexokinase-II
in experimental tumorJ Nucl Med46675682200515809491
|
|
21.
|
RS BrownJY LeungSJ FisherKA FreySP
EthierRL WahlIntratumoral distribution of tritiated
fluorodeoxyglucose in breast carcinoma: I. Are inflammatory cells
important?J Nucl Med361854186119957562055
|
|
22.
|
H ToyamaM IchiseJS LiowAbsolute
quantification of regional cerebral glucose utilization in mice by
18F-FDG small animal PET scanning and 2-14C-DG
autoradiographyJ Nucl Med4513981405200415299067
|
|
23.
|
EA EisenhauerP TherasseJ BogaertsNew
response evaluation criteria in solid tumours: revised RECIST
guideline (version 1.1)Eur J
Cancer45228247200910.1016/j.ejca.2008.10.026
|
|
24.
|
R Schor-BardachDC AlsopI PedrosaDoes
arterial spin-labeling MR imaging-measured tumor perfusion
correlate with renal cell cancer response to antiangiogenic therapy
in a mouse
model?Radiology251731742200910.1148/radiol.252108105919474376
|
|
25.
|
Z KanS PhongkitkarunS KobayashiFunctional
CT for quantifying tumor perfusion in antiangiogenic therapy in a
rat
modelRadiology237151158200510.1148/radiol.236304129316183931
|
|
26.
|
Y ChangJ AdnaneP TrailSorafenib (BAY
43-9006) inhibits tumor growth and vascularization and induces
tumor apoptosis and hypoxia in RCC xenograft modelsCancer Chemother
Pharmacol59561574200710.1007/s00280-006-0393-417160391
|
|
27.
|
RK JainNormalizing tumor vasculature with
anti-angiogenic therapy: a new paradigm for combination therapyNat
Med7987989200110.1038/nm0901-98711533692
|
|
28.
|
LM ChingD GoldsmithWR JosephH KörnerJD
SedgwickBC BaguleyInduction of intratumoral tumor necrosis factor
(TNF) synthesis and hemorrhagic necrosis by
5,6-dimethylxanthenone-4-acetic acid (DMXAA) in TNF knockout
miceCancer Res5933043307199910416582
|
|
29.
|
K HoriStarvation tactics for solid tumors:
tumor blood flow interruption via a combretastatin derivative
(Cderiv) and its micro-circulation mechanismCancer Metastasis
Rev31109122201210.1007/s10555-011-9333-922101805
|
|
30.
|
J MarxAngiogenesis. A boost for tumor
starvationScience301452454200310.1126/science.301.5632.45212881543
|
|
31.
|
DM PattersonGJ RustinVascular damaging
agentsClin Oncol (R Coll
Radiol)19443456200710.1016/j.clon.2007.03.014
|
|
32.
|
T ShinojimaM OyaA TakayanagiR MizunoN
ShimizuM MuraiRenal cancer cells lacking hypoxia inducible factor
(HIF)-1alpha expression maintain vascular endothelial growth factor
expression through
HIF-2alphaCarcinogenesis28529536200710.1093/carcin/bgl143
|
|
33.
|
SW EbbinghausMS GordonRenal cell
carcinoma: rationale and development of therapeutic inhibitors of
angiogenesisHematol Oncol Clin North
Am1811431159ixx200410.1016/j.hoc.2004.06.00315474339
|
|
34.
|
RA FiglinRenal cell carcinoma: management
of advanced diseaseJ
Urol161381387199910.1016/S0022-5347(01)61897-49915408
|
|
35.
|
PA GodleyM TaylorRenal cell carcinomaCurr
Opin Oncol13199203200110.1097/00001622-200105000-0001211307065
|
|
36.
|
X NaG WuCK RyanSR SchoenPA di’SantagneseEM
MessingOverproduction of vascular endothelial growth factor related
to von Hippel-Lindau tumor suppressor gene mutations and
hypoxia-inducible factor-1 alpha expression in renal cell
carcinomasJ Urol170588592200310.1097/01.ju.0000074870.54671.98
|
|
37.
|
J JośkoM MazurekTranscription factors
having impact on vascular endothelial growth factor (VEGF) gene
expression in angiogenesisMed Sci Monit10RA8998200415039660
|
|
38.
|
WG KaelinThe von Hippel-Lindau tumor
suppressor protein and clear cell renal carcinomaClin Cancer
Res13S680S684200710.1158/1078-0432.CCR-06-186517255293
|
|
39.
|
W CáceresA Cruz-ChacónRenal cell
carcinoma: molecularly targeted therapyPR Health Sci
J307377201116336094
|
|
40.
|
TE HutsonTargeted therapies for the
treatment of metastatic renal cell carcinoma: clinical
evidenceOncologist16Suppl
21422201110.1634/theoncologist.2011-S2-1421346036
|
|
41.
|
J SosmanI PuzanovCombination targeted
therapy in advanced renal cell
carcinomaCancer11523682375200910.1002/cncr.2423419402058
|
|
42.
|
SM WilhelmC CarterL TangBAY 43-9006
exhibits broad spectrum oral antitumor activity and targets the
RAF/MEK/ERK pathway and receptor tyrosine kinases involved in tumor
progression and angiogenesisCancer
Res6470997109200410.1158/0008-5472.CAN-04-144315466206
|
|
43.
|
A JahangiriMK AghiBiomarkers predicting
tumor response and evasion to anti-angiogenic therapyBiochim
Biophys Acta182586100201222067555
|
|
44.
|
A PircherW HilbeI HeideggerJ DrevsA
TichelliM MedingerBiomarkers in tumor angiogenesis and
anti-angiogenic therapyInt J Mol
Sci1270777099201110.3390/ijms1210707722072937
|
|
45.
|
M ZweifelAR PadhaniPerfusion MRI in the
early clinical development of antivascular drugs: decorations or
decision making tools?Eur J Nucl Med Mol Imaging37Suppl
1164182201010.1007/s00259-010-1451-z20461374
|
|
46.
|
JA RaleighDP Calkins-AdamsLH RinkerHypoxia
and vascular endothelial growth factor expression in human squamous
cell carcinomas using pimonidazole as a hypoxia markerCancer
Res583765376819989731480
|
|
47.
|
EG TroostP LavermanJH KaandersImaging
hypoxia after oxygenation-modification: comparing
[18F]FMISO autoradiography with pimonidazole
immunohistochemistry in human xenograft tumorsRadiother
Oncol80157164200616905213
|
|
48.
|
EG TroostP LavermanME
PhilippensCorrelation of [18F] FMISO autoradiography and
pimonidazole [corrected] immunohistochemistry in human head and
neck carcinoma xenograftsEur J Nucl Med Mol
Imaging35180318112008
|
|
49.
|
LM CherC MuroneN LawrentschukCorrelation
of hypoxic cell fraction and angiogenesis with glucose metabolic
rate in gliomas using 18F-fluoromisonidazole,
18F-FDG PET and immunohistochemical studiesJ Nucl
Med47410418200616513609
|
|
50.
|
WJ KohKS BergmanJS RaseyEvaluation of
oxygenation status during fractionated radiotherapy in human
nonsmall cell lung cancers using [F-18]fluoromisonidazole positron
emission tomographyInt J Radiat Oncol Biol
Phys3339139819957673026
|