Introduction
Schwannomas are benign tumors that arise from
Schwann cells in the peripheral nerves. These tumors often
originate from the vestibular nerve, although they can develop
anywhere from the glial-Schwann junction up to the nerve
terminations within the auditory and vestibular sensory organs
(1). Although histologically
benign, vestibular schwannomas may cause hearing loss, tinnitus,
facial palsy and, when large enough, brain stem compression and
even death. Vestibular schwannomas are usually sporadic and
unilateral (95%) but may be bilateral when associated with
neurofibromatosis type 2 (NF2) syndrome, which is caused by
germline mutations of the neurofibromin 2 (NF2) gene.
Moreover, patients with NF2 develop other tumors as well, such as
meningiomas, ependymomas and gliomas (2).
The NF2 gene, a tumor suppressor located at
22q12 that encodes a protein termed merlin or schwannomin (3), is mutated in up to 66% of sporadic
schwannomas (4). The NF2
gene is inactivated in most, if not all, schwannomas (5) and is frequently lost in conjunction
with the loss of chromosome 22. Merlin is a member of the band 4.1
superfamily of proteins and exhibits sequence homology with the
members of the ezrin/radixin/moesin (ERM) family, with 17 coding
exons and 2 main isoforms, arising from alternative splicing of
exons 16 and 17. In Schwann cells, merlin coloca lizes with
E-cadherin at the paranodes and Schmidt-Lanterman incisures in the
myelinating peripheral nerve (6).
Merlin is involved in a variety of signaling
pathways, such as mTORC1 regulation (7), activation of the Hippo pathway in
Drosophila(8), membrane
recruitment and activation of Rac/PAK (9) and, upon cell-to-cell contact,
downregulation of the membrane levels of ErbB2, ErbB3 (10) and EGFR (11). Recently, merlin has been found to
suppress tumorigenesis by entering the nucleus and binding to the
E3 ubiquitin ligase CRL4DCAF1, suppressing its activity
(12). For translocation into the
nucleus, merlin must be activated (closed state) by the
dephosphorylation of myosin phosphatase target subunit 1
(MYPT1), although other mechanisms of activation should not
be ruled out.
In addition to schwannomas, merlin alterations have
been described in other tumor types, particularly meningiomas and
ependymomas and, less commonly, in mesotheliomas, renal cell
carcinomas, melanomas, colorectal cancers and glioblastomas
(13). Furthermore, advanced
breast cancer exhibits a loss of merlin expression via
post-translational mechanisms (14). Other genetic changes that are rare
in schwannomas, such as 1p losses and 9q34 and 17q gains, have been
described in a few samples (15,16).
Furthermore, epigenetic changes involving the NF2 gene
(17–21) and other tumor-related genes
(22) have also been investigated
in vestibular schwannomas.
There are only 3 studies available on the global
gene expression profile in vestibular schwannomas. These studies
used various microarray platforms: 4 EST filters from Research
Genetics (Huntsville, AL, USA) (23), Affymetrix HG-U133A (24) and ABI 1700 (25). The first of these studies used 1
control nerve sample and 7 tumors, while the other two increased
the controls to 3 and the tumors to 16 and 25, respectively. Due to
the number of controls available, the statistical approach was
different: the first approach was very restrictive and centered on
specific probes, while the other two were less restrictive and even
validated 7 genes by qRT-PCR. Apart from specific coincidences,
these studies showed no common trends. With the less stringent
method previously described (25),
1,650 genes appeared deregulated and the development of new tools
for data analysis led to the conclusion that the ERK pathway was
the core network. Our goal, with the help of new improved tools for
data analysis, was to perform a more thorough analysis of the
expression patterns of 31 schwannomas and 9 controls. Our results
concur with earlier array analysis data on schwannomas, such as
caveolin-1 (CAV1) downregulation (25), as well as with other studies
conducted, using techniques such as qRT-PCR [i.e., neuregulin 1
(NRG1)-ErbB2-ErbB3 upregulation] and immunohistochemistry analysis
(CCND1 upregulation) (26).
In conclusion, the main finding of this study is the
activation of the MET pathway due to changes in the expression of
other modulators of this gene [integrin, alpha 4
(ITGA4)/ITGB6 and PLEXNB3/SEMA5]. Furthermore,
osteopontin (SPP1) upregulation, described in breast cancer
as being responsible for merlin degradation (14), may explain the absence of merlin
even in schwannomas with no DNA hits in NF2 (5). Finally, we also performed correlation
analyses with clinical and molecular alterations, in order to
identify markers with useful prognostic, diagnostic and therapeutic
information.
Materials and methods
Sample and DNA/RNA preparation
The study group consisted of 31 patients who
underwent vestibular schwannoma removal surgery at our institution.
The study population included 17 females and 14 males. The local
Ethics Review Board of La Paz University Hospital approved the
study protocol according to the principles of the Declaration of
Helsinki. All patients received detailed information of the study
and provided their written informed consent prior to their
inclusion. DNA was isolated from 31 frozen samples, corresponding
to 28 sporadic and 3 NF2-associated vestibular schwannomas, using
the Wizard Genomic DNA purification kit (Promega). DNA from the
corresponding peripheral blood of the patients was also extracted.
RNA was isolated using the RNeasy® Mini kit (Qiagen) in
all tumoral and non-tumoral samples. The following non-tumoral
samples were used as the controls: 2 auricular nerves, 2 cervical
nerves, 1 facial nerve, 1 vestibular nerve and 1 nerve from the
VIII cranial pair (all processed with the same protocol as
schwannomas), as well as 1 commercial normal human adult Schwann
cell (HSC) RNA, purchased from ScienCell (HSC total RNA, catalog
number 1705).
Expression arrays
Affymetrix Human Gene 1.0 ST arrays were used to
analyze gene expression levels. We processed 25 ng of total RNA as
previously described by Gonzalez-Roca et al(27). In brief, library preparation and
amplification were performed following the distributor’s
(Sigma-Aldrich) recommendations for whole transcriptome
amplification (WTA2). Amplification was performed for 17 cycles and
amplified cDNA was purified and quantified on a NanoDrop ND-1000
spectrophotometer (Thermo-Fischer). cDNA (8 μg) was
subsequently fragmented by DNAse I and biotinylated by terminal
transferase obtained from a GeneChip Mapping 10Kv2 Assay kit
(Affymetrix). Hybridization, washing, staining and scanning of
Affymetrix Human Gene 1.0 ST arrays were performed following the
manufacturer’s recommendations. Scanned images (DAT files) were
transformed into intensities (CEL files) by Affymetrix GeneChip
Operating Software (GCOS). Arrays were processed at the IRB
Barcelona Functional Genomics Core Facility. Data can be accessed
at the Gene Expression Omnibus (GEO) database GSE39645.
Array normalization and
summarization
Overall array intensity was normalized between
arrays to correct for systematic bias in data and remove the impact
of non-biological influences on biological data. Affymetrix arrays
had multiple probes (probe set) directed to each gene. Following
normalization, the probe intensity of all probes in a probe set was
summarized to a single value. Normalization and summarization was
performed using the Robust Multichip Average (RMA) algorithm
(28).
Statistical array analysis
The 40 samples (31 tumors and 9 nerve controls) were
processed in 2 batches, with controls and tumors in both batches.
ComBat, an Empirical Bayes method (29), was subsequently used to remove the
batch effect, based on previous findings (30). In order to include genes for web
tool analysis, those genes with at least a 2-fold change of
expression and a p<0.05 cut-off (t-test) were selected, as
previously recommended (31).
Bonferroni adjustment was used to obtain more restrictive results.
For the analysis, we used probes from NM (messenger RNA) of RefSeq
annotation and intron-free olfactory receptors were removed in
order to avoid cross-hybridization (32). All statistical analyses were
performed using MultiExperiment Viewer (MeV) (33,34).
Principal component analysis (PCA) was performed by eigenvalue
decomposition of the 3 principal components for tridimensional
classification of the samples and an unsupervised hierarchical
cluster by Pearson’s correlation was selected to group the samples.
The significance analysis of microarrays (SAM) statistical
technique (with 1,000 permutations and a threshold fold change of
2) was also performed for descriptive and comparative purposes.
Array web tool analysis
To obtain a list of deregulated genes for use with
web tool databases, a fold change ranking plus a non-stringent
p-value cut-off (p<0.05) was used. Three different open access
databases were selected for the analysis:
DAVID (35,36). We used the RefSeq
annotations selected for statistical array analysis as a
background. A list of genes (upregulated, downregulated, or both)
was then used to obtain enriched biological and/or molecular
themes. Public genomic resources, such as Gene Ontology (GO),
Swiss-Prot (SP) and Protein Information Resource (PIR), were
selected for analysis.
Reactome (http://www.reactome.org). In this peer-reviewed
and manually curated database, pathways can be easily analyzed by
introducing a list of genes with the relative average expression of
the groups (controls vs. tumors in our study).
WebGestalt (37). Similar to the DAVID
database, this tool provides data that can also be checked with
Transcription Factor Target analysis, WikiPathways and Cytogenetic
band analysis. The configuration used for the analysis was the
enrichment analysis at p<0.05 using the hypergeometric test and
BH adjustment.
Quantitative RT-PCR
To validate the expression pattern obtained by the
microarrays, qRT-PCR amplifications were performed with TaqMan Gene
Expression Assay products on an ABI PRISM 7900HT Sequence Detection
system (Applied Biosystems, Foster City, CA, USA). The reactions
were performed using TaqMan Low Density arrays (TLDAs; Applied
Biosystems) containing 50 ml TaqMan Universal PCR Master Mix
(Applied Biosystems, Foster City, CA, USA) and 50 ml of a cDNA
template corresponding to 100 ng total RNA per channel of the
microfluidic card. A total of 48 genes studied in these assays were
selected according to their deregulation and involvement in
pathways of potential interest in the development of schwannomas as
well as of other tumors: ANK2-Hs00153998_m1, ANK3-Hs00253210_m1,
AR-Hs00171172_ m1, ATF7IP2-Hs00228009_m1, CAV1-Hs00184697_m1,
CCND1-Hs00765553_m1, CTNNA1-Hs00944794_m1, CXCL1-Hs00236937_m1,
CXCL5-Hs00171085_m1, DSG2-Hs00170071_m1, EGFR-Hs01076086_m1,
ERBB2-Hs0100 1586_m1, FABP4-Hs01086177_m1, FLOT1-Hs00195134_m1,
GRB14-Hs00182949_m1, L1CAM-Hs01109748_m1, LATS2-Hs00324396_m1,
MCAM-Hs00174838_m1, MDM2-Hs9999 9008_m1, MET-Hs01565584_m1,
NOV-Hs00159631_m1, NRG1-Hs00247625_m1, NRXN1-Hs00245125_m1,
PAK2-Hs01127126_m1, PAK3-Hs00176828_m1, PAWR-Hs01088 574_m1,
PDGFA-Hs00964426_m1, PDGFB-Hs00966522_ m1, PDGFC-Hs00211916_m1,
PDGFD-Hs00228671_m1, PDGFRA-Hs00998026_m1, PIK3IP1-Hs00364629_m1,
RASSF4-Hs00604698_m1, RENBP-Hs00234138_m1, SHOX2-Hs01059691_m1,
TGFB3-Hs01086000_m1, VLDLR; FLJ35024-Hs00182461_m1,
WWP1-Hs00366927_m1, CDH1-Hs01023894_m1, CX3CL1-Hs00171086_m1,
ERBB3-Hs00951455_m1, HEPACAM-Hs00404147_m1, IL8RA-Hs00174146_m1 and
S100A9-Hs00610058_m1 (available upon request).
Calculation of gene expression was obtained as
follows: average cycle threshold (Ct) values were obtained using
SDS 2.2 software (Applied Biosystems). The maximum Ct value was set
at 40. Ct values were normalized using 4 housekeeping genes
(18S-Hs99999901_s1, ACTB-Hs99999903_m1, PPIA-Hs99999904_m1 and
RPL18-Hs00965812_g1). The relative expression level of each target
gene was expressed as ΔCt = Ctref -
Ctgene(38).
Reference-normalized expression measurements were adjusted by
defining the lowest expression value as 0, with subsequent 1-unit
increases reflecting an approximate doubling of the RNA. The
non-parametric Mann-Whitney-Wilcoxon test was used to calculate the
significance of differences between control samples and
schwannomas.
Loss of heterozygosity (LOH) of 22q
In order to determine the 22q allelic constitution
of schwannomas, the status of 5 microsatellite markers at the
D22S275, D22S264, D22S929, D22S268 and D22S280 loci (22q11-q12.3)
was verified by labeling 5′ primers with fluorescent markers
(6-FAM/HEX and ROX as a size standard) (Applied Biosystems).
Allelic ratios were defined according to previously described
criteria: T2 x N1/T1 x N2, in which the LOH was <0.6 or >1.67
(39).
PCR/denaturing high-performance liquid
chromatography (dHPLC) analysis and direct sequencing of NF2
Genomic DNA amplification was performed using
standard PCR methods (total volume of 20 μl). A set of 15
primer pairs was used as previously described (3). Mutational screening was performed
using dHPLC following the manufacturer’s instructions (Transgenomic
WAVE® dHPLC Systems). Samples with different patterns by
dHPLC were sequenced bidirectionally (ABI 3100-Avant, Applied
Biosystems), using the BigDye sequencing kit (Applied Biosystems),
to determine the position and nature of the alteration. For the
mutation description, sequence NM_000268.3 was used when the
alteration appeared within mature mRNA and sequence NC_000022.10
was used when the mutation was located in other parts of the
NF2 gene.
Multiplex ligation-dependent probe
amplification (MLPA) analysis of NF2
To identify large NF2 deletions not detected
by PCR/dHPLC, we used a commercial MLPA kit for analysis (SALSA
P044 NF2; MRC-Holland, Amsterdam, The Netherlands). Information
regarding the probe sequences and ligation sites can be found at
http://www.mlpa.com. The MLPA protocol was performed
as described by the manufacturer, using 100 ng of DNA from the
control and tumor samples. Data analysis was performed with
MRC-Coffalyser software (MRC-Holland).
Clinical data
The tumors were located on the left side in 16 cases
(52%). The mean age was 44.5±14.3 years. Audiologic measurements
included pre-operative and post-operative pure-tone average (PTA)
and speech discrimination score (SDS). Hearing data were reported
according to the recommendations of the American Academy of
Otolaryngology-Head and Neck Surgery (AAOHNS). Thus, class A was
defined as PTA <30 dB and SDS >70%; class B, PTA 31–50 dB and
SDS 50–100%; class C, PTA 51–100 dB and SDS 50–100%; and class D,
any PTA and SDS <50%. Size was evaluated by the KOOS scale and
characterized as stage 1 (intracanalicular) in 1 case (3%), stage 2
[15 mm in its greatest diameter in the cerebellopontine angle
(CPA)] in 8 cases (26%), stage 3 (16–30 mm in the CPA) in 16 cases
(52%) and stage 4 (>30 mm in the CPA) in 6 cases (19%). Tumor
appearance was homogeneous (64%), heterogeneous (23%) and cystic
(13%) as shown by MRI. The fundus of the internal auditory channel
was affected in 65% of cases. All tumor tissues obtained at surgery
were fixed in 10% formalin and embedded in paraffin. Staining with
hematoxylin and eosin was performed for routine microscopic
diagnosis. Antoni type A regions consisted of interwoven bundles of
long bipolar spindle cells, whereas Antoni type B regions exhibited
a loose myxoid background containing more stellate tumor cells. The
percentage of the different tissue types (A, B, or mixed) in each
tumor sample was independently determined by 2 pathologists. The
results were grouped in 2 types: type A, >70% of the tumor
composed of type A tissue and type B, <70% of the tumor composed
of type A tissue.
Results
Microarray analysis
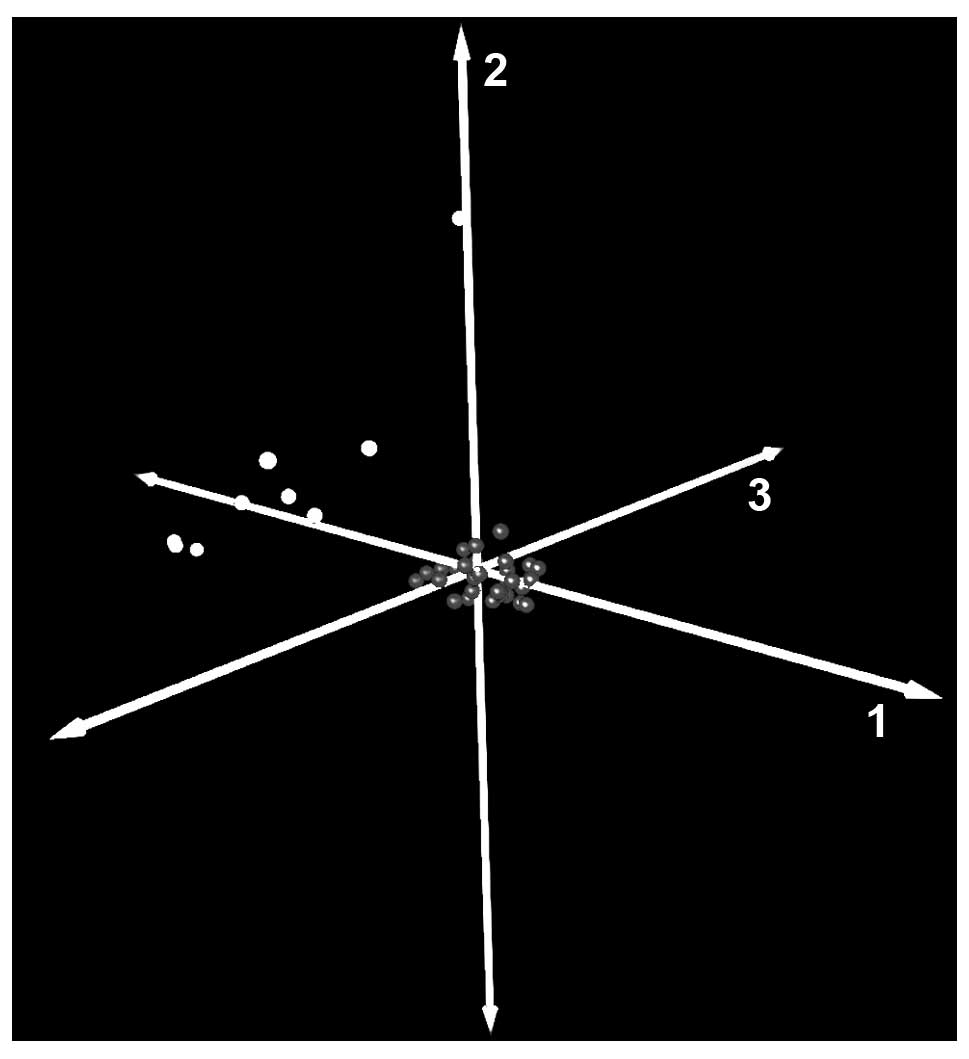
PCA and hierarchical clustering depicted a clear
distinction between control nerves and schwannomas (Fig. 1). The most distinct sample shown in
the PCA corresponded to the control of cultured human Schwann
cells, which was different from other controls due to additional
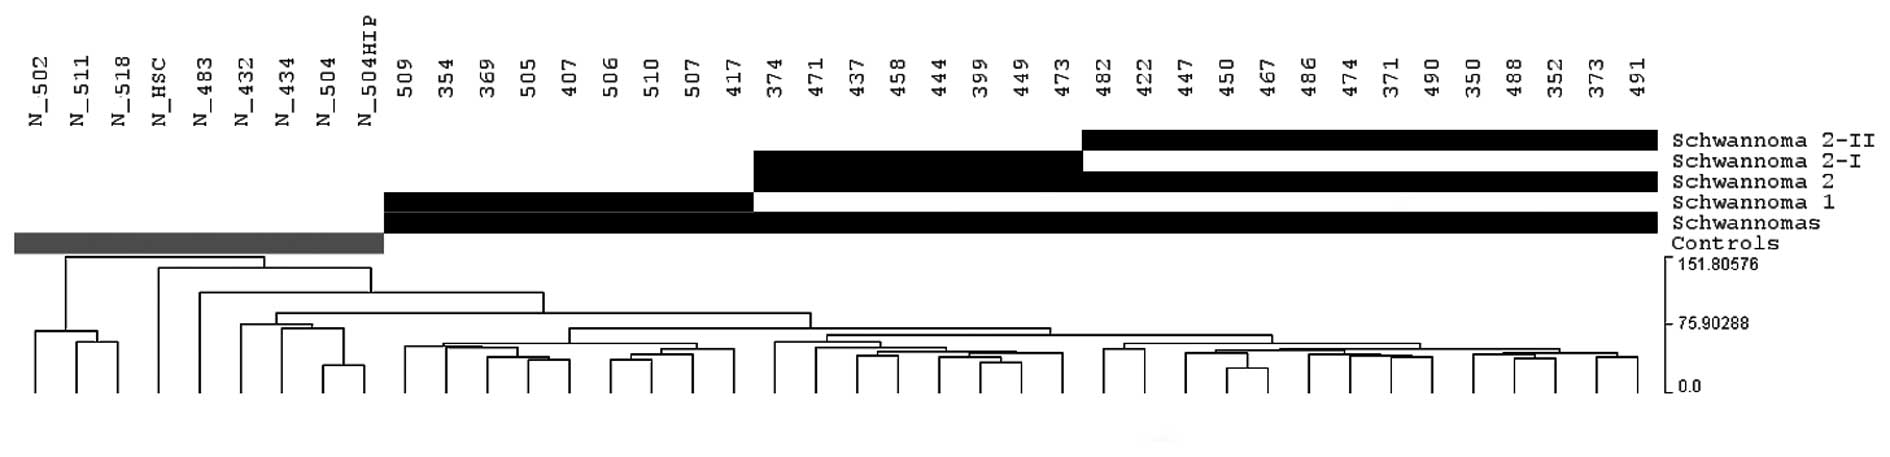
material present at the non-tumoral nerves. Pearson’s correlation
grouped all 31 schwannomas into a large cluster, with small
differences among the tumors (Fig.
2), whereas the control nerves exhibited greater differences.
The hierarchical cluster analysis also recognized 2 schwannoma
expression groups (1 and 2) that displayed only 16 differentially
expressed genes. Likewise, tumors in group 2 were classified into
subgroups 2-I and 2-II, that displayed 66 differentially
deregulated genes, including SEMA3D, MERTK,
RELN and CD36. No Bonferroni-adjusted genes were
obtained in any of these groups.
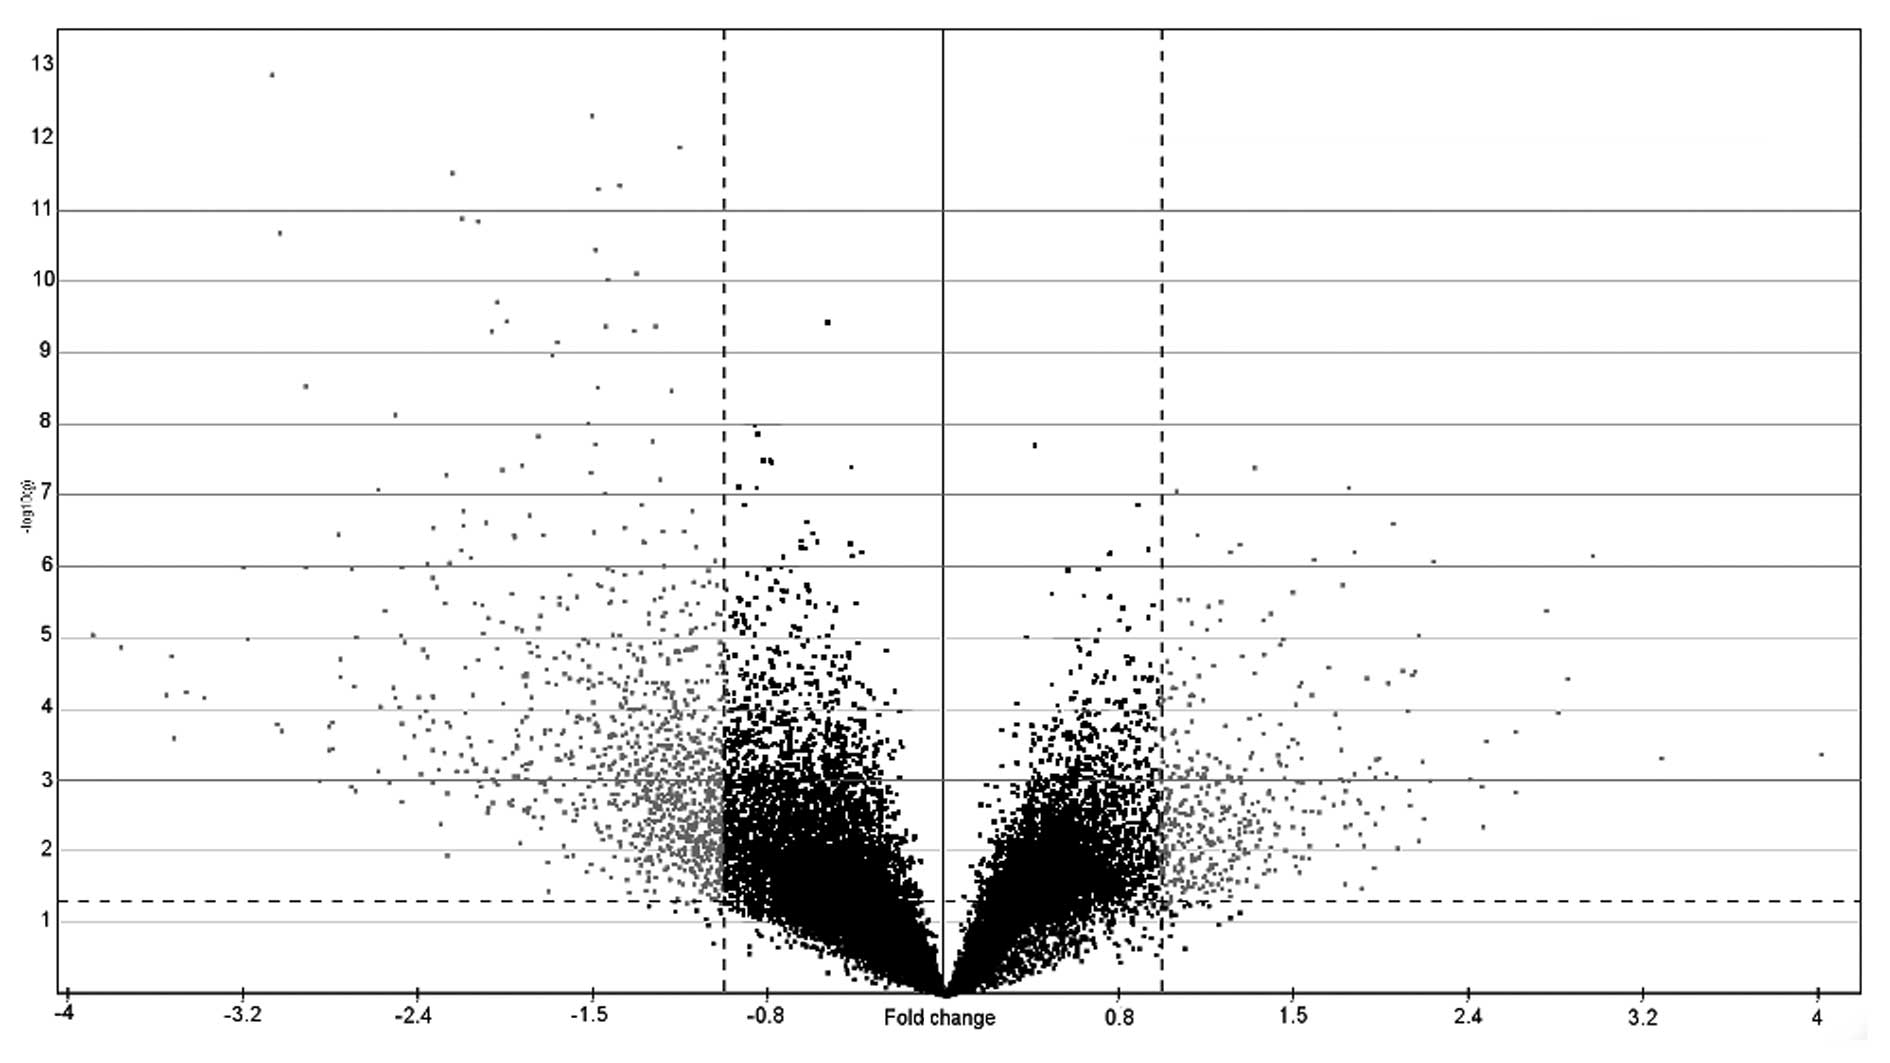
An analysis of variance (ANOVA)/Welch’s t-test
(p<0.05 and 2-fold changes) was performed to establish a list of
1,516 genes (Fig. 3), 1,105 of
which were upregulated (available upon request) and 411
downregulated (available upon request) (89 were upregulated and 15
downregulated following a Bonferroni adjustment). Using more
stringent methods, such as the significance analysis of microarrays
(SAM) statistical technique, 922 deregulated genes were obtained
vs. the 1,516 genes obtained by the t-test. A list of the 30 top
fold change of upregulated (Table
I) and downregulated (Table
II) genes using the SAM method is shown.
 | Table ITop 30 upregulated genes by SAM
method. |
Table I
Top 30 upregulated genes by SAM
method.
| Gene symbol | RefSeq | Description | Location
(chromosome) | Fold change |
|---|
|
C12orf69 | NM_001013698 | Chromosome 12 open
reading frame 69 | 12 | 11.72 |
| L1CAM | NM_000425 | L1 cell adhesion
molecule | X | 11.68 |
| GPR83 | NM_016540 | G protein-coupled
receptor 83 | 11 | 10.26 |
| GPR34 | NM_001097579 | G protein-coupled
receptor 34 | X | 9.71 |
| FCGBP | NM_003890 | Fc fragment of IgG
binding protein | 19 | 9.19 |
| SCN7A | NM_002976 | Sodium channel,
voltage-gated, type VII, alpha | 2 | 9.08 |
| ADAM23 | NM_003812 | ADAM
metallopeptidase domain 23 | 2 | 8.46 |
| GPR155 | NM_001033045 | G protein-coupled
receptor 155 | 2 | 7.90 |
| CDH19 | NM_021153 | Cadherin 19, type
2 | 18 | 7.81 |
| MOXD1 | NM_015529 | Monooxygenase,
DBH-like 1 | 6 | 7.74 |
| ANKRD22 | NM_144590 | Ankyrin repeat
domain 22 | 10 | 7.66 |
| GRB14 | NM_004490 | Growth factor
receptor-bound protein 14 | 2 | 7.25 |
| GFRA3 | NM_001496 | GDNF family
receptor alpha 3 | 5 | 7.07 |
| RGS1 | NM_002922 | Regulator of G
protein signaling 1 | 1 | 6.85 |
|
C10orf114 | NM_001010911 | Chromosome 10 open
reading frame 114 | 10 | 6.43 |
|
SLC16A12 | NM_213606 | Solute carrier
family 16, member 12 | 10 | 6.35 |
| P2RY12 | NM_022788 | Purinergic receptor
P2Y, G-protein coupled, 12 | 3 | 6.29 |
| CHL1 | NM_006614 | Cell adhesion
molecule with homology to L1CAM | 3 | 6.23 |
| FCGR3A | NM_000569 | Fc fragment of IgG,
low affinity IIIa, receptor | 1 | 5.89 |
| NLGN4X | NM_020742 | Neuroligin 4,
X-linked | X | 5.81 |
|
ARHGEF26 | NM_015595 | Rho guanine
nucleotide exchange factor | 3 | 5.78 |
| ALDH1A1 | NM_000689 | Aldehyde
dehydrogenase 1 family, member A1 | 9 | 5.72 |
| NCAM2 | NM_004540 | Neural cell
adhesion molecule 2 | 21 | 5.69 |
|
ARHGAP15 | NM_018460 | Rho GTPase
activating protein 15 | 2 | 5.58 |
| IFI44 | NM_006417 | Interferon-induced
protein 44 | 1 | 5.57 |
| RASSF4 | NM_032023 | Ras association
domain family member 4 | 10 | 5.52 |
| CX3CR1 | NM_001337 | Chemokine C-X3-C
motif receptor 1 | 3 | 5.50 |
| IFIT1 | NM_001548 | Interferon-induced
protein with tetratricopeptide repeats 1 | 10 | 5.48 |
| RSAD2 | NM_080657 | Radical S-adenosyl
methionine domain containing 2 | 2 | 5.47 |
| PDGFD | NM_025208 | Platelet-derived
growth factor D | 11 | 5.21 |
| Table IITop 30 downregulated genes by SAM
method. |
Table II
Top 30 downregulated genes by SAM
method.
| Gene symbol | RefSeq | Description | Location
(chromosome) | Fold change |
|---|
| FABP4 | NM_001442 | Fatty acid-binding
protein 4 | 8 | −28.98 |
| MFAP5 | NM_003480 |
Microfibrillar-associated protein 5 | 12 | −13.40 |
| DPT | NM_001937 | Dermatopontin | 1 | −9.36 |
| PLA2G2A | NM_000300 | Phospholipase A2,
group IIA | 1 | −9.00 |
| SFRP2 | NM_003013 | Secreted
frizzled-related protein 2 | 4 | −8.69 |
| PRRX1 | NM_006902 | Paired related
homeobox 1 | 1 | −8.39 |
| SLC22A3 | NM_021977 | Solute carrier
family 22, member 3 | 6 | −8.37 |
| G0S2 | NM_015714 | G0/G1 switch 2 | 1 | −7.93 |
| SLC14A1 | NM_001128588 | Solute carrier
family 14 | 18 | −7.82 |
| PI16 | NM_153370 | Peptidase inhibitor
16 | 6 | −7.42 |
| SLPI | NM_003064 | Secretory leukocyte
peptidase inhibitor | 20 | −6.87 |
| SELE | NM_000450 | Selectin E | 1 | −6.70 |
| CHI3L2 | NM_001025199 | Chitinase 3-like
2 | 1 | −6.35 |
| CCDC80 | NM_199511 | Coiled-coil domain
containing 80 | 3 | −6.26 |
| ANPEP | NM_001150 | Alanyl
aminopeptidase | 15 | −6.05 |
| S100A12 | NM_005621 | S100 calcium
binding protein A12 | 1 | −6.02 |
| PDGFRL | NM_006207 | Platelet-derived
growth factor receptor-like | 8 | −5.95 |
| CRABP2 | NM_001878 | Cellular retinoic
acid-binding protein 2 | 1 | −5.80 |
| APLNR | NM_005161 | Apelin
receptor | 11 | −5.76 |
| FAM171B | NM_177454 | Family with
sequence similarity 171, B | 2 | −5.68 |
| AQP9 | NM_020980 | Aquaporin 9 | 15 | −5.48 |
| CXCR1 | NM_000634 | Chemokine C-X-C
receptor 1 | 2 | −5.41 |
|
ADCYAP1R1 | NM_001118 | Adenylate cyclase
activating polypeptide 1 | 7 | −5.27 |
| IL1R2 | NM_004633 | Interleukin 1
receptor, type II | 2 | −5.20 |
| DSG2 | NM_001943 | Desmoglein 2 | 18 | −5.11 |
| HSPB8 | NM_014365 | Heat shock protein
8 | 12 | −5.08 |
| HHIP | NM_022475 | Hedgehog
interacting protein | 4 | −5.06 |
| THBS4 | NM_003248 | Thrombospondin
4 | 5 | −4.97 |
| PAK3 | NM_002578 | p21
protein-activated kinase 3 | X | −4.94 |
| CAV1 | NM_001753 | Caveolin-1 | 7 | −4.90 |
The main results obtained using the database web
tools are as follows:
DAVID. The clusters in DAVID were very
similar when using a p-value cut-off <0.05 or <0.001,
presenting variation primarily at the enrichment level. For the
1,065 upregulated genes in the schwannomas, the main clusters of GO
annotation were referred to as intrinsic to membrane, lysosomes,
vacuoles, cell adhesion, axonogenesis and neuron development
(Table III). For the 400
downregulated genes (Table IV),
the clusters of GO annotation were extracellular region, cell
adhesion, response to wounding, proteinaceous extracellular matrix
and plasma membrane. The most significant deregulations were
observed in the SP and PIR protein databases and the upregulated
genes included glycoprotein, disulfide bond, membrane, lysosome and
actin-binding. The downregulated genes were signal, secreted, cell
adhesion, EGF-like domain, heparin-binding and chemotaxis.
Comparisons between the schwannoma groups of the 16 differentially
expressed genes between groups 1 and 2 showed no significant
clusters. Otherwise, the differences observed between subgroups 2-I
and 2-II included enriched extracellular regions and response to
wounding.
| Table IIIDAVID clusters obtained with
upregulated genes. |
Table III
DAVID clusters obtained with
upregulated genes.
| Cluster | Enrichment
score | Category | Term | Fold
enrichment | p-value |
|---|
| 1 | 15.7 |
SP_PIR_KEYWORDS | Glycoprotein | 1.56 | 5.74e-19 |
| UP_SEQ_FEATURE | Glycosylation
site:N-linked (GlcNAc) | 1.58 | 5.04e-18 |
|
SP_PIR_KEYWORDS | Disulfide bond | 1.60 | 1.48e-11 |
| 2 | 12.7 |
SP_PIR_KEYWORDS | Glycoprotein | 1.56 | 5.74e-19 |
| UP_SEQ_FEATURE | Glycosylation
site:N-linked (GlcNAc) | 1.58 | 5.04e-18 |
|
SP_PIR_KEYWORDS | Membrane | 1.35 | 1.20e-12 |
| 3 | 9.8 | GOTERM_BP_FAT | GO:0007155-cell
adhesion | 2.10 | 1.15e-07 |
| GOTERM_BP_FAT |
GO:0022610-biological adhesion | 2.10 | 1.25e-07 |
|
SP_PIR_KEYWORDS | Cell adhesion | 2.38 | 1.79e-06 |
| 4 | 9.3 |
SP_PIR_KEYWORDS | Lysosome | 4.17 | 1.45e-10 |
| GOTERM_CC_FAT | GO:0000323-lytic
vacuole | 2.93 | 5.08e-07 |
| GOTERM_CC_FAT |
GO:0005764-lysosome | 2.93 | 5.08e-07 |
| 5 | 4.8 | GOTERM_BP_FAT | GO:0009611-response
to wounding | 1.88 | 0.006957 |
| GOTERM_BP_FAT |
GO:0006954-inflammatory response | 2.02 | 0.106629 |
| GOTERM_BP_FAT | GO:0006952-defense
response | 1.70 | 0.116900 |
| 6 | 4.7 | GOTERM_BP_FAT | GO:0048666-neuron
development | 2.14 | 0.007170 |
| GOTERM_BP_FAT | GO:0048812-neuron
projection morphogenesis | 2.46 | 0.011071 |
| GOTERM_BP_FAT |
GO:0007409-axonogenesis | 2.54 | 0.011999 |
| 7 | 4.5 | GOTERM_CC_FAT | GO:0044459-plasma
membrane part | 1.36 | 6.55e-04 |
| GOTERM_CC_FAT | GO:0005887-integral
to plasma membrane | 1.42 | 0.054804 |
| GOTERM_CC_FAT |
GO:0031226-intrinsic to plasma
membrane | 1.41 | 0.057849 |
| Table IVDAVID clusters obtained with
downregulated genes. |
Table IV
DAVID clusters obtained with
downregulated genes.
| Cluster | Enrichment
score | Category | Term | Fold
enrichment | p-value |
|---|
| 1 | 19.0 |
SP_PIR_KEYWORDS | Signal | 2.16 | 2.39e-19 |
| UP_SEQ_FEATURE | Signal peptide | 2.16 | 8.97e-19 |
| UP_SEQ_FEATURE | Disulfide bond | 2.39 | 2.56e-18 |
| 2 | 9.5 | GOTERM_BP_FAT | GO:0009611-response
to wounding | 3.28 | 1.14e-07 |
| GOTERM_BP_FAT | GO:0006952-defense
response | 3.01 | 5.49e-07 |
| GOTERM_BP_FAT |
GO:0006954-inflammatory response | 3.80 | 5.78e-06 |
| 3 | 7.8 |
SP_PIR_KEYWORDS | Glycoprotein | 1.95 | 2.13e-17 |
| UP_SEQ_FEATURE | Glycosylation
site:N-linked (GlcNAc) | 1.97 | 2.00e-16 |
| UP_SEQ_FEATURE | Topological
domain:Extracellular | 1.88 | 2.68e-06 |
| 4 | 7.4 | GOTERM_CC_FAT |
GO:0005578-proteinaceous extracellular
matrix | 3.55 | 5.92e-06 |
| GOTERM_CC_FAT |
GO:0031012-extracellular matrix | 3.40 | 7.90e-06 |
|
SP_PIR_KEYWORDS | Extracellular
matrix | 4.14 | 3.77e-05 |
| 5 | 5.6 | GOTERM_CC_FAT | GO:0005886-plasma
membrane | 1.53 | 9.68e-06 |
| GOTERM_CC_FAT | GO:0005887-integral
to plasma membrane | 1.91 | 6.95e-04 |
| GOTERM_CC_FAT |
GO:0031226-intrinsic to plasma
membrane | 1.87 | 0.001409 |
| 6 | 4.7 |
SP_PIR_KEYWORDS | Cell adhesion | 3.03 | 7.46e-04 |
| GOTERM_BP_FAT | GO:0007155-cell
adhesion | 2.13 | 0.111463 |
| GOTERM_BP_FAT |
GO:0022610-biological adhesion | 2.13 | 0.113672 |
| 7 | 4.5 |
SP_PIR_KEYWORDS | EGF-like
domain | 5.62 | 9.60e-10 |
| INTERPRO | IPR013032:EGF-like
region, conserved site | 4.10 | 3.54e-06 |
| INTERPRO | IPR000742:EGF-like,
type 3 | 5.03 | 4.69e-06 |
Reactome. Using NM_ annotation, the average
expression of control nerves and schwannomas for every deregulated
gene was entered into this web tool. Upregulation of axon guidance
(Table V) and signal transduction
pathways (Table VI) were the most
significative events registered using this tool and deregulated
genes included ErbB2, NRG1, EGFR,
L1CAM, DCX and ERBB2IP. Other deregulated
signal pathways in our study included cytokine signaling in the
immune system (available upon request) and cell metabolism
(available upon request).
| Table VAxon guidance in vestibular
schwannomas. |
Table V
Axon guidance in vestibular
schwannomas.
| Pathway | Description |
|---|
| Semaphorin
interactions | The semaphorins 7A,
6D and 5A were overexpressed, as was the 5A receptor plexin-B3. In
this pathway, Talin-1 (TLN1) also appeared to be
overexpressed. |
| Neural cell
adhesion molecule 1 (NCAM) signaling for neurite outgrowth | NCAM1 gene,
ribosomal protein S6 kinase, 90 kDa, polypeptide 5 (RPS6KA5)
and son of sevenless homolog 1 (SOS1) were overexpressed,
presumably upregulating MAP/kinases cascades according to this
pathway. |
| Netrin-1
signaling | These genes play a
vital role in axon guidance and neural migration during the
development of the nervous system. The NCK1 [which
associates with the actin cytoskeleton mediated by DCC
(deleted in colorectal cancer) and recruits Rac, Cdc42 and their
effectors Pak and N-WASP in neurons] and the NTN4 genes were
overexpressed. |
| L1 cell adhesion
molecule (L1CAM) interactions | L1CAM,
activated leukocyte cell adhesion molecule (ALCAM),
NCAM1 and contactin 1 (CNTN1) were upregulated, while
EGFR and doublecortin (DCX) were downregulated. |
| Robo receptor
signaling | The slit homolog 2
(SLIT2) was upregulated in this pathway, while its receptor,
ROBO1, appeared to be downregulated. |
| Table VISignal transduction in vestibular
schwannomas. |
Table VI
Signal transduction in vestibular
schwannomas.
| Pathway | Description |
|---|
| G protein-coupled
receptor (GPCR) signaling | There are more than
800 GPR genes in the genome. These receptors activate adenyl
cyclase to produce cAMP from ATP, or in the phosphatidylinositol
pathway to produce a cell response, depending on the context.
Sixteen of these receptors were deregulated in our tumor series
(available upon request). |
| EGFR signaling | This receptor was
markedly downregulated. In addition, SOS1 (present in cytosol) was
upregulated in this pathway. |
| ErbB2
signaling | The ligand NRG1 and
its receptors ErbB2 and ErbB3 were upregulated. The ErbB2
interacting protein (ERBB2IP) was also upregulated. However,
the ErbB4 signaling pathway was not deregulated. |
| Integrin cell
surface interactions | Integrin αIIb β3
signaling presented four upregulated elements. The amyloid β (A4)
precursor protein-binding family B member 1-interacting protein
(APBB1IP) and downstream effector Talin-1 (TLN1) were
upregulated. This upregulation provoked the activation of integrin
αIIb β3 and the subsequent activation of tyrosine-protein kinase
SYK (SYK), which was also upregulated, by Src. |
WebGestalt. The transcription factor target
analysis showed significant enrichment of the forkhead box O4
(FOXO4), neurofibromin 1 (NF1) and lymphoid
enhancer-binding factor 1 (LEF1) genes with the algorithm
used in this program, when compared with the 1,465 deregulated
genes. When the upregulated genes were analyzed individually, only
FOXO4 was significant, whereas the downregulated genes exhibited
more than 20 significant transcription factor target sites, even
after statistical adjustment. These downregulated genes included
NF1, FOXO4, androgen receptor (AR) and zinc
finger protein, subfamily 1A, 1 (IKZF1). By WikiPathways
analysis and using the list of upregulated genes in schwannomas,
focal adhesion and Toll-like receptor signaling were significantly
affected. When only the downregulated genes were analyzed, the most
significantly affected were adipogenesis, hedgehog signaling and
regulation of actin cytoskeleton. When both up- and down-regulated
genes were analyzed, focal adhesion, α6β4 integrin signaling and
type II interferon signaling were significantly affected. With
cytogenetic band analysis, we found chromosomal arm 4q and 1q31
band to be significantly enriched in the list of upregulated genes.
Those on the downregulated list were enriched at the 12p12
band.
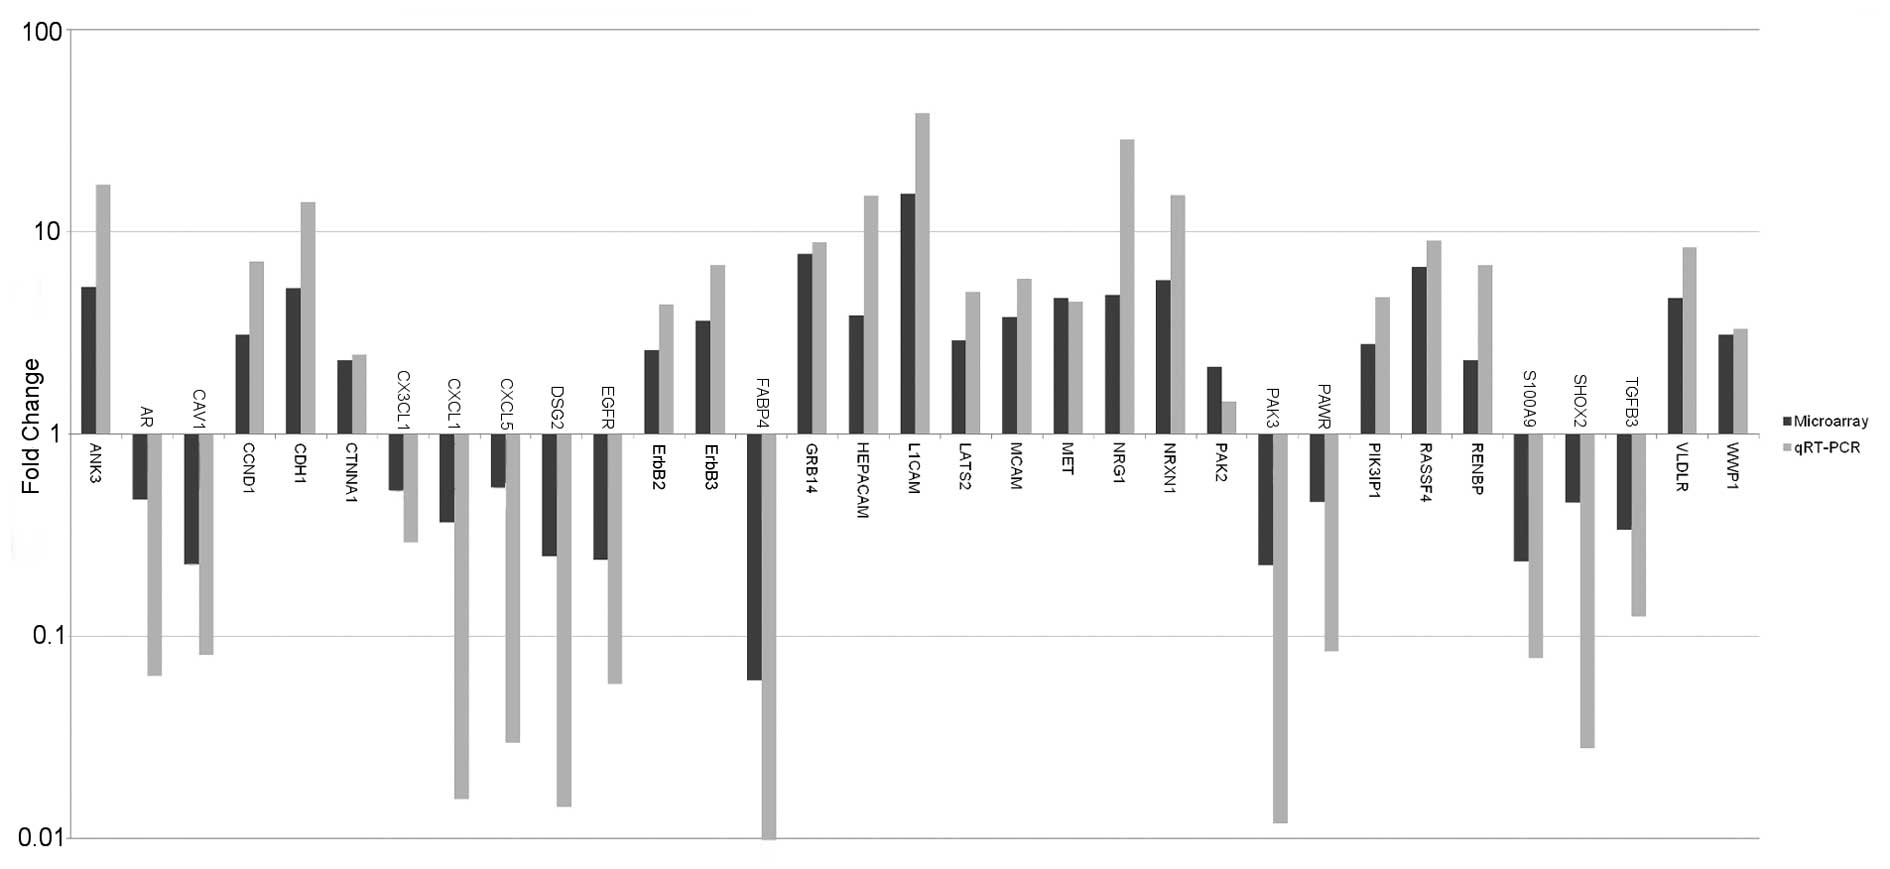
qRT-PCR validation
Validation of the expression pattern of 48 genes
obtained by microarray analysis was performed by qRT-PCR (available
upon request). In all cases, the trend observed in the microarrays
(upregulation, downregulation or no deregulation) was confirmed by
our experiments (Fig. 4). The fold
change was usually larger in the qRT-PCR than in the microarray
analysis, a phenomenon that is well-established due to the wider
dynamic range of the qRT-PCR technique (40 and available upon
request).
NF2 mutational analysis by PCR/dHPLC,
MLPA and LOH of the 22q status
A total of 17 tumors (55%) displayed NF2
sequence variations by PCR/dHPLC, 3 of which had 2 mutations, with
a total of 20 mutations detected. Ten small deletions between 1 and
15 bp were the most common alteration (50%), followed by 9 point
mutations (45%) and 1 small insertion (3%). The most frequent
mutation detected was the nonsense p.Arg57Stop (nucleotide change
c.169C>T), which was present in 3 tumors at exon 2 of the
NF2 gene. Tumor 399, present in a patient with NF2, also
showed the mutation in the peripheral blood sample. No other
mutation was detected in more than one sample. Most sequence
changes were at exon 4 (5 cases), followed by exon 2 (4 cases) and
exon 5 (2 cases); exons 3, 6 and 9 were not affected by any
mutation. The first half of the NF2 gene (exons 2–8)
accumulated 65% of the total mutations. Using 5 microsatellites
markers, an LOH of 22q11–q12.3 occurred in 18 of the 31 (58%)
tumors. In 13 cases, the LOH appeared along with a PCR/dHPLC
alteration. In addition to the cases that were compatible with the
total loss of an NF2 allele, the MLPA for analysis of the
NF2 gene (SALSA P044), showed deletions of at least one exon
in 6 tumors (19%). In 2 of these cases, the MLPA deletion
corresponded to exon 2, which also displayed both sequence
variations (at exon 2) and LOH of 22q, suggesting that this
particular finding by MLPA could be considered an artifact.
Alternatively, the presence of mosaicism in these tumors should not
be discarded.
In conclusion, we found at least 2 inactivating hits
in the NF2 tumor suppressor gene in 16 (52%) specimens
(Table VII). Two of these
specimens were exclusively due to 2 mutations in the NF2
sequence; 2 of the tumors had 2 hits due to an MLPA alteration
(excluding the possible artifact) adding to the LOH of 22q. The
remainder presented this pattern due to a combination of LOH of 22q
and a sequence mutation found by MLPA and/or PCR/dHPLC. Seven cases
(23%) displayed a single hit; 4 with LOH of 22q, 2 with a mutation
detected by PCR/dHPLC and 1 with a deletion found by MLPA. Eight
out of the 31 (26%) tumors in our series did not show any molecular
alteration in the NF2 gene.
| Table VIIAlterations detected in each tumor
sample. |
Table VII
Alterations detected in each tumor
sample.
| Sample | 22q statusa | Nucleotide | Codon | Peripheral blood
status | MLPAb | NF2 hits
detectedc |
|---|
| 350 | LOH | 169C>T | p.Arg57Stop | - | −/del ex.2 | 2 |
| 352 | LOH | 447G>A | p.= | - | +/− | 2 |
| 354 | LOH | −/− | - | - | +/del ex.14–17 | 2 |
| 369 | N | −/− | - | - | −/− | 0 |
| 371 | LOH | 1592delA |
p.Lys531Argfs* | - | −/− | 2 |
| 373 | LOH | 663C>G | p.Tyr221Stop | - | +/− | 2 |
| 374 | LOH | IVS10+1G>A | - | - | +/− | 2 |
| 399 | LOH | 169C>T | p.Arg57Stop | Mutated | +/del ex.2 | 2 |
| 407 | N | −/− | - | - | −/− | 0 |
| 417 | N | −/− | - | - | −/− | 0 |
| 422 | LOH | 737delC |
p.Pro246Leufs* | - | +/− | 2 |
| 437 | LOH | 401delC |
p.Pro134Leufs* | - | +/del ex.4 | 3 |
| 444 | LOH | IVS4-1 G>A | - | - | +/− | 2 |
| 447 | LOH |
1439_1446+19del27 |
p.Thr480Serfs* | - | +/− | 2 |
| 449 | LOH | 436_443del8 |
p.Val146Glnfs* | - | −/− | 2 |
| 450 | LOH | 1076insT |
p.R359Mfs* | - | +/− | 2 |
| 458 | LOH | 469G>A | p.Ser156Asn | - | +/del ex.5.14 | 4 |
| | 467_476del10 |
p.P155Qfs* | | | |
| 467 | N | −/− | - | - | −/− | 0 |
| 471 | N | −/− | - | - | −/− | 0 |
| 473 | LOH | −/− | - | - | −/− | 1 |
| 474 | N | −/− | - | - | −/del ex.4 | 1 |
| 482 | LOH | −/− | - | - | +/− | 1 |
| 486 | N | 169C>T | p.Arg57Stop | - | −/− | 2 |
| | IVS14-26del22 | - | | | |
| 488 | N | −/− | - | - | −/− | 0 |
| 490 | N | 1230_1243del14 |
p.Gln410Hisfs* | - | −/− | 1 |
| 491 | N | −/− | - | - | −/− | 0 |
| 505 | N | 206delA |
p.Lys69Argfs* | - | −/− | 1 |
| 506 | N | −/− | - | - | −/− | 0 |
| 507 | N | 414delT |
p.Val139Cysfs* | - | −/− | 2 |
| | 1600C>T | p.His534Tyr | Mutated | | |
| 509 | LOH | −/− | - | - | +/− | 1 |
| 510 | LOH | −/− | - | - | −/− | 1 |
Alternative splicing analysis
In addition to gene analysis, gene ST arrays offer
the possibility of a limited analysis of alternative splicing in
several genes. Therefore, we performed the analysis on individual
gene probes. We found neurexin genes showing alternative splicing
in tumors compared with the pattern shown by controls. All 3
neurexins presented a long (α) and short (β) form coded by 2
different promoters, which may generate more than 1,000 isoforms
through alternative splicing. In the neurexin-1 gene
(NRXN1), transcript α (NM_004801) showed upregulation, while
there was no variation in the expression of specific probes for
transcript NM_138735. The neurexin-2 gene (NRXN2) showed
downregulation of 3 out of the 23 probes of the α isoform
(NM_015080) and no change in the β isoform (NM_138734). The
neurexin-3 gene (NRXN3) showed upregulation of the β isoform
NM_138970 and downregulation of the α isoform NM_004796-specific
probes. Finally, the neuroligin-4X gene (NGLN4X) presented
an overexpressed NM_181332 isoform and showed no changes in
NM_020742.
Molecular and clinical correlation with
arrays
The correlations between the molecular information
of the tumor and the data from the microarray study were as
follows: NF2 mutated by dHPLC analysis vs. not mutated;
NF2 mutated by both dHPLC and MLPA P044 vs. not mutated; 22q
LOH present vs. no 22q LOH; 2 or more hits in NF2 vs. 1 or
no hits. In each comparison, a group of 1 to 15 genes with
significant p-values appeared to be deregulated (available upon
request); however, none of the genes were deregulated when the
p-value was Bonferroni-corrected.
The correlations with clinical features included the
following: male vs. female; homogeneous vs. heterogeneous vs.
cystic tumor; NF2 syndrome-associated tumor vs. sporadic; smokers
vs. non-smokers; high body mass index (BMI) vs. normal or low BMI;
all variations in the 4 grades of the KOOS scale; involvement of
the internal auditory canal or lack thereof; brainstem compression
or lack thereof; pre-operative audiological class (in 4 groups);
and left-side vs. right-side tumor. No significant
Bonferroni-adjusted deregulated genes were found using these
clinical outcomes, with the exception of Y-chromosome genes when
males and females were compared. No exclusive clinicopathological
similarities were found within schwannoma groups 1, 2-I and 2-II,
even with the 3 NF2-associated samples distributed among all
groups.
Discussion
We performed a microarray analysis and validation by
qRT-PCR on 31 vestibular schwannomas and 9 control samples, in
order to reveal targets and clues for the treatment of this
neoplasm. Describing a global mRNA status in a single article is an
impossible goal. We therefore selected genes that were
well-established as deregulated in these tumors to verify our
results and then focused on deregulated genes in other tumors, as
well as in our series, that had been insufficiently studied or not
studied at all in schwannomas, such as MET, AR or
CAV1.
NRG1 and ErbB2-ErbB3 signaling pathway, a
verification of deregulation
In 2003, malignant peripheral nerve sheath tumors
were found with constitutively activated NRG1/ErbB signaling
(41). This pathway was later
reported to be activated in schwannomas (42,43).
Our results concur with those of previous studies regarding gene
expression values compatible with overexpression (NRG1:
28.6-fold, p=2.94e-5; ErbB2: 4.38-fold, p=2.94e-5;
ErbB3: 6.87-fold, p=8.54e-5). Ligand NRG1 binds to the ErbB2
receptor, which causes the ligand to bind with ErbB3 and downstream
signaling leads to Schwann cell survival, migration, proliferation
and differentiation (reviewed in 44). Merlin, which is presumably
absent in all schwannomas, has been found to block ErbB2-Src
signaling (45). We therefore
validated the NRG1 and ErbB2-ErbB3 signaling pathway, which was
previously reported and well-established as deregulated in
schwannomas, using arrays and qRT-PCR, demonstrating that although
we obtained control nerves from different regions (including the
sensory and motor branches), our results are in agreement as
regards this pathway.
TGFβ and PAK signaling
A member of this pathway is the ErbB2 interacting
protein (ERBB2IP), which was upregulated in our series
(2.41-fold, p= 0.023). This protein regulates signaling and
myelination (46) and has been
found to cooperate with merlin by blocking PAK2 activation induced
by TGFβ signaling (47). Our
results demonstrated that PAK2 was slightly upregulated
(1.45-fold, p=0.006805) and TGFβ3 was down-regulated
(−8-fold, p=2.25e-5). Moreover, TGFβ1, TGFβR1 and
TGFβR2 were upregulated in schwannomas, in contrast with
previous reports, where no evident changes were observed (48). In contrast to PAK2
expression, PAK3 was downregulated (−76-fold, p=4.02e-7) and
PAK1 was not affected. Thus, TGFβ and PAK signaling may
cooperate in schwannoma development and/or maintenance, although
further research is required to elucidate the underlying
mechanism.
EGFR downregulation, a controversial
state
In contrast to ErbB2 and ErbB3,
EGFR (another receptor of this family) was downregulated in
schwannomas (−17.3-fold, p=2.26e-12). Previous studies have
suggested that this receptor is mediated for internalization and is
retained in an insoluble membrane compartment by merlin via NHE-RF1
(SLC9A3R1) (11,49). The expression of EGFR seems
to be restrained in schwannomas. However, its function as an
activator of cell proliferation cannot be ruled out, since EGFR may
still be signaling downstream in a merlin-absent context, despite
the lack of proliferation of the human schwannoma cells following
exposure to the ligand EGF (50),
in contrast to non-tumoral vestibular cells (51). Previous studies have described no
EGFR expression (52,53),
whereas other studies have shown EGFR upregulation (54). Therefore, no firm conclusion was
reached as regards the role of this receptor in schwannomas.
CAV1 downregulation: A broad spectrum of
mechanisms
Another proposed pathway for the internalization of
EGFR is CAV1-mediation followed by DNA damage (55). CAV1 encodes for caveolin-1,
a protein involved in caveolae formation. We demonstrated that this
gene is downregulated in schwannomas (−12.4-fold, p=2.27e-5), in
agreement with the results of Aarhus et al(25). CAV1 loss accelerates proliferation
and cooperates in oncogenic transformation (56). Furthermore, Brennan et
al(57) proposed a model by
which desmoglein 2 (DSG2) could be cleared from the plasma
membrane and possibly activate mitogenic cell signaling through its
interaction with CAV1. In a CAV1-loss context, these desmogleins
could disrupt and affect cell-cell adhesion. Our results showed the
downregulation of both DSG2 (−70-fold, p=2.94e-5) and
CAV1 genes. Thus, the role of CAV1-DSG2 does not appear to
be paramount in schwannomas, suggesting that expression changes in
these genes must be related to other biological consequences.
CAV1 expression variants may participate in other pathways
through different mechanisms, as explained below.
Heat shock protein deregulation; a
consequence of the lack of caveolin-1?
Recently, Ciocca et al(58) showed that breast tumor onset and
reduced apoptosis driven by Her-2/neu expression were accelerated
in mice lacking CAV1; the absense of CAV1 alters the expression of
several stress-related proteins, such as heat shock proteins
(HSPs). In our series, 5 HSPs were deregulated (HSPA12A:
3.31-fold, p=4.34e-4; HSPA13: 2.54-fold, p=0.0035;
HSPA4L: 2.38-fold, p=1.17e-4; HSPB6: −2.19-fold,
p=5.76e-4; HSPB8: −3.77-fold, p=0.001), suggesting that the
CAV1/HSPs interaction may also play a role in schwannomas.
Immunoglobulin superfamily and L1 family
proteins
The HEPACAM gene, which encodes a cell
adhesion molecule of the immunoglobulin family, was upregulated
(14.9-fold, p=6.58e-4), in contrast to malignant tumors such as
hepatocellular carcinoma, in which it is usually downregulated
(59). This protein interacts with
the F-actin cytoskeleton and cell-extra-cellular matrix and is
required to modulate cell motility (60). CAV1 downregulates HEPACAM signal
transduction in lipid rafts/caveolae (61), a common mechanism of action for
this gene. Other members of the immunoglobulin superfamily, in
particular L1 family proteins, were also upregulated in our
experiments. These members included L1 (L1CAM: 38.31-fold,
p=2.94e-5), CHL1 (CHL1: 8.51-fold, p=1.52e-4) and NrCAM
(NRCAM: 5.50-fold, p=2.26e-4). These results coincide with
those previously reported (62).
Neurofascin (NFASC), the last L1 family member, presented a
normal expression level, while its associated protein doublecortin
(DCX) was downregulated (−2.46-fold, p=5.93e-4). The L1
family has been shown to participate mainly in nervous system
processes, such as neurite outgrowth (63), but has also been involved in
non-neural roles, such as cancer progression (64). Therefore, HEPACAM gene
overexpression concomitant with CAV1 downregulation may
participate in schwannoma development and/or maintenance and some
members of the immunoglobulin superfamily appear deregulated in
schwannomas.
Androgen receptor downregulation: A
hormonal cause or consequence of schwannomas?
Androgen receptor for dihydrotestosterone
(AR), which was downregulated in our series (−15.7-fold,
p=2.94e-5), is a steroid hormone nuclear receptor and is a target
in prostate cancer treatment by androgen deprivation. This type of
cancer frequently evolves into a resistant androgen-independent
prostate cancer by mutations in AR(65). An androgen-dependent interaction
has been established between the NH2 terminus region of CAV1 and
the NH2 terminal domain and ligand-binding domain of AR (66). CAV1 is also a co-activator of AR
and may enhance AR ligand-dependent transcriptional activation in
the presence of androgen (67).
Our results demonstrated that the mRNA levels of both transcripts
were downregulated, suggesting that there may be a mechanism by
which AR and CAV1 are related to the development and/or maintenance
of schwannomas. There were no differences between males and females
in terms of AR at the mRNA level. Dexamethasone, frequently
used as postoperative treatment to decrease brainstem and cranial
nerve inflammation, may downregulate AR levels. In the present
series, none of the patients received this drug prior to
surgery.
Apoptotic PAWR downregulation
In the absence of androgen signaling or AR
silencing, the apoptotic pathway should be activated by prostate
apoptosis response 4 (PAWR) through the transcription of
c-FLIP, as previously reported (68). PAWR is also an activator of
myosin phosphatase (69) and can
dephosphorylate merlin in non-mutated tissues and recover its
anti-tumor function. In our study, PAWR was found to be
underexpressed (−11.9-fold, p=2.94e-5), as previously reported in
other tumors, such as renal cell carcinoma (70) and neuroblastoma (71). Likewise, PAWR-null mice were shown
to exhibit an increased rate of developing tumors, particularly in
hormone-dependent tissues (72).
Therefore, in schwannoma cells, apoptosis mediated by CAV1-AR-PAWR
does not seem to occur due to the downregulation of PAWR
mRNA in the tumor cells. There must, therefore, be another role for
these downregulated molecules in schwannoma.
MET pathway, a core network in
schwannomas
At the protein level, the AKT1 signaling pathway
has been shown to restrain PAWR in the cytosol by phosphorylation,
inhibiting its function as a proapoptotic factor in the nucleus
(73). In schwannomas, the AKT
pathway has been found to be activated (74) and it is well established that PI3K
is an activator of AKT (75).
Phosphoinositide-3-kinase interacting protein 1 (PIK3IP1)
(76), an inhibitor of PI3K, was
upregulated (4.76-fold, p=2.94e-5) as was the PI3K activator MET
(4.5-fold, p=2.94e-5) and related genes. Therefore, PI3K activation
of AKT seems possible via MET signaling based on the mRNA analysis,
although PIK3IP1 is supposed to block PI3K. MET is a
tyrosine kinase receptor involved in the activation of several
cellular mechanisms, such as proliferation, motility, migration and
invasion through different pathways, depending on the activating
signal. MET is transactivated by several mechanisms, such as its
ligand HGF, ErbB3 receptor, α6β4 integrins, CD44 and G-coupled
proteins (reviewed in 77). In schwannomas, MET and its ligand HGF
were expressed in all analyzed samples, as determined by qRT-PCR
and immunohistochemistry (78),
although no healthy tissue was used as the control; therefore, no
alterations of expression were established. CAV1, which is
downregulated in schwannomas, has been found to inhibit MET
signaling in osteosarcoma transformation (79), which suggests that if this
mechanism is analogous, CAV1 downregulation could trigger MET
signaling in schwannomas. Moreover, the neural development
molecules semaphorin 5A and plexin-B3 were overexpressed
(SEMA5A: 3.14-fold, p=3.64e-5; PLXB3: 2.28-fold,
p=5.05e-5) and able to trigger the intracellular signaling of MET
(80). Finally, secreted
phospho-protein 1/osteopontin (SPP1), an enhancer of MET
activator protein CD44, is upregulated (5.8-fold, p=9.23e-4). Due
to its involvement in several deregulated signals, the MET pathway
seems to exert a pivotal role in schwannoma development and CAV1
may also exert its protumoral effect in this manner.
Absence of merlin may be due to more than
just mutational mechanisms
We detected 22q LOH alterations in 58% of the
samples, a finding that agrees with previous reports (4). Furthermore, 64.5% of the tumors had
at least 1 hit in the sequence analysis by the combination of
PCR/dHPLC and MLPA. This is also in agreement with previously
reported data (4), although the
percentage is lower in comparison to other studies (25). Despite the molecular analysis
performed, 26% of the samples did not exhibit mutations and
NF2 mRNA expression was not manifestly deregulated
(available upon request), as in previous reports (25). Therefore, other mechanisms may
cause the complete absence of merlin in schwannomas (5). The merlin protein is degraded by
ubiquitination in advanced breast cancer due to
osteopontin-initiated signaling via AKT (14). As PI3K/AKT activation occurs
through ErbB3 and MET (77),
which, as mentioned above, was upregulated in our series, we
suggest that SPP1 upregulation, in addition to the mutations
of the NF2 gene and 22q LOH, may lead to the complete
absence of the merlin protein in schwannomas, even in samples with
no hits in the NF2 gene and taking into consideration that
epigenetic inactivation of this gene seems to be a rare event in
schwannomas (17–21).
Schwannoma cells are pre-myelinated
cells
The development of myelinating and non-myelinating
Schwann cell lineages includes 3 states: Neural crest cells that
give rise to the Schwann cell precursors, which evolve into the
immature Schwann cells (81). Our
results using the database web tools demonstrate enriched
axonogenesis and neuronal development, suggesting that schwannoma
cells may be in a pre-differentiation state, as previously reported
(62). In light of our results,
the expression pattern obtained in schwannomas seems to be
intermediate between the Schwann cell precursor and the neural
crest cell. Both states, as well as schwannomas, exclusively
overexpress α4-integrin (ITGA4, 1.8-fold, p= 0.003), AP2a
(TFAP2A, 1.41-fold, p= 0.009) and Ncad (CDH2,
4.5-fold, p=5.42e-4). Cad19 (CDH19), which is only expressed
in the Schwann cell precursor (82), is overexpressed in schwannomas
(10.8-fold, p=6.54e-5). However, BFABP, DHH, P0, PMP22 and PLP are
not overexpressed in schwannomas or neural crest cells, but only in
Schwann cell precursors. Therefore, based on these findings, it is
difficult to specify which state (between the neural crest and
Schwann cell precursor) is most similar to that found in
schwannomas; however, it seems clear that the gene expression
pattern of these tumors corresponds to a previous state of
myelinating Schwann cells.
Vestibular schwannoma grouping; fact or
artifact?
Similarly to previous reports (25,83),
2 mRNA expression groups in schwannoma were found in our study;
however, although several genes were differentially expressed
between groups of schwannomas, no major differences were observed
between the groups. Furthermore, the absence of deregulated genes
at the Bonferroni-adjusted level (except for males vs. females)
between different tumor characteristics (e.g., homogeneous,
heterogeneous or cystic; schwannomas from NF2 patients and
sporadic; and different tumor sizes) indicate that, at least at the
mRNA expression level, there are no significant differences among
vestibular schwannomas based on our experiments. Although 2 groups
were identified, the homogeneity of the expression exhibited by
several genes suggests that a potential therapeutic target could be
suitable for all NF2 and sporadic vestibular schwannoma
patients.
Gene NF1. NF1 was faintly upregulated
(1.88-fold, p=0.012). The transcription factor target analysis
using the WebGestalt tool showed that this gene was enriched,
suggesting that schwannomas may also be related to NF1
deregulation.
Alternative splicing; a possible
mechanism of tumorigenesis in schwannomas
Neurexins and neuroligins play essential roles in
the development and function of the synapses in the nervous system,
as well as in vessel tone and angiogenesis in the vascular system
(84). Our results demonstrate a
clear, distinct pattern in tumors compared with controls in the
various isoforms available in the Gene 1.0 ST arrays. Thus,
different isoforms of neurexins and neuroligins may appear in
schwannomas compared with non-tumoral nerves. Further studies are
warranted, with more specific arrays for alternative splicing, to
identify other genes exhibiting this phenomenon.
Conclusions
In conclusion, based on our array expression
pattern of 31 tumors and 9 controls and the validation of 48 genes
by qRT-PCR, we discovered that the expression profile of vestibular
schwannomas returns to a prior state which is similar to a Schwann
precursor cell state rather than to mature myelinating Schwann
cells. Our findings also demonstrate that the MET signaling
pathway, which is possibly enhanced by the upstream signaling of
SPP1, ITGA4/B6, PLEXNB3/SEMA5A
and CAV1, appears to play a paramount role in the
development and maintenance of vestibular schwannoma. A hormonal
effect may also be involved in tumor formation, based on the
deregulation of androgen receptor (AR). In addition, there were no
expression differences between NF2-associated and sporadic tumors.
Finally, osteopontin upregulation may contribute to merlin
degradation in schwannomas with no apparent genetic (22q LOH and/or
mutation) NF2 inactivation.
Acknowledgements
The authors would like to thank
Carolina Peña-Granero for her excellent technical assistance,
Herbert Auer for his assistance with the array analysis and J.A.
Fresno and A. Gamez for assistance with qRT-PCR. This study was
supported by grants PI07/0577, PI08/1849 and PI10/1972 from Fondo
de Investigaciones Sanitarias, Ministerio de Ciencia e Innovación,
Spain and PI10-045, and from the Fundación Sociosanitaria de
Castilla-La Mancha, Spain.
References
|
1
|
Roosli C, Linthicum FH Jr, Cureoglu S and
Merchant SN: What is the site of origin of cochleovestibular
schwannomas? Audiol Neurootol. 17:121–125. 2012. View Article : Google Scholar : PubMed/NCBI
|
|
2
|
Evans DG, Sainio M and Baser ME:
Neurofibromatosis type 2. J Med Genet. 37:897–904. 2000. View Article : Google Scholar
|
|
3
|
Rouleau GA, Merel P, Lutchman M, et al:
Alteration in a new gene encoding a putative membrane-organizing
protein causes neuro-fibromatosis type 2. Nature. 363:515–521.
1993. View Article : Google Scholar : PubMed/NCBI
|
|
4
|
Hadfield KD, Smith MJ, Urquhart JE, et al:
Rates of loss of heterozygosity and mitotic recombination in NF2
schwannomas, sporadic vestibular schwannomas and schwannomatosis
schwannomas. Oncogene. 29:6216–6221. 2010. View Article : Google Scholar : PubMed/NCBI
|
|
5
|
Stemmer-Rachamimov AO, Xu L,
Gonzalez-Agosti C, et al: Universal absence of merlin, but not
other ERM family members, in schwannomas. Am J Pathol.
151:1649–1654. 1997.PubMed/NCBI
|
|
6
|
Yi C, Troutman S, Fera D,
Stemmer-Rachamimov A, et al: A tight junction-associated
Merlin-angiomotin complex mediates Merlin’s regulation of mitogenic
signaling and tumor suppressive functions. Cancer Cell. 19:527–540.
2011.PubMed/NCBI
|
|
7
|
James MF, Han S, Polizzano C, et al:
NF2/merlin is a novel negative regulator of mTOR complex 1, and
activation of mTORC1 is associated with meningioma and schwannoma
growth. Mol Cell Biol. 29:4250–4261. 2009. View Article : Google Scholar : PubMed/NCBI
|
|
8
|
Hamaratoglu F, Willecke M, Kango-Singh M,
et al: The tumour-suppressor genes NF2/Merlin and Expanded act
through Hippo signalling to regulate cell proliferation and
apoptosis. Nat Cell Biol. 8:27–36. 2006. View Article : Google Scholar : PubMed/NCBI
|
|
9
|
Okada T, Lopez-Lago M and Giancotti FG:
Merlin/NF-2 mediates contact inhibition of growth by suppressing
recruitment of Rac to the plasma membrane. J Cell Biol.
171:361–371. 2005. View Article : Google Scholar : PubMed/NCBI
|
|
10
|
Lallemand D, Manent J, Couvelard A, et al:
Merlin regulates transmembrane receptor accumulation and signaling
at the plasma membrane in primary mouse Schwann cells and in human
schwannomas. Oncogene. 28:854–865. 2009. View Article : Google Scholar
|
|
11
|
Curto M, Cole BK, Lallemand D, Liu CH and
McClatchey AI: Contact-dependent inhibition of EGFR signaling by
Nf2/Merlin. J Cell Biol. 177:893–903. 2007. View Article : Google Scholar : PubMed/NCBI
|
|
12
|
Li W, You L, Cooper J, et al: Merlin/NF2
suppresses tumorigenesis by inhibiting the E3 ubiquitin ligase
CRL4(DCAF1) in the nucleus. Cell. 140:477–490. 2010. View Article : Google Scholar : PubMed/NCBI
|
|
13
|
Li W, Cooper J, Karajannis MA and
Giancotti FG: Merlin: a tumour suppressor with functions at the
cell cortex and in the nucleus. EMBO Rep. Feb 21–2012.(Epub ahead
of print). View Article : Google Scholar
|
|
14
|
Morrow KA, Das S, Metge BJ, et al: Loss of
tumor suppressor Merlin in advanced breast cancer is due to
post-translational regulation. J Biol Chem. 286:40376–40385. 2011.
View Article : Google Scholar : PubMed/NCBI
|
|
15
|
Leone PE, Bello MJ, Mendiola M, et al:
Allelic status of 1p, 14q, and 22q and NF2 gene mutations in
sporadic schwannomas. Int J Mol Med. 1:889–892. 1998.PubMed/NCBI
|
|
16
|
Warren C, James LA, Ramsden RT, Wallace A,
Baser ME, Varley JM and Evans DG: Identification of recurrent
regions of chromosome loss and gain in vestibular schwannomas using
comparative genomic hybridisation. J Med Genet. 40:802–806. 2003.
View Article : Google Scholar : PubMed/NCBI
|
|
17
|
Kino T, Takeshima H, Nakao M, et al:
Identification of the cis-acting region in the NF2 gene promoter as
a potential target for mutation and methylation-dependent silencing
in schwannoma. Genes Cells. 6:441–454. 2001. View Article : Google Scholar : PubMed/NCBI
|
|
18
|
Gonzalez-Gomez P, Bello MJ, Alonso ME, et
al: CpG island methylation in sporadic and neurofibromatis type
2-associated schwannomas. Clin Cancer Res. 9:5601–5606.
2003.PubMed/NCBI
|
|
19
|
Kullar PJ, Pearson DM, Malley DS, Collins
VP and Ichimura K: CpG island hypermethylation of the
neurofibromatosis type 2 (NF2) gene is rare in sporadic vestibular
schwannomas. Neuropathol Appl Neurobiol. 36:505–514. 2010.
View Article : Google Scholar : PubMed/NCBI
|
|
20
|
Koutsimpelas D, Ruerup G, Mann WJ and
Brieger J: Lack of neurofibromatosis type 2 gene promoter
methylation in sporadic vestibular schwannomas. ORL J
Otorhinolaryngol Relat Spec. 74:33–37. 2012. View Article : Google Scholar : PubMed/NCBI
|
|
21
|
Lee JD, Kwon TJ, Kim UK and Lee WS:
Genetic and epigenetic alterations of the NF2 gene in sporadic
vestibular schwannomas. PLoS One. 7:e304182012. View Article : Google Scholar : PubMed/NCBI
|
|
22
|
Bello MJ, Martinez-Glez V,
Franco-Hernandez C, et al: DNA methylation pattern in 16
tumor-related genes in schwannomas. Cancer Genet Cytogenet.
172:84–86. 2007. View Article : Google Scholar : PubMed/NCBI
|
|
23
|
Welling DB, Lasak JM, Akhmametyeva E,
Ghaheri B and Chang LS: cDNA microarray analysis of vestibular
schwannomas. Otol Neurotol. 23:736–748. 2002. View Article : Google Scholar : PubMed/NCBI
|
|
24
|
Cayé-Thomasen P, Borup R, Stangerup SE,
Thomsen J and Nielsen FC: Deregulated genes in sporadic vestibular
schwannomas. Otol Neurotol. 31:256–266. 2010.
|
|
25
|
Aarhus M, Bruland O, Sætran HA, Mork SJ,
Lund-Johansen M and Knappskog PM: Global gene expression profiling
and tissue microarray reveal novel candidate genes and
down-regulation of the tumor suppressor gene CAV1 in sporadic
vestibular schwannomas. Neurosurgery. 67:998–1019. 2010. View Article : Google Scholar
|
|
26
|
Lassaletta L, Patrón M, Del Río L, Alfonso
C, Roda JM, Rey JA and Gavilan J: Cyclin D1 expression and
histopathologic features in vestibular schwannomas. Otol Neurotol.
28:939–941. 2007. View Article : Google Scholar : PubMed/NCBI
|
|
27
|
Gonzalez-Roca E, Garcia-Albéniz X,
Rodriguez-Mulero S, Gomis RR, Kornacker K and Auer H: Accurate
expression profiling of very small cell populations. PLoS One.
5:e144182010. View Article : Google Scholar : PubMed/NCBI
|
|
28
|
Irizarry RA, Bolstad BM, Collin F, Cope
LM, Hobbs B and Speed TP: Summaries of Affymetrix GeneChip probe
level data. Nucleic Acids Res. 31:e152003. View Article : Google Scholar : PubMed/NCBI
|
|
29
|
Johnson WE, Li C and Rabinovic A:
Adjusting batch effects in microarray expression data using
empirical Bayes methods. Biostatistics. 8:118–127. 2007. View Article : Google Scholar : PubMed/NCBI
|
|
30
|
Chen C, Grennan K, Badner J, Zhang D,
Gershon E, Jin L and Liu C: Removing batch effects in analysis of
expression microarray data: an evaluation of six batch adjustment
methods. PLoS One. 6:e172382011. View Article : Google Scholar : PubMed/NCBI
|
|
31
|
MAQC Consortium; Shi L, Reid LH, Jones WD,
et al: The MicroArray Quality Control (MAQC) project shows inter-
and intraplatform reproducibility of gene expression measurements.
Nat Biotechnol. 24:1151–1161. 2006. View Article : Google Scholar : PubMed/NCBI
|
|
32
|
Zhang X, De la Cruz O, Pinto JM, Nicolae
D, Firestein S and Gilad Y: Characterizing the expression of the
human olfactory receptor gene family using a novel DNA microarray.
Genome Biol. 8:R862007. View Article : Google Scholar : PubMed/NCBI
|
|
33
|
Saeed AI, Sharov V, White J, et al: TM4: a
free, open-source system for microarray data management and
analysis. Biotechniques. 34:374–378. 2003.PubMed/NCBI
|
|
34
|
Saeed AI, Bhagabati NK, Braisted JC, et
al: TM4 microarray software suite. Meth Enzymol. 411:134–193. 2006.
View Article : Google Scholar : PubMed/NCBI
|
|
35
|
Huang da W, Sherman BT and Lempicki RA:
Systematic and integrative analysis of large gene lists using DAVID
bioinformatics resources. Nat Protoc. 4:44–57. 2009.PubMed/NCBI
|
|
36
|
Huang da W, Sherman BT and Lempicki RA:
Bioinformatics enrichment tools: paths toward the comprehensive
functional analysis of large gene lists. Nucleic Acids Res.
37:1–13. 2009.PubMed/NCBI
|
|
37
|
Duncan D, Prodduturi N and Zhang B:
WebGestalt2: an updated and expanded version of the Web-based Gene
Set Analysis Toolkit. BMC Bioinformatics. 11:P102010. View Article : Google Scholar
|
|
38
|
Livak KJ and Schmittgen TD: Analysis of
relative gene expression data using real-time quantitative PCR and
the 2(−Delta Delta C(T)) Method. Methods. 25:402–408. 2001.
|
|
39
|
Canzian F, Salovaara R, Hemminki A, Kristo
P, Chadwick RB, Aaltonen LA and de la Chapelle A: Semiautomated
assessment of loss of heterozygosity and replication error in
tumors. Cancer Res. 56:3331–3337. 1996.PubMed/NCBI
|
|
40
|
Abruzzo LV, Lee KY, Fuller A, Silverman A,
Keating MJ, Medeiros LJ and Coombes KR: Validation of
oligonucleotide microarray data using microfluidic low-density
arrays: a new statistical method to normalize real-time RT-PCR
data. Biotechniques. 38:785–792. 2005. View Article : Google Scholar : PubMed/NCBI
|
|
41
|
Frohnert PW, Stonecypher MS and Carroll
SL: Constitutive activation of the neuregulin-1/ErbB receptor
signaling pathway is essential for the proliferation of a
neoplastic Schwann cell line. Glia. 43:104–118. 2003. View Article : Google Scholar : PubMed/NCBI
|
|
42
|
Stonecypher MS, Chaudhury AR, Byer SJ and
Carroll SL: Neuregulin growth factors and their ErbB receptors form
a potential signaling network for schwannoma tumorigenesis. J
Neuropathol Exp Neurol. 65:162–175. 2006. View Article : Google Scholar : PubMed/NCBI
|
|
43
|
Hansen MR, Roehm PC, Chatterjee P and
Green SH: Constitutive neuregulin-1/ErbB signaling contributes to
human vestibular schwannoma proliferation. Glia. 53:593–600. 2006.
View Article : Google Scholar : PubMed/NCBI
|
|
44
|
Newbern J and Birchmeier C: Nrg1/ErbB
signaling networks in Schwann cell development and myelination.
Semin Cell Dev Biol. 21:922–928. 2010. View Article : Google Scholar : PubMed/NCBI
|
|
45
|
Houshmandi SS, Emnett RJ, Giovannini M and
Gutmann DH: The neurofibromatosis 2 protein, merlin, regulates
glial cell growth in an ErbB2- and Src-dependent manner. Mol Cell
Biol. 29:1472–1486. 2009. View Article : Google Scholar : PubMed/NCBI
|
|
46
|
Tao Y, Dai P, Liu Y, Marchetto S, Xiong
WC, Borg JP and Mei L: Erbin regulates NRG1 signaling and
myelination. Proc Natl Acad Sci USA. 106:9477–9482. 2009.
View Article : Google Scholar : PubMed/NCBI
|
|
47
|
Wilkes MC, Repellin CE, Hong M, Bracamonte
M, Penheiter SG, Borg JP and Leof EB: Erbin and the NF2 tumor
suppressor Merlin cooperatively regulate cell-type-specific
activation of PAK2 by TGF-beta. Dev Cell. 16:433–444. 2009.
View Article : Google Scholar : PubMed/NCBI
|
|
48
|
Löttrich M, Mawrin C, Chamaon K, Kirches
E, Dietzmann K and Freigang B: Expression of transforming growth
factor-beta receptor type 1 and type 2 in human sporadic vestibular
Schwannoma. Pathol Res Pract. 203:245–249. 2007.PubMed/NCBI
|
|
49
|
Cole BK, Curto M, Chan AW and McClatchey
AI: Localization to the cortical cytoskeleton is necessary for
Nf2/merlin-dependent epidermal growth factor receptor silencing.
Mol Cell Biol. 28:1274–1284. 2008. View Article : Google Scholar : PubMed/NCBI
|
|
50
|
Ammoun S, Flaiz C, Ristic N, Schuldt J and
Hanemann CO: Dissecting and targeting the growth factor-dependent
and growth factor-independent extracellular signal-regulated kinase
pathway in human schwannoma. Cancer Res. 68:5236–5245. 2008.
View Article : Google Scholar
|
|
51
|
Bartolami S, Augé C, Travo C, Ventéo S,
Knipper M and Sans A: Vestibular Schwann cells are a distinct
subpopulation of peripheral glia with specific sensitivity to
growth factors and extracellular matrix components. J Neurobiol.
57:270–290. 2003. View Article : Google Scholar
|
|
52
|
Prayson RA, Yoder BJ and Barnett GH:
Epidermal growth factor receptor is not amplified in schwannomas.
Ann Diagn Pathol. 11:326–329. 2007. View Article : Google Scholar : PubMed/NCBI
|
|
53
|
Wickremesekera A, Hovens CM and Kaye AH:
Expression of ErbB-1 and 2 in vestibular schwannomas. J Clin
Neurosci. 14:1199–1206. 2007. View Article : Google Scholar : PubMed/NCBI
|
|
54
|
Doherty JK, Ongkeko W, Crawley B, Andalibi
A and Ryan AF: ErbB and Nrg: potential molecular targets for
vestibular schwannoma pharmacotherapy. Otol Neurotol. 29:50–57.
2008. View Article : Google Scholar : PubMed/NCBI
|
|
55
|
Zhu H, Yue J, Pan Z, et al: Involvement of
Caveolin-1 in repair of DNA damage through both homologous
recombination and non-homologous end joining. PLoS One.
5:e120552010. View Article : Google Scholar : PubMed/NCBI
|
|
56
|
Cerezo A, Guadamillas MC, Goetz JG,
Sánchez-Perales S, Klein E, Assoian RK and del Pozo MA: The absence
of caveolin-1 increases proliferation and anchorage-independent
growth by a Rac-dependent, Erk-independent mechanism. Mol Cell
Biol. 29:5046–5059. 2009. View Article : Google Scholar : PubMed/NCBI
|
|
57
|
Brennan D, Peltonen S, Dowling A, et al: A
role for caveolin-1 in desmoglein binding and desmosome dynamics.
Oncogene. 31:1636–1648. 2012. View Article : Google Scholar : PubMed/NCBI
|
|
58
|
Ciocca DR, Cuello-Carrión FD, Natoli AL,
Restall C and Anderson RL: Absence of caveolin-1 alters heat shock
protein expression in spontaneous mammary tumors driven by
Her-2/neu expression. Histochem Cell Biol. 137:187–194. 2012.
View Article : Google Scholar : PubMed/NCBI
|
|
59
|
Chung Moh M, Hoon Lee L and Shen S:
Cloning and characterization of hepaCAM, a novel Ig-like cell
adhesion molecule suppressed in human hepatocellular carcinoma. J
Hepatol. 42:833–841. 2005.PubMed/NCBI
|
|
60
|
Moh MC, Tian Q, Zhang T, Lee LH and Shen
S: The immunoglobulin-like cell adhesion molecule hepaCAM modulates
cell adhesion and motility through direct interaction with the
actin cytoskeleton. J Cell Physiol. 219:382–391. 2009. View Article : Google Scholar : PubMed/NCBI
|
|
61
|
Moh MC, Lee LH, Zhang T and Shen S:
Interaction of the immunoglobulin-like cell adhesion molecule
hepaCAM with caveolin-1. Biochem Biophys Res Commun. 378:755–760.
2009. View Article : Google Scholar : PubMed/NCBI
|
|
62
|
Hung G, Colton J, Fisher L, Oppenheimer M,
Faudoa R, Slattery W and Linthicum F: Immunohistochemistry study of
human vestibular nerve schwannoma differentiation. Glia.
38:363–370. 2002. View Article : Google Scholar : PubMed/NCBI
|
|
63
|
Hortsch M: The L1 family of neural cell
adhesion molecules: old proteins performing new tricks. Neuron.
17:587–593. 1996. View Article : Google Scholar : PubMed/NCBI
|
|
64
|
Fogel M, Gutwein P, Mechtersheimer S, et
al: L1 expression as a predictor of progression and survival in
patients with uterine and ovarian carcinomas. Lancet. 362:869–875.
2003. View Article : Google Scholar : PubMed/NCBI
|
|
65
|
Tilley WD, Buchanan G, Hickey TE and
Bentel JM: Mutations in the androgen receptor gene are associated
with progression of human prostate cancer to androgen independence.
Clin Cancer Res. 2:277–285. 1996.PubMed/NCBI
|
|
66
|
Lu ML, Schneider MC, Zheng Y, Zhang X and
Richie JP: Caveolin-1 interacts with androgen receptor. A positive
modulator of androgen receptor mediated transactivation. J Biol
Chem. 276:13442–13451. 2001. View Article : Google Scholar : PubMed/NCBI
|
|
67
|
Bryant KG, Camacho J, Jasmin JF, et al:
Caveolin-1 overexpression enhances androgen-dependent growth and
proliferation in the mouse prostate. Int J Biochem Cell Biol.
43:1318–1329. 2011. View Article : Google Scholar : PubMed/NCBI
|
|
68
|
Gao S, Wang H, Lee P, et al: Androgen
receptor and prostate apoptosis response factor-4 target the c-FLIP
gene to determine survival and apoptosis in the prostate gland. J
Mol Endocrinol. 36:463–483. 2006. View Article : Google Scholar : PubMed/NCBI
|
|
69
|
Vetterkind S, Lee E, Sundberg E, Poythress
RH, Tao TC, Preuss U and Morgan KG: Par-4: a new activator of
myosin phosphatase. Mol Biol Cell. 21:1214–1224. 2010. View Article : Google Scholar : PubMed/NCBI
|
|
70
|
Cook J, Krishnan S, Ananth S, et al:
Decreased expression of the pro-apoptotic protein Par-4 in renal
cell carcinoma. Oncogene. 18:1205–1208. 1999. View Article : Google Scholar : PubMed/NCBI
|
|
71
|
Kögel D, Reimertz C, Mech P, et al:
Dlk/ZIP kinase-induced apoptosis in human medulloblastoma cells:
requirement of the mitochondrial apoptosis pathway. Br J Cancer.
85:1801–1808. 2001.PubMed/NCBI
|
|
72
|
García-Cao I, Duran A, Collado M, et al:
Tumour-suppression activity of the proapoptotic regulator Par4.
EMBO Rep. 6:577–583. 2005.PubMed/NCBI
|
|
73
|
Goswami A, Burikhanov R, de Thonel A, et
al: Binding and phosphorylation of par-4 by akt is essential for
cancer cell survival. Mol Cell. 20:33–44. 2005. View Article : Google Scholar : PubMed/NCBI
|
|
74
|
Jacob A, Lee TX, Neff BA, Miller S,
Welling B and Chang LS: Phosphatidylinositol 3-kinase/AKT pathway
activation in human vestibular schwannoma. Otol Neurotol. 29:58–68.
2008. View Article : Google Scholar : PubMed/NCBI
|
|
75
|
Krasilnikov MA: Phosphatidylinositol-3
kinase dependent pathways: the role in control of cell growth,
survival, and malignant transformation. Biochemistry (Mosc).
65:59–67. 2000.PubMed/NCBI
|
|
76
|
Zhu Z, He X, Johnson C, et al: PI3K is
negatively regulated by PIK3IP1, a novel p110 interacting protein.
Biochem Biophys Res Commun. 358:66–72. 2007. View Article : Google Scholar : PubMed/NCBI
|
|
77
|
Organ SL and Tsao MS: An overview of the
c-MET signaling pathway. Ther Adv Med Oncol. 3(Suppl 1): S7–S19.
2011. View Article : Google Scholar : PubMed/NCBI
|
|
78
|
Moriyama T, Kataoka H, Kawano H, et al:
Comparative analysis of expression of hepatocyte growth factor and
its receptor, c-met, in gliomas, meningiomas and schwannomas in
humans. Cancer Lett. 124:149–155. 1998. View Article : Google Scholar : PubMed/NCBI
|
|
79
|
Cantiani L, Manara MC, Zucchini C, et al:
Caveolin-1 reduces osteosarcoma metastases by inhibiting c-Src
activity and met signaling. Cancer Res. 67:7675–7685. 2007.
View Article : Google Scholar : PubMed/NCBI
|
|
80
|
Artigiani S, Conrotto P, Fazzari P, et al:
Plexin-B3 is a functional receptor for semaphorin 5A. EMBO Rep.
5:710–714. 2004. View Article : Google Scholar : PubMed/NCBI
|
|
81
|
Mirsky R, Woodhoo A, Parkinson DB,
Arthur-Farraj P, Bhaskaran A and Jessen KR: Novel signals
controlling embryonic Schwann cell development, myelination and
dedifferentiation. J Peripher Nerv Syst. 13:122–135. 2008.
View Article : Google Scholar : PubMed/NCBI
|
|
82
|
Takahashi M and Osumi N: Identification of
a novel type II classical cadherin: rat cadherin19 is expressed in
the cranial ganglia and Schwann cell precursors during development.
Dev Dyn. 232:200–208. 2005. View Article : Google Scholar : PubMed/NCBI
|
|
83
|
Martinez-Glez V, Franco-Hernandez C,
Alvarez L, et al: Meningiomas and schwannomas: molecular subgroup
classification found by expression arrays. Int J Oncol. 34:493–504.
2009.PubMed/NCBI
|
|
84
|
Bottos A, Destro E, Rissone A, et al: The
synaptic proteins neurexins and neuroligins are widely expressed in
the vascular system and contribute to its functions. Proc Natl Acad
Sci USA. 106:20782–20787. 2009. View Article : Google Scholar : PubMed/NCBI
|