Introduction
Laryngeal carcinomas are malignant tumors which are
difficult to cure. Traditionally, patients with laryngeal cancer
are treated with surgery, radiotherapy alone, or adjuvant
treatments. The effects of radiation therapy have been found to be
reliable and adverse reactions can be readily observed. However,
radiation therapy is only associated with a relatively good
efficacy when it is applied to radiation-sensitive patients.
Moreover, treatment failures have occurred even with early stage
cancers (1). Therefore,
radioresistance of laryngeal cancers represents a serious problem
and determining the mechanism(s) mediating this radioresistance is
critical.
Research of disease mechanisms over the past couple
of years has shown that cancer stem cells (CSCs) can exhibit a
radioresistant phenotype. Moreover, a ‘cancer stem cell’ theory has
gained interest in the field of oncology, where CSCs are proposed
to possess a self-renewal property typical of normal stem cells.
Correspondingly, despite tumor tissues containing very few CSCs
which rarely divide, tumors are still able to produce rapidly
proliferating daughter cells. Previous studies have demonstrated
the existence of CSCs in a variety of tumors (2–6).
Furthermore, expression of CD133 has been used to
define the CSC populations in brain, lung, pancreatic, liver,
prostate, gastric, colorectal and head and neck cancers (7–14).
CD133+ tumors have also been shown to establish more
efficiently in immunocompromised mice than CD133− tumors
(15). In addition to these stem
cell properties, CSCs also display a high resistance to radiation
and conventional chemotherapy. For example, Bao et al
(16) reported that
CD133+ CSCs contributed to glioma radioresistance
through preferential activation of DNA damage checkpoint responses
and an increased capacity for DNA repair. In brain glioblastomas,
Liu et al (17) reported
that CD133+ CSCs exhibited strong chemoresistance due to
higher expression of ABCG2 and MGMT. These studies strongly support
the cancer stem cell theory that CSCs are the underlying cause of
radioresistance and chemoresistance exhibited by tumors.
CSCs grow in a ‘niche’, a microenvironment that is
composed of a specialized vascular bed of endothelial cells,
associated cells of mesenchymal origin and extracellular matrix
components (18). The secretion of
factors within this niche can lead to the regulation, or
maintainance, of a CSC phenotype. Furthermore, these factors can
affect tumor invasion, metastasis and response to therapy (19,20).
Often, the tumor microenvironment also includes hypoxic conditions,
whereby expression of hypoxia inducible factor-1α (HIF-1α) is
induced. Induction of HIF-1α has been shown to correlate with an
increase in the ratio of CSCs present in a tumor (21) and to modulate specific stem cell
effectors, including Notch, Wnt and Oct4, which control stem cell
proliferation, differentiation and pluripotency (22). Moreover, HIF-1α has been shown to
enhance radioresistance. For example, a selective HIF-1α inhibitor
enhanced the sensitivity of malignant gliomas to radiotherapy
(23). However, it remains to be
determined whether radioresistance of laryngeal cancers are caused
by CSCs and whether hypoxia affects CSCs. Therefore, these two
aspects were examined using Hep-2 cells in vitro.
Materials and methods
Cell lines and culturing
Hep-2 cells were purchased from the Institute of
Biochemistry and Cell Biology, SIBS, CAS. HIF-1α-silenced Hep-2
cells which stably express HIF-RNAi were obtained from the Bethune
International Hospital (38). Both
cell types were cultured in RPMI-1640 medium containing 10% fetal
calf serum (Sijiqing Co., China) in 25 ml flasks. For normoxic
conditions, cells were maintained in 21% O2, while
hypoxic conditions included the incubation of cells with 1%
O2. Media was changed every 1–2 days and when cells
reached 80–90% confluency, they were passaged or used.
Treatment groups and irradiation
Cells were divided into four groups: groups A and B
included Hep-2 cells cultured under hypoxic or normoxic conditions,
respectively; while groups C and D included HIF-siRNA Hep-2 cells
cultured under hypoxic and normoxic conditions, respectively.
Delivery of irradiation was conducted under ambient conditions with
different radiation dosages applied (0, 5, 10, 15 and 20 Gy). All
irradiations were performed using a 60Co unit (FCC-7000,
Shangdong Xinhua Medical Instrument Co. Ltd., China) with a source
skin distance (SSD) of 75 cm, a radiation area of 20×20
cm2 and a dose rate of 486 cGy/min. Following
irradiation, cells received fresh media.
MTT assays
MTT was dissolved in phosphate-buffered saline (PBS)
and adjusted to a final concentration of 5 mg/ml. For MTT assays,
Hep-2 cells (4×10³/well) were cultured in 96-well plates
under hypoxic and normoxic conditions. After 36 h, cells were
exposed to varying doses of irradiation while being maintained
under hypoxic and normoxic conditions. After 12, 24, 36 and 48 h,
20 μl MTT was added to each well. After an additional 4 h at
37°C, culture media was removed and 150 μl DMSO was added.
Plates were swirled gently in the dark for 10 min at RT. Absorbance
values at 490 nm (A490) for each well were then measured using an
enzyme-linked immunosorbent detector (Model 550, Bio-Rad, Hercules,
CA, USA). Based on these data, cell growth inhibition ratios were
calculated according to the following formula: cell growth
inhibition ratio = [control group (0 Gy group) A value -
experimental group (each dose point group) A value]/control group A
value × 100%. Data were plotted with absorbed doses along the
x-axis and inhibition ratios reported along the y-axis.
Flow cytometry to detect cell cycle
progression and CD133+ Hep-2 cells
After Hep-2 cells were cultured for 36 h under
hypoxic or normoxic conditions, cells received 10 Gy of
irradiation, then were maintained under hypoxic and normoxic
conditions. After 24 h, cells were adjusted to a concentration of
1×10⁶ cells/ml with Buffer 1 (PBS/0.5% bovine serum
albumin (BSA)/2 mM EDTA). Cells were then fixed with 70% alcohol
for 18 h. Ethanol was removed by centrifugation and cells were
stained with 50 mg/ml propidium iodide (PI, Sigma Chemical Co., St.
Louis, MO, USA) at 4°C for 30 min before cell circle were detected.
To detect the CD133+ cell population, cells were stained
with a PE-conjugated CD133 mouse anti-human monoclonal antibody
(Miltenyi Biotechnology Corp., Germany) or a PE-conjugated mouse
anti-human IgG (control) at 4°C. After 30 min, cells were washed
twice with Buffer 1, were resuspended in 500 μl Buffer 1 and
were analyzed using a FACS flow cytometer and CellQuest software
(BD Biosciences, San Jose, CA, USA).
Fluorescence-activated cell sorting
CD133+ cells were isolated from Hep-2
cells and HIF-siRNA Hep-2 cells and were cultured. For staining,
Hep-2 cells (1×10⁸) were adjusted to a concentration of
1×10⁷ cells/ml with Buffer 1 and incubated with
PE-conjugated CD133 mouse anti-human monoclonal antibody (Miltenyi
Biotechnology Corp.) for 30 min at 4°C. After cells were washed
twice with Buffer 1, cells were resuspended in 10 ml Buffer 1. FACS
of CD133+ and CD133− cells was performed
using a Cytomation AriaII cytometer (BD Biosciences). Cells
incubated with PE-conjugated mouse anti-human IgG were used as
controls and the top 25% of the most brightly stained cells were
isolated as CD133+ cells.
Culturing of CD133+ cells,
sphere formation assays and treatment groups
CD133+ cells were cultured in serum-free
RPMI-1640 medium (SFM), containing 0.5% bovine serum albumin (BSA),
100 ng/ml epidermal growth factor (EGF), 40 ng/ml β-FGF, 5
μg/ml insulin, 100 IU/ml penicillin, 100 μg/ml
streptomycin and 5 ng/ml leukemia inhibitory factor (LIF). Between
1 and 3 weeks later, cultures were monitored for sphere formation.
For passaging of the spheres, medium was centrifuged, incubated
with trypsin, then single cell suspensions were obtained with
mechanical dissociation. After cells were resuspended in SFM
(2×10⁵ cells/ml), CD133+ cells were divided
into groups E–H: i) in group E, Hep-2 cells were cultured under
hypoxic conditions; ii) in group F, Hep-2 cells were cultured under
normoxic conditions; iii) in group G, HIF-siRNA Hep-2 cells were
cultured under hypoxic conditions; and iv) in group H, HIF-siRNA
Hep-2 cells were cultured under normoxic conditions. After 36 h,
all groups received 10 Gy irradiation.
MTT assay of CD133+ cells
For MTT assays of CD133+ cells, the MTT
protocol described above was used, except that the media used was
serum-free and the 96-well plates were centrifuged and medium was
disgarded before DMSO was added.
Soft agar colony formation assays
Colony formation was evaluated using soft-agar plate
assays. Briefly, CD133+ cells (100 cells/well) from each
group were embedded in 0.3% agar gel containing RPMI-1640 medium
and 20% fetal calf serum in 6-well plates precoated with 0.5% agar
gel containing RPMI-1640/20% FCS. After 36 h of hypoxic or normoxic
culture conditions, cells were treated with 10 Gy irradiation.
Fourteen days later, 0.5 ml MTT was added to each well, plates were
incubated for 30 min, then colonies containing ≥50 cells were
counted. These assays were performed in duplicate with each sample
assayed in triplicate.
Flow cytometry to detect protein
expression
The four groups of CD133+ Hep-2 and
HIF-siRNA Hep-2 cells were cultured for 36 h, then treated with 10
Gy irradiation. After an additional 24 h of culturing, cells
(2×10⁵) were washed twice with Buffer 1 (PBS/0.5% BSA)
then were re-suspended with fixation and permeabilization solution
(B&D Biosciences Pharmingen) and incubated for 20 min. Cells
were then washed with Buffer 2 (Perm/Wash™ buffer solution; B&D
Biosciences Pharmigen) and incubated with the following primary
antibodies diluted in Buffer 2: mouse anti-human p53, survivin
(Santa Cruz Biotechnology, Inc. Santa Cruz, CA, USA), DNA-dependent
protein kinase, catalytic subunit (DNA-PKcs) (Neomarker, USA),
ataxia-telangiectasia mutated (ATM) (Biovision, Mountain View, CA,
USA). After 1 h at 4°C, cells were washed twice with Buffer 2, then
were resuspended in 50 μl Buffer 2, to which DyLight™488
conjugated goat anti-mouse IgG (Multisciences Biotech Corp., China)
was added. Samples were incubated in the dark for 30 min at 4°C.
Following two washes with Buffer 1, samples were analyzed using a
FACS flow cytometer and CellQuest software (BD Biosciences).
Statistical analysis
Data are expressed as the mean ± standard deviation
(SD). All statistical analyses were performed using SPSS15.0
software. Factorial and linear correlation analyses were applied to
values measured by MTT assays, apoptosis rates and DNA-PKcs, ATM,
p53 and survivin proteins. P<0.05 was considered statistically
significant.
Results
Confirmation of HIF-1α expression and
validation of in vitro model
Two populations of human laryngeal carcinoma cells
were assayed under hypoxic and normoxic conditions in vitro.
The first population included Hep-2 cells, representing groups A
and B, respectively. The second population included HIF-siRNA Hep-2
which stably express HIF-1α-targeted siRNA, representing groups C
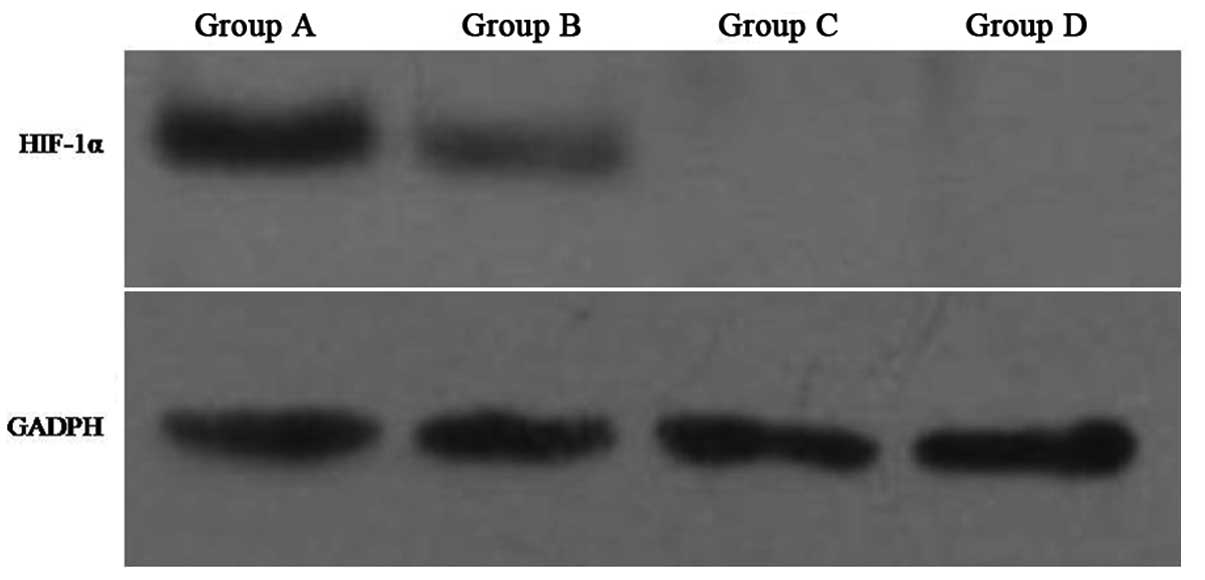
and D, respectively. To validate the hypoxic and normoxic
conditions employed in this study, levels of HIF-1α were detected
in groups A–D by western blotting. Consistent with the role for
HIF-1α during hypoxia, higher levels of HIF-1α were detected in
Hep-2 cells cultured under hypoxic conditions (e.g., group A)
versus normoxic conditions (e.g., group B). In contrast, HIF-siRNA
Hep-2 cells did not have detectable levels of HIF-1α expressed by
either group C or D cells (Fig.
1).
Growth inhibition of Hep-2 cells
following treatment with different doses of radiation
To examine whether Hep-2 cells exhibit a
radioresistant phenotype that is affected by hypoxia, cell groups
A–D were subjected to various doses of irradiation (0, 5, 10, 15
and 20 Gy). Following irradiation, cells received fresh media and
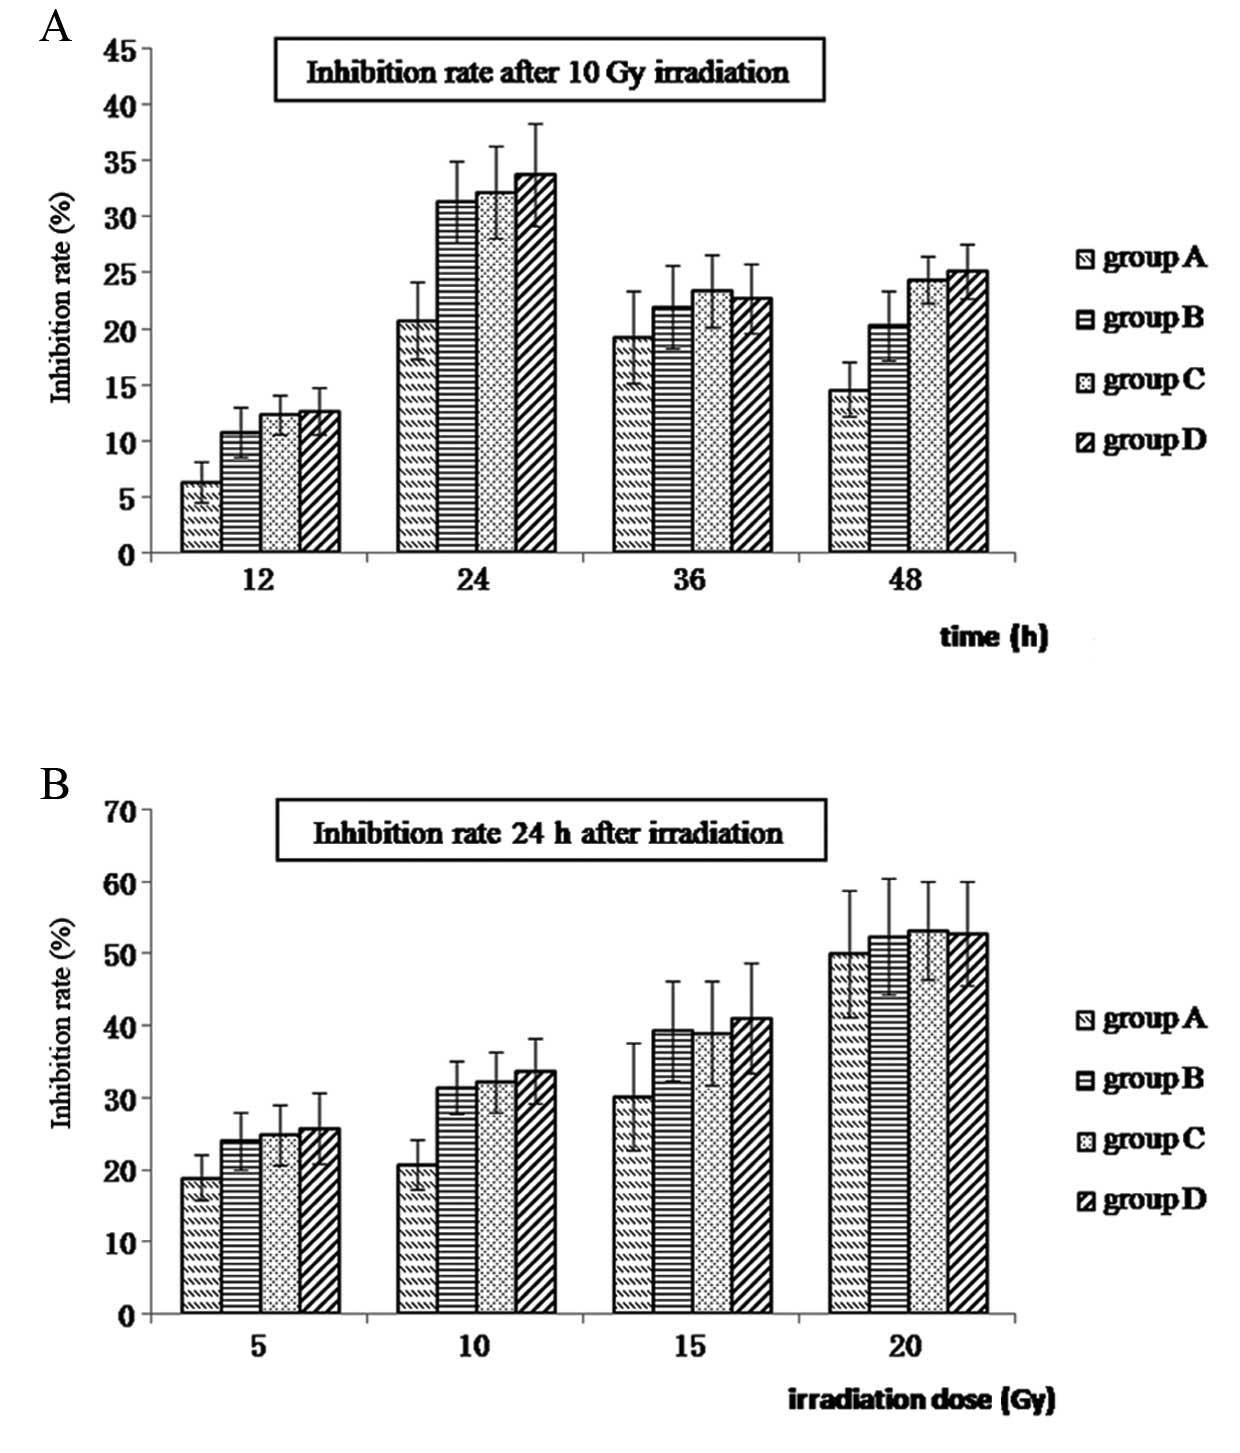
cell growth was monitored using MTT assays. As shown in Fig. 2, growth inhibition ratios for
groups A–D are shown at various time-points following the
application of 10 Gy irradiation (Fig.
2A) and 24 h after different doses of radiation (Fig. 2B). Growth of Hep-2 cells was
observed to be radiation dose-dependent, with higher levels of
growth inhibition observed with higher levels of irradiation.
Moreover, the greatest difference in the ratio of growth inhibition
was observed at the 24 h time-point following 10 Gy irradiation
(P<0.05). Growth inhibition was also the lowest for hypoxic
Hep-2 cells (group A) at each dose and time-point (Fig. 2 and Table I).
 | Table I.Growth inhibition ratios for the
treatment groups. |
Table I.
Growth inhibition ratios for the
treatment groups.
| Radiation
dosea
| Time-point
following 10 Gy irradiation
|
|---|
| Cell group | 5 Gy | 10 Gy | 15 Gy | 20 Gy | 12 h | 24 h | 36 h | 48 h |
|---|
| A | 18.9±3.1 | 20.7±3.4 | 30.1±7.4 | 50.0±8.8 | 6.3±1.9 | 20.7±3.4 | 19.3±4.1 | 14.6±2.42 |
| B | 24.0±3.9 | 31.4±3.7 | 39.4±7.0 | 52.4±8.1 | 10.8±2.3 | 31.4±3.7 | 21.9±3.7 | 20.3±3.1 |
| C | 24.9±4.1 | 32.2±4.1 | 39.0±7.3 | 53.2±6.8 | 12.3±1.7 | 32.2±4.1 | 23.4±3.3 | 24.4±2.1 |
| D | 25.7±5.0 | 33.8±4.5 | 41.1±7.7 | 52.8±7.2 | 12.7±2.1 | 33.8±4.5 | 22.7±3.2 | 25.1±2.4 |
Cell cycle distribution for
CD133+ Hep-2 cells in groups A–D 24 h after
irradiation
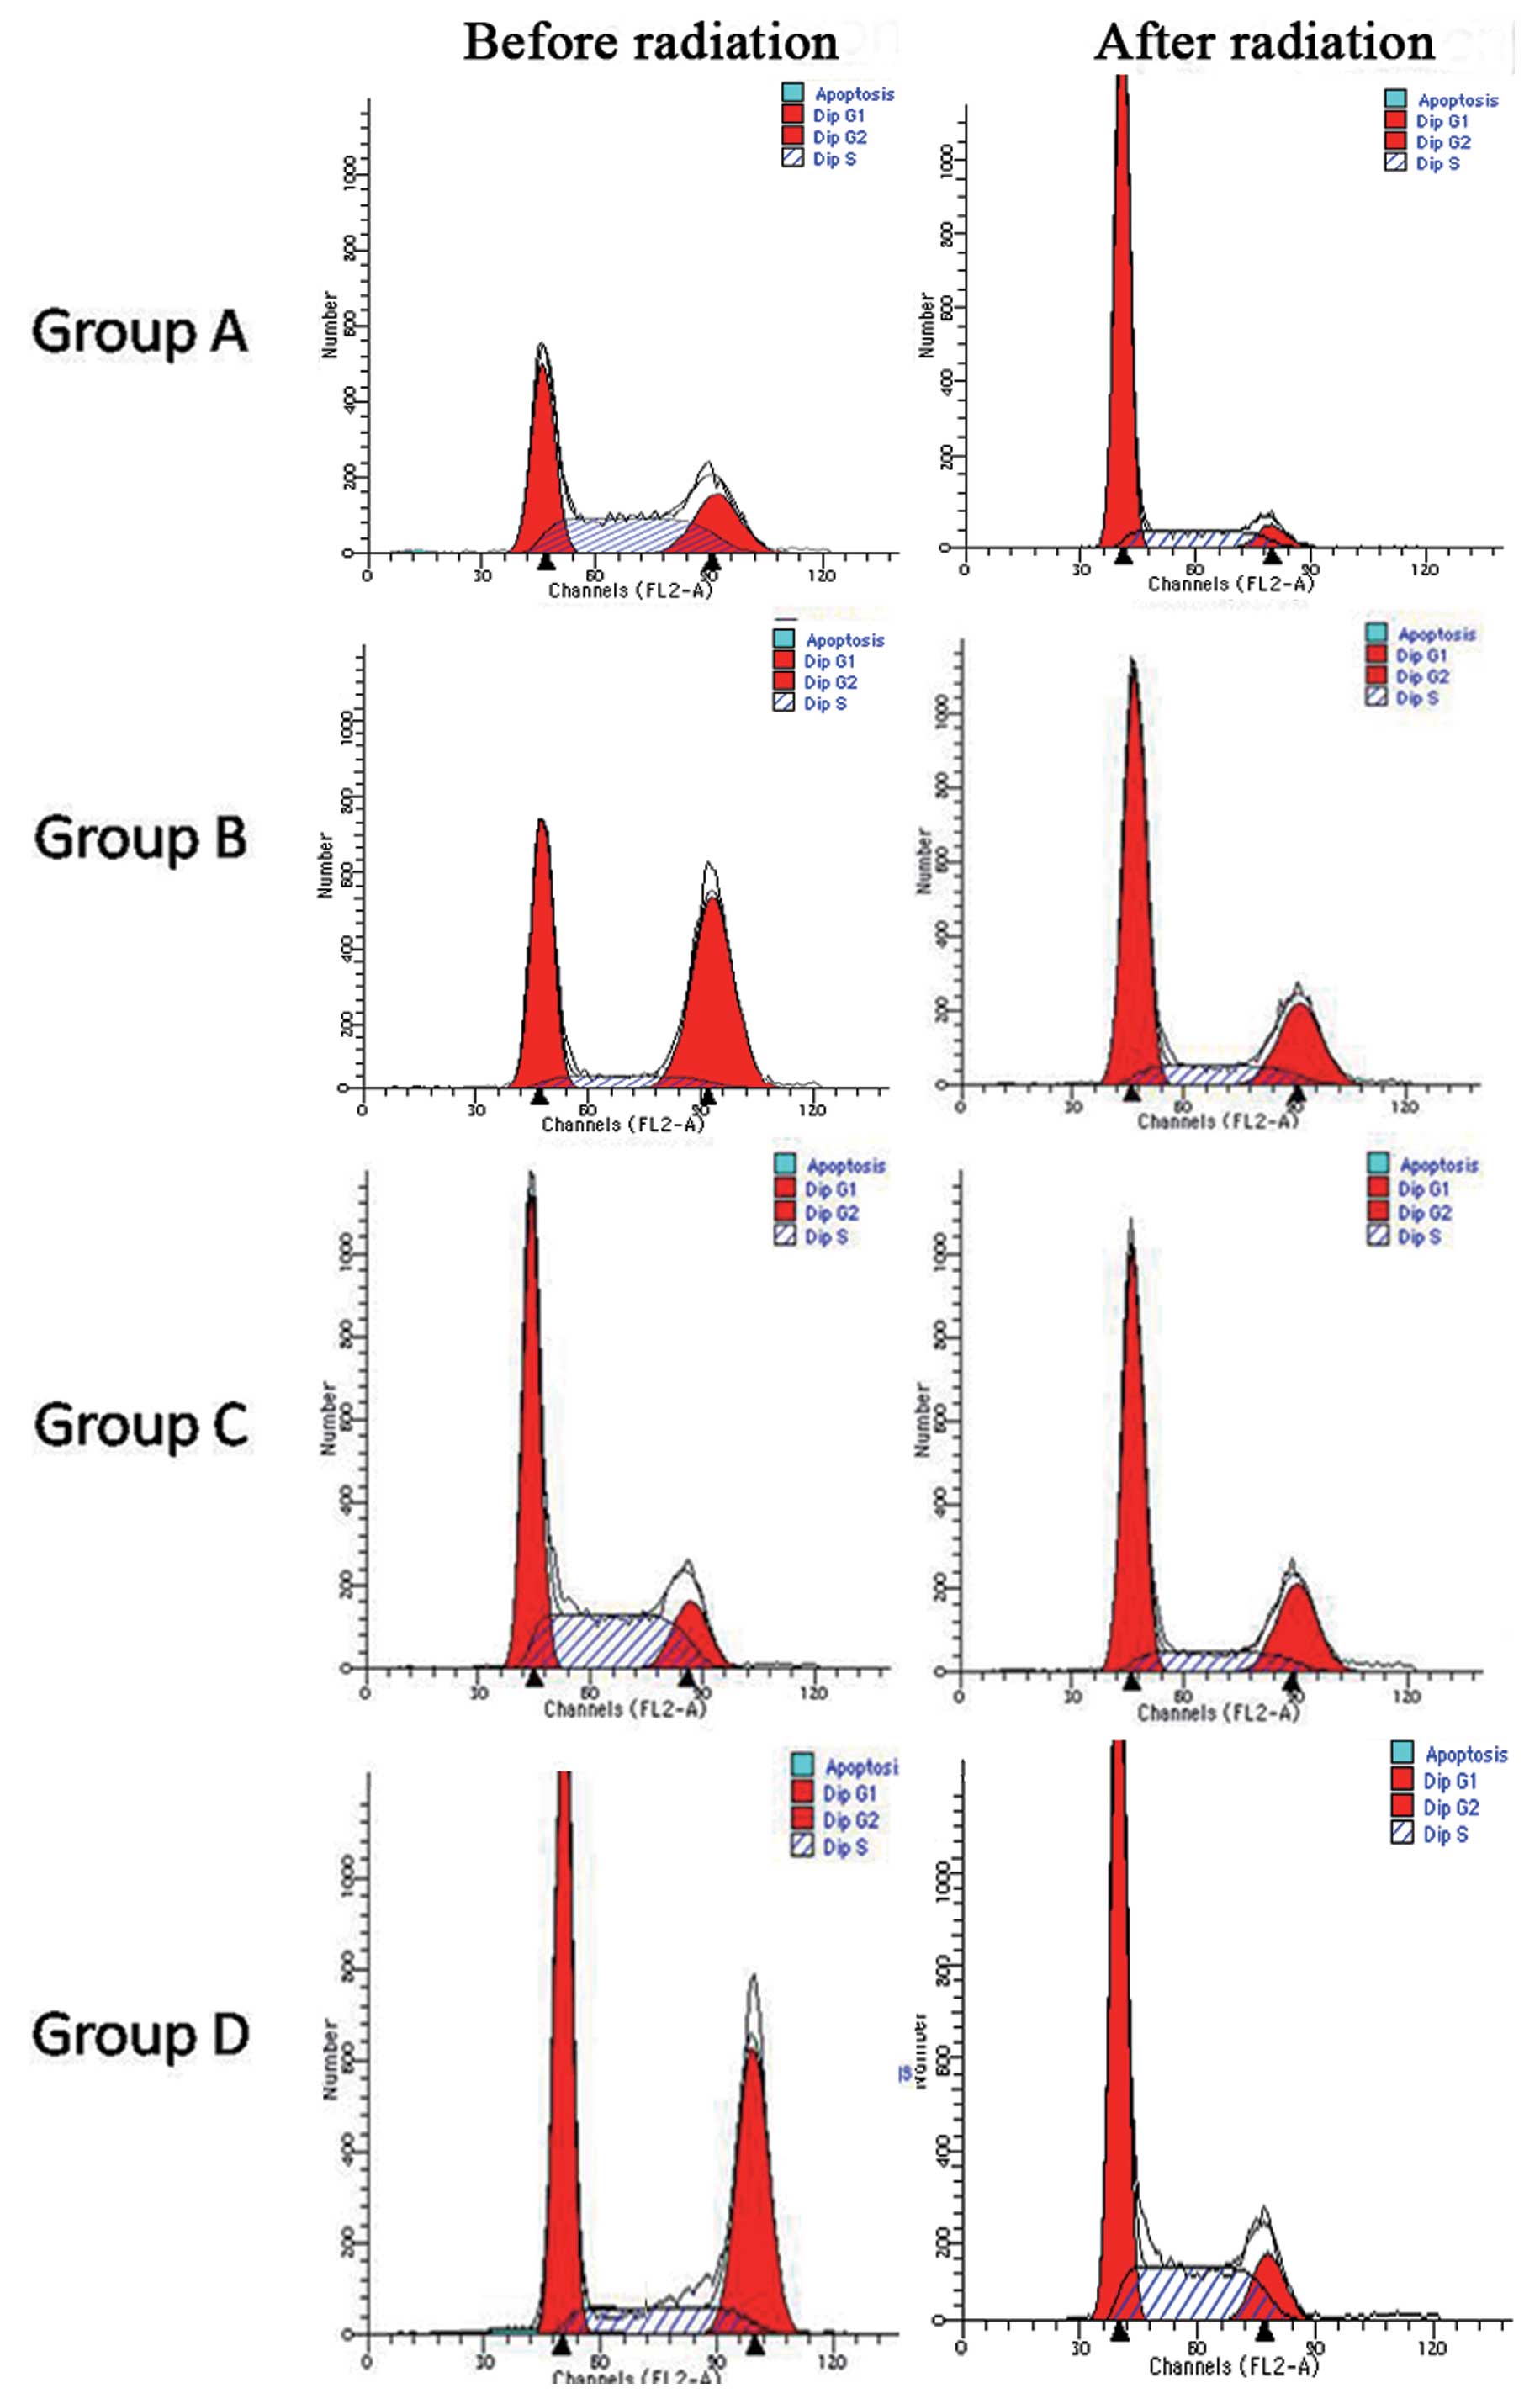
Groups A–D were cultured for 36 h under hypoxic or
normoxic conditions before cells were treated with 10 Gy of
radiation. Cells were then maintained under hypoxic and normoxic
conditions until cell cycle assays were performed. Cells were
co-stained with PI and PE-conjugated CD133 mouse anti-human
monoclonal antibody. For all four groups following irradiation, the
percentage of cells in the G1 phase increased, while the percentage
of cells in the G2/S phase decreased. In groups A and B, a 4- and
2-fold increase in cells in the G1 phase after radiation was
observed, respectively. In contrast, there was no significant
increase in the G1 population for groups C and D. For the G2/S
population, a decrease was observed following exposure to radiation
for groups B and D. Among the four groups, hypoxic Hep-2 cells
(group A) maintained most of the cells in the G1 phase (P<0.05)
(Fig. 3 and Table II).
| Table II.Cell cycle distribution for cell
groups A–D. |
Table II.
Cell cycle distribution for cell
groups A–D.
| Cell group | Radiation | G1 (%) | G2 (%) | S (%) |
|---|
| A | Before | 30.2±3.8 | 26.8±2.1 | 40.7±4.2 |
| After | 74.6±6.4 | 6.9±1.5 | 18.6±2.1 |
| B | Before | 36.7±3.9 | 50.4±2.5 | 12.3±1.4 |
| After | 59.6±5.9 | 22.2±2.7 | 17.1±1.3 |
| C | Before | 45.2±3.8 | 15.7±2.0 | 41.1±5.1 |
| After | 58.3±4.3 | 23.2±1.9 | 16.4±1.4 |
| D | Before | 45.1±4.4 | 37.3±3.6 | 16.0±1.9 |
| After | 57.7±4.8 | 11.4±0.8 | 32.3±3.0 |
The percentage of CD133+ cells in groups
A–D before and after irradiation were also detected by flow
cytometry. These percentages included: 1.5 versus 9.9% for group A,
1.0 versus 3.3% for group B, 0.8 versus 2.7% for group C and 0.7
versus 2.5% for group D, respectively, in each case. Hep-2 cells
cultured under hypoxic conditions (e.g., group A) exhibited a
significant difference in the CD133+ population in
response to irradiation (P<0.05). In contrast, the percentage of
CD133+ cells in groups B–D did not significantly differ
(Table III).
| Table III.CD133+ cell ratio for cell
groups A–D. |
Table III.
CD133+ cell ratio for cell
groups A–D.
| Radiation | Group A | Group B | Group C | Group D |
|---|
| Before | 1.4±0.1 | 1.0±0.08 | 0.8±0.06 | 0.7±0.06 |
| After | 9.9±1.1 | 3.3±0.2 | 2.7±0.2 | 2.5±0.1 |
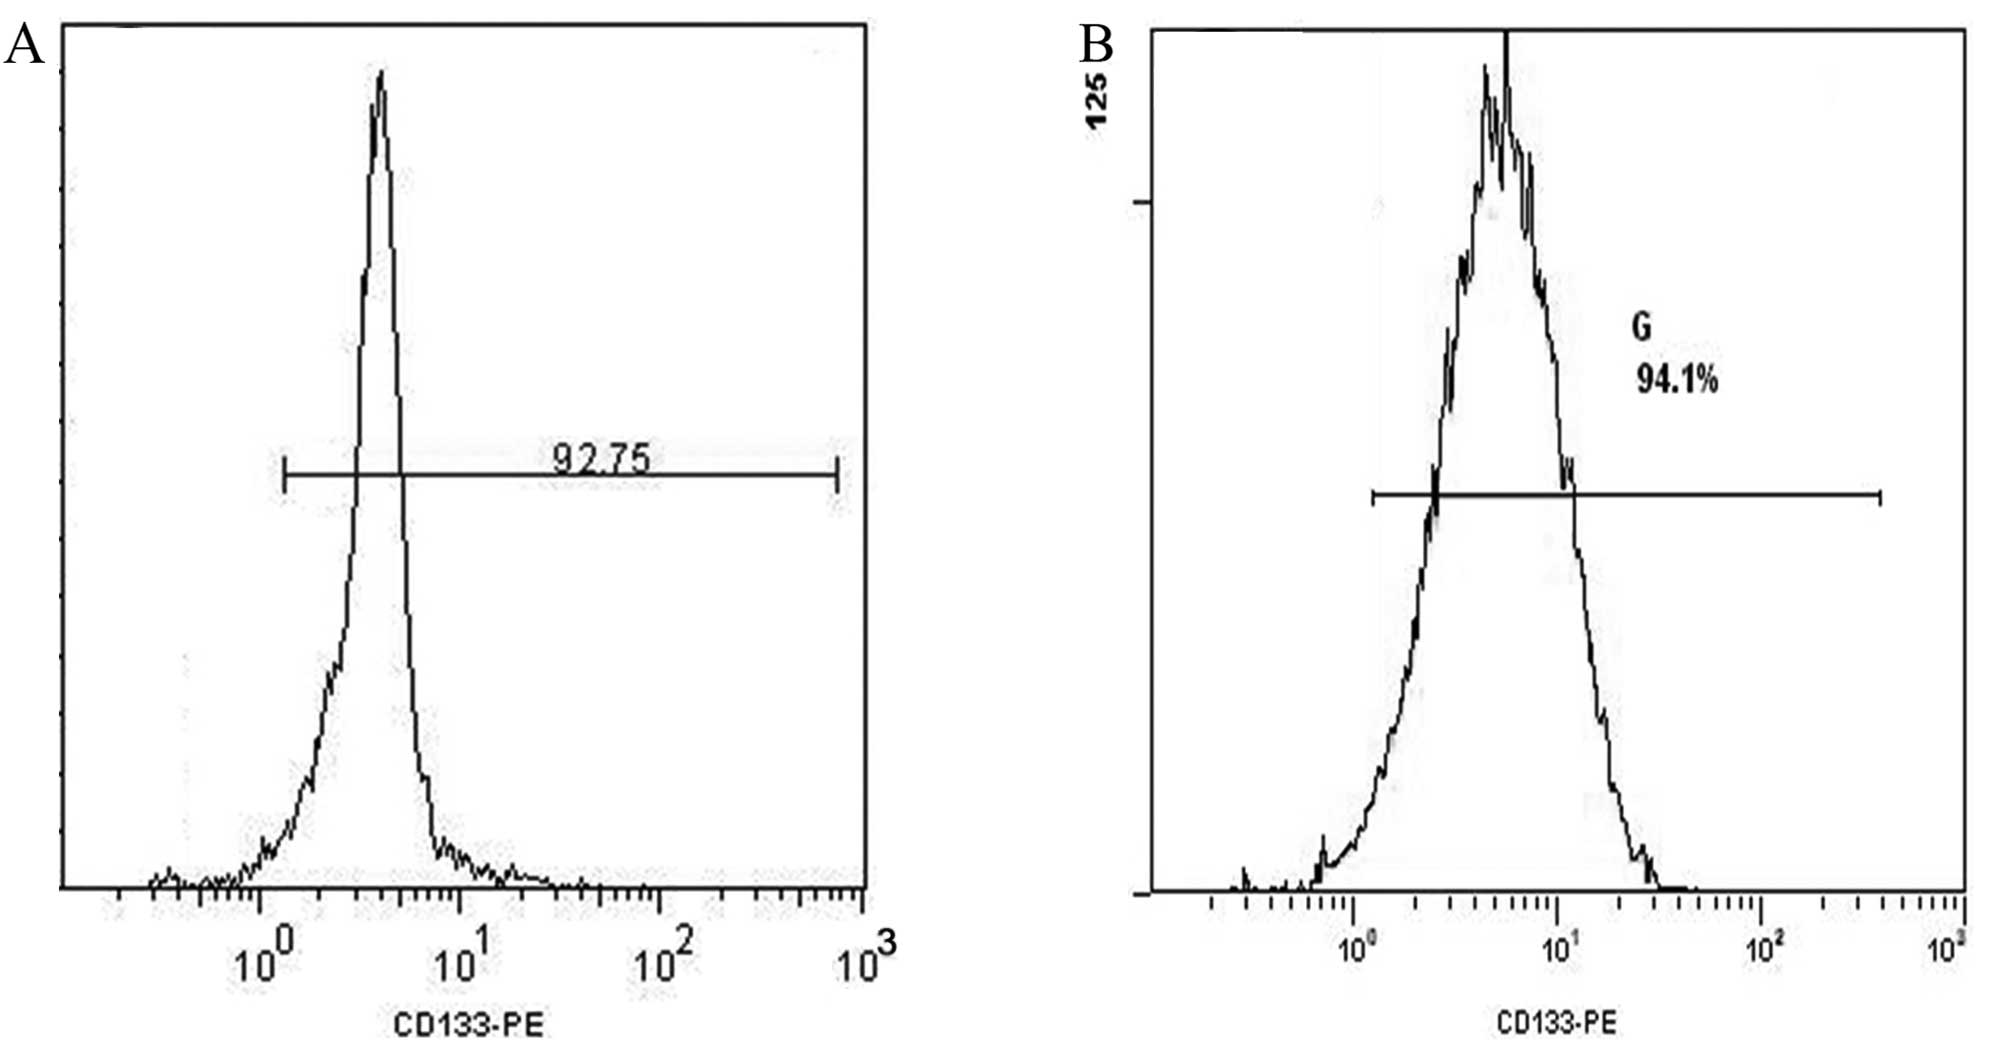
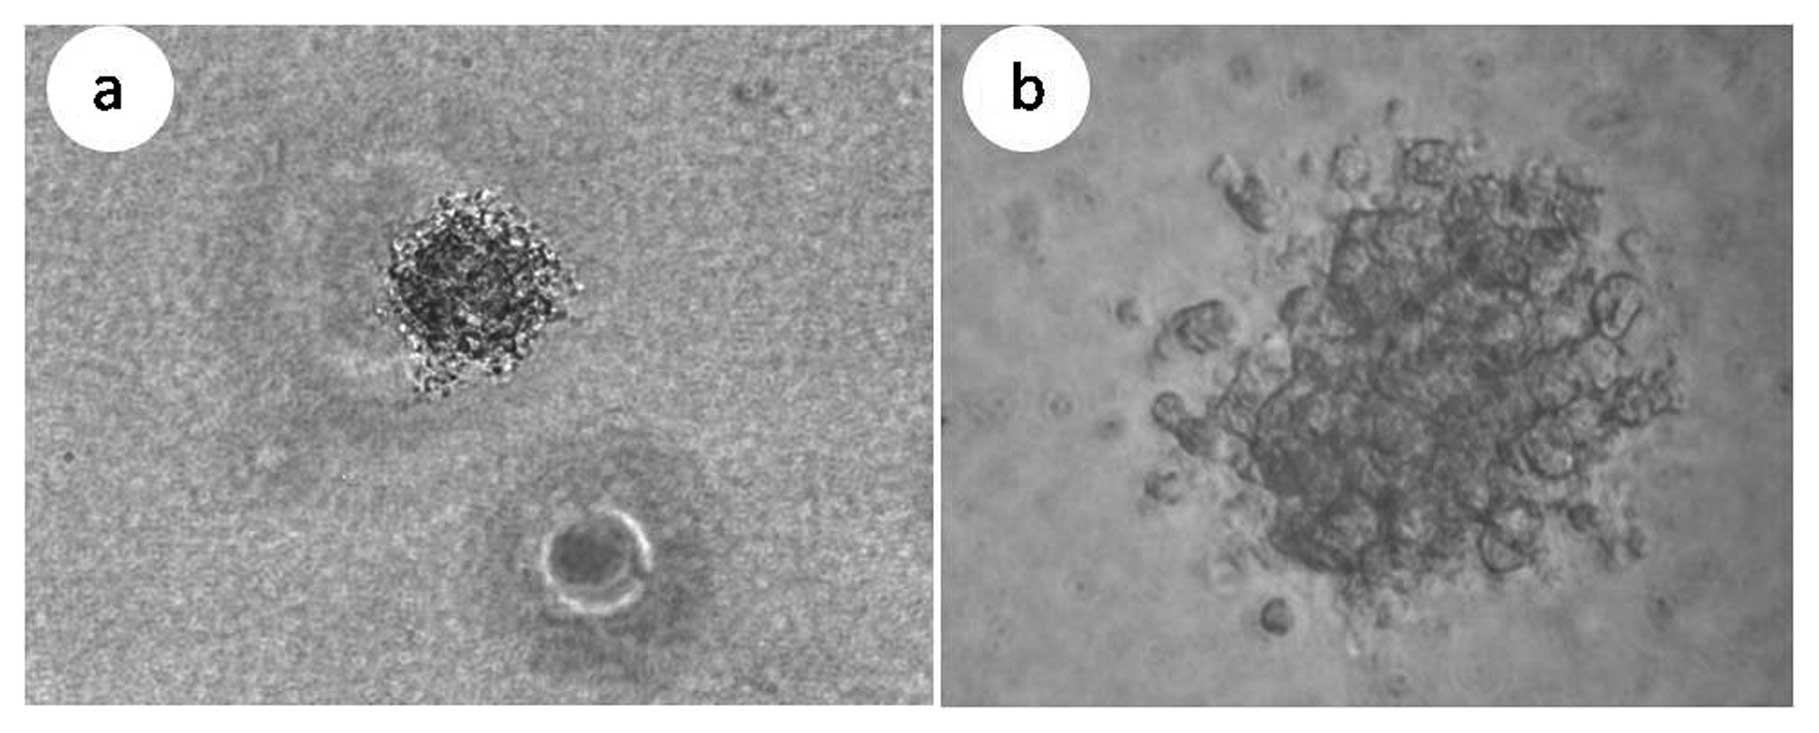
Isolation of CD133+ cells
using fluorescence-activated cell sorting (FACS) and sphere
formation assays
When Hep-2 cells and HIF-siRNA Hep-2 cells were
sorted for CD133+ cells using FACS, ∼1×10⁶
cells were obtained with a cell purity of 92.8 and 94.1%,
respectively (Fig. 4). These two
sets of cells were then cultured for 2 weeks in SFM and the
phenotype of the spheres that formed are shown in Fig. 5. When these two sets of spheres
were digested with 0.25% zymine, the resulting single cell
suspensions were also analyzed by FACS and the percentage of
CD133+ cells detected were 88.3 and 89.4%,
respectively.
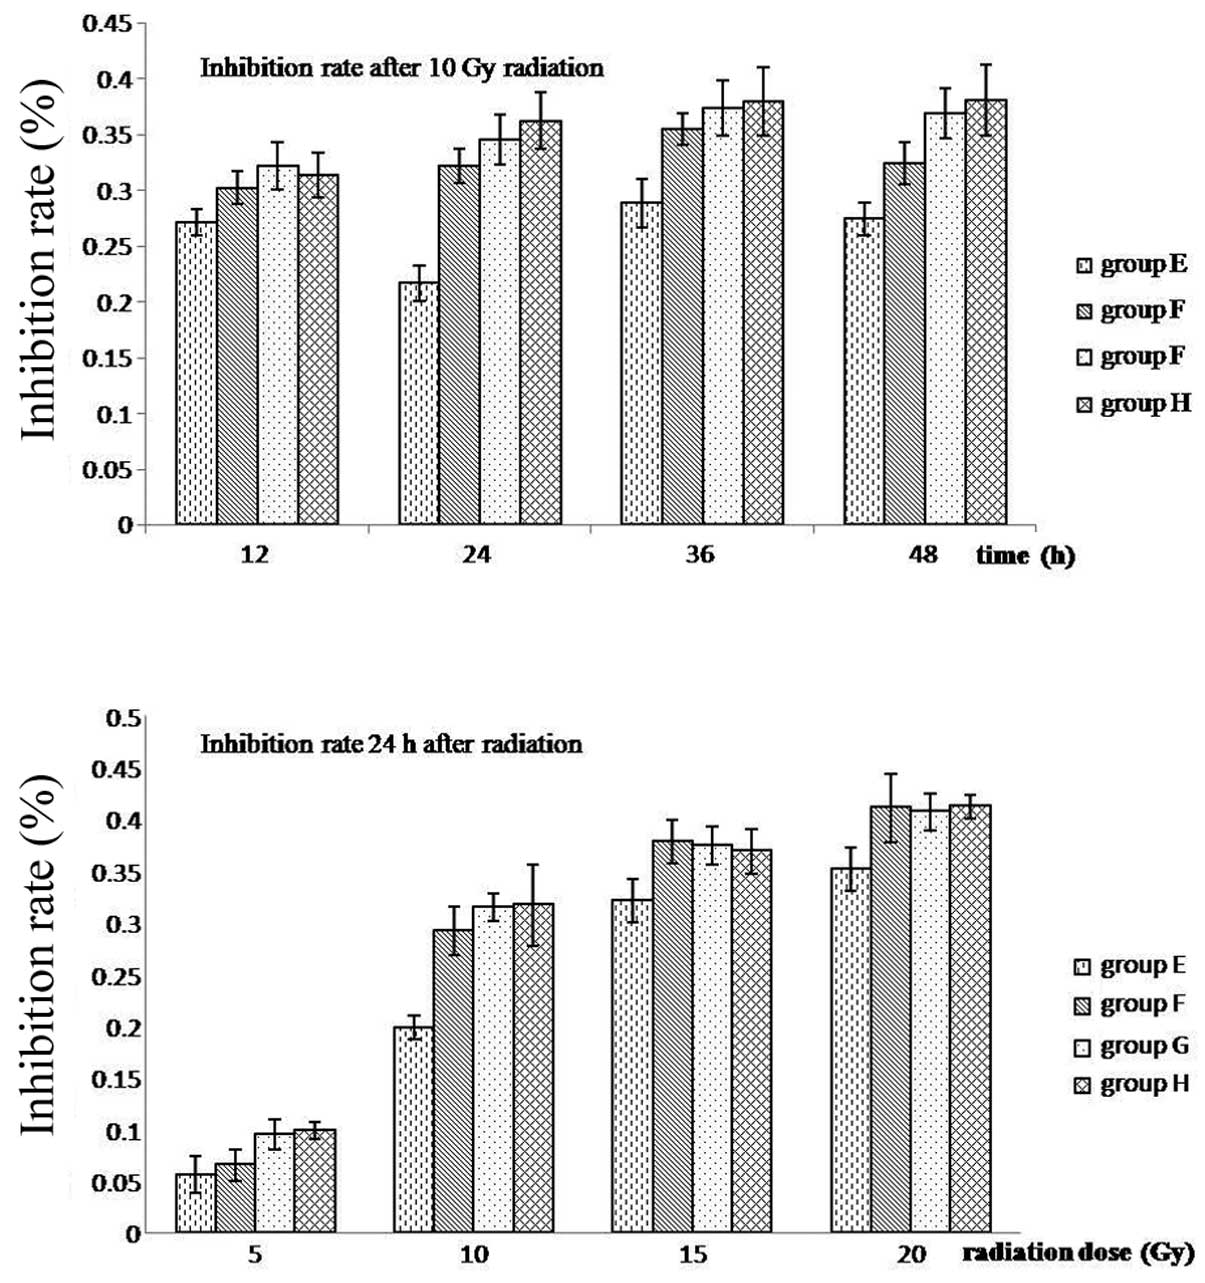
Viability of CD133+ cells
The CD133+ cells obtained following FACS
of the Hep-2 spheres and HIF-siRNA Hep-2 spheres, were divided into
groups E–H. In groups E and F, Hep-2 cells were cultured under
hypoxic and normoxic conditions, respectively. Similarly, in groups
G and H, HIF-siRNA Hep-2 cells were cultured under hypoxic and
normoxic conditions, respectively. After 36 h, groups E–H were
subjected to various doses of radiation (0, 5, 10, 15 and 20 Gy)
and subsequently, cells received fresh media at various
time-points. Cell growth was then monitored using MTT assays.
Growth inhibition was observed to increase in a dose-dependent
manner and was the lowest for group E at each dose and time-point.
In addition, the greatest difference in growth inhibition between
the four doses was 24 h after 10 Gy irradiation (P<0.05)
(Fig. 6 and Table IV).
| Table IV.Growth inhibition ratios for
CD133+ cells in groups E–H. |
Table IV.
Growth inhibition ratios for
CD133+ cells in groups E–H.
| Radiation
dosea
| Time-point
following 10 Gy irradiation
|
|---|
| Cell group | 5 Gy | 10 Gy | 15 Gy | 20 Gy | 12 h | 24 h | 36 h | 48 h |
|---|
| E | 5.60±1.78 | 19.83±1.18 | 32.08±2.08 | 35.15±2.11 | 27.11±1.12 | 21.69±1.60 | 28.83±2.15 | 27.43±1.50 |
| F | 6.54±1.50 | 29.16±2.37 | 37.81±2.13 | 41.06±3.27 | 30.22±1.45 | 32.17±1.49 | 35.49±1.38 | 32.43±1.87 |
| G | 9.48±1.48 | 31.46±1.32 | 37.43±1.84 | 40.71±1.78 | 32.14±2.10 | 34.55±2.24 | 37.34±2.49 | 36.88±2.28 |
| H | 9.90±0.08 | 31.69±3.93 | 36.90±2.17 | 41.18±1.09 | 31.33±1.98 | 36.21±2.51 | 37.96±3.08 | 38.05±3.20 |
Sphere formation in soft agar following
irradiation
For cell groups E–H, colony formation was also
evaluated using soft agar plate assays. In these assays,
CD133+ cells and CD133− cells for each group
(100 cells/well) were embedded in 0.3% agar gel, incubated for 36 h
under hypoxic or normoxic culture conditions, then were treated
with 10 Gy radiation. Fourteen days later, 0.5 ml MTT was added to
each well and colonies containing ≥50 cells were counted. Sphere
formation for CD133+ cells was found to be significantly
higher than that of CD133− cells both before and after
irradiation (P<0.001). Furthermore, sphere formation for hypoxic
Hep-2 cells (group E) was greater than that of the other three
groups before irradiation. However, after irradiation, sphere
formation for group E was observed to decrease, although this
difference was not significant (P>0.05). In contrast, sphere
formation for the other three groups decreased significantly
(P<0.05) (Table V).
| Table V.Sphere formation ratios. |
Table V.
Sphere formation ratios.
| Cell group | Before
radiation | After
radiation | P-value |
|---|
| E | 55.0±4.8 | 49.4±5.2 | >0.05 |
| F | 42.8±6.8 | 27.1±6.1 | <0.05 |
| G | 41.3±7.1 | 25.7±5.7 | <0.05 |
| H | 39.2±6.3 | 23.4±6.1 | <0.05 |
| P-value | <0.05 | <0.05 | |
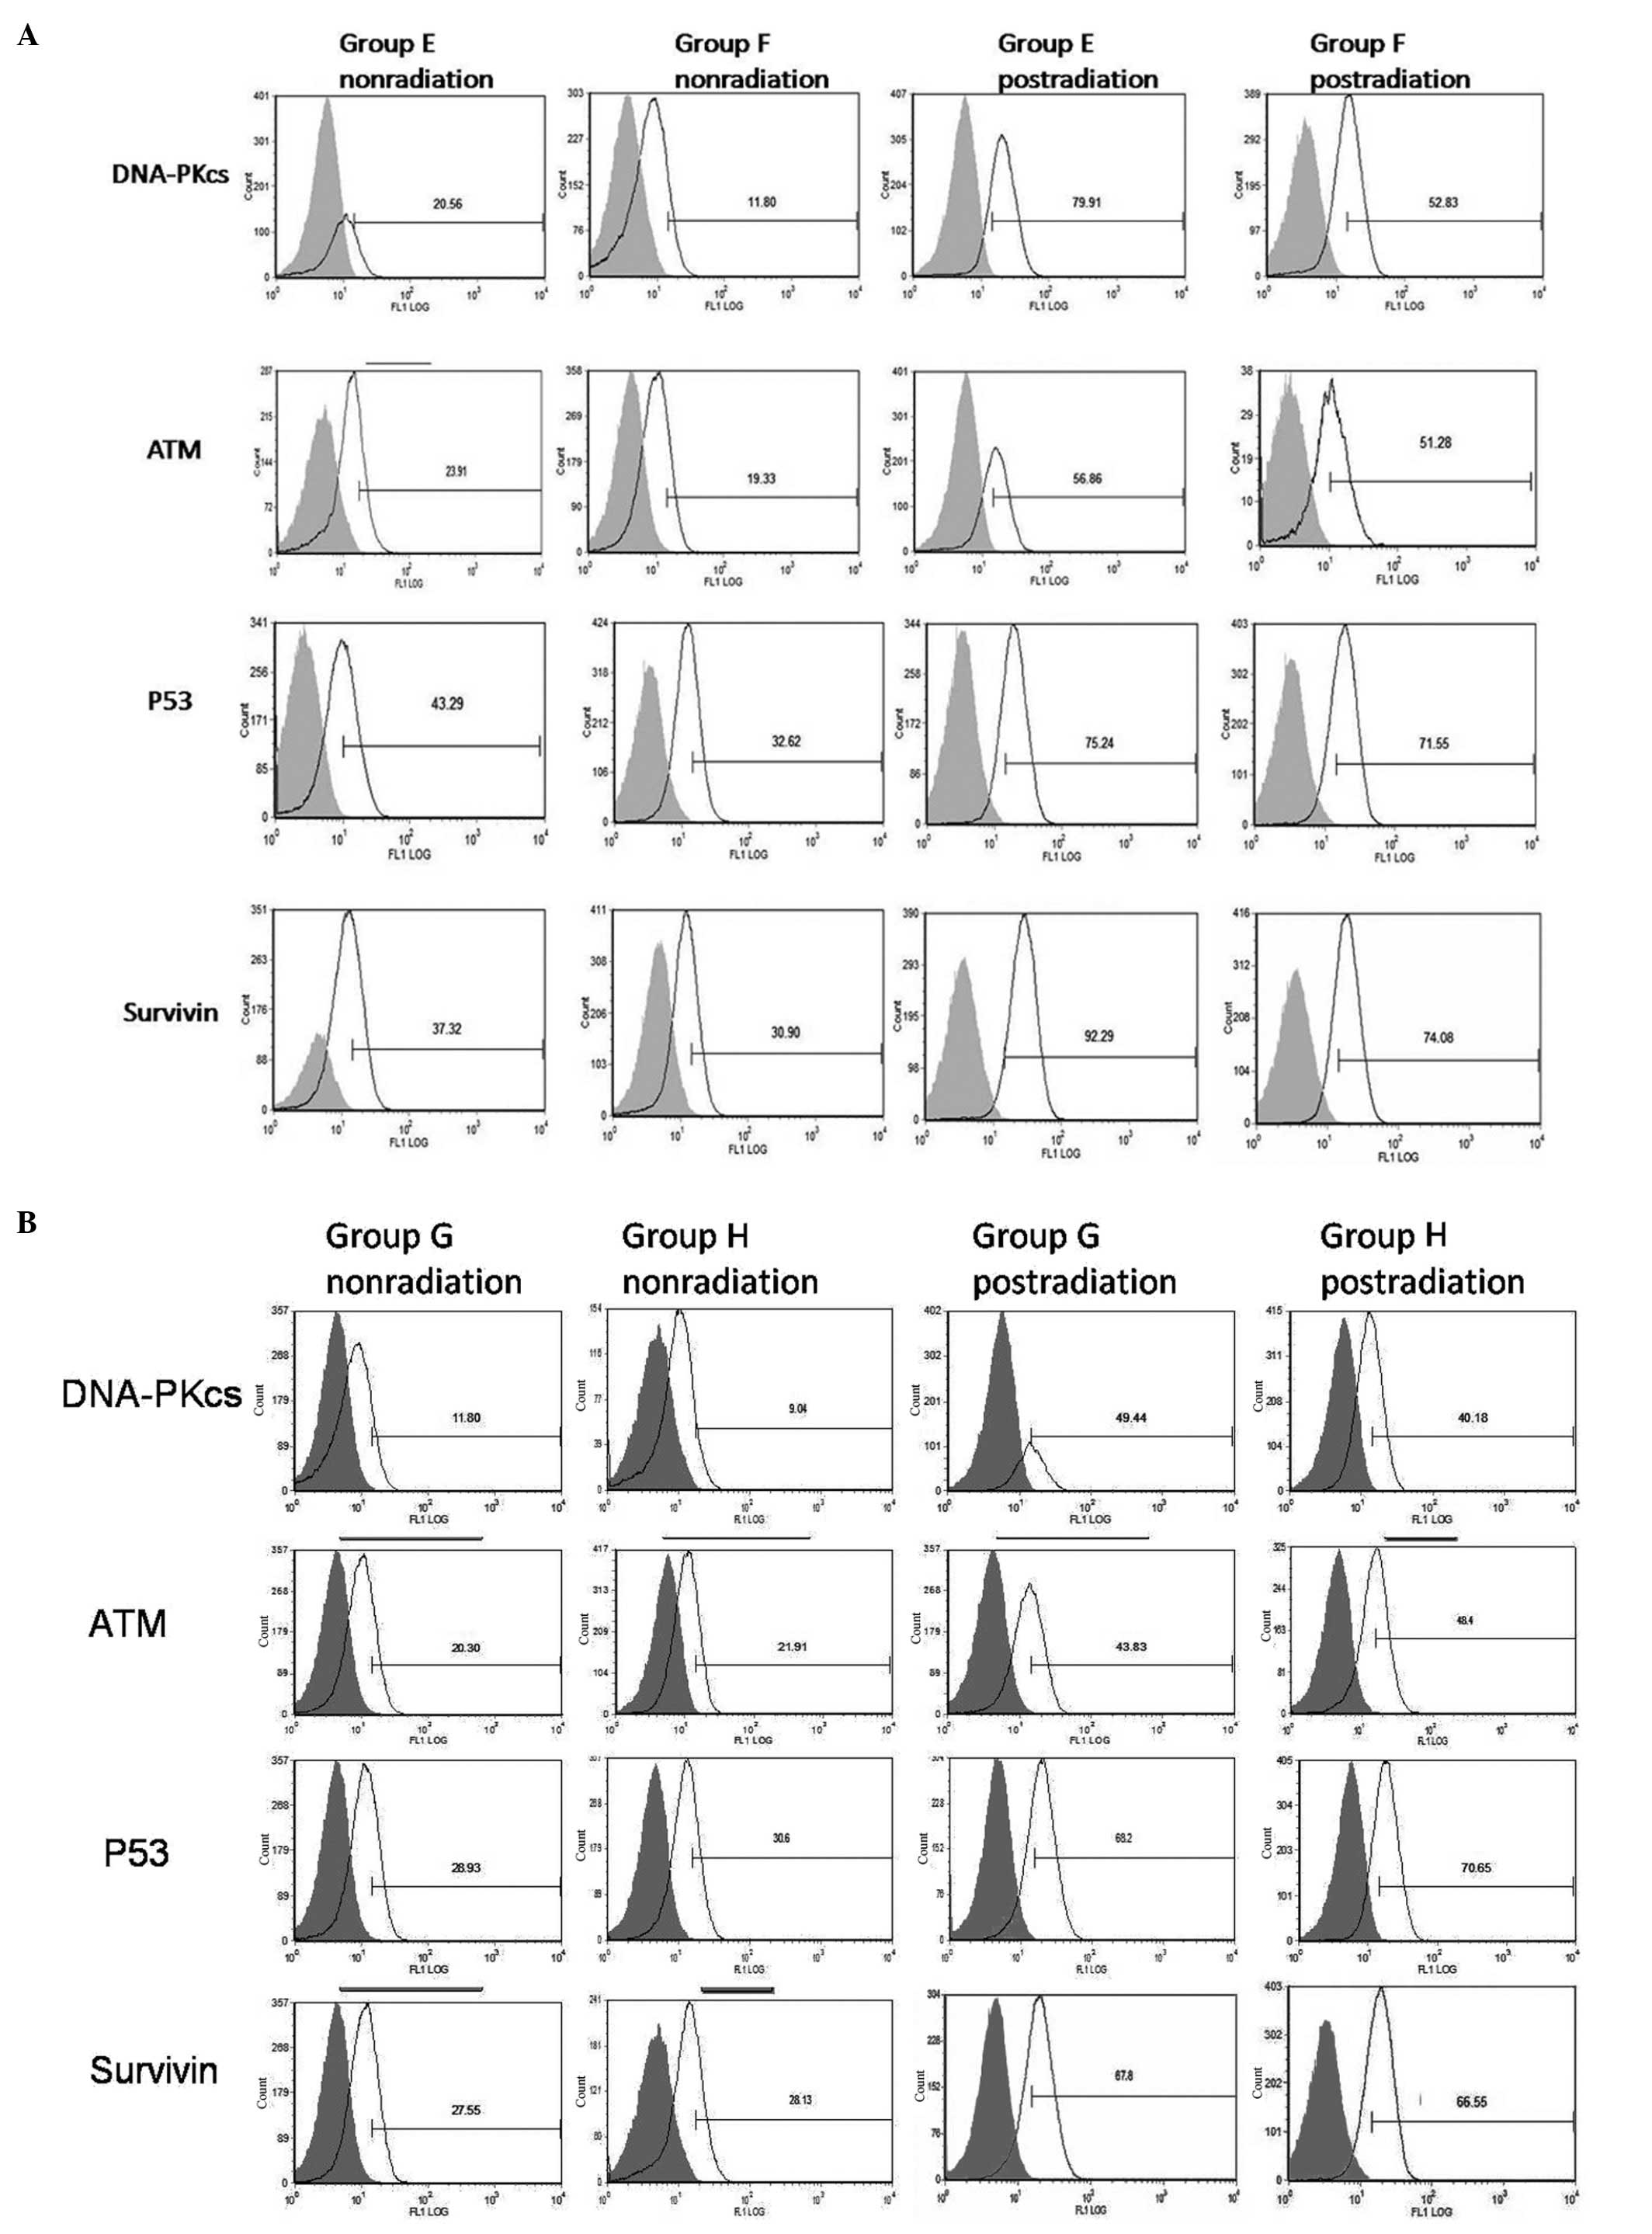
Levels of DNA-PKcs, ATM, survivin and p53
in CD133+ cells following irradiation
Expression of DNA-PKcs, ATM, survivin and p53 were
detected in CD133+ cells under hypoxic and normoxic
conditions, as well as under the same conditions with radiation
treatment (10 Gy), using fluorescence-activated flow cytometry.
Higher levels of expression were detected for all four proteins in
CD133+ cells compared with CD133− cells
following irradiation (P<0.01). Furthermore, radiation treatment
increased expression of all four proteins in CD133+
groups E–H. In group E, higher levels of DNA-PKcs and survivin
expression were detected following hypoxia and radiation compared
to groups F–H (P<0.05). Moreover, levels of DNA-PKcs and
survivin in CD133+ cells cultured under hypoxic versus
non-hypoxic conditions differed, yet this effect was absent in
parallel studies of CD133+ HIF-siRNA cells. For ATM and
p53, expression levels did not show significant changes in response
to hypoxia (P>0.05) (Fig. 7 and
Table VI). There was a slight
change in ATM levels detected for CD133+ cells cultured
under hypoxic conditions and treated with radiation. However, this
difference was not significant.
| Table VI.Levels of DNA-PKcs, ATM, survivin and
p53 proteins in CD133+ cells and CD133+
HIF-siRNA cells detected by flow cytometry. |
Table VI.
Levels of DNA-PKcs, ATM, survivin and
p53 proteins in CD133+ cells and CD133+
HIF-siRNA cells detected by flow cytometry.
| Radiation | Group E | Group F | Group G | Group H |
|---|
| DNA-PKcs | Before | 18.5±2.3 | 12.7±4.1 | 11.1±2.6 | 9.6±1.8 |
| After | 80.5±2.1 | 54.1±2.5 | 48.5±3.4 | 44.1±5.7 |
| ATM | | | | | |
| Before | 25.0±1.5 | 19.4±1.0 | 20.2±2.2 | 21.1±1.5 |
| After | 55.3±2.2 | 52.7±2.0 | 45.6±3.3 | 47.8±4.1 |
| p53 | | | | | |
| Before | 44.5±4.7 | 33.6±3.3 | 29.6±2.8 | 31.1±3.0 |
| After | 74.8±3.0 | 71.4±3.2 | 68.7±4.1 | 70.3±3.9 |
| Survivin | | | | | |
| Before | 35.8±2.4 | 30.1±3.1 | 27.1±3.2 | 29.2±3.7 |
| After | 92.5±3.3 | 74.9±4.7 | 68.6±5.1 | 67.1± 5.6 |
Discussion
Consistent with previous studies, culturing of Hep-2
cells under hypoxic conditions resulted in higher levels of HIF-1α.
Hypoxia-induced radioresistance was also observed in growth
inhibition assays, suggesting that downstream targets of HIF-1α,
including vascular endothelial growth factor (VEGF), p53 and, may
contribute to the radiosensitivity phenotype of Hep-2 cells.
CD133+ cells exhibit cancer stem
cell-like characteristics (24)
and this was confirmed in the present study. However, the
percentage of CD133+ cells detected in Hep-2 cells with
or without HIF-1α expression ranged from 0.8 to 1.5% and this range
was somewhat lower than previously reported (24–26).
However, the ratio of CD133+ cells increased under
hypoxic conditions, consistent with previous reports (27,28).
Based on the observation that the ratio of
CD133+ cells detected in all groups increased following
irradiation and the greatest increase was exhibited by Hep-2 cells
cultured under hypoxic conditions (group A), we hypothesize that
radiation affected a larger number of CD133− cells than
CD133+ cells, with the latter being radioresistant.
Furthermore, the highest percentage of CD133+ cells was
found in group A both before and after irradiation among groups
A–D, suggesting that HIF-1α induced by hypoxia could potentially
promote the proliferation of CD133+ cells, leading to
increased radioresistance by group A.
The observation that levels of CD133+
cells increased for all four groups 24 h after a 10 Gy radiation
dose, then decreased in a radiation dose and time-dependent manner,
revealed that 10 Gy of radiation could induce the greatest killing
effect to CD133− cells. In contrast, the same dose did
not seem to affect the majority of CD133+. However, when
larger doses of radiation were administered, a greater proportion
of CD133+ cells were killed, resulting in an increase in
growth inhibition ratios. Moreover, 24 h after irradiation, the
greatest change in growth inhibition ratios was observed,
suggesting that CD133− cells were killed, resulting in
an increase in the percentage of CD133+ cells remaining.
Subsequently, CD133+ cells began to proliferate and
differentiate into CD133− cells. As a result, both the
ratio of CD133+ cells and the associated growth
inhibition ratio, decreased. Taken together, these observations
suggest that CD133+ cells possess a radioresistant
capacity and hypoxia enhances this property.
To investigate possible mechanism(s) of
radioresistance by CSCs and the role of hypoxia in this process,
CD133+ Hep-2 cells were isolated and cultured in SFM.
Sphere forming assays have been performed to characterize the
self-renewal capacity of CSCs in a variety of studies and cells
that are able to form spheres are widely regarded as CSCs (29–33).
In the present study, spheres formed in SFM within a week and
subsequently increased in size. When the purity of these spheres
was checked by flow cytometry, the percentage of CD133+
cells was 92.8% and 2 weeks later, was 88.3%. These results
indicate that most of the CD133+ cells had not
differentiated. Furthermore, 2 weeks after CD133+ cells
received a dose of radiation (10 Gy), the growth inhibition ratio
for hypoxic Hep-2 cells (group A) was lower than that of the other
three groups. Based on these results, we hypothesize that hypoxia
enhances the radioresistance of CD133+ cells and the
results of the sphere formation assays performed using
CD133+ cells support this hypothesis.
To investigate potential mechanisms for the
radioresistant phenotype associated with Hep-2 cells, expression
levels of DNA-PKcs, ATM, survivin and p53 were detected in
CD133+ cells before and after treatment with radiation.
DNA-PKcs and ATM represent key enzymes in two DNA repair pathways,
DNA nonhomologous end-joining (NHEJ) and homologous recombination
(HR), respectively. Both proteins belong to the family of PI3K
protein kinases and DNA-PK initiates the process of DNA repair
(34), while ATM responds to DNA
damage by phosphorylating cell cycle regulating kinases such as
Chk1 and Chk2 (35). Survivin is
an anti-apoptosis gene whose activation and distribution are also
affected by DNA-PK and ATM and survivin has been found to have an
important role in the generation and development of tumors
(36). p53 is an anti-oncogene
that has been shown to inhibit tumor invision via the formation of
the complex, wtp53-MDM2-Slug (37). However, mutated p53 mediates the
opposite effect and in this study, mutated p53 (DO-1) was detected.
Expression levels for these four proteins detected in groups E-H
were higher following irradiation and were higher compared to
levels detected in CD133− cells. These results suggest
that DNA damage repair in CD133+ cells is more active,
consistent with the radioresistance exhibited by CD133+
cells.
Following irradiation, cells arrested in the G1
phase and a checkpoint response was initiated. When ATM is
activated, Chk1 and Chk2 are subsequently activated to repair
injured DNA. Furthermore, p53 is affected by ATM. Therefore, the
increase in levels of mutated p53 could have weakened the
inhibition of survivin, thereby leading to increased expression of
survivin. In addition, DNA-PK and ATM also have the capacity to
increase expression of survivin. With higher levels of survivin and
mutated p53 present in Hep-2 cells, apoptosis would be inhibited.
After irradiation, expression of DNA-PKcs and survivin in hypoxic
Hep-2 cells (group E) was found to be higher than in the other
three groups. In contrast, levels of ATM and p53 appeared
unchanged. Taken together, these results indicate that under
hypoxic conditions, enhanced DNA repair mediated by NHEJ was
activated and DNA-PK played a key role.
In conclusion, CD133+ cells exhibit
characteristics of cancer stem cells, namely the ability to become
tumor cells, the capacity for self-renewal and the ability to
undergo differentiation and thus, have the potential to play a key
role in the radioresistant phenotype of Hep-2 cells. Furthermore,
radioresistance of CD133+ cells was enhanced by hypoxic
conditions and was associated with an increase in DNA-PK activity.
These results suggest that the NHEJ pathway of DNA repair is a
mechanism that contributes to the radioresistant phenotype
exhibited by laryngeal carcinomas.
Acknowledgements
The technical assistance of Professor
Yong Zhao and Hongran Li (State Key Laboratory of Biomembrane and
Membrane Biotechnology, Chinese Academy of Sciences) is highly
acknowledged. This study was supported by The Jieping Wu Medicine
Foundation of China (grant 320.6750.10121).
References
|
1.
|
Nix P, Greenman J, Cawkwell L and Stafford
N: Radioresistant laryngeal cancer: beyond the TNM stage. Clin
Otolaryngol Allied Sci. 29:105–114. 2004. View Article : Google Scholar : PubMed/NCBI
|
|
2.
|
Velasco-Velázquez M, Homsi N, De L and
Pestell R: Breast cancer stem cells. Int J Biochem Cell Biol.
44:573–577. 2012.
|
|
3.
|
Vaiopoulos A, Kostakis I, Koutsilieris M
and Papavassiliou A: Colorectal cancer stem cells. Stem Cells.
30:363–371. 2012. View Article : Google Scholar
|
|
4.
|
Guerrero-Cazares H, Attenello FJ and
Quinones-Hinojosa A: Stem cells in gliomas. Handb Clin Neurol.
104:63–73. 2012. View Article : Google Scholar
|
|
5.
|
Mannelli G and Gallo O: Cancer stem cells
hypothesis and stem cells in head and neck cancers. Cancer Treat
Rev. 38:515–539. 2012. View Article : Google Scholar : PubMed/NCBI
|
|
6.
|
Tu S and Lin S: Prostate cancer stem
cells. Clin Genitourin Cancer. 10:69–76. 2012. View Article : Google Scholar
|
|
7.
|
Singh S, Hawkins C, Clarke I, et al:
Identification of human brain tumour initiating cells. Nature.
432:396–401. 2004. View Article : Google Scholar : PubMed/NCBI
|
|
8.
|
Chen Y, Hsu H, Chen Y, et al: Oct-4
expression maintained cancer stem-like properties in lung
cancer-derived CD133-positive cells. PLoS One. 3:e26372008.
View Article : Google Scholar : PubMed/NCBI
|
|
9.
|
Hermann P, Huber S, Herrler T, et al:
Distinct populations of cancer stem cells determine tumor growth
and metastatic activity in human pancreatic cancer. Cell Stem Cell.
1:313–323. 2007. View Article : Google Scholar : PubMed/NCBI
|
|
10.
|
Ma S, Chan K, Lee T, et al: Aldehyde
dehydrogenase discriminates the CD133 liver cancer stem cell
populations. Mol Cancer Res. 6:1146–1153. 2008. View Article : Google Scholar : PubMed/NCBI
|
|
11.
|
Miki J, Furusato B, Li H, et al:
Identification of putative stem cell markers, CD133 and CXCR4, in
hTERT-immortalized primary nonmalignant and malignant tumor-derived
human prostate epithelial cell lines and in prostate cancer
specimens. Cancer Res. 67:3153–3161. 2007. View Article : Google Scholar
|
|
12.
|
Zhang Q, Shi S, Yen Y, Brown J, Ta J and
Le A: A subpopulation of CD133 (+) cancer stem-like cells
characterized in human oral squamous cell carcinoma confer
resistance to chemotherapy. Cancer Lett. 289:151–160. 2009.
|
|
13.
|
Matsumoto K, Arao T, Tanaka K, et al: mTOR
signal and hypoxia inducible factor-1 alpha regulate CD133
expression in cancer cells. Cancer Res. 69:7160–7164. 2009.
View Article : Google Scholar : PubMed/NCBI
|
|
14.
|
Wei X, Zhou L, Cheng L and Tian J:
Experimental investigation of CD133 as a putative marker of
tumor-initiating cell in laryngeal carcinoma. Chin J
Otorhinolaryngol Head Neck Surg. 41:940–944. 2006.PubMed/NCBI
|
|
15.
|
Ailles L and Weissman I: Cancer stem cells
in solid tumors. Curr Opin Biotechnol. 18:460–466. 2007. View Article : Google Scholar : PubMed/NCBI
|
|
16.
|
Bao S, Wu Q, McLendon R, et al: Glioma
stem cells promote radioresistance by preferential activation of
the DNA damage response. Nature. 444:756–760. 2006. View Article : Google Scholar : PubMed/NCBI
|
|
17.
|
Liu G, Yuan X, Zeng Z, et al: Analysis of
gene expression and chemoresistance of CD133+ cancer
stem cells in glioblastoma. Mol Cancer. 5:672006. View Article : Google Scholar : PubMed/NCBI
|
|
18.
|
Nie D: Cancer stem cell and niche. Front
Biosci (Schol Ed). 2:184–193. 2010. View
Article : Google Scholar
|
|
19.
|
Iwasaki H and Suda T: Cancer stem cells
and their niche. Cancer Sci. 100:1166–1172. 2009. View Article : Google Scholar : PubMed/NCBI
|
|
20.
|
Julie B, Sneddon and Zena W: Location,
location, location: the cancer stem cell niche. Cell Stem Cell.
1:607–611. 2007. View Article : Google Scholar : PubMed/NCBI
|
|
21.
|
McCord A, Jamal M, Shankavaram U, Lang F,
Camphausen K and Tofilon P: Physiologic oxygen concentration
enhances the stem-like properties of CD133+ human
glioblastoma cells in vitro. Mol Cancer Res. 7:489–497. 2009.
View Article : Google Scholar : PubMed/NCBI
|
|
22.
|
Mazumdar J, Dondeti V and Simon M:
Hypoxia-inducible factors in stem cells and cancer. J Cell Mol Med.
13:11–12. 2009. View Article : Google Scholar : PubMed/NCBI
|
|
23.
|
Kessler J, Hahnel A, Wichmann H, et al:
HIF-1alpha inhibition by siRNA or chetomin in human malignant
glioma cells: effects on hypoxic radioresistance and monitoring via
CA9 expression. BMC Cancer. 10:6052010. View Article : Google Scholar : PubMed/NCBI
|
|
24.
|
Wei X, Zhou L, Cheng L, Tian J, Jiang J
and Maccallum J: In vivo investigation of CD133 as a putative
marker of cancer stem cells in Hep-2 cell line. Head Neck.
31:94–101. 2009. View Article : Google Scholar : PubMed/NCBI
|
|
25.
|
Patrawala L, Calhoun T,
Schneider-Broussard R, Zhou J, Claypool K and Tang D: Side
population is enriched in tumorigenic, stemlike cancer cells,
whereas ABCG2+ and ABCG2-cancer cells are similarly
tumorigenic. Cancer Res. 65:6207–6219. 2005. View Article : Google Scholar : PubMed/NCBI
|
|
26.
|
Kondo T, Setoguchi T and Taga T:
Persistence of a small subpopulation of cancer stem-like cells in
the C6 glioma cell line. Proc Natl Acad Sci USA. 101:781–786. 2004.
View Article : Google Scholar : PubMed/NCBI
|
|
27.
|
Soeda A, Park M, Lee D, et al: Hypoxia
promotes expansion of the CD133-positive glioma stem cells through
activation of HIF-1alpha. Oncogene. 28:3949–3959. 2009. View Article : Google Scholar : PubMed/NCBI
|
|
28.
|
Hashimoto O, Shimizu K, Semba S, et al:
Hypoxia induces tumor aggressiveness and the expansion of
CD133-positive cells in a hypoxia-inducible factor-1α-dependent
manner in pancreatic cancer cells. Pathobiology. 78:181–192.
2011.PubMed/NCBI
|
|
29.
|
Wicha M: Hedgehog signaling and Bmi-1
regulate self-renewal of normal and malignant human mammary stem
cells. Cancer Res. 66:6063–6071. 2006. View Article : Google Scholar : PubMed/NCBI
|
|
30.
|
Diamandis P, Wildenhain J, Clarke I, et
al: Chemical genetics reveals a complex functional ground state of
neural stem cells. Nat Chem Biol. 3:268–273. 2007. View Article : Google Scholar : PubMed/NCBI
|
|
31.
|
Beier D, Hau P, Proescholdt M, et al:
CD133 (+) and CD133 (−) glioblastoma-derived cancer stem cells show
differential growth characteristics and molecular profiles. Cancer
Res. 67:4010–4015. 2007.
|
|
32.
|
Ponti D, Costa A, Zaffaroni N, et al:
Isolation and in vitro propagation of tumorigenic breast cancer
cells with stem/progenitor cell properties. Cancer Res.
65:5506–5511. 2005. View Article : Google Scholar : PubMed/NCBI
|
|
33.
|
Yu F, Yao H, Zhu P, et al: let-7 regulates
self renewal and tumorigenicity of breast cancer cells. Cell.
131:1109–1123. 2007. View Article : Google Scholar : PubMed/NCBI
|
|
34.
|
Dobbs T, Tainer J and Lees-Miller S: A
structural model for regulation of NHEJ by DNA-PKcs
autophosphorylation. DNA Repair. 9:1307–1314. 2010. View Article : Google Scholar : PubMed/NCBI
|
|
35.
|
Tomita M: Involvement of DNA-PK and ATM in
radiation- and heat-induced DNA damage recognition and apoptotic
cell death. J Radiat Res. 51:493–501. 2010. View Article : Google Scholar : PubMed/NCBI
|
|
36.
|
Asumen M, Ifeacho T, Cockerham L, Pfandl C
and Wall N: Dynamic changes to survivin subcellular localization
are initiated by DNA damage. Onco Targets Ther. 3:129–137.
2010.PubMed/NCBI
|
|
37.
|
Wang S, Wang W, Chang Y, et al: p53
controls cancer cell invasion by inducing the MDM2-mediated
degradation of Slug. Nat Cell Biol. 11:694–705. 2009. View Article : Google Scholar : PubMed/NCBI
|
|
38.
|
Qu Y, Li X, Xu O, Wang M and Lu X: Impacts
of hypoxia on the features and chemoresistance of cancer stem cells
in Hep-2 cells and underlying mechanism. Chin J Otorhinolaryngol
Head Neck Surg. 47:228–233. 2012.PubMed/NCBI
|