Introduction
Lung cancer is the most frequent cause of
cancer-related death worldwide, according for ∼1.4 million deaths
per year (1). Adenocarcinoma (AD)
predominates over squamous, large cell or small cell carcinomas as
the major tumor type and involves different carcinogenic mechanisms
besides tobacco genotoxicity. The identification of multiple
genetic abnormalities which drive oncogenic signaling pathways,
such as EGFR mutations and ALK fusions, has led to the development
of new targeted therapies in a subset of patients (2,3).
However, the molecular mechanism in many AD patients still remains
to be understood.
Array comparative genomic hybridization (array CGH)
facilitates gene discovery by enabling precise mapping of the
clones of interest to specific locations on the human genome map.
With increasing density of clone coverage of the genome, it has
been shown that small DNA aberrations at sub-megabase levels can be
identified (4). Our previous
analyses on lung ADs with metaphase CGH have demonstrated several
typical genomic aberrations. However, aberrations <10–20 Mb
could be difficult to identify and little is known about the
candidate tumor genes residing in them.
In the present study, we detected 36 lung AD cases
by array CGH to identify genomic imbalances, using an array that
consists of BAC or PAC clones covering the whole genome at an
average of 1 Mb interval. Then comparison between patient groups
was also performed to identify aberrations associated with clinical
and tumor characteristics. Furthermore, 23 selected genes according
to array data were studied by real-time quantitative PCR (real-time
qPCR) to identify the potential candidate genes that could play a
critical role in AD progression.
Materials and methods
Study samples
Resection specimens of 36 ADs were recruited for
study with written informed consent at the Grantham Hospital, Hong
Kong after institutional review board approval. All patients were
ethnic Chinese, and none had received any preoperative radiation
therapy or chemotherapy. Demographic and clinical data were
collected by the designated clinician. Non-smokers (NS) were
patients who had smoked <100 cigarettes in the life-time;
ex-smokers (EX) were those who had consumed >100 cigarettes but
who had stopped smoking for at least one year before recruitment;
current smokers (SM) were patients who were still smoking at the
time of recruitment; passive smokers (PS) were those regularly
exposed to environmental tobacco smoke at home or at work places.
Tumor classification and grading were independently performed by 2
qualified pathologists according to the WHO classification of lung
tumors (2004). Details of the clinicopathological data of the 36
patients were shown in Table
I.
 | Table I.Clinicopathological data of 36 primary
lung adenocarcinomas. |
Table I.
Clinicopathological data of 36 primary
lung adenocarcinomas.
| No. | % of total |
|---|
| Gender | | |
| Female | 24 | 67 |
| Male | 12 | 33 |
| Age (years) | | |
| <50 | 3 | 8 |
| 50–59 | 11 | 31 |
| 60–69 | 12 | 33 |
| ≥70 | 10 | 28 |
| Smoking history | | |
| Non-smoker | 22 | 61 |
| Current smoker | 8 | 22 |
| Ex-smoker | 2 | 6 |
| Passive smoker | 4 | 11 |
| Differentiation | | |
| Well | 18 | 50 |
| Moderate | 15 | 42 |
| Poor | 3 | 8 |
| TNM stage | | |
| I | 24 | 67 |
| II | 6 | 17 |
| III | 5 | 14 |
| IV | 1 | 3 |
Tumor tissues were snap frozen within 30 min of
resection and kept at −70°C until use. Haematoxylin and eosin
stained sections were examined histologically prior to DNA and RNA
extraction. Areas showing high tumor cell density with preserved
morphology, low stromal and inflammatory cell content were
dissected for study, and non-neoplastic or necrotic areas were
avoided or dissected away to ensure the presence of at least 70% of
tumor content. Peripheral blood mononuclear cells of 15 each of
male or female young healthy adults were examined cytogenetically
to ensure normal karyotypes, after which DNA was extracted, pooled
and used as reference DNA for array CGH. For real-time qPCR, to
ensure comparability of results from different test samples, all
the cDNA used in the present study were prepared from a fixed
amount of starting RNA and reverse-transcribed according to the
same protocol after strict quality check to ensure absence of RNA
degradation. All aliquots of samples and replicates of each case
used in the analysis of every gene were taken from the same sample
stock to ensure consistency of quality and amount of material
input.
Array CGH and data analysis
The DNA microarray contained 2621 non-overlapping
BAC and PAC clones in duplicates that spanned the entire genome at
an average density of 1 Mb per clone (Human BAC Arrays; Spectral
Genomics, Inc., Houston, TX, USA). Clone information was provided
by the chip manufacturer and clone position was mapped according to
the National Center for Biotechnology Information MapViewer
database, build 37.2. Extracted tumor and reference DNA was treated
with RNase A and digested by DpnII (New England Biolabs),
followed by purification using high pure PCR product purification
kit (Roche). Each of test and reference DNA (0.5 μg) were,
respectively, labeled by BioPrime® DNA Labeling kit
(Invitrogen), modified to include dATP, dGTP and dTTP (10 nmol
each), dCTP (0.3 nmol), Cy5-dCTP or Cy3-dCTP (0.3 nmol) and 1
μl Klenow fragment in a 50 μl reaction volume.
Unincorporated nucleotides were removed by MicroSpin G-50 columns
(Amersham Pharmacia Biotech, Inc., Piscataway, NJ, USA). Probe size
was optimized to 100–700 bp. Labeled test and sex-matched reference
DNA were co-precipitated with human Cot-1 DNA and Salmon Sperm
Testis DNA and resuspended in 50 μl of hybridization buffer.
For hybridization, the probe mix was first denatured and incubated
at 37°C for 60 min to allow pre-annealing of Cot-1 DNA. It was then
added to the array under a glass cover-slip and hybridized for
16–18 h at 37°C. Afterwards, the arrays were washed briefly in 2X
SSC/0.5% SDS, 50% formamide/2X SSC at 50°C for 20 min, 2X SSC/0.1%
NP40 for 20 min and finally 0.2X SSC for 10 min at 50°C. The arrays
were then rinsed in water and air dried. For each sample, two
separate hybridizations were performed with reversed dye labeling
to obtain 2 reciprocal datasets for analysis.
Hybridization signals were scanned with ScanArray
5000 (Packard BioScience) and captured images were analyzed using
QuantArray 3.0 software (Packard BioChip Technologies). For each
array, the Cy5/Cy3 signal intensity ratios were normalized
according to the recommendations of the chip manufacturer. Briefly,
the mean ratio and standard deviation (SD) of all target spots were
calculated. A normalization constant was then derived from spots
within the overall mean ± 1.5 SD range. Readings from duplicate
targets were averaged to yield a single intensity ratio. Cy5/Cy3
intensity ratios of <0.85 or >1.15 were considered to show
DNA copy number alterations (CNA). These threshold values were
similar to those adopted in other array CGH studies of solid tumors
using BAC array platforms (5,6).
High level CNA were designated for ratios of <0.5 and >1.5.
Two repeats of normal vs. normal hybridizations with pooled normal
DNA were performed to ensure consistency of criteria. For each
target, the final status of DNA gain or loss was assigned only if
the reciprocal ratios of the dye-reversal experiments yielded
concordant results. Loci showing imbalances in the control
experiments or with inconsistent map positions were omitted during
data interpretation.
Fluorescence in situ hybridization
(FISH)
Dual color FISH analysis was performed on paraffin
tumor tissue sections. PAC clone RP5-885L7 (20q13.3, 60.9 Mb),
corresponding to loci of DNA gain by array CGH, was used as test
probe. The test probes were labeled by nick translation with
SpectrumOrange (Vysis, Downers Grove, IL, USA). Procedures of probe
labeling and FISH analysis were according to previously published
protocols (7).
Real-time qPCR
Twenty-three genes were selected for evaluation in
the present study. These genes should be in the aberrant loci by
array CGH and involved in biological processes with potential
enhancing effects on tumor development and progression, such as
cell proliferation, cell cycle control, cell death, cell adhesion
and transcriptional regulation. Twenty genes were selected from
regions of genomic gain and 3 genes were from frequently deleted
regions.
Real-time qPCR analysis was performed using the ABI
PRISM 7700 Sequence Detection system (PE Applied Biosystems).
Primer and probe sets of the selected genes were commercially
obtained (Assay-on demand TaqMan® Gene Expression
Assays; Applied Biosystems). Samples were analyzed in duplicate and
repeated for verification where appropriate. The comparative Ct
method was used for the calculation of relative level of a test
gene in a given tumor sample normalized according to β2M as
reference for cDNA input. Results were presented as
log2-transformed ratios between the tumor and pooled
normal lung samples.
Statistical analysis
Statistical analysis was performed with the SPSS
18.0.0 software. Chi-square or Fisher’s exact test was used to
compare aberrant loci between tumors of different
clinicopathological characteristics. Student’s t-test for
independent samples was used for the comparison of mean expression
levels between different clinicopathological groups for individual
genes. A two-sided P-value of <0.05 was taken as indicating a
statistically significant result.
Results
Genomic CNA identified by array CGH
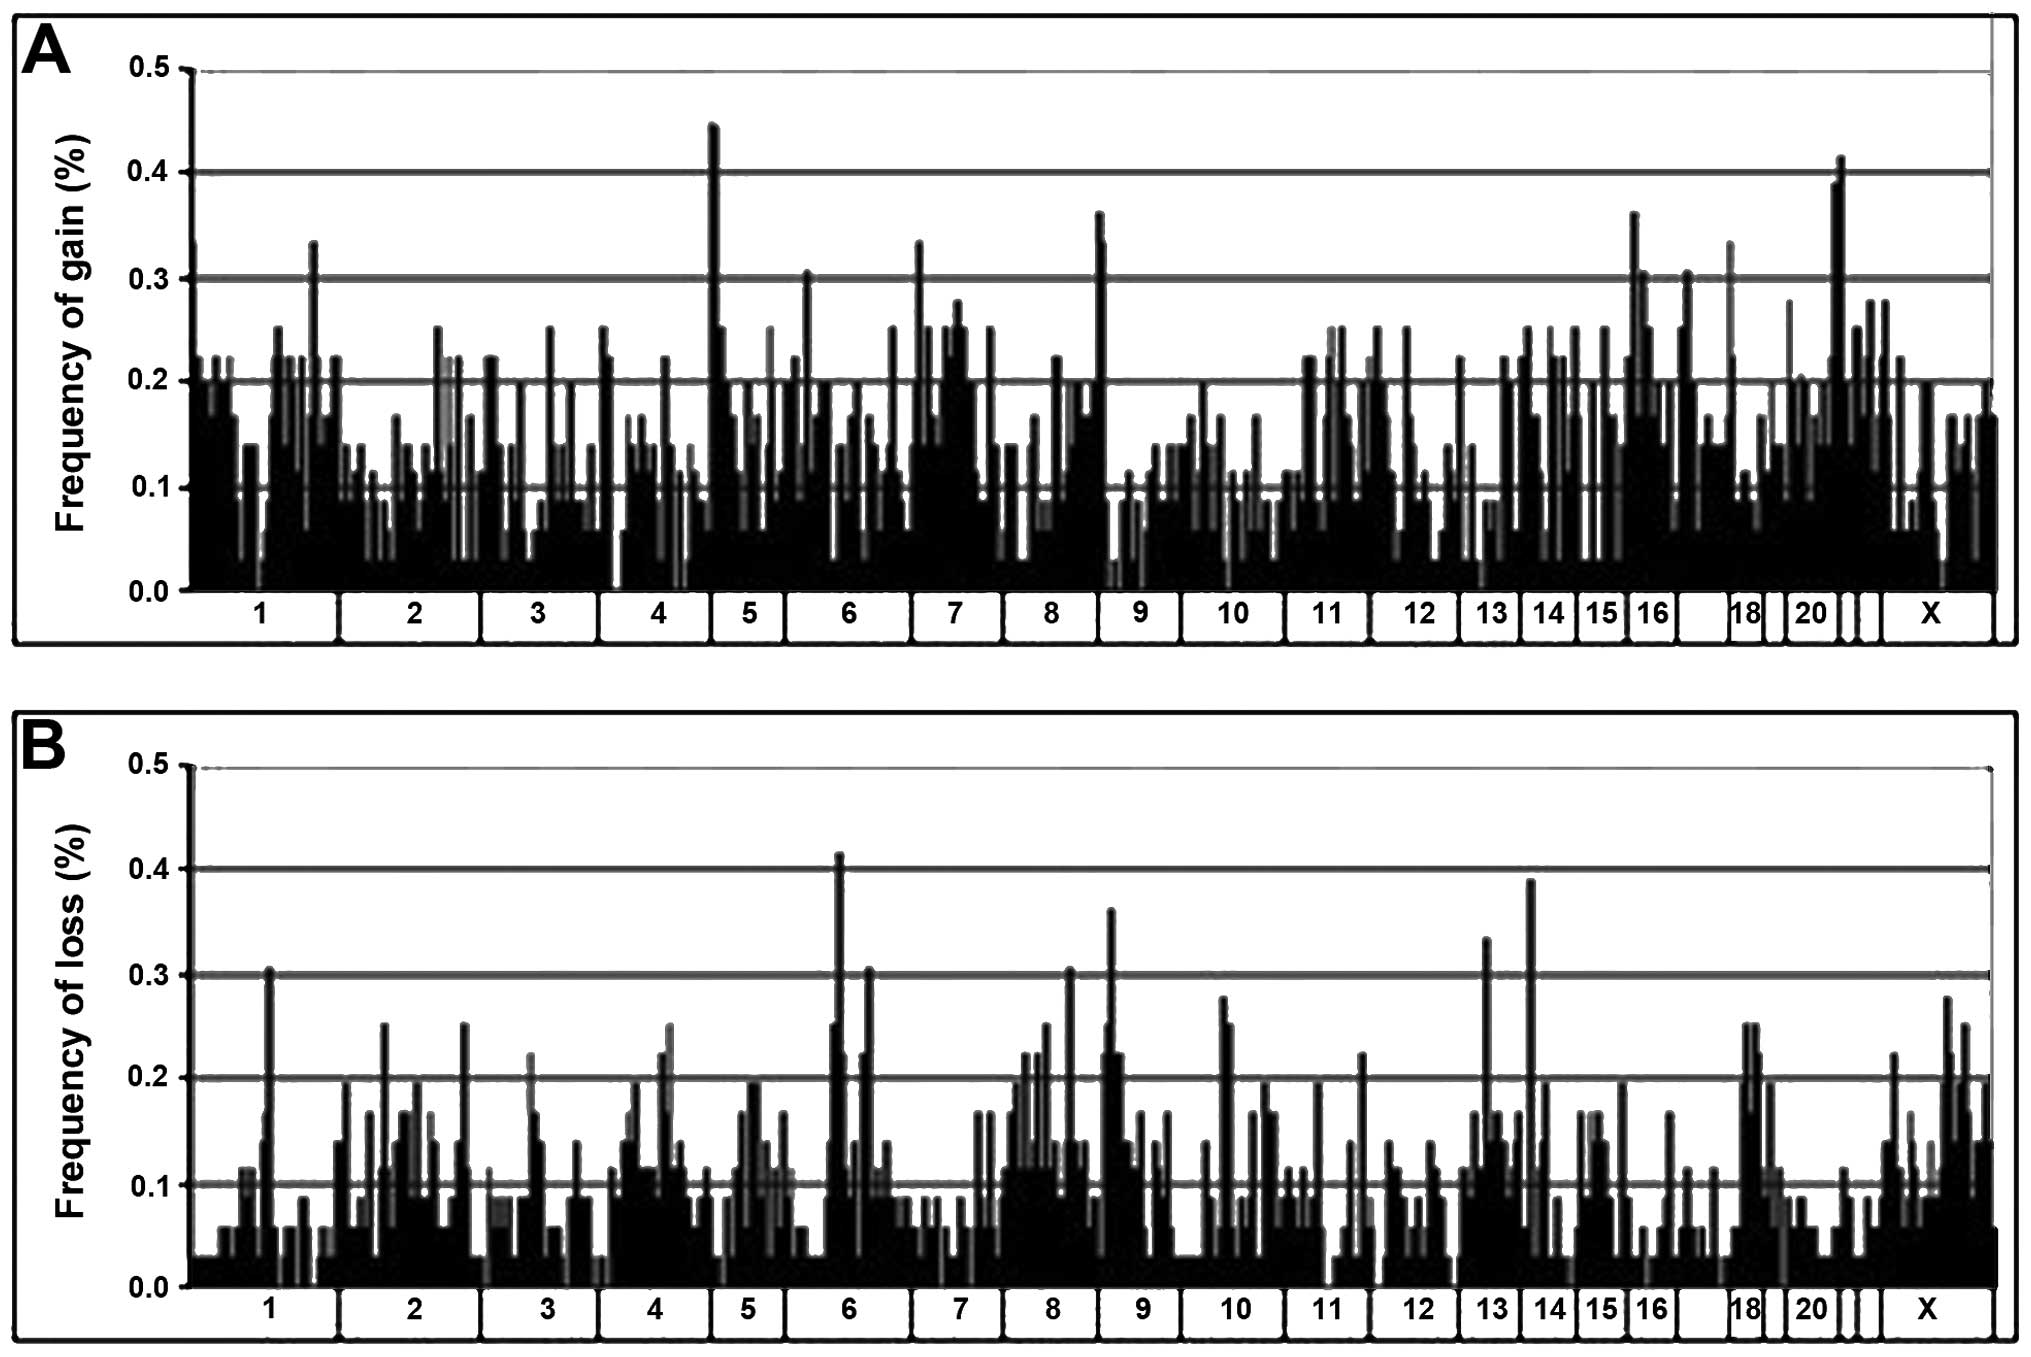
All the 36 ADs analyzed showed genomic imbalances,
with a mean of 221.6±168.4 (8.5±6.4%) aberrations per tumor.
Overall, DNA gains (mean, 131.6) were more frequent than losses
(mean, 90.1). Graphical representation of the alteration
frequencies of all loci along each chromosome is presented in
Fig. 1.
The distribution of DNA imbalances was non-uniform.
Clustering of aberrations was observed, where multiple altered loci
were found in contiguous genomic sites or closely within the same
cytogenetic band. These clustered alterations were mainly found
within 1p, 1q, 5p, 5q, 7p, 7q, 8q, 11q, 12p, 13q, 16p, 17q and 20q
for DNA gain and within 6q, 9p, 10q and 18q for DNA loss. Regions
containing alterations in 6 or more tumors are listed in Table II. The genomic distances they
spanned ranged from 0.3 to 8.4 Mb. The most frequently gained loci
were within 5p15.33-p15.31 (44.4%), 20q13.31-20q13.33 (38.9%),
8q24.21-q24.3 (36.1%), 16p13.3-p13.12 (36.1%), followed by 1p36.32,
1q32.1 and 17q25.3 (33.3%). The commonest loci of loss were within
9p23 (36.1%), followed by 6q16.3 (30.6%).
| Table II.Clustered aberrations of DNA gain
(upper panel) and loss (lower panel) spanned by multiple clones
detected by array CGH in lung adenocarcinomas. |
Table II.
Clustered aberrations of DNA gain
(upper panel) and loss (lower panel) spanned by multiple clones
detected by array CGH in lung adenocarcinomas.
| Cytoband | Region size | Clone name | Chromosome start
position (Mb) | % Gain (n=36) |
|---|
| 1p36.32 | 1.4 Mb | RP1-163G9 | chr1_3.0 | 33.3 |
| | RP11-447M5 | chr1_4.2 | 27.8 |
| 1p36.23-p36.21 | 3.3 Mb | RP11-476D13 | chr1_9.2 | 22.2 |
| | AL031984.13 | chr1_10.4 | 22.2 |
| | RP5-888M10 | chr1_12.4 | 16.7 |
| 1q21.2-q21.3 | 3.3 Mb | RP4-790G17 | chr1_147.0 | 22.2 |
| | RP11-71L20 | chr1_148.1 | 25.0 |
| | RP1-148L21 | chr1_150.3 | 22.2 |
| 1q25.3 | 1.5 Mb | RP11-63O2 | chr1_180.7 | 22.2 |
| | RP11-79I7 | chr1_182.0 | 19.4 |
| 1q32.1 | 3.9 Mb | RP11-150L7 | chr1_197.9 | 16.7 |
| | RP11-246J15 | chr1_198.9 | 16.7 |
| | RP11-335O13 | chr1_199.8 | 25.0 |
| | RP11-80N9 | chr1_201.4 | 16.7 |
| | RP11-243M13 | chr1_201.6 | 33.3 |
| 1q44 | 3.4 Mb | RP1-241M7 | chr1_240.7 | 19.4 |
| | RP11-91C5 | chr1_242.5 | 22.2 |
| | RP11-656O22 | chr1_244.1 | 22.2 |
| 5p15.33-p15.31 | 3.4 Mb | RP11-20B3 | chr5_3.1 | 44.4 |
| | RP11-89N22 | chr5_4.1 | 36.1 |
| | AC010635.6 | chr5_6.3 | 22.2 |
| 5p15.31-p15.2 | 5.0 Mb | RP11-91M12 | chr5_9.9 | 19.4 |
| | RP11-145B1 | chr5_10.3 | 25.0 |
| | RP11-72C10 | chr5_10.7 | 19.4 |
| | RP11-79G1 | chr5_11.1 | 19.4 |
| | RP11-81P9 | chr5_14.7 | 19.4 |
| 5q31.3 | 0.8 Mb | RP11-79K4 | chr5_140.3 | 25.0 |
| | RP11-15J20 | chr5_140.9 | 16.7 |
| | RP11-55M16 | chr5_141 | 19.4 |
| 7p21.1 | 3.5 Mb | RP11-89B15 | chr7_15.4 | 25.0 |
| | RP11-123E5 | chr7_17.3 | 19.4 |
| | RP11-70K3 | chr7_18.1 | 16.7 |
| | RP11-384L2 | chr7_18.7 | 19.4 |
| 7p15.1-p14.3 | 3.5 Mb | RP11-242I4 | chr7_30.2 | 25.0 |
| | AC018648.5 | chr7_32.6 | 22.2 |
| | RP11-89N17 | chr7_33.5 | 22.2 |
| 7q11.21-q11.22 | 2.5 Mb | RP11-91C6 | chr7_65.0 | 16.7 |
| | RP11-89D15 | chr7_67.4 | 25.0 |
| 8q24.21-q24.3 | 4.2 Mb | RP11-13A18 | chr8_141.6 | 36.1 |
| | RP11-349C2 | chr8_145.6 | 25.0 |
| | CTC-261I1 | chr8_145.7 | 33.3 |
| 11q13.3-q13.5 | 5.0 Mb | AP001271.4 | chr11_70.0 | 22.2 |
| | RP11-168B13 | chr11_74.8 | 22.2 |
| | RP11-91P18 | chr11_74.9 | 25.0 |
| 11q14.2 | 1.2 Mb | RP11-80F20 | chr11_86.5 | 19.4 |
| | RP11-876F8 | chr11_87.7 | 25.0 |
|
12p13.33-p13.31 | 5.3 Mb | RP11-598F7 | chr12_0.0 | 19.4 |
| | RP11-543P15 | chr12_3.1 | 25.0 |
| | RP11-319E16 | chr12_5.2 | 19.4 |
| 13q31.1-q31.2 | 0.7 Mb | RP11-753M10 | chr13_86.4 | 19.4 |
| | RP11-29P20 | chr13_87.0 | 22.2 |
| 13q34 | 3.2 Mb | RP11-474D23 | chr13_110.8 | 22.2 |
| | RP11-245B11 | chr13_113.8 | 19.4 |
| 16p13.3 | 5.9 Mb | RP11-344L6 | chr16_0.0 | 22.2 |
| | CTB-191K2 | chr16_0.1 | 30.6 |
| | RP11-334D3 | chr16_0.9 | 36.1 |
| | RP11-417B20 | chr16_1.4 | 25.0 |
| | RP11-433P17 | chr16_3.3 | 16.7 |
| | RP11-89M4 | chr16_4.5 | 16.7 |
| | RP11-349I11 | chr16_5.7 | 16.7 |
|
16p13.13-16p13.12 | 3.4 Mb | RP11-396B14 | chr16_11.1 | 19.4 |
| | RP11-81F1 | chr16_11.2 | 30.6 |
| | RP11-165M1 | chr16_12.3 | 19.4 |
| | RP11-91M7 | chr16_14.4 | 16.7 |
| 17q25.3 | 3.1 Mb | RP11-165J13 | chr17_74.7 | 33.3 |
| | RP11-46E14 | chr17_75.3 | 22.2 |
| | CTB-50C4 | chr17_77.8 | 16.7 |
|
20q13.31-20q13.33 | 8.4 Mb | RP5-885A10 | chr20_54.0 | 22.2 |
| | RP4-749H19 | chr20_54.9 | 36.1 |
| | RP5-907D15 | chr20_56.6 | 25.0 |
| | RP5-1043L13 | chr20_58.2 | 38.9 |
| | RP5-1040G13 | chr20_59.1 | 33.3 |
| | RP5-1107C24 | chr20_59.9 | 30.6 |
| | RP5-1005F21 | chr20_60.1 | 30.6 |
| | RP5-885L7 | chr20_60.9 | 25.0 |
| | RP4-583P15 | chr20_61.8 | 33.3 |
| | AL118506.27 | chr20_62.0 | 25.0 |
| | AL137028.9 | chr20_62.4 | 22.2 |
| Cytoband | Region size | Clone name | Chromosome start
position (Mb) | % Loss (n=36) |
|
| 6q16.3 | 0.5 Mb | RP11-90O11 | chr6_101.9 | 30.6 |
| | RP11-79O12 | chr6_102.2 | 16.7 |
| 9p24.2 | 1.6 Mb | RP11-79M14 | chr9_2.6 | 22.2 |
| | RP11-32F11 | chr9_3.1 | 25.0 |
| | RP11-31M2 | chr9_4.1 | 16.7 |
| 9p24.1 | 1.1 Mb | RP11-79K3 | chr9_7.3 | 16.7 |
| | RP11-376O21 | chr9_8.2 | 25.0 |
| 9p23 | 3.1 Mb | RP11-91E3 | chr9_9.6 | 30.6 |
| | RP11-32D4 | chr9_11.5 | 36.1 |
| | RP11-328C23 | chr9_12.5 | 19.4 |
| 10q21.1 | 4.4 Mb | RP11-75M12 | chr10_52.8 | 27.8 |
| | RP11-79A2 | chr10_57.1 | 25.0 |
| 18q22.1-q22.2 | 0.3 Mb | RP11-90A7 | chr18_64.7 | 25.0 |
| | RP11-49H23 | chr18_64.9 | 22.2 |
Another pattern of CNA consisted of focal
aberrations spanned by single clones which were found in almost all
chromosomes. The most frequently altered loci were DNA gain
involving 6p22 at 15.6 Mb (clone RP1-147M19, 30.6%), 7p13 at 47.1
Mb (clone AC073341.10, 27.8%) and 22q12 at 31.5 Mb (clone Z73979.1,
27.8%); and DNA loss involving 1p21 at 103.9 Mb (clone RP11-259N12,
30.6%), 6q12 at 67.1 Mb (clone RP11-80L16, 41.7%), 8q21 at 86.8 Mb
(RP11-96G1, 30.6%) and 14q12 at 28.6 Mb (clone RP11-125A5,
38.9%).
High-level copy gains were identified in 16 of the
36 tumors. Nine loci showed recurrent gains involving at least 2
cases. They were focused at 2 regions, comprising 7p21.1-p15.3
(18.1 to 21.2 Mb) spanned by 3 clones (RP11-70K3, RP11-51L23 and
CTB-23M10) and 20q13.31-q13.33 (56.6 to 62.4 Mb) spanned by 6
clones (RP5-907D15, RP5-1043L13, RP5-1107C24, RP5-1005F21,
RP5-885L7 and RP1-81F12). No locus of high level loss was detected
in the tumors studied.
CNA and clinicopathological
correlations
Comparison between tumors with different
clinicopathological features showed a trend of higher total and
mean number of genetic aberrations in tumors showing larger size
(≥2 cm), lymph node metastasis, higher pathological stages (stage
II or higher), moderate/poor differentiation and previous or
current tobacco exposure. The difference, however, was not
statistically significant. Tumors of more aggressive phenotypes
showed more frequent alterations in 13q for DNA loss, and 1q, 2q,
3q, 5q and 17q for DNA gain. Furthermore, tobacco-exposed patients
showed more often loss at 8q21.3, 9p24.1 and gain at 6p22.1, while
non-smokers showed more frequent gains at 1q44, 8q13.3, 22q12.3 and
Xp22.12 (Table III).
| Table III.Aberrant loci showing significant
associations with clinicopathological features. |
Table III.
Aberrant loci showing significant
associations with clinicopathological features.
| Position | Cytoband | Smoking
historya
| P-value |
Differentiationb
| P-value | Lymph node status
| P-value | Tumor stage
| P-value |
|---|
| NS (n=22) (%) | SM+PS+EX (n=14)
(%) | WD (n=18) (%) | MD+PD (n=18)
(%) | Negative (n=26)
(%) | Positive (n=10)
(%) | Stage I (n=24)
(%) | Stage II, III, IV
(n=12) (%) |
|---|
| Loss | | | | | | | | | | | | | |
| chr8_89.0 | 8q21.3 | 0 (0.0) | 5 (35.7) | 0.005 | | | | | | | | | |
| chr9_8.2 | 9p24.1 | 2 (9.1) | 7 (50.0) | 0.014 | | | | | | | | | |
| chr13_82.4 | 13q31.1 | | | | | | | | | | 0 (0.0) | 4 (33.3) | 0.008 |
| Gain | | | | | | | | | | | | | |
| chr1_169.0 | 1q24.3 | | | | 0 (0.0) | 8 (44.4) | 0.003 | | | | | | |
| chr1_182.0 | 1q25.3 | | | | 0 (0.0) | 7 (38.9) | 0.008 | | | | | | |
| chr1_196.1 | 1q32.1 | | | | | | | 0 (0.0) | 4 (40.0) | 0.004 | 0 (0.0) | 4 (33.3) | 0.008 |
| chr1_233.0 | 1q43 | | | | | | | | | | 1 (4.2) | 5 (41.7) | 0.01 |
| chr1_242.5 | 1q44 | 8 (36.4) | 0 (0.0) | 0.013 | 0 (0.0) | 8 (44.4) | 0.003 | | | | | | |
| chr2_198.7 | 2q33.1 | | | | 0 (0.0) | 8 (44.4) | 0.003 | | | | | | |
| chr3_128.6 | 3q21.3 | | | | | | | | | | 0 (0.0) | 5 (41.7) | 0.002 |
| chr5_169.1 | 5q35.1 | | | | | | | | | | 0 (0.0) | 4 (33.3) | 0.008 |
| chr6_29.8 | 6p22.1 | 0 (0.0) | 6 (42.9) | 0.002 | | | | | | | | | |
| chr6_170.8 | 6q27-qter | | | | 0 (0.0) | 7 (38.9) | 0.008 | | | | | | |
| chr8_72.3 | 8q13.3 | 8 (36.4) | 0 (0.0) | 0.013 | | | | | | | | | |
| chr17_5.8 | 17p13.2 | | | | 0 (0.0) | 7 (38.9) | 0.008 | | | | | | |
| chr17_30.9 | 17q12 | | | | | | | 0 (0.0) | 4 (40.0) | 0.004 | 0 (0.0) | 4 (33.3) | 0.008 |
| chr22_31.5 | 22q12.3 | 10 (45.5) | 0 (0.0) | 0.003 | 1 (5.6) | 9 (50.0) | 0.007 | | | | | | |
| chrX_20.6 | Xp22.12 | 8 (36.4) | 0 (0.0) | 0.013 | | | | | | | | | |
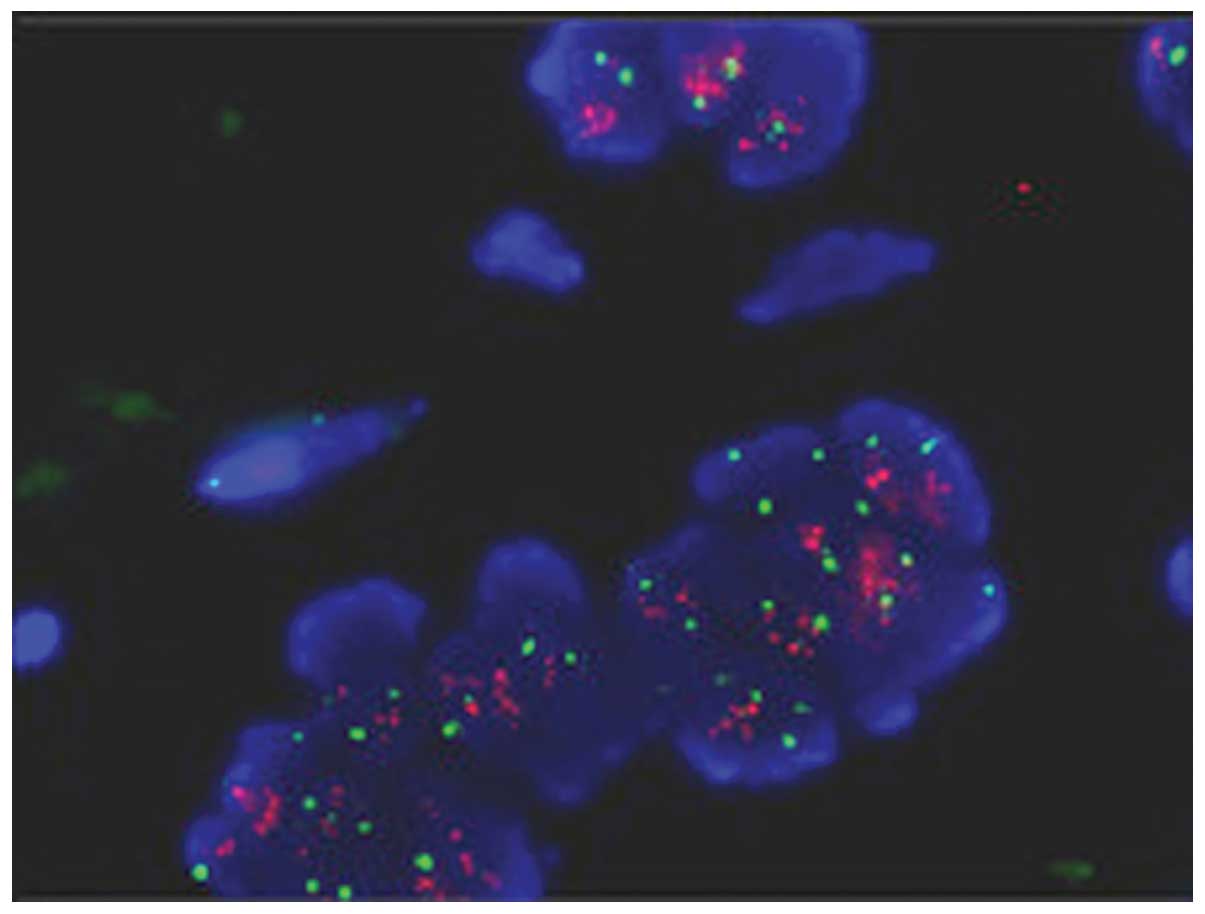
FISH analysis
Dual-color FISH analysis of a selective loci at
20q13.3 which show high-level gain were performed in 5 of 8
amplified cases of paraffin sections. The average ratio of test to
reference signal was 2.31, which showed agreement with the results
detected by array CGH (Fig.
2).
Real-time qPCR
For the 20 genes located in regions of DNA gain, the
tumor to normal expression ratios investigated by real-time qPCR
ranged from 0.22 to 4.89. While for the 3 genes located in regions
of genomic loss, the tumor to normal expression ratios were −0.23,
1.14 and 2.91, respectively (Table
IV). The concordance observed between the genomic and
expression changes for most of the genes suggested that they could
be candidate oncogenes that contributed to the development of lung
AD, while none of the genes showed expression levels that were
significantly associated with the cliniopathological
parameters.
| Table IV.Candidate gene expression levels by
real-time qPCR in 36 cases of lung adenocarcinomas. |
Table IV.
Candidate gene expression levels by
real-time qPCR in 36 cases of lung adenocarcinomas.
| Gene symbol | Cytoband | Array CGH | Expression level
(log2) | Validation
(DNA/RNA) |
|---|
| CMM | 1p36.32 | Gain | 0.48 | Yes |
| PAX7 | 1p36.2 | Gain | 3.44 | Yes |
| ILF2 | 1q21.3 | Gain | 3.02 | Yes |
| MUC1 | 1q22 | Gain | 2.20 | Yes |
| ELF3 | 1q32.1 | Gain | 1.96 | Yes |
| CHI3L1 | 1q32.1 | Gain | 2.23 | Yes |
| SMYD3 | 1q44 | Gain | 2.99 | Yes |
| TERT | 5p13.33 | Gain | 4.89 | Yes |
| PRDM13 | 6q16.3 | Loss | 1.14 | No |
| AGR2 | 7p21.1 | Gain | 4.34 | Yes |
| SBDS | 7q11.21 | Gain | 2.35 | Yes |
| RECQL4 | 8q24.3 | Gain | 3.31 | Yes |
| OVC | 9p24.2 | Loss | 2.91 | No |
| DKK1 | 10q21.1 | Loss | −0.23 | Yes |
| CCND1 | 11q13.3 | Gain | 3.02 | Yes |
| ETV6 | 12p13.33 | Gain | 1.39 | Yes |
| GAS6 | 13q34 | Gain | 0.22 | Yes |
| AXIN | 16p13.3 | Gain | 1.79 | Yes |
| EMP2 | 16p13.13 | Gain | 3.56 | Yes |
| ASPL | 17q25.3 | Gain | 2.02 | Yes |
| STK6 | 20q13.31 | Gain | 2.97 | Yes |
| TFAP2C | 20q13.31 | Gain | 1.32 | Yes |
| EEF1A2 | 20q13.33 | Gain | 4.52 | Yes |
Discussion
The present study utilized an array platform that
consists of large insert DNA template clones covering the genome at
an average resolution of 1 Mb to characterize the profiles of
genomic imbalances in primary lung AD. Recurrent aberrations were
found clustered in regional distribution spanned by multiple
clones, and in focal distribution spanned by single clones. These
loci correlated with results of our previous array CGH study
performed on non-small cell lung cancer (NSCLC) cell lines, and
corresponded to well-known aberrations of lung cancers defined by
other array CGH studies (8,9). The
common patterns of genomic changes indicate that lung
cancer-related genes are likely to be contained within these hot
spots of alterations.
5p15.33 is the most frequently gained locus in the
present study. A pooled analysis from East Asia totaling 1164 lung
ADs revealed that genetic variation in the CLPTM1LTERT locus of
5p15.33 was directly associated with the risk of lung cancer, most
notably AD (10). Other studies
also found 5p15.33 locus influence lung cancer risk (11,12).
The second frequently gained region involves an 8.4-Mb segment of
gain at 20q13.31-q13.33 (56.5 to 62.1 Mb). This region is
noteworthy as it is one of the commonest aberrations in lung cancer
as well as tumors of the gastric cancer and pancreatic cancer
(13–15). The FISH analysis on tumor samples
confirmed modest DNA gains. The third altered locus of
8q24.21-q24.3 is a known site of DNA gains and amplifications and
contains the c-Myc oncogene. Different array CGH studies have found
aberrant loci correlating to this region (16,17).
The detection of these multiple loci by independent studies
suggests the presence of multiple oncogenes at these regions.
Comparison of tumors of different
clinicopathological groups was performed to identify genomic
markers of potential diagnostic and prognostic importance. All the
aberrant loci that showed statistical significance were more common
in tumors of more aggressive phenotypes, i.e., poor
differentiation, lymph node metastasis and higher disease stage.
This observation corroborates the concept that tumor progression is
enhanced by genomic instability and accumulation of genetic
abnormalities.
Several studies have evaluated DNA alterations in
tumors of different tobacco exposure using different approaches.
However, the chromosomal regions characterizing tobacco-or non
tobacco-induced lung AD remain unclear. By cluster analysis of
genomic aberrations in 55 AD detected by a cancer gene-rich array,
Shibata et al (18)
identified subgroups associated with female non-smokers, male
current or previous smokers and a group with mixed gender and
tobacco history. Loci of DNA gains on 1p, 4p, 11p, 12q, 16p, 17q,
19q, 20p, 20q and 22q, and losses on 1p, 6q, 10q, 13q, 15q and 18p
were associated with non-smokers, while loci of 19q gain and 22q
loss were associated with smokers. Our results cannot be directly
compared since our array did not specifically span tumor genes.
Nevertheless, 22q12.3 (31.5 Mb) which shows DNA gain in 10 of 22
non-smokers compared to 0 of 14 tobacco-exposed tumors (P=0.003) is
located close to one of their reported loci (22q12.2 gain) in
non-smokers. Analysis of a larger number of tumors and the use of
identical, high-resolution array platforms in different populations
would be necessary for definitive identification of genomic markers
associated with different tobacco exposure and clinicopathological
profiles.
It is a common assumption that chromosomal gains and
losses have ‘dosage effects’ on the expression of at least some of
the genes within these regions, which should be good candidates for
involvement in carcinogenesis. The concordance observed between the
genomic changes and expression level by real-time qPCR for the most
selected genes in the present study suggested that they could be
candidate oncogenes or tumor suppressor genes that contributed to
the development of lung AD. Some of them had been investigated in
clinical or in vitro studies and results supported their
putative oncogenic roles. For example, PAX7 gene on 1pter-p33 that
encodes a transcription factor was most amplified in lung squamous
cell carcinoma (19), and elevated
expression of MUC1 on 1q22 contributed to smoking-induced lung
cancers that were driven by inflammatory signals of macrophages
(20). One of Stat3 downstream
gene products, chitinase 3-like 1 (CHI3L1, in region 1q32.1)
protein, was found to be a potential biomarker of
inflammation-induced lung cancer by a study of lung tumor mouse
models (21). TERT was locused on
5p15.33 which was one of the susceptibility loci from a genome-wide
association study of lung cancer in never-smoking Asian women
(8), and was the highest expressed
gene in the present study. Several studies using animal models and
human NSCLC tissues have reported that TERT mRNA and protein were
overexpressed in lung tumors compared with normal lung tissues
(22,23). The 7p genes AGR2 was revealed to be
significantly overexpressed in lung AD by comparison with SCCs or
normal lung tissue (24). Among
the 3 genes located in the loss region, only Dickkopf1 (DKK1, in
region 10q21.1) was underexpressed compared to normal lung tissue.
DKK1 is the predominant secretory antagonist of the Wnt/β-catenin
signal, suggesting that if DKK1 were not precisely regulated, it
could result in tumor formation and progression. In fact, several
clinical studies demonstrated that DKK1 was downregulated in
melanoma and breast cancer (25,26).
The observation that CCND1 (in region 11q13.3) was amplified and
overexpressed in a fraction of NSCLC when compared with normal lung
was strong evidence implicating the inappropriate expression of
CCND1 in lung carcinogenesis (27). Amongst genes located in the
recurrently gained 20q13.3 region, TFAP2C not only were highly
expressed in breast cancer, but also associated with reduced
survival (28). And EEF1A2 were
amplified or overexpressed in various cancers including NSCLC which
highlights its oncogenic potential (29).
None of the genes showed expression levels that were
significantly associated with the clinicopathological parameters,
indicating that the currently studied genes were not likely
candidates that mediated the differences in tumor differentiation
and behavior implicated by the array CGH analysis. The possible
explanations for failing to demonstrate these relations could be
that gene-mining based on the strategy of genomic, expressional and
functional correlations was insufficient in the clinical context,
reflecting the complexity of genetic and transcriptional
interactions in tumor development. Moreover, since lung ADs are
known to consist of heterogeneous tumor populations, it might be
worthwhile to conduct the investigation in a larger sample of well
controlled, homogeneous tumor population when a candidate tumor
gene with strong evidence is considered.
In conclusion, we used array CGH to identify loci of
frequent DNA aberrations in primary lung AD. Real-time qPCR
confirmed cancer-related genes in regions with CNA from array CGH
data. The limitations of the present study are the small number of
samples and further studies are needed to validate our results. The
identified aberrations and candidate genes can be used as starting
points for more specific investigations for pathogenesis in primary
lung AD, as well as in tumors of different etiological or
phenotypic characteristics.
References
|
1.
|
Jemal A, Bray F, Center MM, Ferlay J, Ward
E and Forman D: Global cancer statistics. CA Cancer J Clin.
61:69–90. 2011. View Article : Google Scholar
|
|
2.
|
Paez JG, Jänne PA, Lee JC, et al: EGFR
mutations in lung cancer: correlation with clinical response to
gefitinib therapy. Science. 304:1497–1500. 2004. View Article : Google Scholar : PubMed/NCBI
|
|
3.
|
Kwak EL, Bang YJ, Camidge DR, et al:
Anaplastic lymphoma kinase inhibition in non-small-cell lung
cancer. N Engl J Med. 363:1693–1703. 2010. View Article : Google Scholar : PubMed/NCBI
|
|
4.
|
Davies JJ, Wilson IM and Lam WL: Array CGH
technologies and their applications to cancer genomes. Chromosome
Res. 13:237–248. 2005. View Article : Google Scholar : PubMed/NCBI
|
|
5.
|
de Leeuw RJ, Davies JJ, Rosenwald A, et
al: Comprehensive whole genome array CGH profiling of mantle cell
lymphoma model genomes. Hum Mol Genet. 13:1827–1837.
2004.PubMed/NCBI
|
|
6.
|
Nakao K, Mehta KR, Fridlyand J, et al:
High-resolution analysis of DNA copy number alterations in
colorectal cancer by array-based comparative genomic hybridization.
Carcinogenesis. 25:1345–1357. 2004. View Article : Google Scholar : PubMed/NCBI
|
|
7.
|
Wong MP, Fung LF, Wang E, et al:
Chromosomal aberrations of primary lung adenocarcinomas in
nonsmokers. Cancer. 97:1263–1270. 2003. View Article : Google Scholar : PubMed/NCBI
|
|
8.
|
Zhu H, Lam DC, Han KC, et al: High
resolution analysis of genomic aberrations by metaphase and array
comparative genomic hybridization identifies candidate tumour genes
in lung cancer cell lines. Cancer Lett. 245:303–314. 2007.
View Article : Google Scholar
|
|
9.
|
Lan Q, Hsiung CA, Matsuo K, et al:
Genome-wide association analysis identifies new lung cancer
susceptibility loci in never-smoking women in Asia. Nat Genet.
44:1330–1335. 2012. View
Article : Google Scholar : PubMed/NCBI
|
|
10.
|
Hsiung CA, Lan Q, Hong YC, et al: The
5p15.33 locus is associated with risk of lung adenocarcinoma in
never-smoking females in Asia. PLoS Genet. 6:e10010512010.
View Article : Google Scholar
|
|
11.
|
McKay JD, Hung RJ, Gaborieau V, et al:
Lung cancer susceptibility locus at 5p15.33. Nat Genet.
40:1404–1406. 2008. View
Article : Google Scholar
|
|
12.
|
Wang Y, Broderick P, Webb E, et al: Common
5p15.33 and 6p21.33 variants influence lung cancer risk. Nat Genet.
40:1407–1409. 2008. View
Article : Google Scholar
|
|
13.
|
Dong J, Hu Z, Wu C, et al: Association
analyses identify multiple new lung cancer susceptibility loci and
their interactions with smoking in the Chinese population. Nat
Genet. 44:895–899. 2012. View
Article : Google Scholar : PubMed/NCBI
|
|
14.
|
Fan B, Dachrut S, Coral H, et al:
Integration of DNA copy number alterations and transcriptional
expression analysis in human gastric cancer. PLoS One.
7:e298242012. View Article : Google Scholar : PubMed/NCBI
|
|
15.
|
Holzmann K, Kohlhammer H, Schwaenen C, et
al: Genomic DNA-chip hybridization reveals a higher incidence of
genomic amplifications in pancreatic cancer than conventional
comparative genomic hybridization and leads to the identification
of novel candidate genes. Cancer Res. 64:4428–4433. 2004.
View Article : Google Scholar
|
|
16.
|
Tonon G, Wong KK, Maulik G, et al:
High-resolution genomic profiles of human lung cancer. Proc Natl
Acad Sci USA. 102:9625–9630. 2005. View Article : Google Scholar : PubMed/NCBI
|
|
17.
|
Kim TM, Yim SH, Lee JS, et al: Genome-wide
screening of genomic alterations and their clinicopathologic
implications in non-small cell lung cancers. Clin Cancer Res.
11:8235–8242. 2005. View Article : Google Scholar : PubMed/NCBI
|
|
18.
|
Shibata T, Uryu S, Kokubu A, et al:
Genetic classification of lung adenocarcinoma based on array-based
comparative genomic hybridization analysis: its association with
clinicopathologic features. Clin Cancer Res. 11:6177–6185. 2005.
View Article : Google Scholar
|
|
19.
|
Rácz A, Brass N, Höfer M, Sybrecht GW,
Remberger K and Meese EU: Gene amplification at chromosome
1pter-p33 including the genes PAX7 and ENO1 in squamous cell lung
carcinoma. Int J Oncol. 17:67–73. 2000.PubMed/NCBI
|
|
20.
|
Xu X, Padilla MT, Li B, et al: MUC1 in
macrophage: contributions to cigarette smoke-induced lung cancer.
Cancer Res. 74:460–467. 2014. View Article : Google Scholar : PubMed/NCBI
|
|
21.
|
Yan C, Ding X, Wu L, Yu M, Qu P and Du H:
Stat3 downstream gene product chitinase 3-like 1 is a potential
biomarker of inflammation-induced lung cancer in multiple mouse
lung tumor models and humans. PLoS One. 8:e619842013. View Article : Google Scholar : PubMed/NCBI
|
|
22.
|
Aras G, Kanmaz D, Urer N, Purisa S,
Kadakal F, Yentürk E and Tuncay E: Immunohistochemical expression
of telomerase in patients with non-small cell lung cancer:
prediction of metastasis and prognostic significance. Anticancer
Res. 33:2643–2650. 2013.PubMed/NCBI
|
|
23.
|
Lantuéjoul S, Salon C, Soria JC and
Brambilla E: Telomerase expression in lung preneoplasia and
neoplasia. Int J Cancer. 120:1835–1841. 2007.
|
|
24.
|
Pizzi M, Fassan M, Balistreri M,
Galligioni A, Rea F and Rugge M: Anterior gradient 2 overexpression
in lung adenocarcinoma. Appl Immunohistochem Mol Morphol. 20:31–36.
2012. View Article : Google Scholar : PubMed/NCBI
|
|
25.
|
Larue L and Delmas V: The WNT/Beta-catenin
pathway in melanoma. Front Biosci. 11:733–742. 2006. View Article : Google Scholar : PubMed/NCBI
|
|
26.
|
Zhou XL, Qin XR, Zhang XD and Ye LH:
Downregulation of Dickkopf-1 is responsible for high proliferation
of breast cancer cells via losing control of Wnt/β-catenin
signaling. Acta Pharmacol Sin. 31:202–210. 2010.PubMed/NCBI
|
|
27.
|
Gautschi O, Ratschiller D, Gugger M,
Betticher DC and Heighway J: Cyclin D1 in non-small cell lung
cancer: a key driver of malignant transformation. Lung Cancer.
55:1–14. 2007. View Article : Google Scholar : PubMed/NCBI
|
|
28.
|
Gee JM, Eloranta JJ, Ibbitt JC, et al:
Overexpression of TFAP2C in invasive breast cancer correlates with
a poorer response to anti-hormone therapy and reduced patient
survival. J Pathol. 217:32–41. 2009. View Article : Google Scholar : PubMed/NCBI
|
|
29.
|
Lee MH and Surh YJ: eFF1A2 as a putative
oncogene. Ann NY Acad Sci. 1171:87–93. 2009. View Article : Google Scholar
|