Introduction
Anticancer drug resistance is evoked by various
mechanisms, but there is no universal marker that plays a role in
drug resistance and that is useful to predict the therapeutic
effect in different disease types. To characterize such markers, it
is important to identify candidates that are expressed
constitutively in patients before therapy and that promote natural
resistance.
The overexpression and mutation of various tyrosine
kinases contributes to the development of acute leukemia. For
example, the overexpression or mutation of tyrosine kinases,
including Flt3, c-kit, platelet-derived growth factor receptor and
Bcr-Abl has been reported (1–3).
Once these tyrosine kinases are activated, they transmit major
molecules such as phosphatidylinositol 3-kinase (PI3K) and
mitogen-activated protein kinase (MAPK) (1–3).
This not only induces proliferation of leukemia cells, but also
renders them resistant to various anticancer drugs. Therefore,
several kinase inhibitors are used clinically and some were
reported to serve as predictive factors for the patient response to
treatment or prognosis (4–6). However, these abnormalities are
detected only in a limited number of patients with acute leukemia.
Furthermore, energy-dependent, rapid drug efflux and
multidrug-resistance molecules are the major factors for the
resistance of several leukemic cells; however, drug retention does
not always correlate with cytotoxicity and these molecules are not
always expressed before therapy.
We recently reported that serine threonine tyrosine
kinase 1 (STYK1)/novel oncogene with kinase domain (NOK), a
receptor protein tyrosine kinase (RPTK)-like protein, is widely
expressed in patients with leukemia (7). We also demonstrated that STYK1
expression was decreased after chemotherapy in all patients, and
was important in the proliferation of leukemia cells. STYK1 was
reported to be a tumorigenesis-inducing factor by Liu et al
(8). STYK1 overexpression
results in the growth factor-independent proliferation of murine
bone-marrow-derived lymphoid BaF3 cells and surface
adhesion-independent growth and colony formation in NIH3T3 and BaF3
cells (8). STYK1 shares 20–30%
homology with members of the fibroblast growth factor receptor and
platelet-derived growth factor receptor families (8). RPTKs usually bind to specific ligands
to stimulate tyrosine phosphorylation and growth signal
transduction. Interestingly, STYK1 has a single putative
transmembrane domain and an intracellular tyrosine kinase domain,
but it lacks an extracellular domain. Therefore, STYK1
expression may itself trigger self-phosphorylation and transmit
growth signals without ligand binding. PI3K and MAPK are reported
as activated growth signals by STYK1, suggesting that these signals
might induce the expression of various molecules such as inhibitor
of apoptosis proteins (IAPs) and NF-κB signals to stimulate
resistance against anticancer drugs. Based on these observations,
we hypothesized that the widely expressed STYK1 may play key roles
in the drug resistance of hematopoietic malignancies. However,
STYK1 expression has not yet been reported to act as a resistance
factor in leukemic cells; therefore, whether its expression is
related to therapeutic outcome in patients with acute leukemia
remains unclear.
In this study, to determine whether STYK1 functions
as a resistance factor against anticancer drugs, we transfected
cells with either a control or STYK1 expression vector and compared
drug sensitivity and the activation of signaling pathways. We next
examined STYK1 mRNA expression levels in patients with acute
leukemia and compared its expression in two groups with completely
different therapeutic outcomes. To ensure the applicability of the
mRNA expression measurements to clinical practice, we used
peripheral blood and bone marrow blood samples without purifying
blasts.
Materials and methods
Cell culture and anticancer drugs
The human myelogenous leukemia cell lines HL-60 and
K562 were obtained from the American Type Culture Collection
(Manassas, VA, USA). The cells were cultured in RPMI-1640
(BioWhittaker, Walkersville, MD, USA) supplemented with 10%
heat-inactivated fetal bovine serum (FBS; Invitrogen, Carlsbad, CA,
USA) at 37°C in a humidified atmosphere of 5% CO2.
Doxorubicin and etoposide were purchased from Sigma-Aldrich (St.
Louis, MO, USA).
Patients and samples
A total of 34 peripheral or bone marrow blood
samples were examined. Fresh peripheral blood samples from 22
patients who had been diagnosed with acute leukemia were obtained
at Sapporo Medical University Hospital. Fresh bone marrow blood
samples were also obtained from 12 patients with acute leukemia.
Ten patients with acute lymphoblastic leukemia, 20 with acute
myeloid leukemia and 4 with acute mixed-lineage leukemia were
assessed. A total of 25 patients were newly diagnosed and 9 were
relapsed cases. After informed consent was obtained, blood samples
were freshly prepared immediately before therapy, hemolyzed using a
lysis reagent (Ortho Diagnostic Systems, Tokyo, Japan), and washed
with phosphate-buffered saline lacking magnesium and calcium. Total
RNA was then extracted from the washed cells.
Transfection
The STYK1 expression vector (pCMV6-STYK1) was
purchased from Origene Technologies, Inc. (Rockville, MD, USA) and
large-scale preparation was performed using competent cells. The
control vector (pCMV6-Mock) was constructed by digesting the
parental vector with AsiSI (SfaAI) and MluI to
remove the STYK1 coding region. Both plasmids were
transfected into HL-60 cells using the Nucleofector® II
device and the Cell Line Nucleofector® Kit V (Amaxa
Inc., Gaithersburg, MD, USA) according to the manufacturer’s
instructions. Transfected cells were then cultured in media
containing 800 μg/ml of G418 sulfate (geneticin, EMD Chemicals,
Inc., San Diego, CA, USA) for 14 days.
Microarrays
Total RNA was prepared from transfected cells, and
then subjected to industrial analysis. Quality control check and
global gene expression profiling was performed by TakaraBio. Inc.
(Otsu, Japan) using SurePrint G3 Human GE 8×60 K Microarrays (both
from Agilent Technologies, Santa Clara, CA, USA) following the
Agilent one-color microarray-based gene expression analysis
protocol. The slides were scanned using an Agilent Technologies
Microarray Scanner, and the images were processed using Agilent
Feature Extraction software, version 10.7.3.1.
RNA extraction and quantification of
STYK1 mRNA expression
The expression of STYK1 mRNA was determined
by performing qRT-PCR on an ABI PRISM 7700 sequence detection
system (Applied Biosystems, Foster City, CA, USA). Total RNA was
isolated, and the concentration was determined using the GeneQuant
DNA/RNA Calculator (Amersham Pharmacia Biotech, Uppsala, Sweden).
The gene-specific primers and fluorescent hybridization probes used
for quantitative PCR were as follows: STYK1 forward primer, 5′-CAT
CTT TCG AGC CAA TAT GAA CAC-3′; reverse primer, 5′-TGG AAT TGG ATT
CGC CCT AA-3′; and probe, 5′-(FAM) CCA GCT GGG CTC CAT GAG GTA CAA
GAT (TAMRA)-3′. Quantitative RT-PCR was performed using the TaqMan
One-Step RT-PCR Master Mix Reagents kit (Applied Biosystems). To
compare the STYK1 mRNA expression between different samples,
the specific mRNA was normalized to that of 18S ribosomal RNA
(rRNA) to obtain a ratio. The 18S rRNA expression was determined
using TaqMan Ribosomal RNA control reagents (Applied Biosystems),
according to the protocol provided by the manufacturer. For each
experiment, a calibration curve was prepared using control RNA from
K562 cells. Briefly, a computer algorithm was used to analyze the
emission of reporter dye and quenching dye emission during PCR
amplification, and the intensity of the fluorescence signals from
each PCR cycle was detected. The amplification curves obtained from
serial dilutions of control RNA were prepared, and the optimal
signal intensity (threshold) was selected manually in the
exponential phase of the curves. The PCR cycle number (threshold
cycle, CT) at each concentration of starting RNA was
determined to draw the calibration curve, which was constructed as
a xy plot [with the log of the input amount (log ng of starting
total RNA) as x, and CT as y]. The expression of the
target mRNA in the unknown samples was determined from the
CT value. A negative control reaction that lacked
template was included in each experiment.
Immunocytochemistry
STYK1 protein expression was assessed by
immunocytochemistry using anti-STYK1 antibody. Briefly, cells were
attached to glass slides by using CytoSpin (1,000 rpm for 1 min),
and then fixed immediately using 4% paraformaldehyde for 15 min at
room temperature (RT). Cells were then incubated with primary
antibody (rabbit monoclonal anti-STYK1, Abgent, Inc., San Diego,
CA, USA) for 16 h at 4°C. Non-specific binding was removed by
washing with phosphate-buffered saline (PBS), and cells were then
incubated with Alexa Fluor 488-labeled anti-rabbit IgG. Cells were
counterstained with Hoechst 33342 for nuclear staining.
Caspase activity
Caspase-3 and -7 activities were measured using
Caspase-Glo 3/7 assay kit (Promega, Madison, WN, USA). Cells
transfected with control vector or STYK1 were plated onto 96-well
plates (Costar, Corning, NY, USA), and were then treated with
doxorubicin and etoposide. After 24-and 48-h incubations, 100 μl of
the assay reagent was added to each well, and incubated for 1 h at
RT. The intensity of luminescence signal (RLU, relative light
units) was then measured using a Veritas™ microplate luminometer
(Promega).
Measurement of cell viability
Cells were plated in 96-well plates at a density of
20,000 cells per well in RPMI supplemented with 10% FBS. The cells
were incubated for appropriate period, and were then analyzed using
the Cell Titer-Glo™ Luminescent Cell Viability Assay (Promega)
according to the manufacturer’s instructions. The level of
ATP-driven luminescence signal (RLU, relative light units), which
correlates with the number of viable cells, was measured using
Veritas microplate luminometer.
Cell cycle analysis
Cells plated onto 6-well culture dishes (Costar)
were washed with FBS-free medium and PBS. The cells were then
harvested and fixed with 70% ethanol at 4°C. After centrifugation,
the cell pellets were treated with RNase A, and stained with 1 ml
of hypotonic fluorochrome solution (50 μg/ml propidium iodide and
0.1% sodium citrate) at room temperature for 30 min. The cells were
then kept on ice, and 20,000 cells/sample were analyzed using a
Canto flow cytometer (Becton Dickinson Japan, Tokyo, Japan).
Results
Alteration in drug sensitivity by
transfection of a STYK1 expression vector
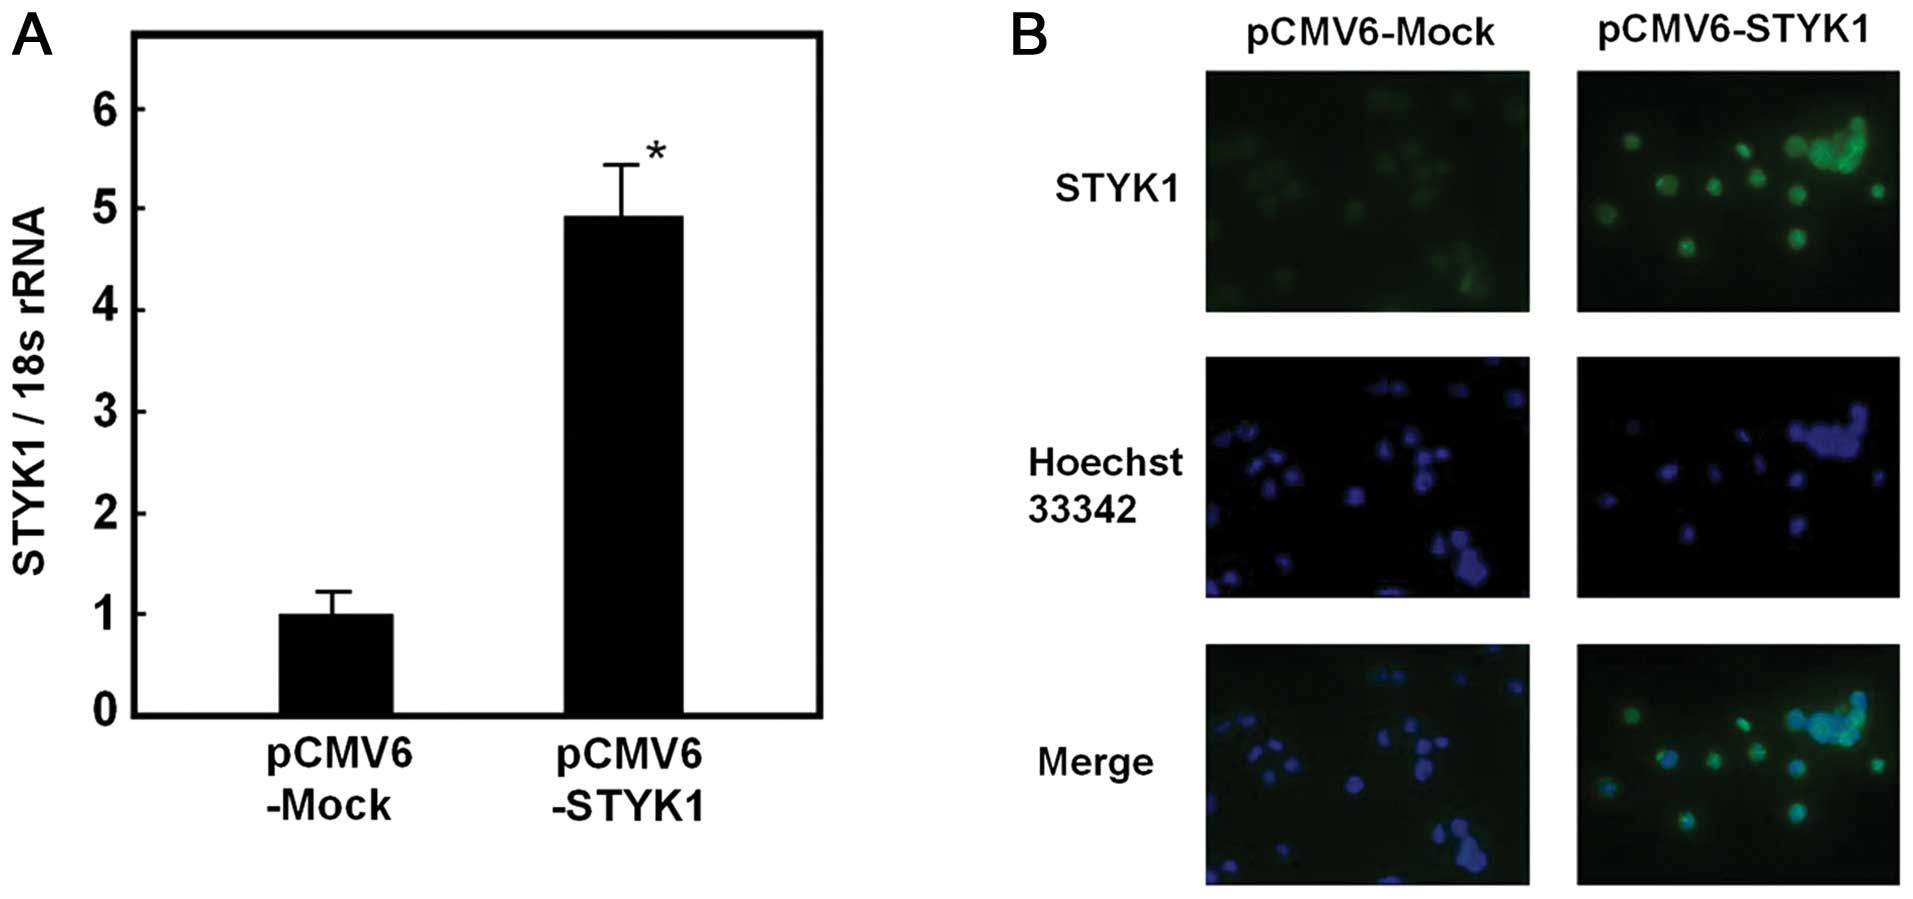
To determine the importance of STYK1
expression for the drug sensitivity of leukemic cells, we
transfected leukemia cells with a STYK1 (pCMV6-STYK1) or control
vector (pCMV6-Mock). First, we determined the STYK1 mRNA
expression levels in three leukemia cell lines to select the
appropriate cells for transfection; the mRNA expression was lowest
in HL-60 cells (data not shown), and so these cells were used in
subsequent experiments. Three micrograms of either vector were
transfected into HL-60 cells, and G418-selected stably expressing
cells were obtained. In cells transfected with pCMV6-STYK1, a
4.9-fold increase in STYK1 mRNA was detected compared with
cells transfected with pCMV6-Mock (Fig. 1A). STYK1 protein expression was
also assessed, and increased expression was detected in
pCMV6-STYK1-transfected cells using immunocytochemistry (Fig. 1B).
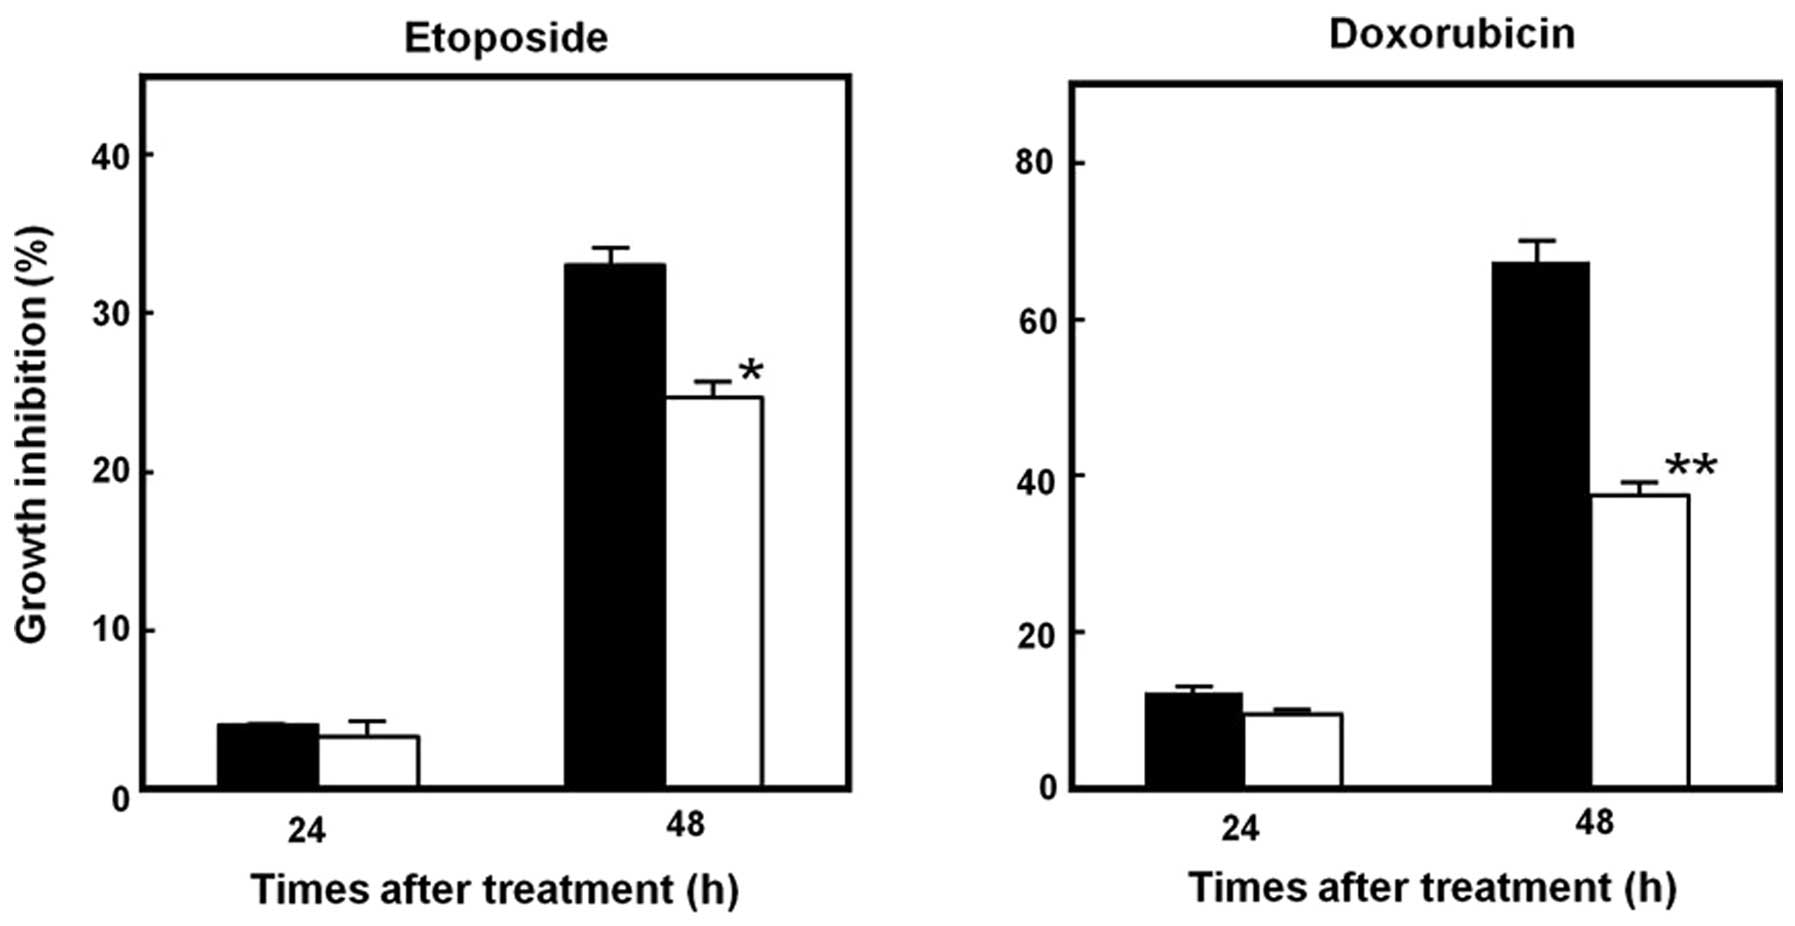
Stable transfectants were treated with different
concentrations of doxorubicin and etoposide, and cultured for 48 h.
Cells transfected with pCMV6-STYK1 exhibited significantly lower
rates of growth inhibition in response to both drugs compared with
pCMV6-Mock-transduced cells (Fig.
2). This altered drug sensitivity was more potent in
doxorubicin-treated cells. Interestingly, cells transfected with
pCMV6-Mock already had some resistance against etoposide,
suggesting some cross-resistance between the selection drug G418
sulfate and etoposide.
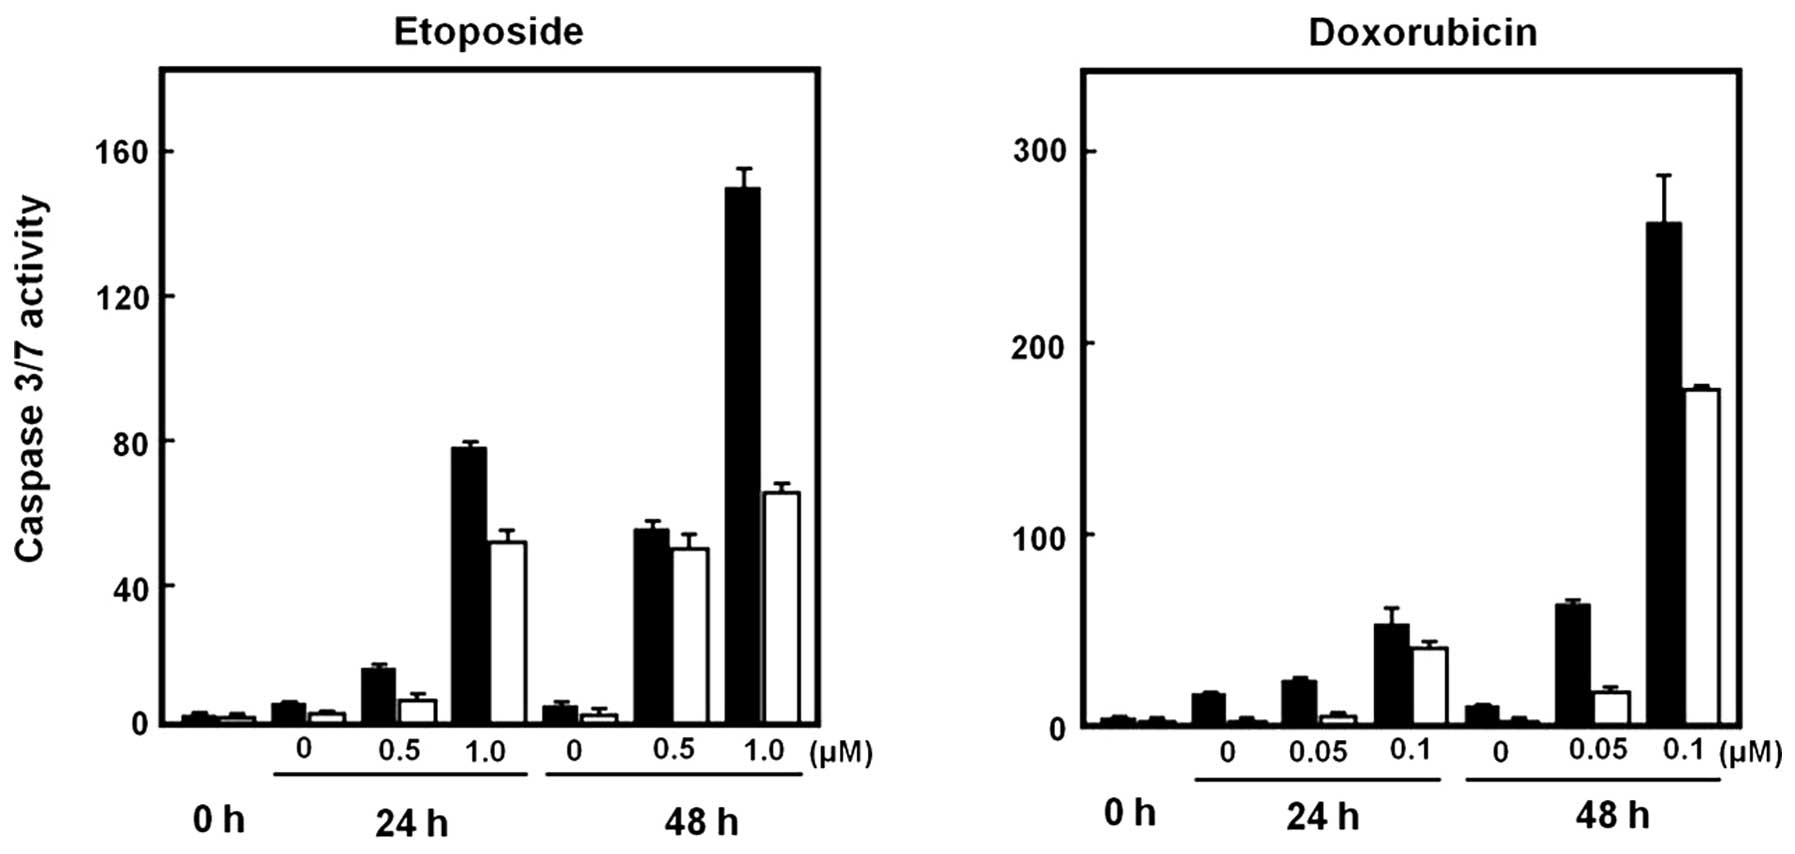
Alteration of drug-induced caspase
activity and the cell cycle by STYK1 transfection
We next examined whether STYK1 overexpression
affected drug-induced caspase activity. Cells transfected with
pCMV6-Mock or pCMV6-STYK1 were treated with doxorubicin and
etoposide for 24 and 48 h; apoptosis was then assessed using
caspase assays. Caspase activity was increased markedly by drug
treatment in cells transfected with either vector; however, the
caspase activity was decreased significantly in cells transfected
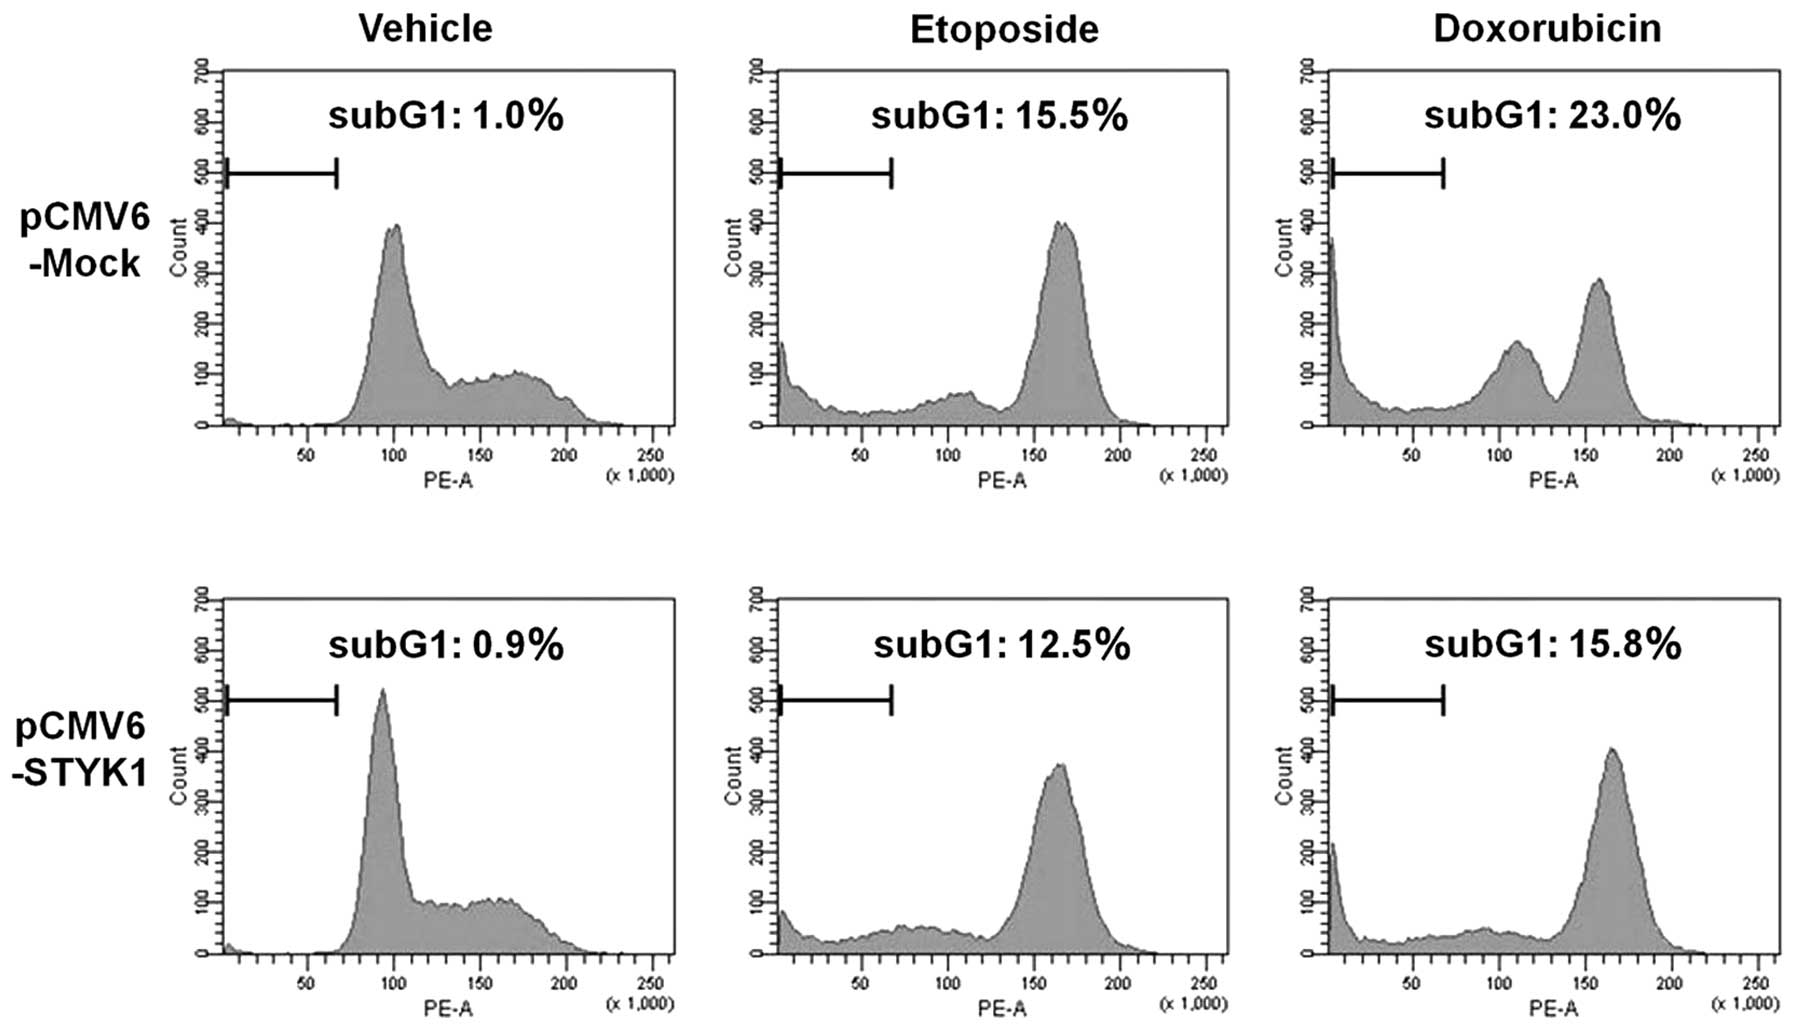
with pCMV6-STYK1 compared with pCMV6-Mock (Fig. 3). After 48 h of treatment with
doxorubicin and etoposide, the number of cells in the sub-G1 phase
was increased in cells transfected with either vector, but the
increase was less in cells transfected with pCMV6-STYK1 (Fig. 4).
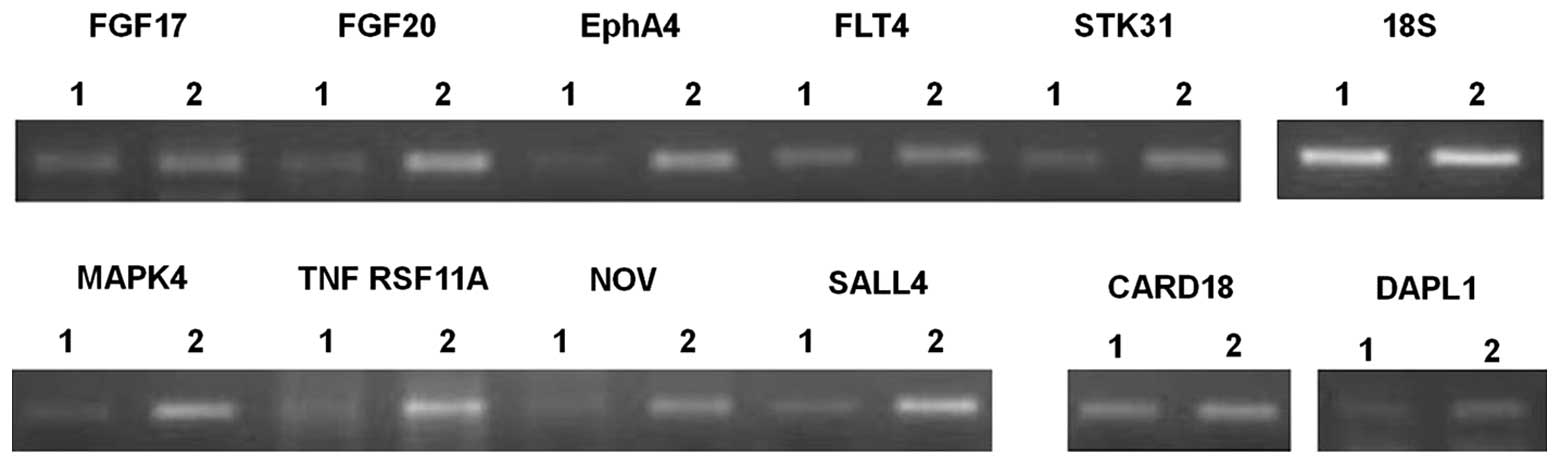
Microarray analysis of STYK1-regulated
genes
To determine the mechanism by which STYK1 induces
drug resistance, the expression of ~65,000 genes contained on a
microarray were analyzed in cells transfected with pCMV6-Mock and
pCMV6-STYK1. Expression of numerous numbers of molecules was
altered and therefore the expression change exceeding 4-fold was
taken into consideration for significant alteration. In Table I, we list 11 genes related to cell
proliferation or death whose expression was altered ≥4-fold by
STYK1 expression. Interestingly, the increased mRNA expression of
three different tyrosine kinases was detected. In addition, the
expression of NF-κB-activating and cell death-promoting molecules
was inversely regulated, which may contribute to drug resistance.
The expression of genes that regulate stem cell renewal, which is
particularly important for the maintenance of hematopoietic stem
cells, was increased significantly. The altered gene expression
detected using microarrays was confirmed using RT-PCR; final
analyses revealed that nine genes excepting CARD18 and DAPL1 were
apparently upregulated (Fig. 5;
the primers used to amplify each gene are shown in Table II).
 | Table ICell proliferation/death-related
molecules detected by microarray.a |
Table I
Cell proliferation/death-related
molecules detected by microarray.a
| Candidate | Log2 ratio | Expression ratio | Molecular
function |
|---|
| FGF17 | 3.62 | 12.29 | Proliferation
factor |
| FGF20 | 5.00 | 32.00 | Proliferation
factor |
| EphA4 | 5.03 | 32.67 | Receptor type
tyrosine kinase |
| FLT4 | 2.59 | 6.02 | Receptor type
tyrosine kinase |
| STK31 | 6.94 | 122.79 | Receptor type
tyrosine kinase |
| MAPK4 | 2.54 | 5.82 | NF-κB activation |
| TNF RSF11A | 3.61 | 12.21 | NF-κB activation |
| NOV (CCN3) | 5.47 | 44.32 | Stem cell
replication |
| SALL4 | 5.79 | 55.33 | Stem cell
replication |
| CARD18 | −3.96 | 0.06 | Apoptosis
accerelation |
| DAPL1 | −4.39 | 0.05 | Apoptosis
accerelation |
| Table IIPrimer sequences for RT-PCR. |
Table II
Primer sequences for RT-PCR.
| Target molecules | Primer sequence
(5′→3′) |
|---|
| FGF17-F |
AGCTGCTGATTCTCTGCTGTCA |
| FGF17-R |
GCTCAGCTGGTCGGTCATG |
| FGF20-F |
CGCAGGTATTTTGTGGCACTT |
| FGF20-R |
TCCACTGGTCTAGGTAAGAAATGTGT |
| EphA4-F |
AAGGATCAGAATGAGCGAAGCT |
| EphA4-R |
CGCACGTGGAAAACATAGGA |
| FLT4-F |
GGCTTCACCATCGAATCCAA |
| FLT4-R |
CCAGCGCAGATGCTCGTA |
| STK31-F |
CTTGCTTCCAGAACTGACATCTGT |
| STK31-R |
GATCTATGCCCCCACAAAGGA |
| MAPK4-F |
ACTGCTCCTTTCCCCCAATAA |
| MAPK4-R |
CCCCAGCAAAGAGCATTCTC |
| TNF RSF11A-F |
GGTCAGCAGGGAGCATGTG |
| TNF RSF11A-R |
CCCTGACAGACACCACCTTGA |
| NOV-F |
AAATTTCAGCCAAGCTGCAAA |
| NOV-R |
CAGTTAGGCTCAGGCAGTAGCA |
| SALL4-F |
AAGTGTAAGGGTCGGAGCAGTCT |
| SALL4-R |
AATGTCGAGGGTCCCACAAA |
| CARD18-F |
TGGATAAGGCTCGAGTCTTGATT |
| CARD18-R |
GGCAAGTTGAGGGTCTTCTTCA |
| DAPL1-F |
AGAAATTGGCACCTTGGAAAGA |
| DAPL1-R |
CATTCAGGGCATCCAGTGTCT |
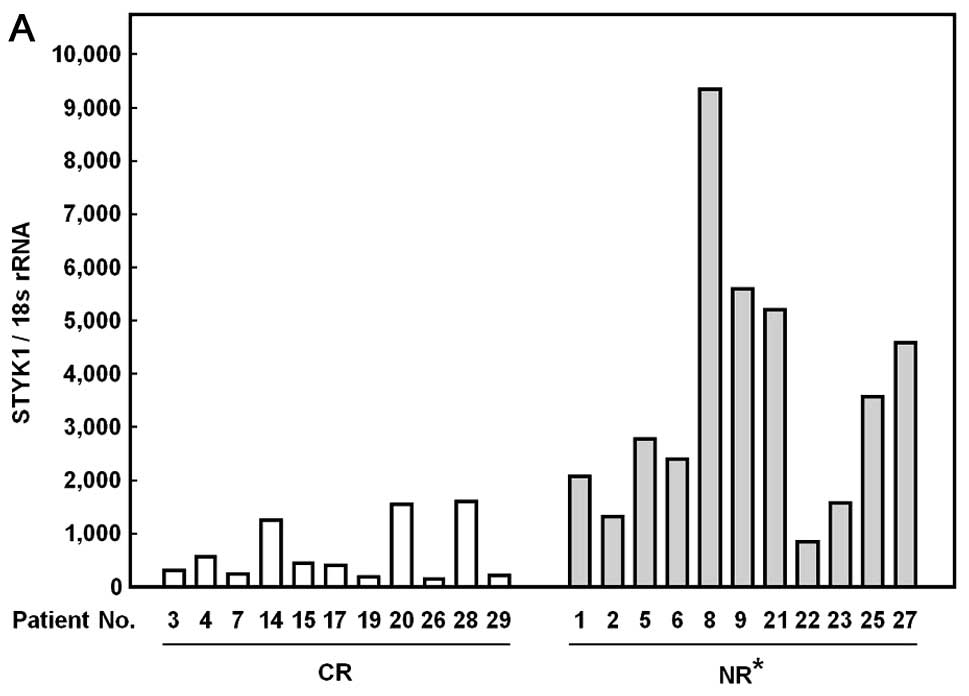
Comparison of STYK1 mRNA expression in
the patients with acute leukemia (Table III)
We previously found that STYK1 mRNA is highly
expressed in leukemic patients compared to non-leukemic individuals
(7). In this study we next
examined whether the level of STYK1 mRNA expression before
therapy could reflect therapeutic effect of anticancer drugs in
leukemic patients. STYK1 mRNA was detected in all the
peripheral blood and bone marrow blood samples. When the expression
was compared between two groups with either complete remission (CR)
and no-response (NR), NR group exhibited significantly higher
expression of STYK1 (3,572±2,483) compared with the CR group
(635±560, p<0.001, Fig. 6A).
The NR group also showed higher expression in bone marrow samples
(2,257±699) compared with the CR group (577±416, Fig. 6B). In both peripheral blood and
bone marrow blood samples, this increased expression in NR groups
was not specific to individual types of leukemia. Regarding
choromosomal abnormality, however, all 5 patients with p53
deletion, Ph1 chromosome, and MLL/AF4 chimera gene, known as
markers for poor response to chemotherapy, showed extremely higher
mRNA expression compared with the mean of the CR group.
Furthermore, also all peripheral blood and bone marrow blood
samples from patients without other prognostic-related factors
exhibited higher STYK1 mRNA expression compared with the mean value
of the CR group.
Discussion
In this study, we provided the first evidence that
the tyrosine kinase STYK1 acts as resistance factor against
anticancer drugs. In contrast to the previously reported classical
receptor protein tyrosine kinases (RPTKs), STYK1 lacks an
extracellular domain as the receptor for a specific ligand.
Therefore, it is thought that growth and survival signals are
transmitted through the autoactivation by STYK1 expression
itself, even in the absence of a specific ligand (8,9).
Therefore, we examined whether STYK1 overexpression causes the
resistance to anticancer drugs, resulting in a significant decrease
in drug sensitivity by inhibiting caspase activity. We then
performed microarray analyses to identify candidate STYK1-regulated
genes and revealed that other RPTKs were induced by STYK1. The
mechanism behind this phenomenon is unclear; however, molecules
important for NF-κB activation were also induced. This suggests
that several tyrosine kinases could cooperatively elicit cell
survival signals to stimulate drug resistance.
Interestingly, the expression of the stem cell
replicators SALL4 and NOV was induced by STYK1. Both of these genes
are expressed at high levels in hematopoietic stem cells (10,11).
In addition, Jeong et al demonstrated that the expression of
SALL4 is increased in leukemic cells, where it characterizes the
leukemic stem cell feature of drug resistance (12). Most tyrosine kinases induce STAT
signaling, and it was reported recently that STAT signaling
upregulates SALL4 (13). Although
the mechanism by which STYK1 augments NOV expression remains
unclear, it is possible that STYK1 induces SALL4 expression via
STAT signaling. As described above, STYK1 activates the PI3K/Akt
pathway (8). This pathway was
recently implicated in the induction of multidrug resistance
(MDR)-related molecules such as MDR1 and MRP (14,15).
However, the relationship between STYK1 expression and the
activation of this pathway is yet to be elucidated.
Based on the above findings, we next analyzed
STYK1 gene expression in clinical samples from acute
leukemic patients. First of all, regarding STYK1 expression in
malignant diseases, we previously demonstrated that STYK1
was overexpressed not only in leukemic patients but also in most
cancerous tissues from patients with breast and lung cancer, and
that its downregulation inhibited the growth of cancer cells
(7,16,17).
In addition, it was reported that STYK1 overexpression could
cause the transformation of hematopoietic BaF3 cells (8). Consequently, STYK1 might be involved
the acquisition of malignant features of cells.
The mechanism that regulates STYK1 expression
is unclear. However, all cases showing the expression of the top
30% in each peripheral and bone marrow samples (7 peripheral blood
and 4 bone marrow samples) formed the NR group, and included all
three individuals who had trisomy or tetrasomy of chromosome 21,
which is a risk factor for leukemogenesis (Table III). The cancer driver gene
RUNX1/AML1 was mapped to chromosome 21 (18); however, the potential relationship
between an abnormal chromosome 21 and STYK1 expression has
not yet been investigated.
Analysis of leukemic patients revealed that most
samples exhibiting high STYK1 expression were in the NR
group. Although various molecules such as P-glycoprotein, MRP and
GST-π stimulate drug resistance, the number of cases in which
constitutive expression could be detected before therapy is
limited. In the present study, STYK1 was highly expressed in
the NR group, regardless of the type of leukemia. Furthermore,
STYK1 was highly expressed in the NR group of both patients with
previously known factors for poor prognosis, and those without any
known prognostic factors. This suggests that measuring STYK1
mRNA expression could be a useful general marker for predicting the
therapeutic response of various types of acute leukemia. Recently,
we found that decreased STYK1 mRNA leads to a remarkable
growth inhibition of leukemic cells (7). Taken together with the findings in
this study, these data suggest that STYK1 may be a
therapeutic target for patients showing STYK1 overexpression when
ideal response to conventional 1st line chemotherapy could not be
expected, and actually obtained.
Acknowledgements
Grants from ‘Japan Society for the Promotion of
Science’ supported this study.
References
|
1
|
Nakao M, Yokota S, Iwai T, Kaneko H,
Horiike S, Kashima K, et al: Internal tandem duplication of the
flt3 gene found in acute myeloid leukemia. Leukemia. 10:1911–1918.
1996.PubMed/NCBI
|
|
2
|
Gambacorti-Passerini CB, Gunby RH, Piazza
R, Galietta A, Rostagno R and Scapozza L: Molecular mechanisms of
resistance to imatinib in Philadelphia-chromosome-positive
leukaemias. Lancet Oncol. 4:75–85. 2003. View Article : Google Scholar : PubMed/NCBI
|
|
3
|
Paietta E, Ferrando AA, Neuberg D, et al:
Activating FLT3 mutations in CD117/KIT(+) T-cell acute
lymphoblastic leukemias. Blood. 104:558–560. 2004. View Article : Google Scholar : PubMed/NCBI
|
|
4
|
Yanada M, Takeuchi J, Sugiura I, et al:
High complete remission rate and promising outcome by combination
of imatinib and chemotherapy for newly diagnosed BCR-ABL-positive
acute lymphoblastic leukemia: a phase II study by the Japan Adult
Leukemia Study Group. J Clin Oncol. 24:460–466. 2006. View Article : Google Scholar
|
|
5
|
Wang YY, Zhou GB, Yin T, et al: AML1-ETO
and C-KIT mutation/overexpression in t(8;21) leukemia: implication
in stepwise leukemogenesis and response to Gleevec. Proc Natl Acad
Sci USA. 102:1104–1109. 2005. View Article : Google Scholar : PubMed/NCBI
|
|
6
|
George P, Bali P, Cohen P, et al:
Cotreatment with 17-allylamino-demethoxygeldanamycin and FLT-3
kinase inhibitor PKC412 is highly effective against human acute
myelogenous leukemia cells with mutant FLT-3. Cancer Res.
64:3645–3652. 2004. View Article : Google Scholar
|
|
7
|
Kondoh T, Kobayashi D, Tsuji N,
Kuribayashi K and Watanabe N: Overexpression of serine threonine
tyrosine kinase 1/novel oncogene with kinase domain mRNA in
patients with acute leukemia. Exp Hematol. 37:824–830. 2009.
View Article : Google Scholar : PubMed/NCBI
|
|
8
|
Liu L, Yu XZ, Li TS, et al: A novel
protein tyrosine kinase NOK that shares homology with
platelet-derived growth factor/fibroblast growth factor receptors
induces tumorigenesis and metastasis in nude mice. Cancer Res.
64:3491–3499. 2004. View Article : Google Scholar
|
|
9
|
Chen Y, Li YH, Chen XP, et al: Point
mutation at single tyrosine residue of novel oncogene NOK abrogates
tumorigenesis in nude mice. Cancer Res. 65:10838–10846. 2005.
View Article : Google Scholar : PubMed/NCBI
|
|
10
|
Ma Y, Cui W, Yang J, et al: SALL4, a novel
oncogene, is constitutively expressed in human acute myeloid
leukemia (AML) and induces AML in transgenic mice. Blood.
108:2726–2735. 2006. View Article : Google Scholar : PubMed/NCBI
|
|
11
|
Gupta R, Hong D, Iborra F, Sarno S and
Enver T: NOV (CCN3) functions as a regulator of human hematopoietic
stem or progenitor cells. Science. 316:590–593. 2007. View Article : Google Scholar : PubMed/NCBI
|
|
12
|
Jeong HW, Cui W, Yang Y, Lu J, He J, Li A,
Song D, Guo Y, Liu BH and Chai L: SALL4, a stem cell factor,
affects the side population by regulation of the ATP-binding
cassette drug transport genes. PLoS One. 6:e183722011. View Article : Google Scholar : PubMed/NCBI
|
|
13
|
Bard JD, Gelebart P, Amin HM, Young LC, Ma
Y and Lai R: Signal transducer and activator of transcription 3 is
a transcriptional factor regulating the gene expression of SALL4.
FASEB J. 23:1405–1414. 2009. View Article : Google Scholar : PubMed/NCBI
|
|
14
|
Tazzari PL, Cappellini A, Ricci F, et al:
Multidrug resistance-associated protein 1 expression is under the
control of the phosphoinositide 3 kinase/Akt signal transduction
network in human acute myelogenous leukemia blasts. Leukemia.
21:427–438. 2007. View Article : Google Scholar
|
|
15
|
Chiarini F, Del Sole M, Mongiorgi S, et
al: The novel Akt inhibitor, perifosine, induces caspase-dependent
apoptosis and downregulates P-glycoprotein expression in
multidrug-resistant human T-acute leukemia cells by a JNK-dependent
mechanism. Leukemia. 22:1106–1116. 2008. View Article : Google Scholar
|
|
16
|
Moriai R, Kobayashi D, Amachika T, Tsuji N
and Watanabe N: Diagnostic relevance of overexpressed NOK mRNA in
breast cancer. Anticancer Res. 26:4969–4973. 2006.PubMed/NCBI
|
|
17
|
Amachika T, Kobayashi D, Moriai R, Tsuji N
and Watanabe N: Diagnostic relevance of overexpressed mRNA of novel
oncogene with kinase-domain (NOK) in lung cancers. Lung Cancer.
56:337–340. 2007. View Article : Google Scholar : PubMed/NCBI
|
|
18
|
Harbott J, Viehmann S, Borkhardt A, Henze
G and Lampert F: Incidence of TEL/AML1 fusion gene analyzed
consecutively in children with acute lymphoblastic leukemia in
relapse. Blood. 90:4933–4937. 1997.PubMed/NCBI
|