Introduction
Mantle cell lymphoma (MCL) constitutes approximately
5% to 7% of all malignant lymphomas (1); a recent epidemiologic study reported
that MCL has increased in the United States and Japan (2). MCL has a broad spectrum of
clinicopathological characteristics with a variety of morphological
forms; these include the indolent type, the morphological
equivalent of classical MCL (cMCL), and a more blastoid and
pleomorphic appearance representing the aggressive form of MCL
(aMCL) (3). Many patients with MCL
repeatedly relapse and gradually become resistant to treatment.
MCL is clinicopathologically characterized by the
t(11;14) (q13;q32) translocation, resulting in CCND1 overexpression
and SOX11 expression (3). These
events are valuable for the diagnosis of MCL (4). MCL can exist without the CCND1
translocation. More than half of such cases have been shown to
possess CCND2 translocation (5). Therefore, this strongly suggests that
the molecular basis of MCL is cell cycle deregulation caused by
translocation and subsequent overexpression of CCND1 or
CCND2. However, abnormal CCND-related gene expression
is insufficient for the pathogenesis of MCL, and does not account
for aggressiveness of MCL (3).
Unbiased and whole-genome analyses revealed that
alteration of CDKN2A, TP53, ATM, and NOTCH1 genes are
related to MCL progression and the prognosis (3,6). The
MCL international prognostic index (MIPI) with the Ki-67
proliferation index (7), and an
index including information for TP53 and SOX11 have been shown to
adequately reflect the clinical outcome of MCL (8). Our previous study revealed that MCL
could be classified into three forms; classical, intermediate and
aggressive types based on the pathological findings, and that the
aggressive type had a significant poorer prognosis that the other
types (9). We also compared gene
expression profiles of cMCL and aMCL and found that cell cycle
regulation genes such as CDK1, BIRC5, and FOXM1 are
involved in transformation of cMCL to aMCL (10).
Through recent technical innovations, miRNAs, that
are non-coding RNAs approximately 18–25 nucleotides in length, have
been found to regulate gene expression. It is known that multiple
genes can be regulated by a single miRNA, and therefore, abnormal
miRNA expression can deregulate expression of a number of genes. In
fact, it has been reported that for some malignancies, including
MCL, pathophysiological tumor status is closely associated with
miRNA expression (11,12). miRNAs are also valuable for the
diagnosis of some types of malignancies (13). In previous studies, high miR-17–92
expression in MCL was found to be associated with the
transformation (14); low miR-34a
expression correlates with the prognosis of MCL (15). However, miRNAs related to the
progression of MCL remain to be delineated.
In this study, we used a 3D-Gene miRNA microarray
and locked nucleic acid (LNA) in situ hybridization in
formalin-fixed paraffin-embedded (FFPE) sections to identify miRNAs
whose expression correlates with progression from cMCL to aMCL.
Materials and methods
Patients and tissue samples
We performed miRNA microarray experiments using
frozen tissues from nine MCL lymph node specimens collected from
the Department of Pathology of Kurume University (Fukuoka, Japan)
(Table I). MCL was diagnosed
according to the World Health Organization (WHO). MCL samples
analyzed in this study, all of which were included in authors'
previous study (10), are
confirmed to carry the chromosomal translocation t(11;14)(q13;q32)
(IgH/CCND1) and expression of CCND1 and SOX11 proteins.
Categorization of MCL in this study were done based on WHO
classification. The details are declared in the previous study
(9). Briefly, ‘Classical type’ has
morphological characteristics of classical MCL in WHO
classification. ‘Aggressive type’ includes morphological features
of blastic variant or pleomorphic variant of MCL in WHO
classification. ‘Intermediate type’ has morphological transition in
one section from region classified in classical type to region done
in aggressive type. Of all 9 MCL specimens, 4 specimens were
categorized in classical type (cMCL), 4 specimens were aggressive
type (aMCL), and 1 specimen was intermediate type (iMCL, n=1). For
iMCL, the region of classical MCL (iMCL-c, n=1) and the region of
aggressive MCL (iMCL-a, n=1) were obtained by laser microdissection
(LMD). This study was approved by the Kurume University
Institutional Review Board and in accordance with the Declaration
of Helsinki. Informed consent was not obtained because the data
were analyzed anonymously.
 | Table IClinical data of mantle cell lymphoma
(MCL) used for miRNA microarray analysis. |
Table I
Clinical data of mantle cell lymphoma
(MCL) used for miRNA microarray analysis.
| Case no. (sample
no.) | Age (year) | Gender | Diagnosis | Tissue | Growth
patternd | Ki-67 (%) | Translocation
t(11;14) | RNA extraction |
|---|
| 126 | 79 | M | cMCLa | LN | N | 25 | + | Whole |
| 135 | 59 | M | cMCL | LN | N | 20 | + | Whole |
| 141 | 75 | M | cMCL | LN | N | 25 | + | Whole |
| 200 | 75 | M | cMCL | LN | N | 30 | + | Whole |
| 5 | 71 | M | aMCLb | LN | D | 70 | + | Whole |
| 98 | 87 | M | aMCL | LN | D | 95 | + | Whole |
| 102 | 77 | M | aMCL | LN | D | 75 | + | Whole |
| 107 | 76 | M | aMCL | LN | D | 60 | + | Whole |
| 132 | 67 | F | iMCLc | LN | N & D | 15/95 | + | |
| (132-C) | | | Classical part | | | 15 | | LMDe |
| (132-A) | | | Aggressive
part | | | 95 | | LMD |
Laser microdissection (LMD)
The tissue samples were immediately frozen in
acetone/dry ice and stored at −80°C for microdissection. The iMCL
sample was embedded in an optical cutting temperature (OCT)
compound (Sakura Finetek, Tokyo, Japan) and frozen in liquid
nitrogen. Cryosections (20 μm-thick) were mounted on 2.0 μm-thick
PEN-Membrane slides (MicroDissect GmbH, Herborn, Germany). After
fixation in 100% ethanol, the slides were stained rapidly with
toluidine blue O (Chroma-Gesellschaft Schmid GmbH & Co.,
Köngen, Germany), washed with diethylpyrocarbonate (DEPC)-treated
water, and air-dried using a fan.
The frozen sections were microdissected with a Leica
LMD6000 laser microdissection system following the manufacturer's
protocol (Leica, Wetzlar, Germany). The classical or aggressive
parts were microdissected from the same iMCL tissue sections with
LMD. The dissected cells were collected in 0.5-ml tube caps filled
with 50 μl lysis buffer for RNA extraction (10,16).
RNA extraction and 3D-Gene miRNA
expression microarray
Total RNA was isolated from frozen whole tumor
tissue samples (cMCL and aMCL) with TRIzol (Invitrogen, Carlsbad,
CA, USA). For the laser-dissected samples (iMCL-c and iMCL-a),
total RNA was extracted with an RNAqueous-Micro kit (Ambion,
Austin, TX, USA) according to the manufacturer's instructions for
LMD. RNA samples were quantified with an ND-1000 spectrophotometer
(NanoDrop Technologies, Wilmington, DE, USA) and the quality was
confirmed with an Experion System (Bio-Rad Laboratories, Hercules,
CA, USA).
miRNA expression profiling
Extracted total RNA was labeled with Hy5 using the
miRCURY LNA™ microRNA Hy5 Power labelling kit (Exiqon, Vedbaek,
Denmark). Labeled RNAs were hybridized onto 3D-Gene Human miRNA
Oligo chips (v.14 1.0.1; Toray Industries, Tokyo, Japan). The
annotation and oligonucleotide sequences of the probes were
confirmed in the miRBase miRNA database Release 14 (http://microrna.sanger.ac.uk/sequences/). After
stringent washes, fluorescent signals were scanned with the
ScanArray Lite Scanner (Perkin Elmer, Waltham, MA, USA) and
analyzed with GenePix Pro software (Molecular Devices, Sunnyvale,
CA, USA).
Data processing
Raw data were normalized by subtracting the mean
intensity of the background signal, as determined from the signal
intensities of all blank spots, with 95% confidence intervals.
Signal intensities >2 standard deviations (SD) of the background
signal intensity were considered to be valid. Relative expression
of a given miRNA was calculated by comparing the signal intensities
of the averaged valid spots with their mean value throughout the
microarray experiments.
Statistical analysis of microarray
The data were normalized, and the significantly
differentially expressed miRNAs were obtained by comparing cMCL
with aMCL using a t-test (p-value <0.05). A heat map of
expression data from the selected miRNAs was generated with MeV
software (www.tm4.org) (17). Ingenuity Pathway Analysis (IPA6.0;
Ingenuity Systems, Redwood, CA, USA; www.ingenuity.com) was used to identify miRNA
interaction with genes.
LNA in situ hybridization
Locked nucleic acid (LNA)-modified probes labeled
with DIG (mercury-LNA detection probe) were obtained from Exiqon.
The probe sequences were as follows: miR-15b,
5′-TGTAAACCATGATGTGCTGCTA-3′ (5′-DIG and 3′-DIG); Scramble-miR used
for negative control, 5′-GTGTAACACGTCTATACGCCCA-3′ (5′-DIG); and U6
snRNA for positive control, 5′-CACGAATTTGCGTG TCATCCTT-3′ (5′-DIG).
FFPE tissues section, 6-μm thin adhered to glass slides were
deparaffinized in two consecutive xylene baths for 15 min each,
followed by 5 min each in serial dilutions of ethanol (100, 95 and
70%) and were washed with PBS. Slides were then digested with
Histo/Zyme (Diagnostic Biosystems, Pleasanton, CA, USA) at room
temperature for 10 min, washed twice with PBS, fixed with 4%
paraformaldehyde, and rinsed in PBS. For the hybridization step,
the IsHyb In Situ Hybridization (ISH) kit (Biochain Institute Inc.,
Hayward, CA, USA) was used according to the manufacturer's
instructions. Briefly, DIG-labeled LNA probes were denatured by
heating to 90°C for 4 min and diluted to 10–100 nM in the IsHyb kit
hybridization solution. Slides were hybridized overnight at 50°C in
a Dako hybridizer (Dako, Glostrup, Denmark). After hybridization,
slides were washed in pre-heated saline-sodium citrate (SSC)
buffers at 50°C: in 2X SSC for 10 min, 1X SSC for 10 min, and 0.2X
SSC for 5 min. Then, slides were placed in 0.2X SSC at 37°C for 10
min. Slides were incubated in 1x IsHyb kit blocking solution for 60
min at room temperature. Alkaline phosphatase (AP)-conjugated
anti-DIG from the IsHyb kit was diluted 1:100 in PBS and applied to
slides for 3 h at room temperature, followed by three washes in
PBS. After two 5-min washes with 1X AP buffer, slides were
incubated with nitro-blue tetrazolium
chloride/5-Bromo-4-Chloro-3′-In-dolylphosphatase p-Toluidine salt
(NBT/BCIP) solution from the IsHyb kit, in the dark, overnight at
room temperature to develop the dark-blue NBT-formazan precipitate.
Images were converted to grayscale and analyzed using the image
processing and analysis software Multi Gauge ver. 3.0 (FujiFilm,
Tokyo, Japan). Formalin-fixed paraffin-embedded MCL tissue samples
(n=31; 19 cMCL, 3 iMCL and 9 aMCL) and non-tumorous lymph node (LN)
(n=8) were analyzed.
Immunohistochemistry and microscopic
analysis
The MCL FFPE sections (19 cMCL, 3 iMCL and 9 aMCL)
used for in situ hybridization were stained with
haematoxylineosin. The immunohistochemical staining of MIB1 (Ki-67:
DakoCytomation, Glostrup, Denmark) was performed. Expression was
scored on a four-point scale as follows: grade 0, 0–10% of the
tumor cells stained; grade 1, 10–40% stained; grade 2, 40–70%
stained; grade 3, >70% stained. Clinical and pathological
findings for different groups were compared using the Student's
t-test and the χ2 test. Values were considered
significant at p<0.05. The immunohistochemical analyses of p53
(mouse MAb clone DO-7: Dako Cytomation, Glostrup, Denmark) and
c-myc (rabbit MAb clone Y69: Abcam, Cambridge, UK) were carried
out.
Results
miRNA microarray: selection of candidate
miRNA
We performed global miRNA expression analysis for
cMCL (n=5) and aMCL (n=5) using the 3D-Gene Human miRNA Oligo chip
(v.14 1.0.1; Toray) (Table I). The
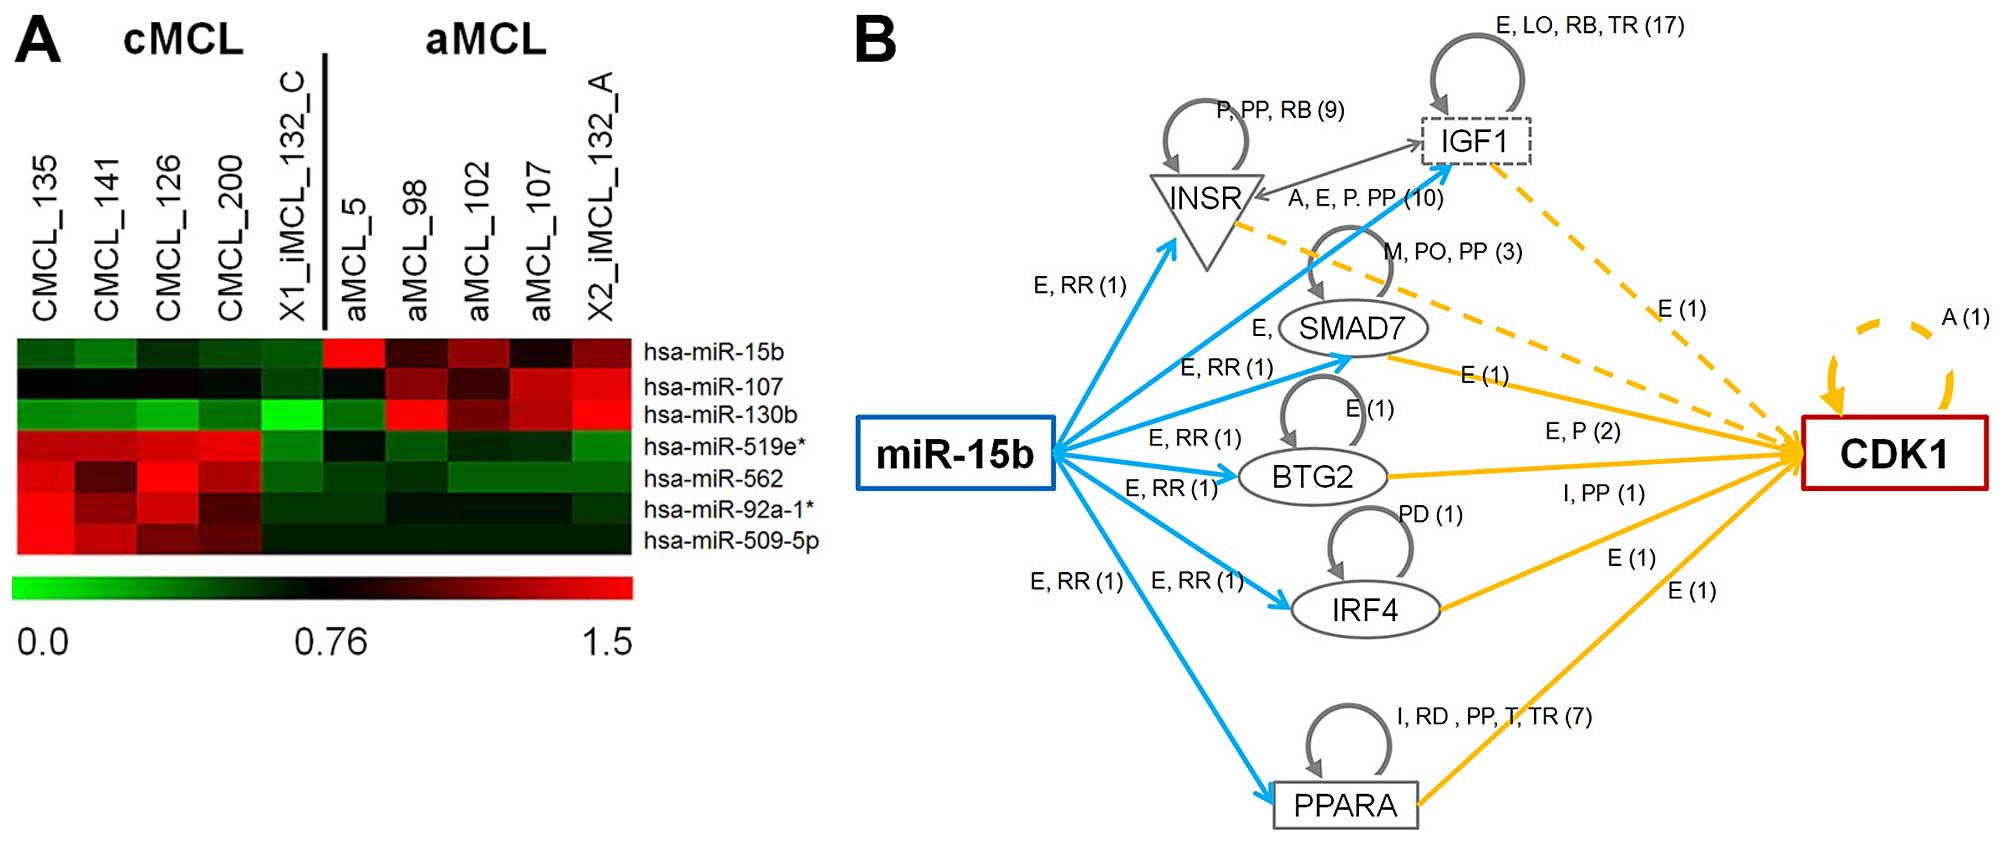
results showed that 7 microRNAs are significantly differentially
expressed (Fig. 1 and Table III, p<0.05, t-test) between
these two MCL forms. Comparing aMCL to cMCL it was observed that
miR-130b, miR-15b, and miR-107 were significantly upregulated,
while miR-92a-1*, miR-509-5p, miR-519e*, and miR-562 were
downregulated (Table III).
| Table IIIList of up- and down-regulated miRNAs
in MCL (aMCL versus cMCL). |
Table III
List of up- and down-regulated miRNAs
in MCL (aMCL versus cMCL).
| miRNA | Chromosomal
locus | Mean signal
intensity | Fold change (FC)
(aMCL/cMCL) | Log2
FC | P-value |
|---|
|
|---|
| cMCL | aMCL |
|---|
| Upregulated |
| hsa-miR-130b | 22q11.21 | 10.3 | 45.4 | 4.41 | 2.14 | 0.016 |
| hsa-miR-15b | 3q25.33 | 292.0 | 690.8 | 2.37 | 1.24 | 0.018 |
| hsa-miR-107 | 10q23.31 | 468.6 | 730.3 | 1.56 | 0.64 | 0.038 |
| Downregulated |
|
hsa-miR-92a-1* | 13q31.3 | 1.9 | 1.1 | 0.58 | −0.78 | 0.045 |
|
hsa-miR-509-5p | Xq27.3 | 1.7 | 1.0 | 0.57 | −0.80 | 0.033 |
|
hsa-miR-519e* | 19q13.42 | 3.0 | 1.5 | 0.49 | −1.02 | 0.045 |
| hsa-miR-562 | 2q37.1 | 2.5 | 1.1 | 0.44 | −1.20 | 0.036 |
Among the miRNAs identified by these miRNA
microarray analyses, we focused on a miRNA which had fold change of
>2 with mean signal intensity of >100. Only miR-15b (FC:
2.37, Mean signal intensity; cMCL: 292, aMCL: 690.8) fitted these
criteria. This analysis raises the possibility that miR-15b plays
an important role in the aggressive transformation from cMCL to
aMCL.
LNA in situ hybridization: validation of
miR-15b expression
To validate the results of global miRNA microarray
analysis, we performed in situ hybridization using a
mercury-LNA detection probe (Exiqon) to assess miR-15b expression.
In situ hybridization was carried out for MCL Case 132, the
intermediate MCL (iMCL) used for miRNA array analysis.
Additionally, cMCL (19 cases), aMCL (8 cases), iMCL (3 cases), and
reactive LN (8 cases) samples were also analyzed (Table II). Staining intensity of miR-15b
was evaluated using image analysis software (Multi Gauge version
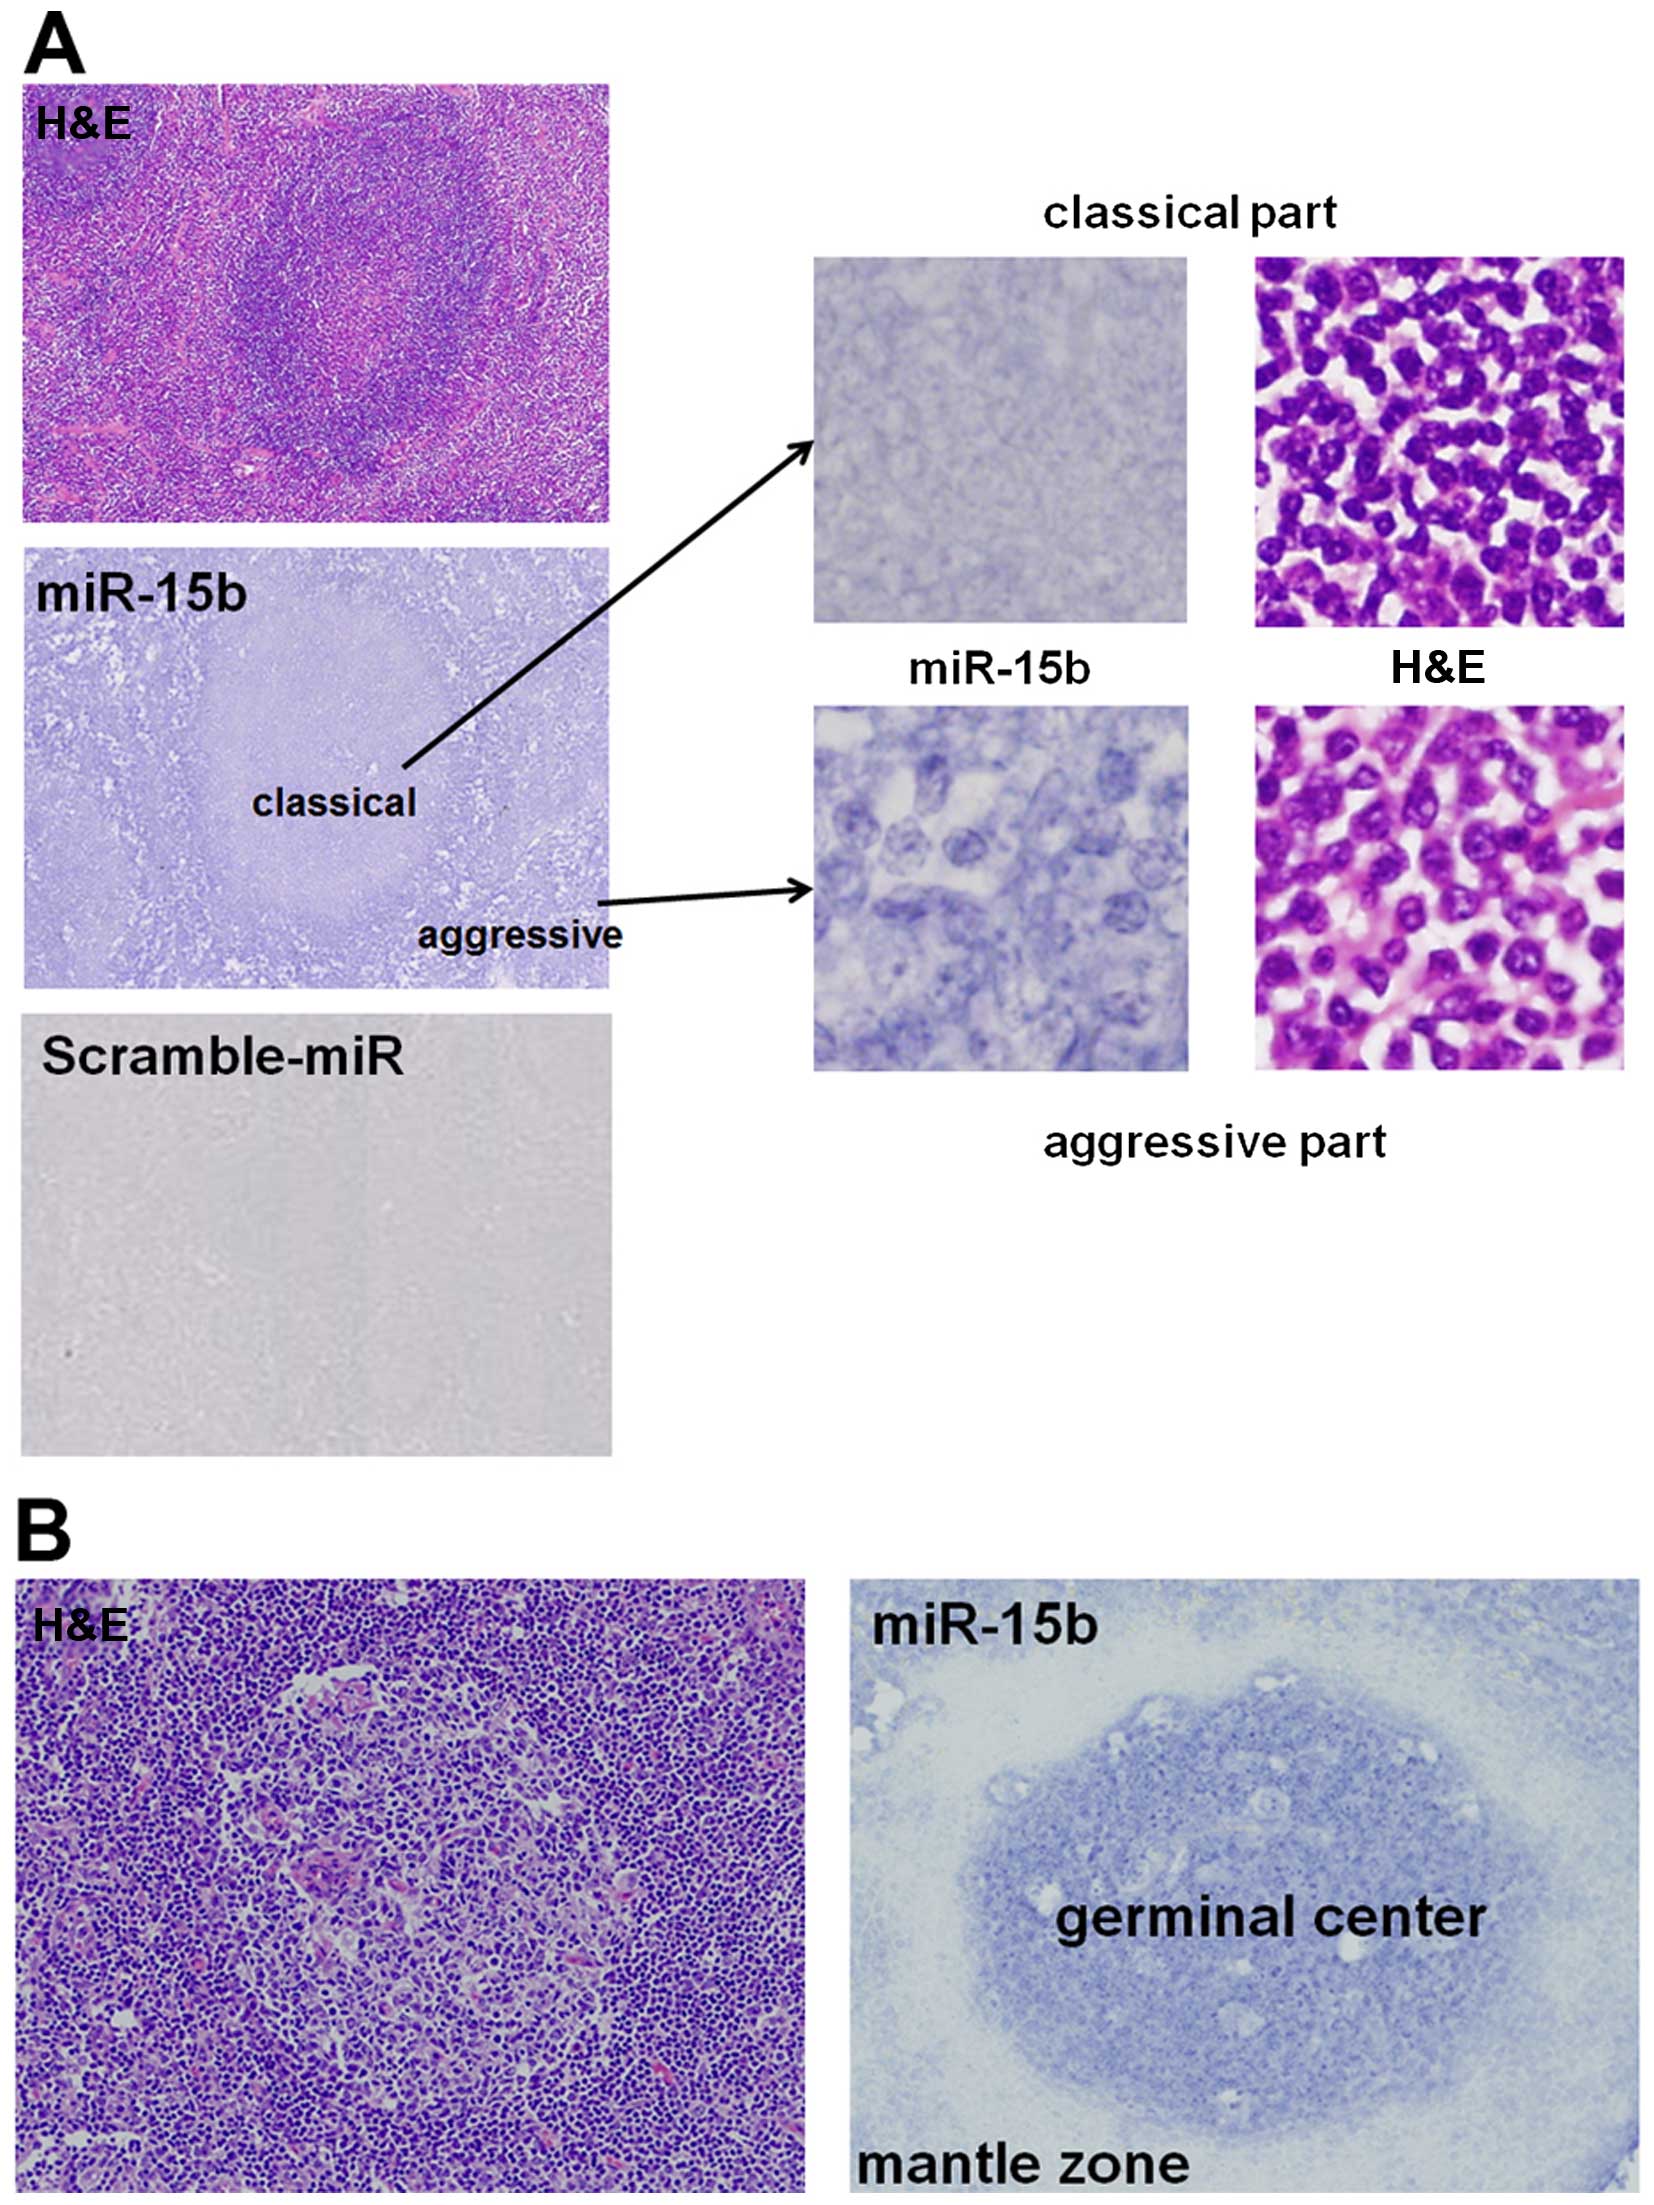
3.0). Fig. 2A shows a
representative example of miR-15b staining for iMCL (MCL Case 132).
This case exhibits morphological features of both classical and
aggressive forms in the same tissue. Comparison of the two
morphological forms, miR-15b intensity in the aggressive form was
2.1-fold higher than in the classical form (Fig. 1A), which correlated well with the
result of miRNA array analysis (2.32-fold change, Table III). This finding suggests that
miR-15b expression is significantly important in aggressive
MCL.
| Table IICharacteristics of MCL cases analyzed
in the current study. |
Table II
Characteristics of MCL cases analyzed
in the current study.
| Case no. | Diagnosis | PI (Ki-67) | miR-15b intensity
(Q-B)/pixel2 | miRNA
microarray | LNA in situ
hybridization |
|---|
| 126 | Classical
(cMCL) | 25 | | ● | |
| 135 | cMCL | 15 | 23.69 | ● | ● |
| 141 | cMCL | 10 | 61.07 | ● | ● |
| 200 | cMCL | 30 | | ● | |
| 5 | Aggressive
(aMCL) | 70 | | ● | |
| 98 | aMCL | 95 | | ● | |
| 102 | aMCL | 75 | | ● | |
| 107 | aMCL | 60 | | ● | |
| 132 | Intermediate
(iMCL) | 15/95 | | | |
| (132-C) | Classical part | 15 | - | ● | ● |
| (132-A) | Aggressive
part | 95 | - | ● | ● |
| 1-A1 | cMCL | 10 | 11.37 | | ● |
| 1-A2 | cMCL | 7 | 34.52 | | ● |
| 1-A3 | cMCL | 8 | 21.69 | | ● |
| 1-A6 | cMCL | 20 | 20.48 | | ● |
| 1-B1 | cMCL | 60 | 47.1 | | ● |
| 1-B3 | cMCL | 7 | 17.02 | | ● |
| 1-B4 | cMCL | 2 | 28.83 | | ● |
| 1-B6 | cMCL | 25 | 16.51 | | ● |
| 1-C2 | cMCL | 35 | 49.84 | | ● |
| 1-C3 | cMCL | 15 | 17.26 | | ● |
| 1-C4 | cMCL | 10 | 26.85 | | ● |
| 1-C5 | cMCL | 50 | 38.09 | | ● |
| 1-C6 | cMCL | 5 | 22.6 | | ● |
| 1-D1 | cMCL | 60 | 57.5 | | ● |
| 1-D2 | cMCL | 35 | 57.61 | | ● |
| 1-D4 | cMCL | 10 | 14.59 | | ● |
| 1-D5 | cMCL | 2 | 27.09 | | ● |
| 2-A1 | iMCL | 60 | 80.63 | | ● |
| 2-A2 | iMCL | 80 | 77.33 | | ● |
| 2-A3 | iMCL | 80 | 48.51 | | ● |
| 2-A4 | aMCL | 85 | 65.68 | | ● |
| 2-A6 | aMCL | 70 | 47.25 | | ● |
| 2-B1 | aMCL | 45 | 64.36 | | ● |
| 2-B2 | aMCL | 85 | 83.03 | | ● |
| 2-B3 | aMCL | 70 | 57.71 | | ● |
| 2-B4 | aMCL | 65 | 74.07 | | ● |
| 2-B5 | aMCL | 80 | 52.77 | | ● |
| 2-B6 | aMCL | 85 | 66.57 | | ● |
Of note, in the reactive lymph node, miR-15b
expression was higher in the germinal center; only very few cells
of the mantle zone, the cells affected by MCL, expressed miR-15b
(Fig. 2B).
Correlation of miR-15b expression and
MIB-1-positive cells
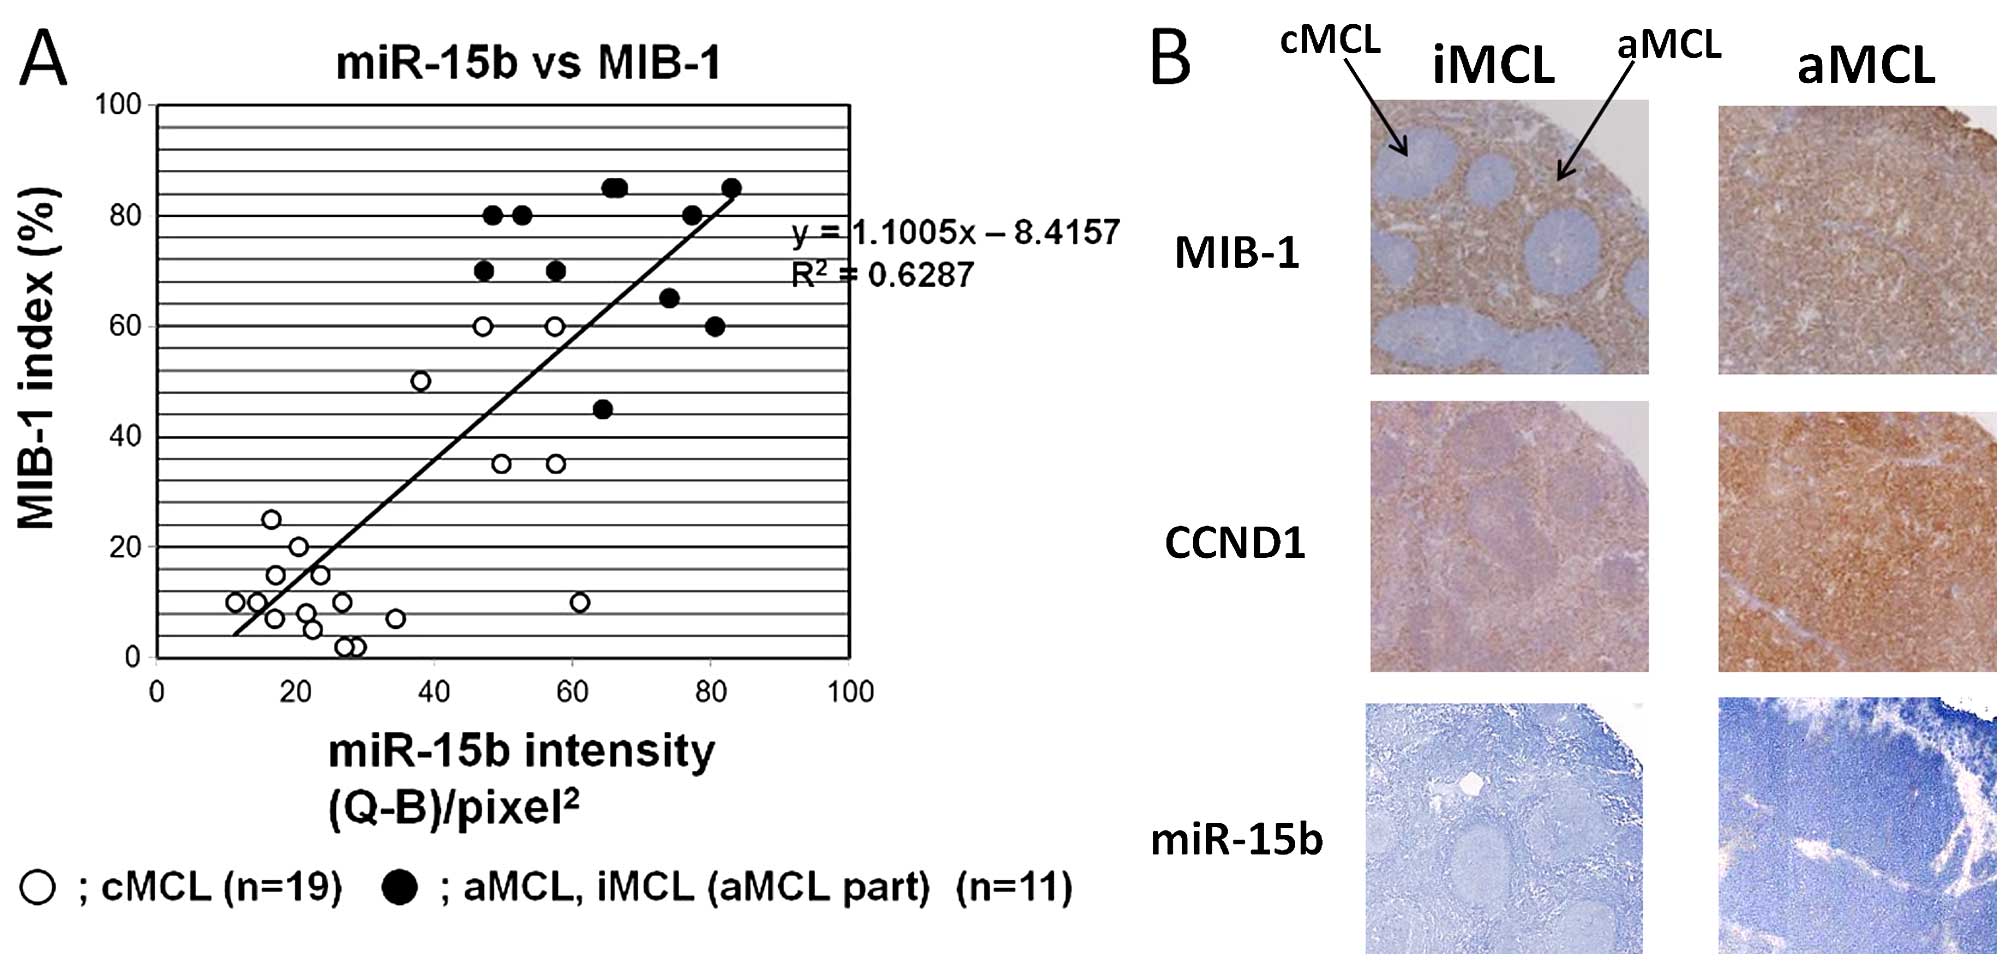
MIB-1 labeling index correlates with the
aggressiveness of MCL, and is included in MIPI. Therefore, we
evaluated a correlation between miR-15b expression and MIB-1 index.
The result indicated a significant positive correlation between the
two (ρ=1.1005, R2=0.6287) (Fig.
3). No correlations were seen with p53 or c-myc.
In our previous study, gene expression analysis
comparing cMCL and aMCL demonstrated that CDK1 expression was
associated with a shift from cMCL to aMCL (10). In addition, ingenuity pathway
analysis demonstrated that a connection between expression of CDK1
and miR-15b exists (Fig. 1B).
These results suggest that miR-15b expression is more important in
aMCL than cMCL.
Discussion
We have evaluated miRNA expression between cMCL and
aMCL and found that high expression of miRNA-15b is characteristic
of aMCL relative to cMCL. In our previous study, we analyzed to the
relationship between morphological subtypes of MCL and prognostic
factors statistically. aMCL had the strongest Ki-67 positivity and
showed extremely poor prognosis (9). miR-15b expression correlated with
Ki-67, indicating that aMCL show high level expression (Fig. 3A). miR-15 expression is likely to
be involved in progression of MCL.
Previous studies on miRNAs in MCL compared MCL cells
with normal B cells or were evaluated using unsupervised
hierarchical clustering (11,14).
In the present study, we focused on the clinicopathological
subtypes of MCL, aMCL and cMCL, and studied miRNA expression. We
identified miR-15b as a novel miRNA, that is highly expressed in
aMCL. Similar analysis was conducted for chronic lymphocytic
lymphoma (CLL), but miR-15 was not identified (17). We further demonstrated that high
expression of miR-15b is associated with aggressiveness using aMCL
and cMCL samples from the same case (MCL Case 132) (Fig. 2A).
miR-15b is located at chromosome 3q25.33. Several
genomic analyses including our previous study showed that gain of
chromosome 3q, including the MIR15B locus, is frequently
observed in MCL, even in the cMCL form (19,20).
These findings indicated that high expression of miR-15b might be
driven by mechanisms other than genomic copy number change. LNA
in situ hybridization identified that high expression of
miR-15b was found in germinal center cells but not in cells in the
mantle zone, the normal cellular counterpart of MCL. This may
simply reflect cell proliferation occurring in germinal center
cells. Alternatively, this may reflect DNA damage and repair in
germinal center cells, because miR-15b expression is reported to be
induced either by radiation, hydrogen peroxide, or etoposide in
human fibroblasts (21). miR-15b
targets CCND3, CCNE1 and CDK6. It regulates the cell cycle
(22) and is also involved in TP53
phosphorylation through ATM and CHK1 (23). From these findings, we speculate
that expression of miR-15b is upregulated by DNA damage and
repair.
The biological role of miR-15b in tumors is
controversial. miR-15b is reported to be upregulated in squamous
cell carcinoma of the head and neck (24), while the expression is decreased in
progressed, aggressive gliomas (25). Unbiased and whole-genome analyses
revealed that in MCL, CCND1 is deregulated, with genomic
aberrations of TP53, CDKN2A, RB1, and ATM, suggesting
that the DNA damage response is profoundly targeted (3). miR-15b is thought to be a negative
regulator for CCND1 (24), but
most MCL samples exhibit CCND1 protein expression. This may
indicate a loss of the suppressive effect of miR-15 for CCND1 in
MCL. Thus, miR-15b expression does not play a role as a negative
regulator of the cell cycle in MCL, but instead plays a role in the
patho-physiology of aMCL through different pathways.
Recently, Lovat et al (26) declared that the low expression of
the miR-15b is important in B-cell lymphoma, in particular in the
pathogenesis of CLL. In terms of transformation of MCL, high
expression of miR-15b is speculated to be involved. At that case,
targets of miR-15b is likely to be the other genes other than
CCND1. CDK1 will be considered as one of its target genes.
In summary, we found that miR-15b is highly
expressed in aMCL, is correlated with Ki-67 expression, and
corresponds well with cancer aggressiveness. The relationship
between high expression of miR-15b and MCL aggressiveness may
potentially lead to new MCL therapy targets, but will require
further study.
Acknowledgements
The authors would like to thank Mayumi Miura, Yuki
Morotomi, Kanoko Miyazaki, Kaoruko Nagatomo, and Chie Kuroki for
outstanding technical assistance. This study was supported by JSPS
KAKENHI Grants and Grants-In-Aid for Cancer Research from the
Ministry of Health, Labour, and Welfare of Japan (M.S. and K.O.).
N.Y. was supported by a research fellowship from JSPS for Young
Scientists.
References
|
1
|
Goy A and Kahl B: Mantle cell lymphoma:
The promise of new treatment options. Crit Rev Oncol Hematol.
80:69–86. 2011. View Article : Google Scholar
|
|
2
|
Chihara D, Ito H, Matsuda T, Shibata A,
Katsumi A, Nakamura S, Tomotaka S, Morton LM, Weisenburger DD and
Matsuo K: Differences in incidence and trends of haematological
malignancies in Japan and the United States. Br J Haematol.
164:536–545. 2014. View Article : Google Scholar :
|
|
3
|
Jares P, Colomer D and Campo E: Molecular
pathogenesis of mantle cell lymphoma. J Clin Invest. 122:3416–3423.
2012. View
Article : Google Scholar : PubMed/NCBI
|
|
4
|
Mozos A, Royo C, Hartmann E, De Jong D,
Baró C, Valera A, Fu K, Weisenburger DD, Delabie J, Chuang SS, et
al: SOX11 expression is highly specific for mantle cell lymphoma
and identifies the cyclin D1-negative subtype. Haematologica.
94:1555–1562. 2009. View Article : Google Scholar : PubMed/NCBI
|
|
5
|
Salaverria I, Royo C, Carvajal-Cuenca A,
Clot G, Navarro A, Valera A, Song JY, Woroniecka R, Rymkiewicz G,
Klapper W, et al: CCND2 rearrangements are the most frequent
genetic events in cyclin D1(−) mantle cell lymphoma. Blood.
121:1394–1402. 2013. View Article : Google Scholar :
|
|
6
|
Kridel R, Meissner B, Rogic S, Boyle M,
Telenius A, Woolcock B, Gunawardana J, Jenkins C, Cochrane C,
Ben-Neriah S, et al: Whole transcriptome sequencing reveals
recurrent NOTCH1 mutations in mantle cell lymphoma. Blood.
119:1963–1971. 2012. View Article : Google Scholar : PubMed/NCBI
|
|
7
|
Hoster E, Dreyling M, Klapper W,
Gisselbrecht C, van Hoof A, Kluin-Nelemans HC, Pfreundschuh M,
Reiser M, Metzner B, Einsele H, et al; German Low Grade Lymphoma
Study Group (GLSG). European Mantle Cell Lymphoma Network: A small
prognostic index (MIPI) for patients with advanced-stage mantle
cell lymphoma. Blood. 111:558–565. 2008. View Article : Google Scholar
|
|
8
|
Nordström L, Sernbo S, Eden P, Grønbaek K,
Kolstad A, Räty R, Karjalainen ML, Geisler C, Ralfkiaer E,
Sundström C, et al: SOX11 and TP53 add prognostic information to
MIPI in a homogenously treated cohort of mantle cell lymphoma - a
Nordic Lymphoma Group study. Br J Haematol. 166:98–108. 2014.
View Article : Google Scholar
|
|
9
|
Kimura Y, Sato K, Arakawa F, Karube K,
Nomura Y, Shimizu K, Aoki R, Hashikawa K, Yoshida S, Kiyasu J, et
al: Mantle cell lymphoma shows three morphological evolutions of
classical, intermediate, and aggressive forms, which occur in
parallel with increased labeling index of cyclin D1 and Ki-67.
Cancer Sci. 101:806–814. 2010. View Article : Google Scholar
|
|
10
|
Kimura Y, Arakawa F, Kiyasu J, Miyoshi H,
Yoshida M, Ichikawa A, Niino D, Sugita Y, Okamura T, Doi A, et al:
The Wnt signaling pathway and mitotic regulators in the initiation
and evolution of mantle cell lymphoma: Gene expression analysis.
Int J Oncol. 43:457–468. 2013.PubMed/NCBI
|
|
11
|
Teshima K, Nara M, Watanabe A, Ito M,
Ikeda S, Hatano Y, Oshima K, Seto M, Sawada K and Tagawa H:
Dysregulation of BMI1 and microRNA-16 collaborate to enhance an
anti-apoptotic potential in the side population of refractory
mantle cell lymphoma. Oncogene. 33:2191–2203. 2014. View Article : Google Scholar
|
|
12
|
Yamagishi M, Nakano K, Miyake A, Yamochi
T, Kagami Y, Tsutsumi A, Matsuda Y, Sato-Otsubo A, Muto S,
Utsunomiya A, et al: Polycomb-mediated loss of miR-31 activates
NIK-dependent NF-κB pathway in adult T cell leukemia and other
cancers. Cancer Cell. 21:121–135. 2012. View Article : Google Scholar : PubMed/NCBI
|
|
13
|
Liu AM, Yao TJ, Wang W, Wong KF, Lee NP,
Fan ST, Poon RT, Gao C and Luk JM: Circulating miR-15b and miR-130b
in serum as potential markers for detecting hepatocellular
carcinoma: A retrospective cohort study. BMJ Open. 2:e0008252012.
View Article : Google Scholar : PubMed/NCBI
|
|
14
|
Iqbal J, Shen Y, Liu Y, Fu K, Jaffe ES,
Liu C, Liu Z, Lachel CM, Deffenbacher K, Greiner TC, et al:
Genome-wide miRNA profiling of mantle cell lymphoma reveals a
distinct subgroup with poor prognosis. Blood. 119:4939–4948. 2012.
View Article : Google Scholar : PubMed/NCBI
|
|
15
|
Navarro A, Clot G, Prieto M, Royo C,
Vegliante MC, Amador V, Hartmann E, Salaverria I, Beà S,
Martín-Subero JI, et al: microRNA expression profiles identify
subtypes of mantle cell lymphoma with different clinicobiological
characteristics. Clin Cancer Res. 19:3121–3129. 2013. View Article : Google Scholar : PubMed/NCBI
|
|
16
|
Yoshida S, Arakawa F, Higuchi F, Ishibashi
Y, Goto M, Sugita Y, Nomura Y, Niino D, Shimizu K, Aoki R, et al:
Gene expression analysis of rheumatoid arthritis synovial lining
regions by cDNA microarray combined with laser microdissection:
Up-regulation of inflammation-associated STAT1, IRF1, CXCL9,
CXCL10, and CCL5. Scand J Rheumatol. 41:170–179. 2012. View Article : Google Scholar : PubMed/NCBI
|
|
17
|
Saeed AI, Sharov V, White J, Li J, Liang
W, Bhagabati N, Braisted J, Klapa M, Currier T, Thiagarajan M, et
al: TM4: A free, open-source system for microarray data management
and analysis. Biotechniques. 34:374–378. 2003.PubMed/NCBI
|
|
18
|
Visone R, Veronese A, Balatti V and Croce
CM: MiR-181b: New perspective to evaluate disease progression in
chronic lymphocytic leukemia. Oncotarget. 3:195–202. 2012.
View Article : Google Scholar : PubMed/NCBI
|
|
19
|
Tagawa H, Karnan S, Suzuki R, Matsuo K,
Zhang X, Ota A, Morishima Y, Nakamura S and Seto M: Genome-wide
array-based CGH for mantle cell lymphoma: Identification of
homozygous deletions of the proapoptotic gene BIM. Oncogene.
24:1348–1358. 2005. View Article : Google Scholar
|
|
20
|
Fernàndez V, Salamero O, Espinet B, Solé
F, Royo C, Navarro A, Camacho F, Beà S, Hartmann E, Amador V, et
al: Genomic and gene expression profiling defines indolent forms of
mantle cell lymphoma. Cancer Res. 70:1408–1418. 2010. View Article : Google Scholar : PubMed/NCBI
|
|
21
|
Simone NL, Soule BP, Ly D, Saleh AD,
Savage JE, Degraff W, Cook J, Harris CC, Gius D and Mitchell JB:
Ionizing radiation-induced oxidative stress alters miRNA
expression. PLoS One. 4:e63772009. View Article : Google Scholar : PubMed/NCBI
|
|
22
|
Ofir M, Hacohen D and Ginsberg D: MiR-15
and miR-16 are direct transcriptional targets of E2F1 that limit
E2F-induced proliferation by targeting cyclin E. Mol Cancer Res.
9:440–447. 2011. View Article : Google Scholar : PubMed/NCBI
|
|
23
|
Rahman M, Lovat F, Romano G, Calore F,
Acunzo M, Bell EH and Nana-Sinkam P: miR-15b/16-2 regulates factors
that promote p53 phosphorylation and augments the DNA damage
response following radiation in the lung. J Biol Chem.
289:26406–26416. 2014. View Article : Google Scholar : PubMed/NCBI
|
|
24
|
Lu YC, Chen YJ, Wang HM, Tsai CY, Chen WH,
Huang YC, Fan KH, Tsai CN, Huang SF, Kang CJ, et al: Oncogenic
function and early detection potential of miRNA-10b in oral cancer
as identified by microRNA profiling. Cancer Prev Res (Phila).
5:665–674. 2012. View Article : Google Scholar
|
|
25
|
Sun G, Shi L, Yan S, Wan Z, Jiang N, Fu L,
Li M and Guo J: MiR-15b targets cyclin D1 to regulate proliferation
and apoptosis in glioma cells. BioMed Res Int. 2014:6878262014.
View Article : Google Scholar : PubMed/NCBI
|
|
26
|
Lovat F, Fassan M, Gasparini P, Rizzotto
L, Cascione L, Pizzi M, Vicentini C, Balatti V, Palmieri D,
Costinean S, et al: miR-15b/16-2 deletion promotes B-cell
malignancies. Proc Natl Acad Sci USA. 112:11636–11641. 2015.
View Article : Google Scholar : PubMed/NCBI
|