Introduction
Rhabdomyosarcomas (RMS) are the most common
paediatric soft tissue tumours, accounting for ~5% of all cancers
at that age. Several histologic RMS variants can be differentiated
with two thirds of RMS belonging to the embryonal subtype (ERMS)
usually diagnosed in younger children below the age of 6 years. The
more aggressive alveolar subtype (ARMS), which is more common in
adolescents and young adults, makes up ~20% of new cases. ARMS are
characterised by the reciprocal translocations t(2;13)(p35;q14) or
t(1;13)(p36;q14) leading to the expression of fusion proteins
consisting of the DNA-binding domains of PAX3 or PAX7 and the
transactivation domain of FOXO1 (1,2).
ERMS often exhibit loss of heterozygosity (LOH) at the chromosomal
band 11p15.5 affecting the expression of the tumour suppressor
genes H19 and CDKN1C (2). There are additional subtypes as the
high grade pleomorphic RMS with a very unfavourable prognosis
(3) and the sclerosing, spindle
cell variant. In children this subtype often has a favourable
outcome, whereas in adults it is highly aggressive (4,5).
The standard therapy of RMS is surgery combined with
a first line chemotherapy composed of vincristine, actinomycin D
and cyclophosphamide (6). However,
mortality rates remain high in case of recurrences and metastatic
disease. Chemotherapy resistance and the failure of RMS cells to
undergo apoptosis often occurs during disease progression (7). Therefore, new innovative approaches
targeting specific signalling pathways are urgently needed.
The hedgehog (Hh) pathway is involved in
development, tissue regeneration but also several kinds of cancer
including basal cell carcinoma, medulloblastoma, osteosarcoma,
Ewing sarcoma and RMS (8–11). Ligand-dependent activation of Hh
signalling occurs via Patched 1 (PTCH1) and Smoothened (SMO)
leading to activation of the downstream transcription factors of
the glioma-associated oncogene family GLI1, GLI2 and GLI3. All GLI
proteins have transcriptional activator functions regulated by
activation of Hh signalling. In absence of Hh pathway activation
C-terminally truncated GLI2 and GLI3 proteins serve as
transcriptional repressors (12).
GLI1 is a direct transcriptional target of Hh signalling and its
function is regulated by abundance (13) of posttranslational modifications
(12,13). However, especially in sarcoma
aberrant, ligand-independent GLI1 activity has been observed
(14–16).
Several SMO inhibitors have been developed and are
in different phases of clinical validation (17,18).
These inhibitors do not prevent downstream pathway activation by
overexpression and constitutive activation of GLI transcription
factors. Therefore, direct targeting of GLI seems to be a more
promising therapeutic approach (13).
In the present study, we determined whether the Hh
pathway is active in RMS cell lines and contributes to cell
proliferation and survival. To address this question, we compared
the effects of different Hh inhibitors acting on SMO (cyclopamine,
LDE225, itraconazole) (19,20)
or GLI (ATO, GANT61). Arsenic trioxide (ATO), which is FDA approved
for the treatment of acute promyelocytic leukemia (APL) (21), prevents transcription of GLI1, GLI2
and PTCH1 in human osteosarcoma cell lines (11), blocks ciliary accumulation and
reduces steady state levels of GLI2 after prolonged incubation in
murine cells (22). GANT61, an
experimentally used substance, reduces GLI1 mediated transcription
in a luciferase based reporter screen (23) and induces apoptosis in a Ewing
sarcoma cell line (16). We found
especially ATO to be highly effective in reduction of viability and
clonal growth as well as in apoptosis initiation in RMS cell lines
of embryonal, alveolar and sclerosing, spindle cell subtype,
whereas normal skeletal muscle cells were scarcely affected.
Itraconazole was the only SMO inhibitor which increased ATO action
in our experimental settings.
Materials and methods
Reagents
ATO (Trisenox, Pharmacy of University Hospital
Tuebingen) was dissolved in purified water, GANT61 (Abcam,
Cambridge, UK), itraconazole (Sigma-Aldrich, Taufkirchen, Germany)
and LDE225 (Selleckchem, Munich, Germany) were dissolved in
dimethyl sulfoxide (DMSO). Cyclopamine (Abcam) was dissolved in
ethanol. For cell culture treatment stock solutions were further
diluted in culture medium.
Cell lines and culture
RD cells were purchased from CLS Cell Lines Service
GmbH (Eppelheim, Germany). RH-30 cells were obtained from ATCC
(Manassas, VA, USA). CCA cells were kindly provided by Barbara
Munz, Department of Sports Medicine, University Hospital Tuebingen.
RUCH3 cells were kindly provided by Ingo Mueller, Clinic of
Pediatric Hematology and Oncology, University Medical Center
Hamburg Eppendorf. ZF (ARMS) and SRH (sclerosing, spindle cell RMS)
were established and characterised at the University Children's
Hospital Tuebingen. The patient (SRH cells) and the parents of the
patient (ZF cells) had given their written informed consent to the
scientific analysis and cell line establishment from tissue
samples, the study of which was approved by the ethics committee of
the University of Tuebingen. Normal skeletal muscle cells from
adult donors (SKMC) were purchased from PromoCell (Heidelberg,
Germany). All cell lines were maintained in Dulbecco's modified
Eagle's medium (DMEM) with GlutaMAX, 4.5 g/l D-glucose (Gibco, Life
Technologies, Darmstadt, Germany) supplemented with 10% FCS
(Biochrom, Berlin, Germany) at 37°C in humidified atmosphere
containing 5% CO2.
RNA isolation and qRT-PCR
RNA was isolated using the RNeasy Mini kit (Qiagen,
Hilden, Germany). One microgram of RNA was reversely transcribed
using the innuSCRIPT reverse transcriptase (Analytik Jena, Jena,
Germany). cDNA (50 ng) was analysed in duplicate reactions by
quantitative RT-PCR (qRT-PCR) using gene-specific primers and 1X
SYBR select master mix for CFX (Life Technologies GmbH) in a total
volume of 10 μl. qRT-PCR was carried out in a CFX96 real-time
device (Bio-Rad, Munich, Germany) and was analysed using CFX
Manager™ software (Bio-Rad). Relative expression levels were
calculated as fold change compared to SKMC cells using the ΔΔCt
(2−ΔΔCt) method with TATA box binding protein (TBP) as a
reference gene. Hh pathway primers were used according to
Laurendeau et al (24).
Cytotoxicity assay
The Cell Titer 96® AQueous One Solution
Cell Proliferation (MTS) assay (Promega, Mannheim, Germany) was
used to measure cell viability via redox enzyme activity, according
to the protocol provided by the manufacturer. SRH, RD, CCA, RUCH3,
RH-30, ZF and SKMC cells (0.5–1.5×10⁴ cells/well) were
grown in 96-well plates. The day after seeding, the cells were
incubated in the presence of ATO, GANT61, cyclopamine, LDE225 or
itraconazole for another 96 h at 37°C in a humidified atmosphere of
5% CO2 in air. At the end of the incubation period, 15
μl MTS reagent was added to the wells, and the plate was incubated
for 1.5 h protected from light. Absorbance was recorded at 490 nm
with a reference wavelength of 630 nm using an EL 800 reader
(BioTek, Winooski, VT, USA).
IC50 determination
IC50 values of ATO, GANT61, cyclopamine
and LDE225 were determined for the different cell lines by
non-linear regression using GraphPad Prism V6.0 software.
Colony formation assay
RD, RH-30 and ZF cells were plated at a density of
0.5×10³ cells/well, RUCH3 cells were plated at a density
of 2.5×10³ cells/well in a 6-well plate and incubated
with increasing concentrations of ATO, LDE225, itraconazole or
inhibitor combinations for 72 h. After 10 days subsequent growth in
standard growth medium, cells were fixed using ice cold methanol
for 15 min, washed and stored in PBS. Visualisation of fixed cell
colonies was achieved by incubating the cells with 0.5% (w/v)
crystal violet for 30 min. Excess crystal violet was removed by
washing with PBS. Visible colonies, consisting of ≥50 cells, were
counted. The colony formation rate was determined: (number of
colonies/ number of plated cells) × 100.
Spheroid assay
For generation of 3D spheroids 0.5×10⁴
cells of the RMS cell lines RD, RH-30 and ZF were seeded in
ultra-low-attachment, U-bottom 96-well plates (Thermo Scientific,
Rochester, NY, USA). After 96 h spheroid formation was documented
by micrographs and Hh inhibitors were added to the culture medium
as indicated. Six days later a second documentation by micrographs
was performed.
PathScan® sandwich ELISA
assay
RD cells (0.5×10⁶) were incubated with
inhibitor concentrations indicated for 48 h in 6-well plates and
the PathScan® ELISA (Cell Signaling Technology, Leiden,
The Netherlands) specific for phospho-p53 (Ser15) #7365C, total p53
#7370C, phospho-Bad (Ser112) #7182C, total Bad #7162C was carried
out according to the manufacturer's instructions.
Western blot analysis
The SRH, RD, CCA, RUCH3, RH-30 and ZF cells (each at
1.5×10⁵ cells/well) and the SKMC cells (at
2.5×10⁵ cells/well) were incubated in 6-well plates with
inhibitor concentrations indicated for 48 h. For analysis, cells
were washed with PBS and lysed in protein lysis buffer (40 mM
Tris/HCl pH 7.4, 300 mM NaCl, 2 mM EDTA, 20% glycerol, 2% Triton
X-100) supplemented with proteinase inhibitor at 4°C. Insoluble
material was removed by centrifugation. The protein concentration
in the supernatant was determined by Bradford protein assay.
Protein samples (40 μg) were separated by 10% SDS-PAGE and
transferred to a hydrophobic polyvinylidene difluoride (PVDF)
membrane (Immobilon-P; Merck KGaA, Darmstadt, Germany). After
blocking with 5% powdered milk (Carl Roth, Karlsruhe, Germany) in
TBS-T, membranes were incubated with primary antibodies [GLI1
rabbit mAb #2533, β-tubulin (9F3) rabbit mAb #2128, cleaved caspase
3 (5A1E) rabbit mAb #9664, anti-cleaved PARP (DE64E10) rabbit mAb
#5625, full length caspase 3 (8G10) rabbit mAb #9665, all 1:1,000,
Cell Signaling Technology; GLI2 (H300) rabbit pAb, 1:200, sc-28674,
Santa Cruz Biotechnology Inc., Dallas, TX, USA; cell cycle
(pCdk/pHH3/ actin) WB cocktail, 1:250, ab136810, Abcam] with gentle
shaking overnight at 4°C according to the manufacturer's protocols.
Membranes were washed three times with TBS-T. Secondary antibody
(horseradish peroxidase-conjugated anti-rabbit pAb, 1:20,000,
Jackson Immuno Research, West Grove, PA, USA) was added for 2 h,
and the membranes were washed another three times with TBS-T.
Proteins were detected using ECL Western Blotting Substrate (Thermo
Scientific, Waltham, MA, USA) with membranes exposed to Amersham
Hyperfilm ECL (GEHealthcare, Pittsburgh, PA, USA). A pre-stained
protein ladder (PageRuler Plus; Thermo Scientific) was used for
determination of molecular weights. ImageJ was utilised for western
blot quantification.
Flow cytometry
Membrane integrity as indicator for cell death was
determined using the fixable viability dye eFluor® 450
(eBioscience, San Diego, CA, USA). The SRH, RD, CCA, RUCH3, RH-30,
ZF and SKMC cells (each at 2.5×10⁵ cells/ well) were
incubated with inhibitor concentrations indicated for 72 h, washed
with PBS, detached with 1% trypsin, and stained for 30 min at 4°C
in the dark. Cells were washed with PBS and fixed with 0.5%
formaldehyde diluted in PBS before being resuspended in FACS buffer
(PBS containing 2% FCS, 2 mM EDTA). Flow cytometric analysis was
performed on an LSRII flow cytometer (Becton-Dickinson, Franklin
Lakes, NJ, USA) using FlowJo Software (Tree Star Inc., Ashland, OR,
USA) for data evaluation.
Statistical analysis
All statistical tests were performed using GraphPad
Prism V6.0 or V5.0 software and p<0.05 was considered as
statistically significant.
Results
Overexpression of hedgehog pathway genes
in rhabdomyosarcoma
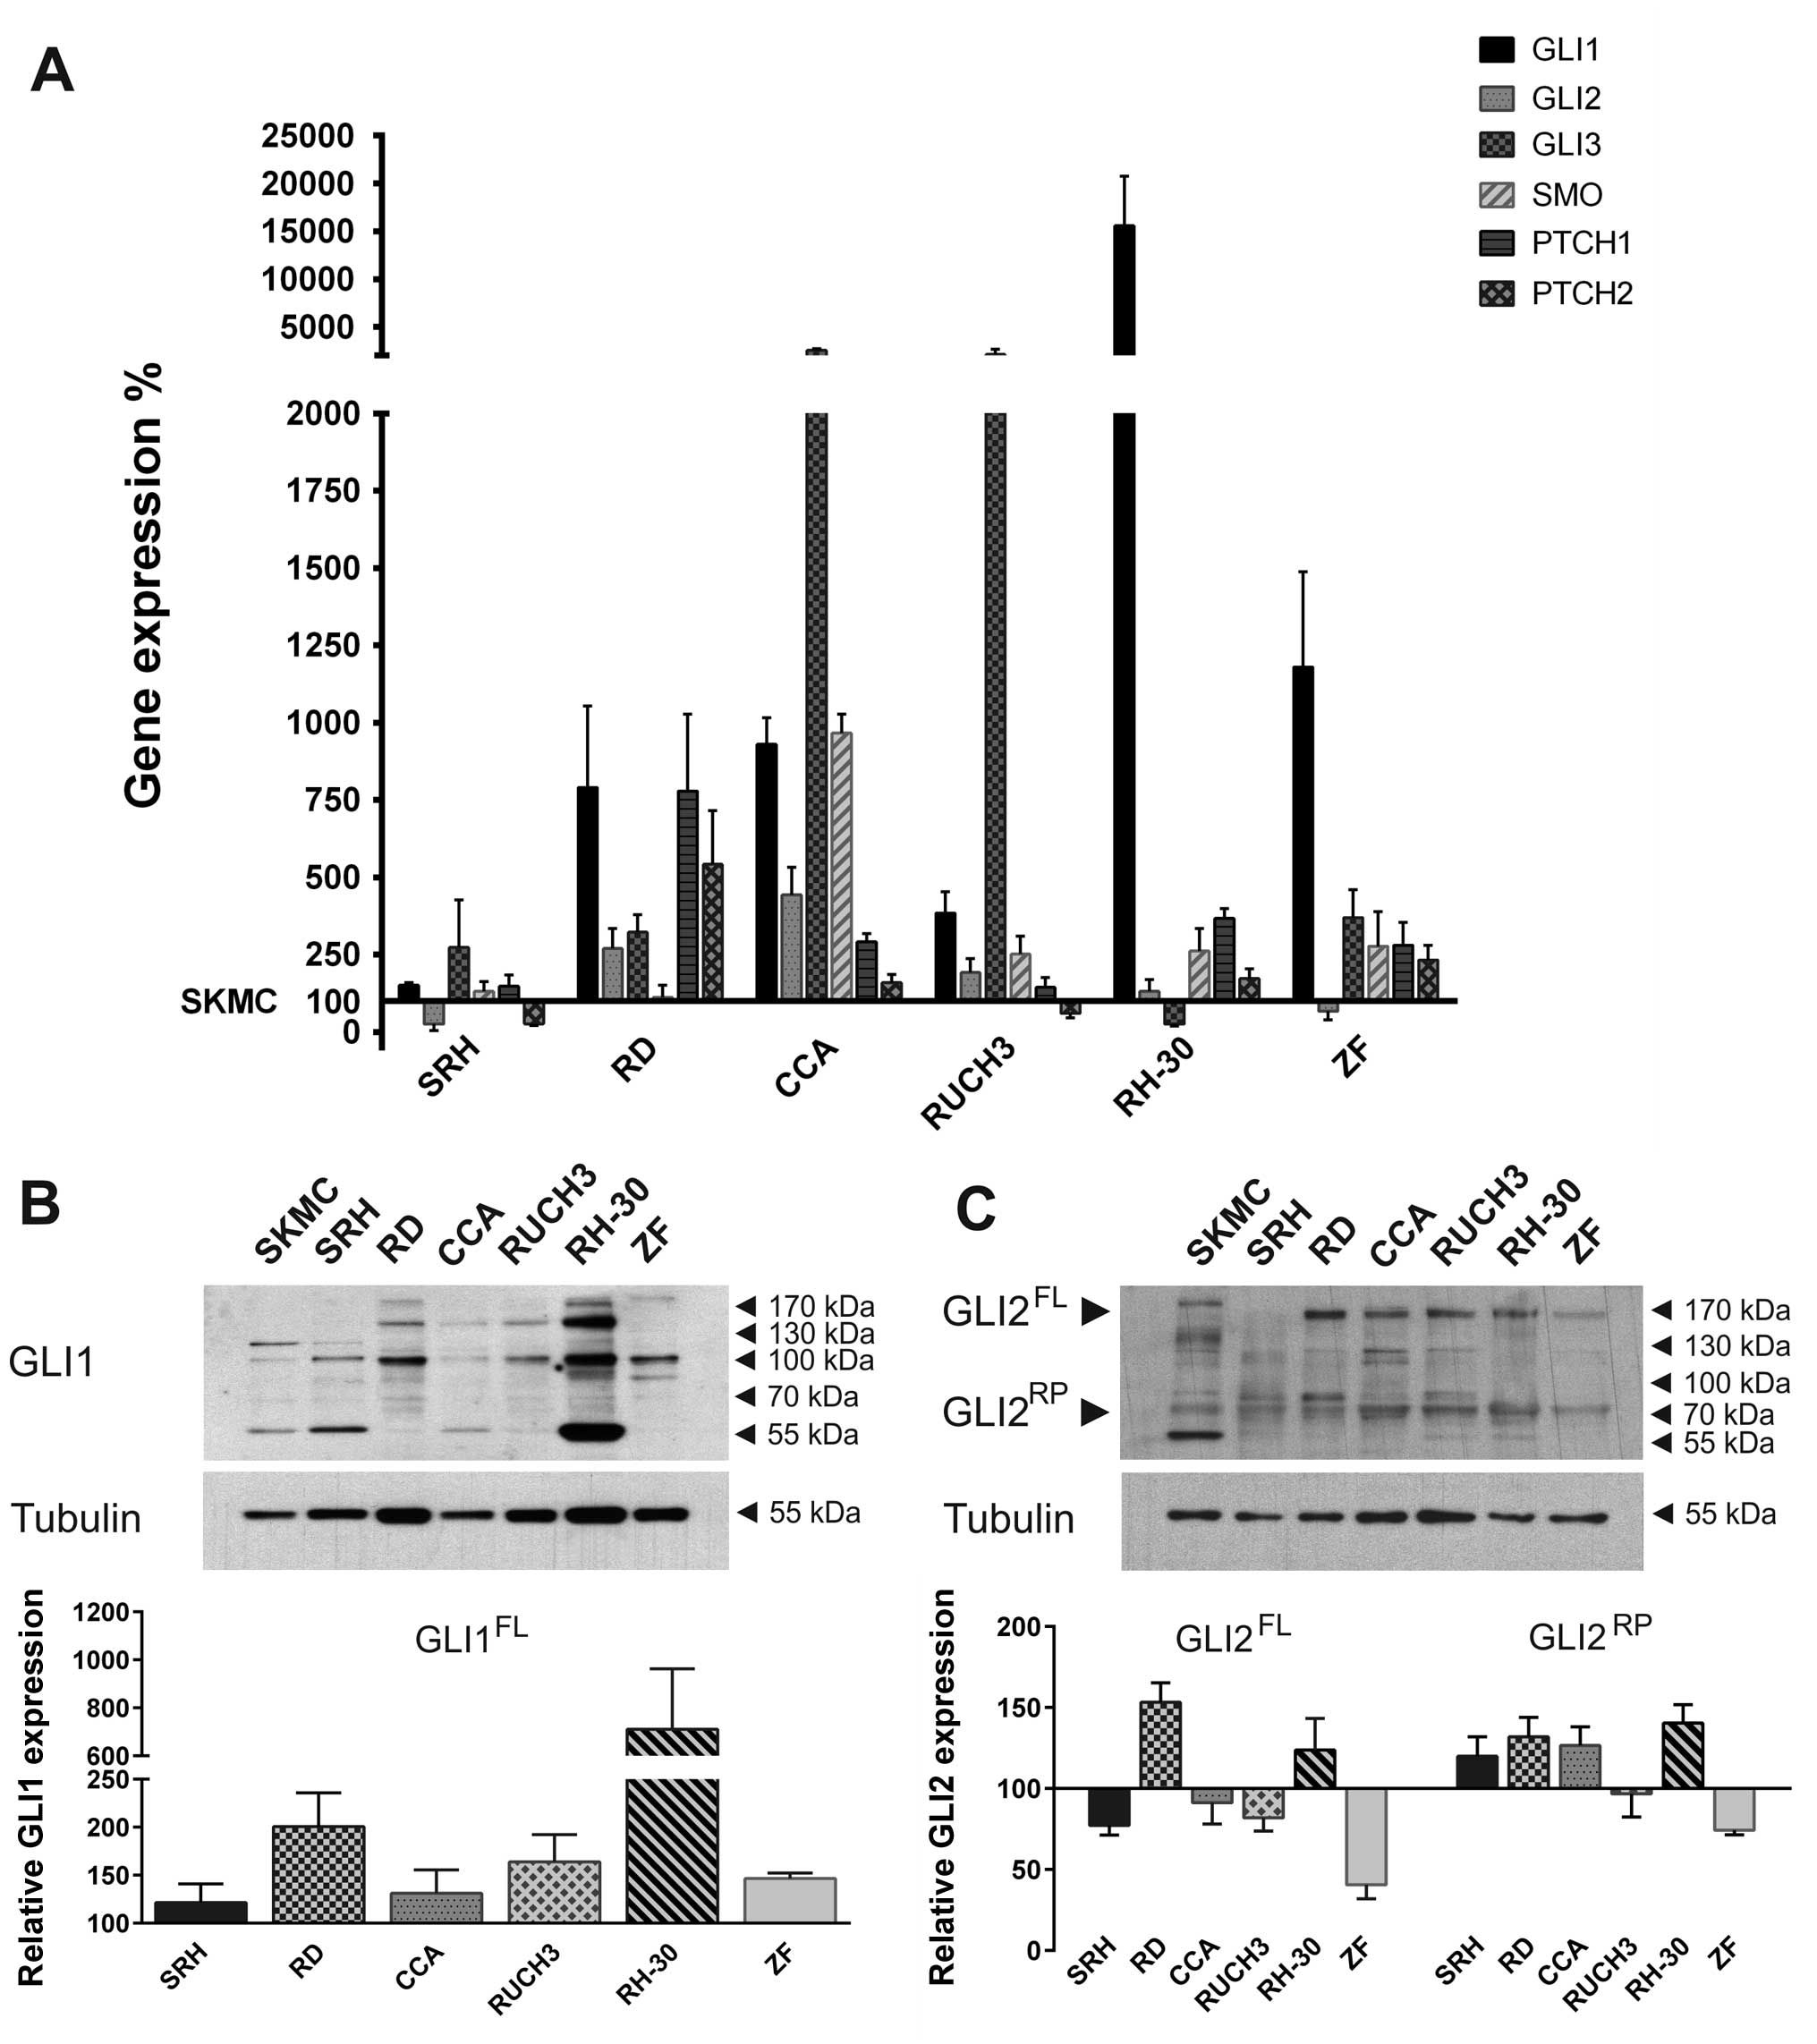
Hedgehog pathway gene expression was determined in
six human RMS cell lines compared to SKMC (Fig. 1A). Quantitative real-time PCR
revealed that GLI1 expression was upregulated in all RMS cell lines
examined. Expression levels in SRH mostly resembled SKMC, whereas
higher GLI1 expression levels were detected in the ERMS cell lines
RD, CCA and RUCH3. The ARMS cell line ZF showed a strong GLI1 mRNA
overexpression, while GLI1 was excessively upregulated in RH-30
cells, which contain a gene amplification (25). GLI2 expression in SRH and ZF cells
was reduced compared to primary skeletal muscle cells. All other
RMS cell lines exhibited a low to moderate overexpression of GLI2
mRNA. GLI3 expression was reduced in RH-30 cells compared to SKMC
but moderately elevated in SRH, RD and ZF. High GLI3 mRNA
expression was found in CCA and RUCH3. SMO mRNA levels of SRH and
RD cells corresponded to SKMC, whereas, higher expression was found
in all other RMS cell lines. The Hh receptor PTCH1 was slightly
overexpressed in SRH and RUCH3. Stronger expression could be found
in CCA, RH-30, ZF and RD cells. PTCH2 expression, on the contrary,
was reduced in SRH and RUCH3 cells compared to SKMC, while it was
slightly upregulated in CCA, RH-30, ZF and RD. Western blot
analysis confirmed the expression of GLI1 protein in RMS cell lines
and SKMC (Fig. 1B) with highest
protein levels in RH-30 cells. However, depending on the cell line
different variants of GLI1 dominated. In addition to the 160 kDa
form, in all RMS cell lines other splice variants (100–130 kDa)
could be detected. Moreover, smaller bands probably corresponding
to GLI1 degradation products appeared. For quantification all GLI1
signals >100 kDa were considered and normalised to tubulin
expression. The graph shows the expression relative to SKMC. GLI2
full length protein expression (100–170 kDa) was reduced in ZF,
SRH, CCA and RUCH3 cells compared to SKMC, while it was elevated in
RD and RH-30 RMS cell lines (Fig.
1C). Additionally, all RMS cell lines comprised the GLI2
repressor form of ~80 kDa. With the exception of RUCH3 and ZF
cells, expression of the GLI2 repressor protein was increased in
the RMS cells compared to SKMC. Remarkably, a prominent 55 kDa band
appeared exclusively in the primary skeletal muscle cells. These
results show that the Hh pathway components are actively expressed
in different RMS cell lines irrespective of their association to
the embryonal, alveolar or sclerosing, spindle cell subtype.
Hedgehog pathway inhibition reduces
viability of human RMS cell lines
We performed MTS viability assays to determine
IC50 values of ATO, GANT61, cyclopamine, LDE225 and
itraconazole in six RMS cell lines and SKMC (Table I). While viability of SKMC was
still 77.5% after 96 h of incubation with 10 μM ATO, the
IC50 values for all RMS cell lines ranged from 1.31 μM
in RH-30 to 3.67 μM in SRH. This emphasises the strong and highly
selective impact of ATO on RMS cells. The second GLI inhibitor
GANT61, on the contrary, was also efficient in all RMS cell lines
examined. However, primary skeletal muscle cells were more strongly
impaired in their viability than RUCH3 cells and nearly to the same
extent compared to RH-30 and SRH cells. Also the SMO inhibitor
cyclopamine showed a poor selectivity and in case of the cell line
RUCH3 no effect, while sensitivity of SRH and RD cells was still
detectable, although lower than in SKMC. Only ZF cells were
strongly compromised by cyclopamine. LDE225, the more selective and
stable derivative of cyclopamine, which is already used in clinical
studies (17), had no impact on
SKMC at a dose of 35 μM. However, SRH, RUCH3 and RH-30 cell
viability was also not affected and IC50 values for CCA
and ZF were significantly higher compared to cyclopamine. Only RD
cells showed a comparable dose response. Up to the concentration of
20 μM itraconazole affected none of the cell lines sufficiently to
determine IC50 values. However, in RUCH3 and RH-30 cells
viability was slightly reduced. Our results show that GANT61 and
cyclopamine are unsuitable for selective tumour cell treatment.
Nevertheless, at the doses applied in viability assays LDE225 and
itraconazole were largely inefficient. This emphasises ATO as the
most promising candidate substance for Hh pathway inhibition.
 | Table IHh pathway inhibition reduces
viability in human RMS cell lines. |
Table I
Hh pathway inhibition reduces
viability in human RMS cell lines.
| Inhibitor | Cell line | IC50
(μM) |
|---|
| ATO | SKMC | >10 |
| SRH | 3.67 |
| RD | 1.51 |
| CCA | 2.09 |
| RUCH3 | 2.64 |
| RH-30 | 1.31 |
| ZF | 2.00 |
| GANT61 | SKMC | 14.92 |
| SRH | 13.32 |
| RD | 8.38 |
| CCA | 8.97 |
| RUCH3 | 16.92 |
| RH-30 | 13.13 |
| ZF | 9.36 |
| Cyclopamine | SKMC | 13.49 |
| SRH | 15.96 |
| RD | 15.71 |
| CCA | 9.96 |
| RUCH3 | >35 |
| RH-30 | 11.93 |
| ZF | 4.08 |
| LDE225 | SKMC | >35 |
| SRH | >35 |
| RD | 15.57 |
| CCA | 13.00 |
| RUCH3 | >35 |
| RH-30 | >25 |
| ZF | 6.65 |
| Itraconazole | SKMC | >20 |
| SRH | >20 |
| RD | >20 |
| CCA | >20 |
| RUCH3 | >20 |
| RH-30 | >20 |
| ZF | >20 |
ATO in combination with itraconazole
impairs colony formation of RMS cell lines
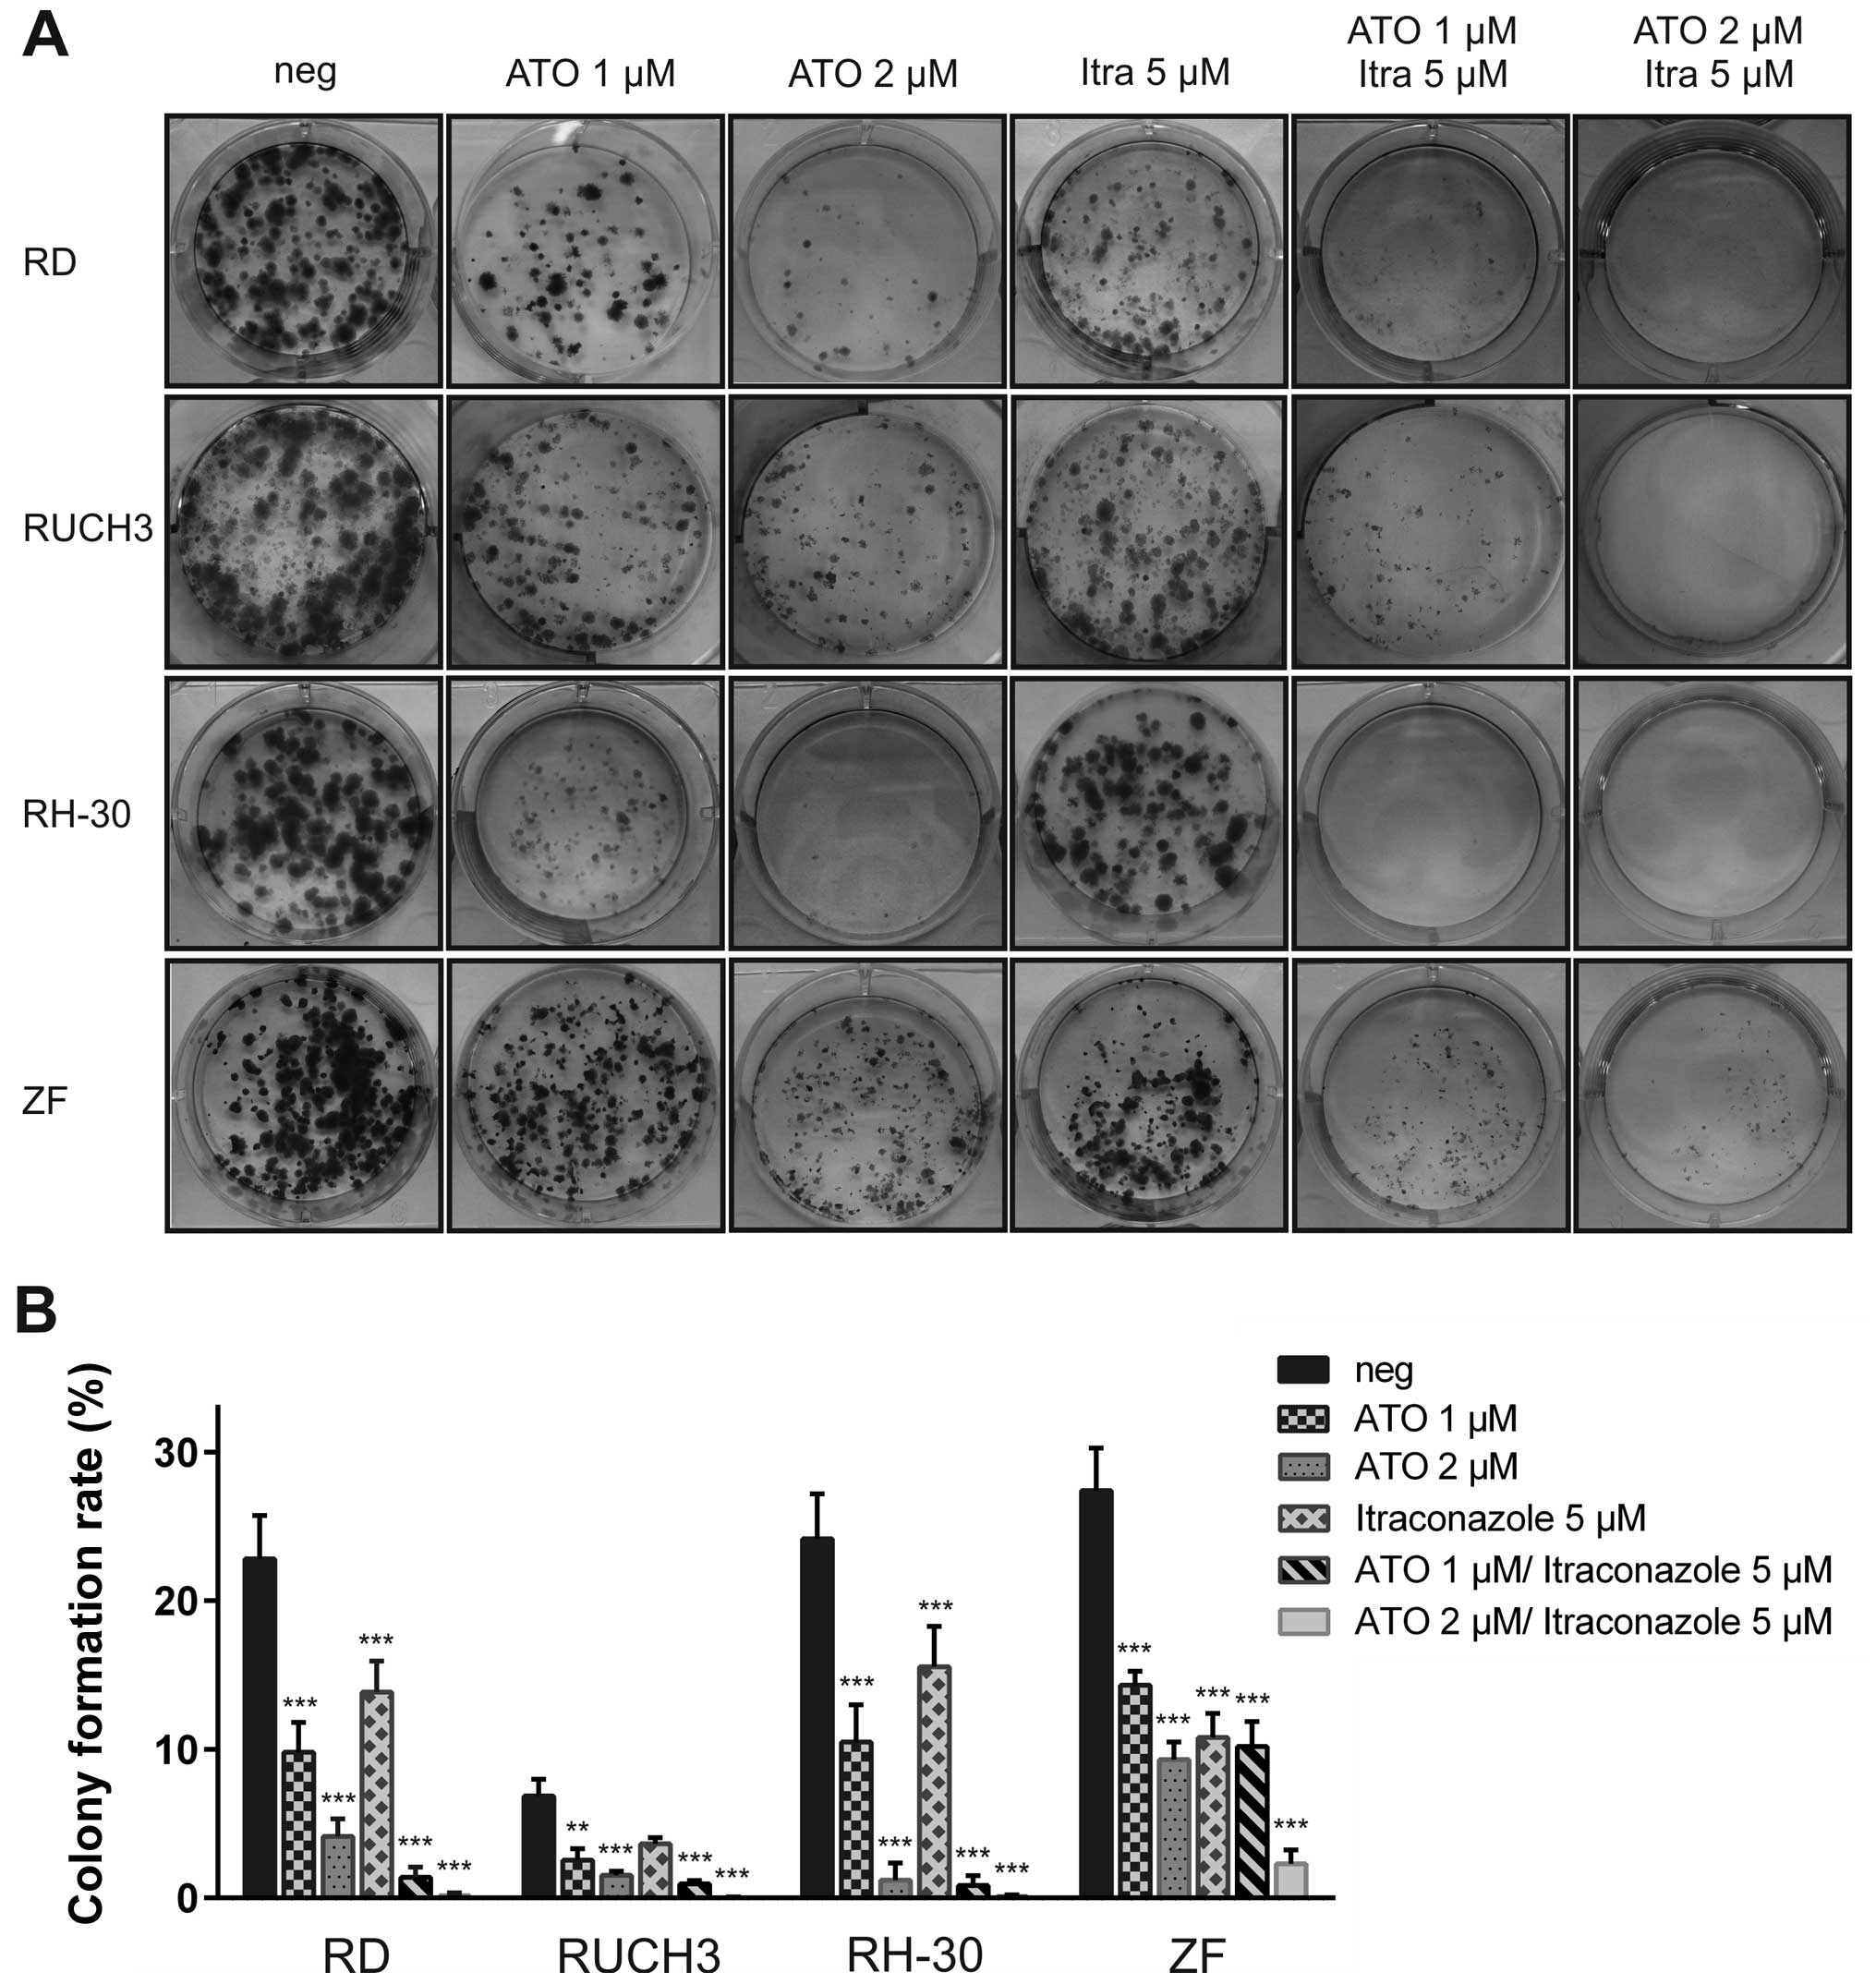
Although itraconazole lacks significant effects on
cell viability we analysed both ATO and itraconazole in single and
combined treatment in clonogenic assays performed with RD, RUCH3,
RH-30 and ZF cells (Fig. 2). The
cell lines SRH and CCA did not to form colonies from single cells
and were therefore excluded from this experiment. The addition of 1
μM ATO for 72 h was sufficient to significantly impair colony
formation in RD, RUCH3 RH-30 and ZF cells compared to mock-treated
control, whereas 2 μM largely abolished colony growth in all cell
lines except ZF (Fig. 2B).
Moreover, the size of the persisting colonies was reduced (Fig. 2A). Compared to the results of the
viability assays, resistance of ZF cells to ATO was higher in the
clonogenic assay. The colony formation rate of RUCH3 cells was
generally low in this experimental setting. Although itraconazole
had no impact on cell viability in the MTS assays, a significant
reduction of colony numbers could be detected after addition of 5
μM itraconazole in RD, RH-30 and ZF cells (Fig. 2B). Combination of 1 μM ATO with 5
μM itraconazole substantially blocked colony formation in RH-30
cells, whereas some microcolonies remained in RD, RUCH3 and ZF
cells. Elevation of the ATO dose to 2 μM suppressed colony growth
in three of the RMS cell lines. Only ZF cells still formed a small
number of microcolonies after combined treatment with 2 μM ATO and
5 μM itraconazole. Interestingly, this additive effect was less
pronounced using combined treatment of ATO with LDE225 (data not
shown). However, a single dose of 15 μM LDE225 was sufficient to
stop colony formation in RD, RUCH3, RH-30 and ZF cells (data not
shown). Conspicuously, proliferation of RUCH3 cells was inhibited
by LDE225 during the longer experimental setting of the colony
formation assay compared with the lack of viability restriction
during the 96 h of MTS assay.
ATO reduces RMS cell growth in 3D
spheroid culture
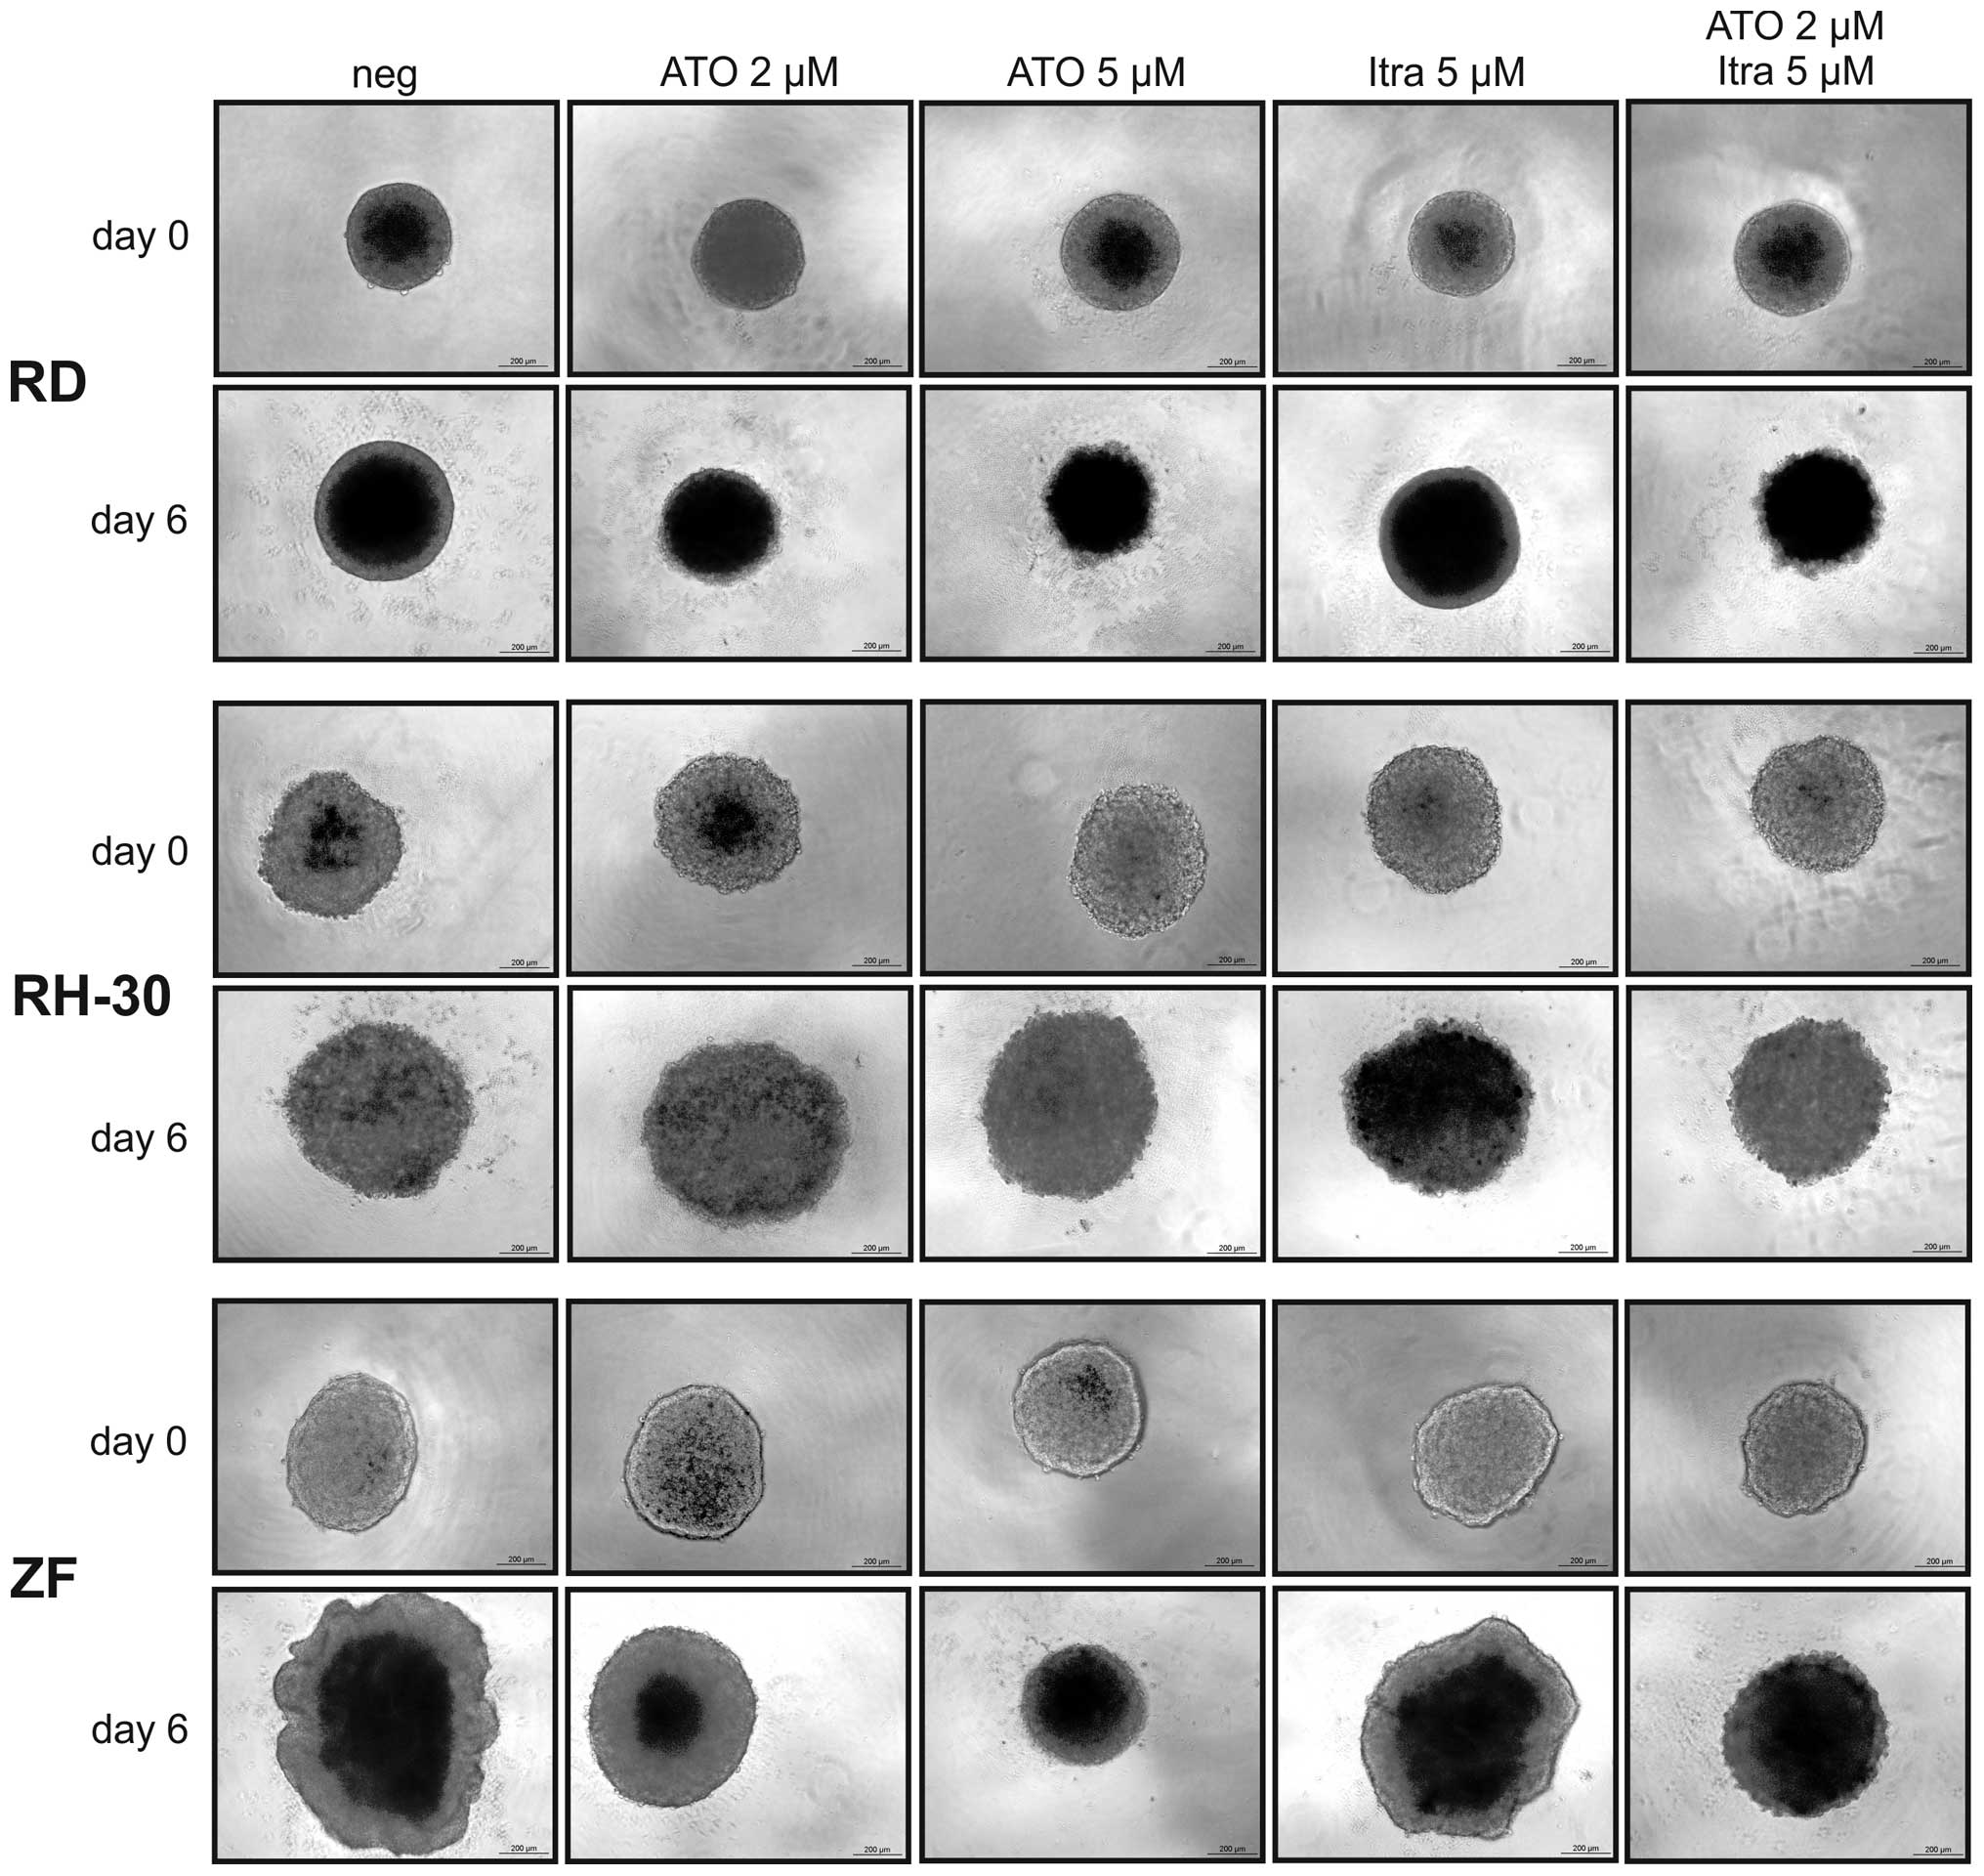
3D spheroid cultures resemble tumour formation in
vivo exhibiting gradients in nutrition and oxygen availability
but also in penetration by cytotoxic substances. As ATO but also a
combination of ATO and itraconazole were effective in viability
reduction and inhibition of colony formation, these Hh inhibitors
were applied in 3D spheroid cultures of RD, RH-30 and ZF cells. The
RMS cell lines SRH, CCA and RUCH3 refused to form stable 3D
cultures and had to be excluded from this experiment. As the
representative micrographs of Fig.
3 show, there was a dose-dependent reduction of spheroid growth
by ATO in ZF cells with 5 μM ATO completely blocking the increase
in size. In RD cells already 2 μM ATO were sufficient to completely
inhibit spheroid growth. RH-30 cells were less sensitive in 3D
culture and ATO could not reduce spheroid growth. Itraconazole
reduced growth of ZF spheroids, however much less compared to ATO,
whereas RD and RH-30 spheroids were not compromised. Growth
inhibition of ZF spheroids was enhanced by the combination of 2 μM
ATO and 5 μM itraconazole compared to single doses. However, it was
not as effective as 5 μM ATO. In RD cells the impact of the
inhibitor combination was comparable to ATO single treatment.
Interestingly, an additive effect could be documented in RH-30
cells, the spheroid growth was not fully prevented but reduced
compared to single treatments.
Hedgehog pathway inhibition induces cell
death
As cancer treatment affords effective killing of
resident tumour cells and not only a transient growth inhibition,
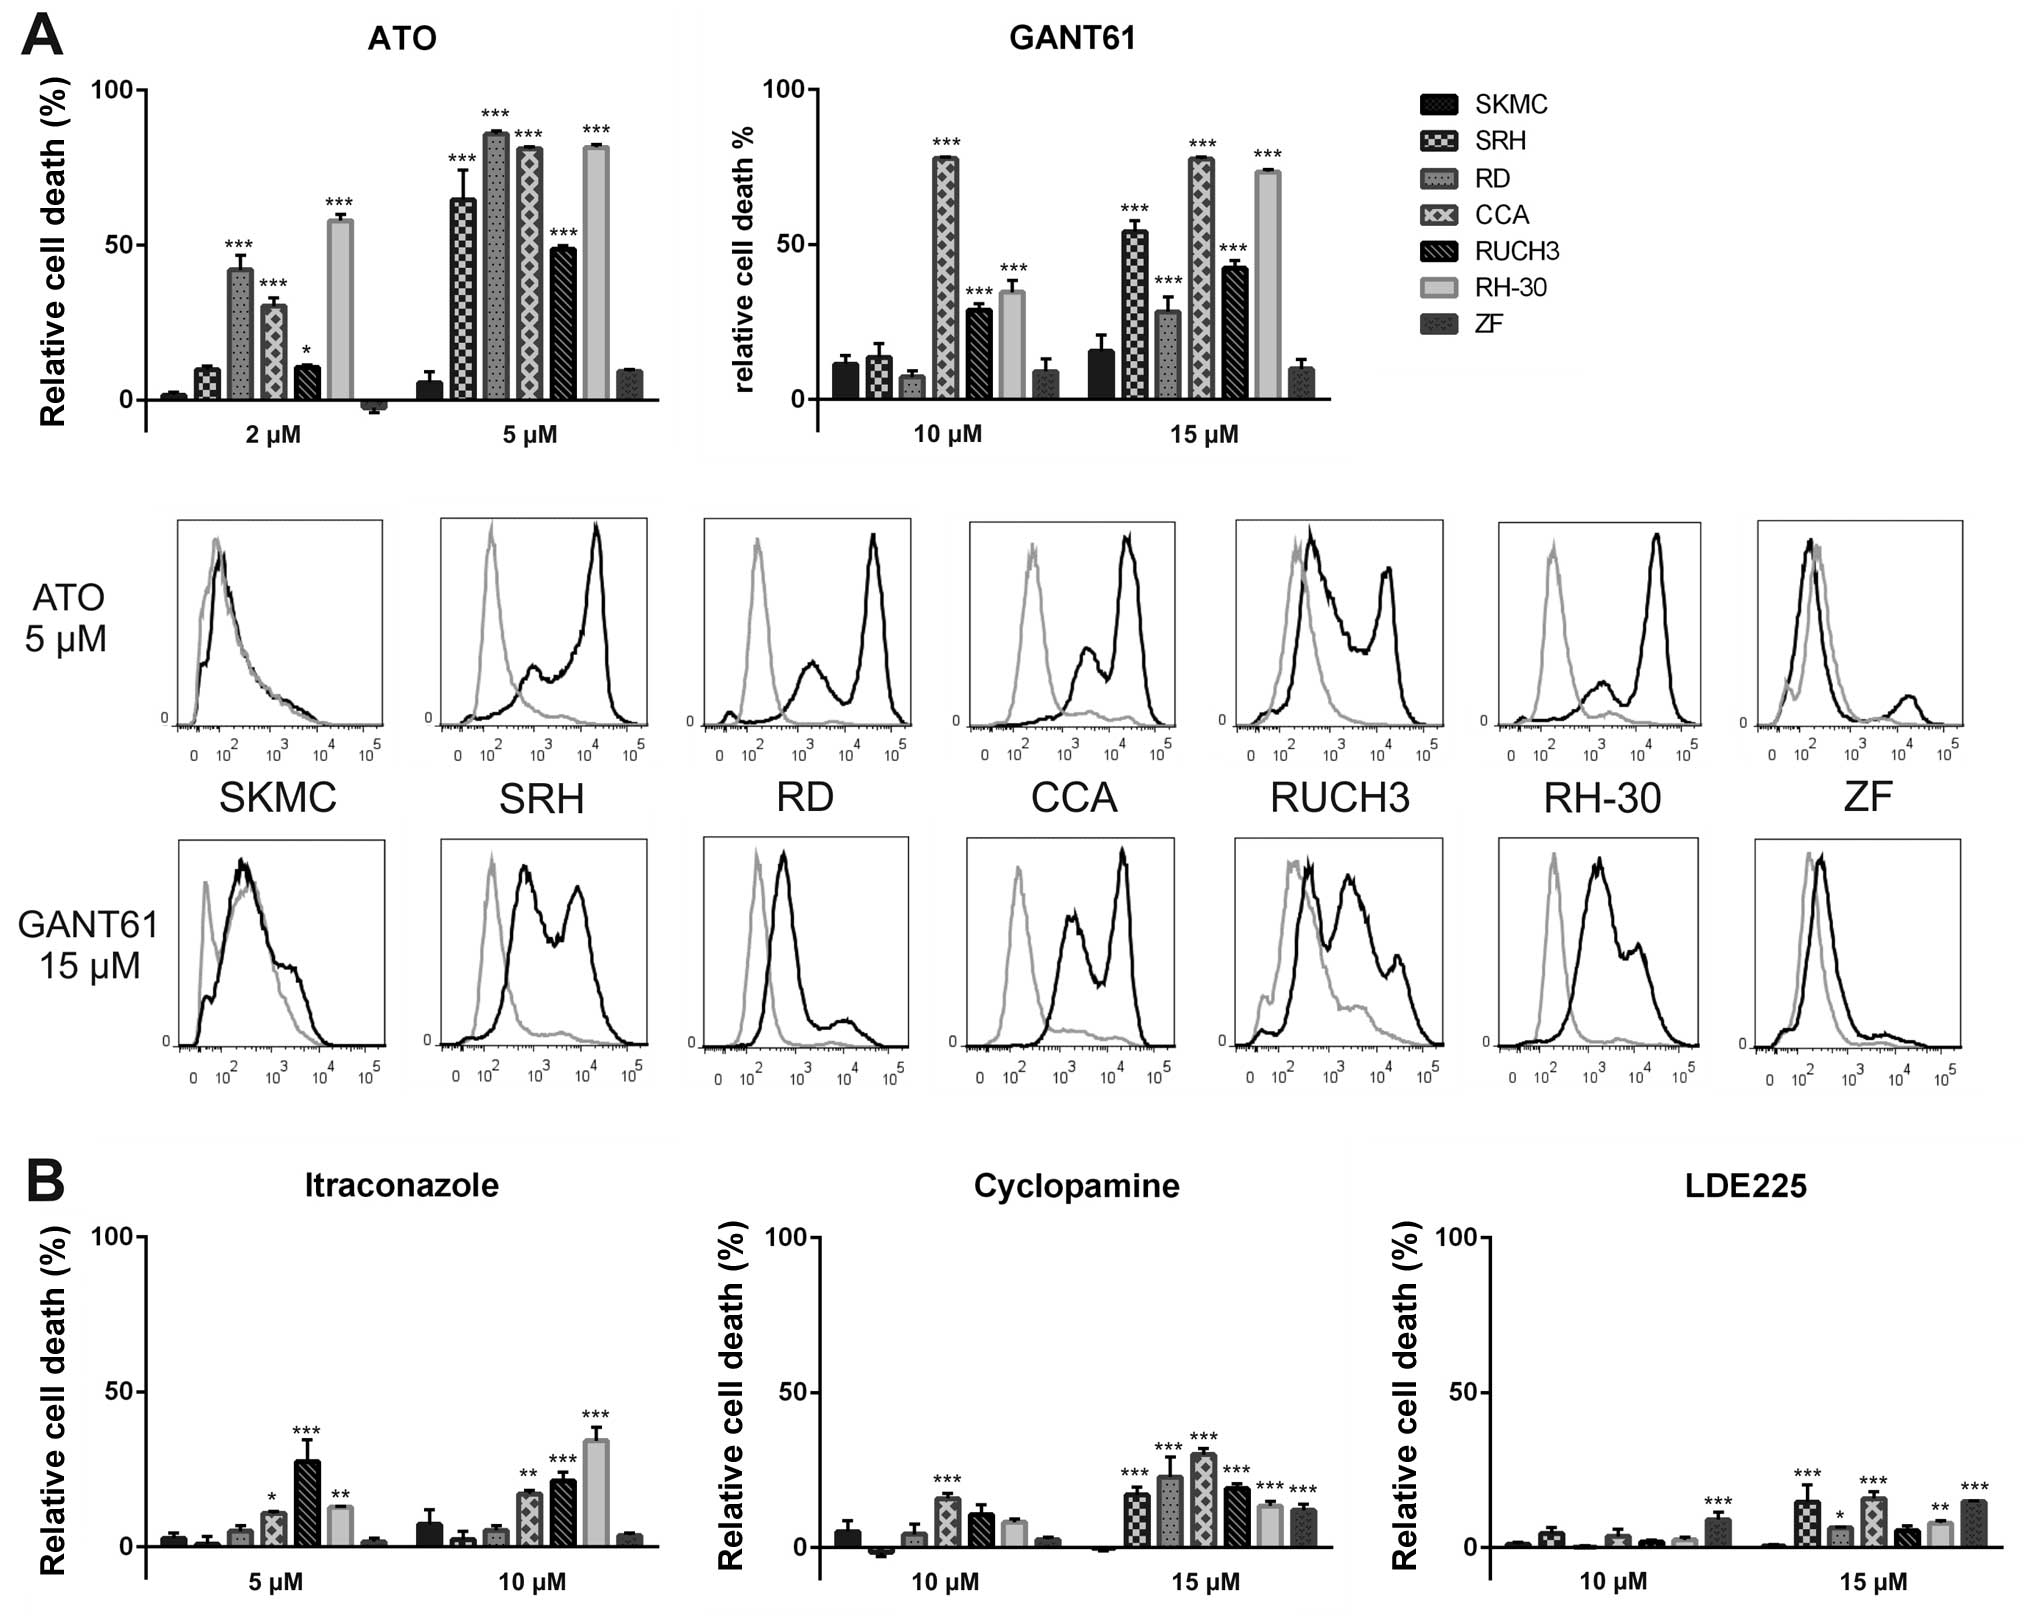
we performed flow cytometry analysis to detect incorporation of the
fixable viability dye eFluor® 450. The dye is excluded
from cells with intact membranes, therefore apoptotic or necrotic
cells with membrane degradation can be quantified using this
method. Six RMS cell lines and SKMC were incubated with ATO,
GANT61, cyclopamine, LDE225 or itraconazole for three days before
assessment of cell death (Fig. 4).
Treatment with 2 μM ATO already induced significant dye
incorporation in the RMS cell lines RD, CCA and RH-30. Using 5 μM
ATO cell death increased to 65% (SRH), 86% (RD), 81% (CCA), 49%
(RUCH3) or 82% (RH-30). ZF cells showed only a small proportion of
dead cells (9%), whereas 6% of SKMC were stained by the dye. The
second GLI1 inhibitor GANT61 was most effective in CCA cells at the
low dose of 10 μM. Increasing the GANT61 concentration to 15 μM led
to 54% (SRH), 28% (RD), 77% (CCA), 42% (RUCH3) and 73% (RH-30) dead
cells. However, GANT61 also induced cell death in 16% of the SKMC,
which was more than in the resistant ZF cells (10% dead cells).
Moreover, the histograms show a less complete shift of the cell
populations after addition of GANT61 compared to ATO (Fig. 4A). Using SMO inhibitors induction
of cell death was less efficient (Fig.
4B). At a concentration of 10 μM itraconazole only CCA (17%),
RUCH3 (21%) and RH-30 cells (34%) showed significant cell death
induction. Cyclopamine (15 μM) induced 17% (SRH), 23% (RD), 30%
(CCA), 19% (RUCH3), 13% (RH-30) and 12% (ZF) cell death,
respectively. Interestingly, membrane integrity of SKMC was not
affected at all by this drug concentration. The impact of the
cyclopamine derivative LDE225 was still lower with maximum cell
death induction of 15% (SRH), 16% (CCA) and 15% (ZF) at the
concentration of 15 μM. Again, SKMC showed <1% dye
incorporation. These results indicate that Hh pathway inhibition at
the level of GLI1 has explicit advantage over SMO inhibition. Even
cyclopamine, showing a noticeable impact on viability of RMS cells
and SKMC, was inefficient for induction of cell death.
ATO-dependent Hh pathway inhibition
induces apoptosis in RMS cell lines
The viability dye eFluor® 450 is not able
to discriminate between necrotic and apoptotic cell death. In order
to detect apoptosis induction after treatment with 5 μM ATO western
blot analysis was performed in all six RMS cell lines and SKMC
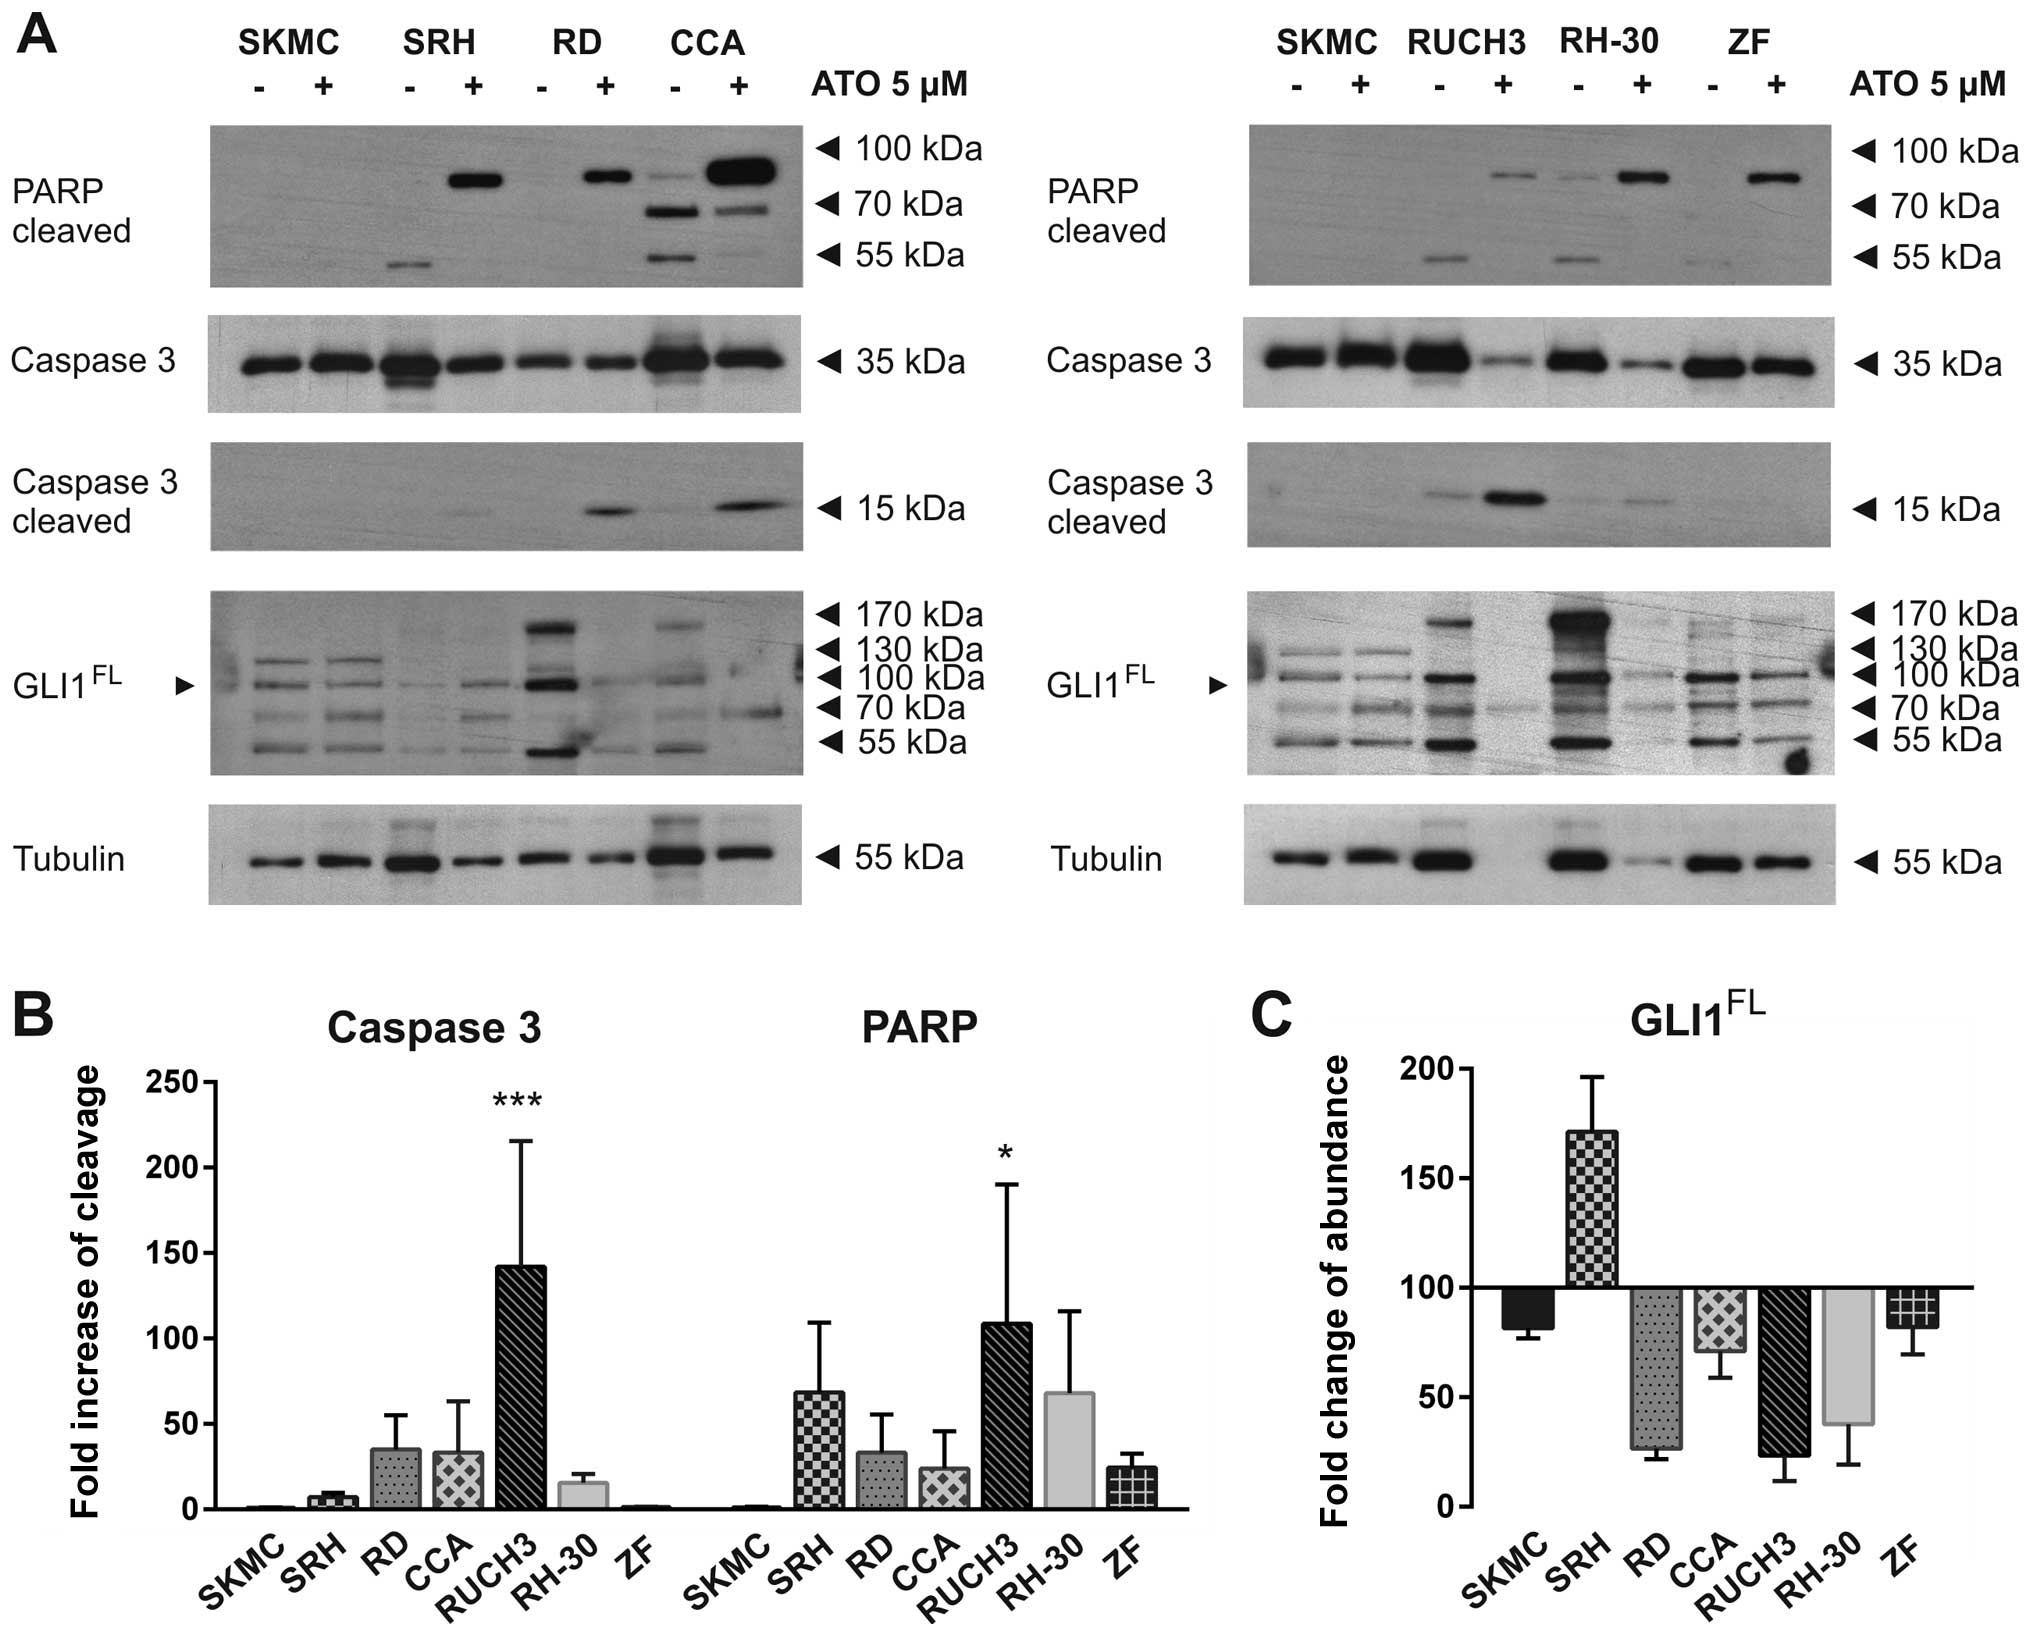
(Fig. 5A). Apoptotic PARP
cleavage, as indicated by the 89 kDa fragment, was clearly induced
by ATO in all RMS cell lines but not SKMC at the time of cell
lysis. The reaction of RUCH3 cells was very distinct indicated by
strong caspase 3 cleavage and nearly total tubulin degradation
after two days (Fig. 5A and B).
Due to global protein degradation the PARP band was comparably weak
in these cells. Also RH-30 cells showed a strong response indicated
by significant reduction of full length caspase 3 and tubulin. In
this case the cleaved caspase 3 band already was very faint while
cleaved PARP could be still detected in high amounts. Caspase 3
cleavage was also detected in RD and CCA cells, while SRH and ZF
cells showed nearly no caspase 3 cleavage and no reduction of total
caspase 3, indicating an alternative way of PARP cleavage (Fig. 5A and B). To verify that ATO indeed
targets the Hh pathway at the level of GLI1, which is an Hh target
gene itself, we also analysed GLI1 protein expression after ATO
incubation (Fig. 5A and C). A
strong reduction of full length and modified GLI1 protein could be
detected in RD, CCA, RUCH3 and RH-30 cells. Interestingly, in SRH
cells the GLI1 protein accumulated after ATO treatment, while GLI1
protein was slightly reduced in ZF cells. SKMC showed no
differences in PARP or caspase 3 cleavage. Compared to tubulin
expression the amount of GLI1 was also slightly reduced in SKMC.
These results indicate that ATO-dependent cell death induction in
RMS cell lines involves the apoptotic pathway and is commonly
linked to loss of full length GLI1. ZF cells which were highly
resistant to ATO induced cell death exhibited no significant
reduction of GLI1 abundance at the dose of 5 μM.
ATO induces cell cycle arrest in RMS cell
lines
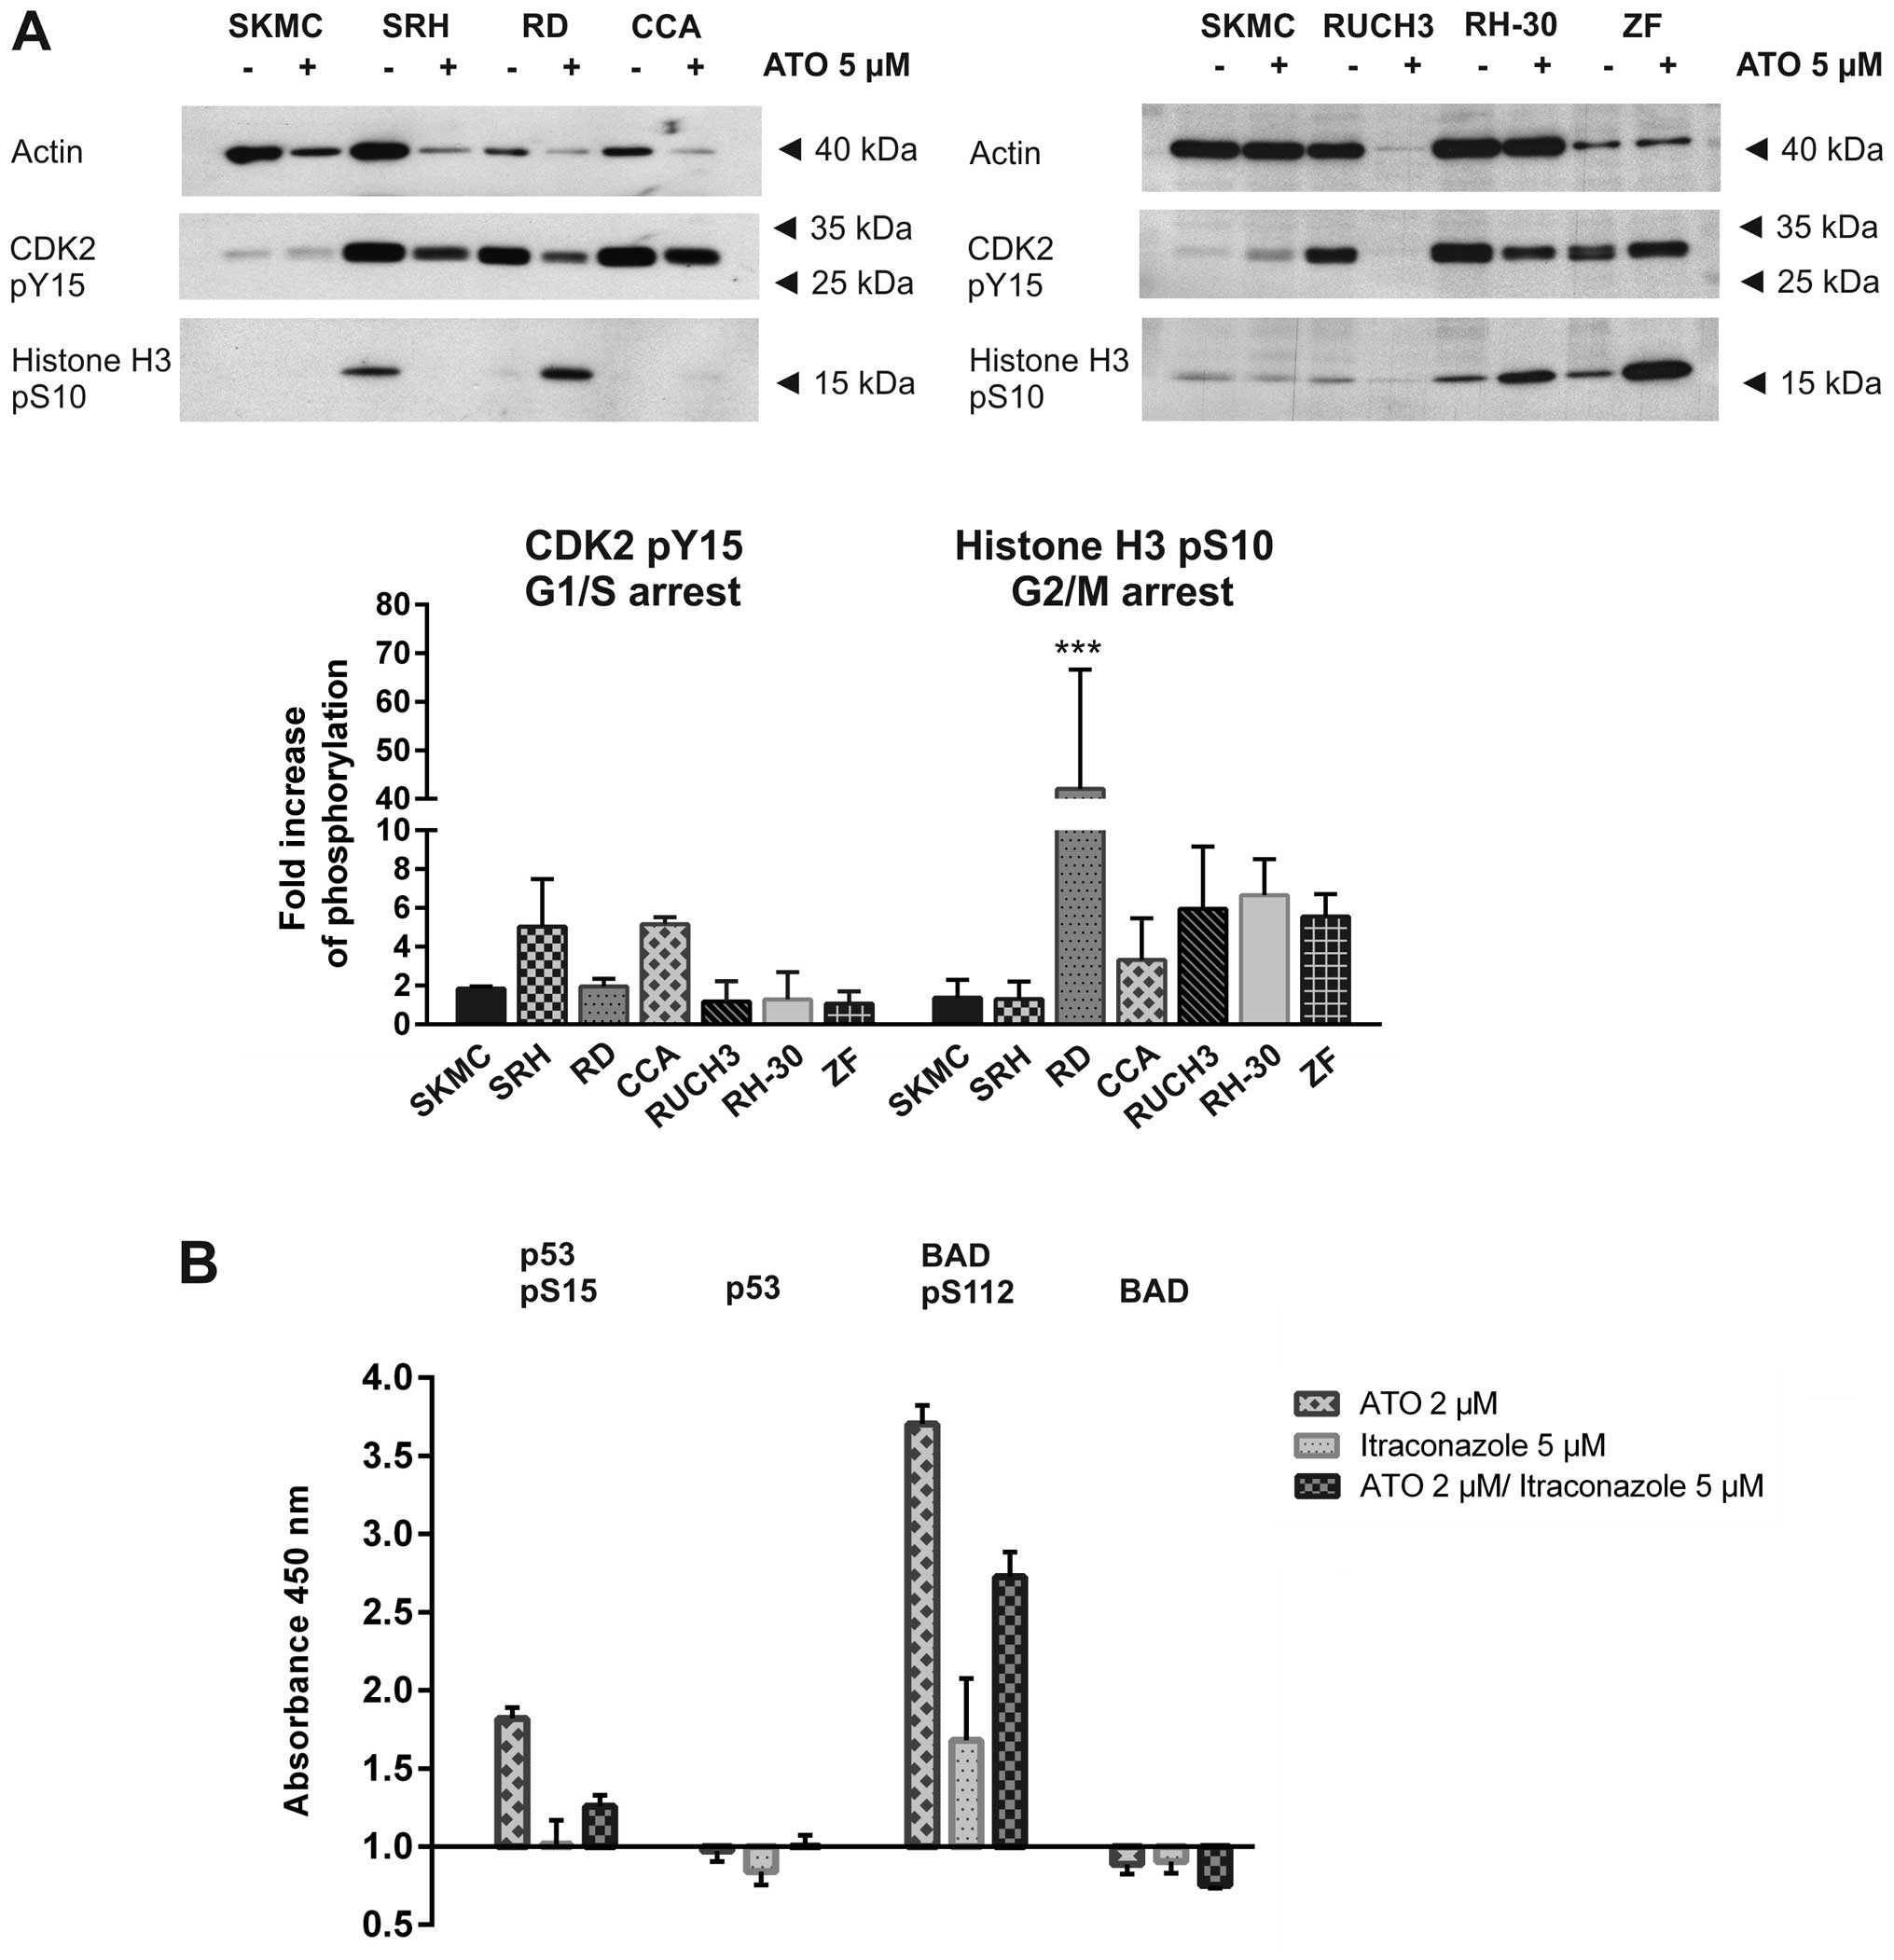
To elucidate the growth arrest and subsequent
apoptosis after ATO treatment western blot analysis was performed
in all six RMS cell lines and SKMC (Fig. 6A). Phosphorylation of CDK2 at Tyr15
indicates its inactivation at the G1/S transition, while Ser10
phosphorylation of histone H3 indicates a G2/M cell cycle arrest
(26,27). Histone H3 phosphorylation was
significantly increased in RD cells and was also elevated in CCA,
RUCH3, RH-30 and ZF cells while actin expression was stable or
reduced after ATO incubation, indicating a G2 arrest.
Unfortunately, due to global protein degradation after 48 h of ATO
incubation the impact on RUCH3 cell cycle was attenuated. In CCA
cells a comparably weak histone H3 phosphorylation could be
detected, but CDK2 Tyr15 phosphorylation was elevated after ATO
treatment while actin was almost degraded, indicating a weak G1
arrest. Interestingly, the histone H3 phosphorylation could hardly
be detected in SRH cells after ATO treatment while CDK2 Tyr15
phosphorylation decreased less distinct than the actin amount
indicating a vague G1 arrest. SKMC cells showed only very weak H3
phosphorylation which was only slightly enhanced by ATO.
Apoptosis induction of RD cells is
attenuated by inhibitory BAD phosphorylation
Phosphorylation of p53 at Ser15 is one of the first
events of p53 modification occurring after metabolic stress or DNA
damage (28). RD cells express the
R248W mutant p53, while the second p53 allele is lost. This hot
spot mutation causes at least partial inactivation of p53 function
(29). Phosphorylation of the
pro-apoptotic BAD protein at Ser112 inactivates its
BCL-XL binding activity and sequesters it to the
cytoplasm, preventing apoptotic cell death (30). Showing that ATO and a combination
of itraconazole and ATO induced a growth arrest and apoptotic cell
death in several RMS cell lines including RD, we chose RD cells for
further elucidating the signalling pathways involved (Fig. 6B). Using a PathScan®
ELISA we showed that p53 protein expression only slightly decreased
after ATO and itraconazole treatment, while 2 μM ATO was sufficient
to induce a significant increase in p53 phosphorylation at Ser15,
which was much weaker after treatment using a combination of 2 μM
ATO with 5 μM itraconazole. However, itraconazole as single agent
had no impact on p53 phosphorylation. While BAD protein expression
was also slightly reduced after treatment with ATO or itraconazole,
we found a massive Ser112 phosphorylation, especially after
incubation with 2 μM ATO, but also using the combination of 2 μM
ATO and 5 μM itraconazole. In addition, itraconazole single
treatment induced a distinct but comparably weaker Ser112
phosphorylation. These results clearly indicate that ATO induced
p53 Ser15 phosphorylation, accompanied by a growth arrest. An
effect which has to be discussed for the p53 mutated RD cells.
Interestingly, the strong anti-apoptotic BAD Ser112 phosphorylation
after ATO and itraconazole treatment should attenuate apoptosis
induction in RD cells.
Discussion
The standard of care for treating RMS is a
combination of multimodal chemotherapy and surgery (6). However, mortality rates remain high
in case of recurrences and metastatic disease due to the
development of drug resistance (7). Aberrant activation of the Hh
signalling pathway has been found in several cancers including RMS
(10). For this reason we
investigated the impact of Hh pathway inhibition on RMS cell growth
and survival. In our study we found all six RMS cell lines examined
to actively express components of the Hh pathway with data of SRH
cells mostly resembling primary skeletal muscle cells. Especially
the GLI1 mRNA was overexpressed compared to SKMC with highest
levels found in the ARMS cell lines RH-30 and ZF. RH-30 cells
contain a GLI1 gene amplification (25) leading to massive expression of
different GLI1 isoforms including the 160 kDa full length and
smaller variants. Interestingly, on protein level ZF cells showed
only a moderate overexpression of a 100 kDa isoform. Indeed, with
the exception of CCA cells, we found the 100 kDa isoform in all RMS
cell lines to be more distinctly expressed compared to SKMC. GLI2
full length protein expression was significantly reduced in ZF
cells compared to SKMC, whereas it was increased in RD and RH-30
RMS cell lines. In addition to the full length protein of 170 kDa,
an 80 kDa repressor form could be detected in all cells with
diminished expression in ZF cells compared to SKMC. Conspicuously,
the full length GLI2 protein in SKMC seems to be modified having a
higher molecular weight compared to the RMS cell lines. On the
other hand, only in SKMC there was a prominent 55 kDa band, which
was much smaller than the repressor form predicted (31), therefore most likely representing a
degradation product. For inhibition of the Hh pathway two major
targets can be addressed. Cyclopamine and its derivative LDE225
target SMO (18). In addition,
itraconazole also inhibits SMO but uses a different binding site
(20). More downstream in the Hh
pathway the GLI inhibitors ATO and GANT61 prevent expression of Hh
target genes (22,23). Intriguingly, in RMS
ligand-independent GLI1 activity has been observed, which may
interfere with the efficiency of SMO inhibitors (14,15,32).
Other groups showed, that both GLI1 knockdown and a combination of
GLI1 and GLI2 siRNA reduced RMS cell survival (1,33).
In this study, we identified ATO as the most
efficient and specific Hh inhibitor inducing growth arrest and
apoptosis in a panel of RMS cell lines. ATO directly binds to GLI1
and GLI2, inhibiting their transcriptional activation capacity
(34). Moreover, ATO promotes GLI2
degradation (35). We applied ATO
doses of 2–5 μM, which correspond to plasma levels obtained in
leukemia patients (36). We showed
that ATO reduced viability, clonogenic survival and growth of 3D
cultures in a dose-dependent manner in all RMS cell lines examined.
In addition, RD, CCA, RUCH3 and RH-30 cells underwent apoptosis
indicated by caspase 3 and PARP cleavage. However, our RMS cell
lines comprise two recently established, low passage cell lines SRH
and ZF, which exhibit almost no caspase 3 cleavage upon ATO
treatment, while viability was significantly reduced.
Interestingly, this lack of caspase 3-dependent apoptosis was
accompanied by largely unchanged or indeed elevated GLI1 expression
levels under ATO, indicating that the Hh pathway was still active
in these cells under the dose of 5 μM ATO. Whereas, the high dose
of 5 μM ATO was sufficient to induce cell death indicated by loss
of membrane integrity in SRH cells, ZF cells remained almost
completely resistant. Nevertheless, also ZF cells exhibited PARP
cleavage upon ATO addition indicated by the 89 kDa catalytic
fragment. Indeed, both ZF and SRH cells were established from high
grade RMS patients receiving multimodal chemotherapy prior to
resection of the tumour, which may also contribute to general
apoptosis resistance as described before (7). Analysis of histone 3 Ser10
phosphorylation revealed a clear G2/M arrest induced by 5 μM ATO in
RD, RH-30 and ZF cells. On the contrary, in SRH cells histone 3
Ser10 phosphorylation was not elevated upon ATO treatment,
indicating an unaffected progression through G2/M phase, while CDK2
Tyr15 phosphorylation was enhanced, suggesting a G1/S arrest. Also
in CCA cells CDK2 Tyr15 phosphorylation remained high, while actin
abundance decreased upon treatment with 5 μM ATO, pointing to a G1
arrest. Actually, although a G2/M arrest is more commonly reported
after ATO treatment, a G1 arrest was also found in myeloma cells.
However, we can not consent to the statement that the ATO induced
G2/M arrest and subsequent apoptosis is generally dependent on
mutated p53 (37). We could prove
that SRH cells comprise a p53 double mutant (data not shown) but
these cells showed neither G2/M arrest nor caspase 3-dependent
apoptosis after ATO treatment. On the other hand, CCA cells had a
strong apoptotic caspase 3 and PARP cleavage but apparently only a
weak G2/M arrest. In APL cell lines and primary APL blasts an
ATO-dependent ERK1/2 activation seems to be implicated in an
increased anti-apoptotic BAD Ser112 phosphorylation (38). In its phosphorylated stage BAD can
no longer displace BAX from binding to BCL-2 or BCL-XL
proteins, preventing the BAX-dependent disruption of the
mitochondrial membrane (39,40).
Furthermore, ATO was able to induce BAD Ser112 phosphorylation in
RD cells. Regardless of this, a high number of dead cells could be
detected after treatment of RD cells using 5 μM ATO and apoptosis
induction was proven by caspase 3 and PARP cleavage. Certainly, the
intrinsic apoptotic pathway leading to mitochondrial disruption can
be induced by ATO via downregulation of Bcl-2 expression in
pulmonary adenocarcinoma cells (41) or hepatocellular carcinoma cells
(42) or induction of the ER
stress pathway (43), apparently
overcoming the effect of BAD phosphorylation. Moreover, ATO was
shown to induce the extrinsic apoptotic pathway via TRAIL and TRAIL
receptor activation in myeloma cells (37,44).
GANT61, the second GLI inhibitor used in this study,
was a more effective cell death trigger compared to the SMO
inhibitors cyclopamine, LDE225 and itraconazole in single
application. Nevertheless, despite the efficacy of GANT61 in RMS
cell lines as we and others could prove (33), it also compromised primary skeletal
muscle cell viability and induced increased cell death.
As ATO and itraconazole are the only FDA approved
substances tested, which are directly available for use in
patients, we analysed the potential advantage of combination
treatment. Actually, despite limited impact of itraconazole on RMS
cell viability and cell death induction, the combination with ATO
clearly reduced colony formation and spheroid size. Our results are
in agreement with studies in mouse basal cell carcinoma and
medulloblastoma allografts, where an additive effect of ATO and
itraconazole could be demonstrated as well (35).
In conclusion, our data provide evidence that ATO is
a promising substance for the treatment of RMS by directly
targeting GLI transcription factors. Combination with itraconazole
or chemotherapeutic drugs has the potential to enhance the
treatment efficiency.
Abbreviations:
|
APL
|
acute promyelocytic leukemia
|
|
ATO
|
arsenic trioxide
|
|
BAD
|
BCL2-associated agonist of cell
death
|
|
BAX
|
BCL2-associated X-protein
|
|
BCL
|
B-cell CLL/lymphoma 2
|
|
CDK2
|
cyclin-dependent kinase 2
|
|
CDKN1C
|
cyclin-dependent kinase inhibitor
1C
|
|
FOXO1
|
forkhead box O1
|
|
GLI
|
glioma-associated oncogene family
|
|
Hh
|
hedgehog
|
|
PARP
|
poly(ADP-ribose) polymerase
|
|
PTCH
|
patched
|
|
PAX
|
paired box
|
|
RMS
|
rhabdomyosarcoma
|
|
SKMC
|
skeletal muscle cells
|
|
SMO
|
smoothened
|
|
TRAIL
|
TNF-related apoptosis inducing
ligand
|
References
|
1
|
Tostar U, Toftgård R, Zaphiropoulos PG and
Shimokawa T: Reduction of human embryonal rhabdomyosarcoma tumor
growth by inhibition of the hedgehog signaling pathway. Genes
Cancer. 1:941–951. 2010. View Article : Google Scholar
|
|
2
|
Egas-Bejar D and Huh WW: Rhabdomyosarcoma
in adolescent and young adult patients: Current perspectives.
Adolesc Health Med Ther. 5:115–125. 2014.PubMed/NCBI
|
|
3
|
Ferrari A, Dileo P, Casanova M, Bertulli
R, Meazza C, Gandola L, Navarria P, Collini P, Gronchi A, Olmi P,
et al: Rhabdomyosarcoma in adults. A retrospective analysis of 171
patients treated at a single institution. Cancer. 98:571–580. 2003.
View Article : Google Scholar : PubMed/NCBI
|
|
4
|
Agaram NP, Chen CL, Zhang L, LaQuaglia MP,
Wexler L and Antonescu CR: Recurrent MYOD1 mutations in pediatric
and adult sclerosing and spindle cell rhabdomyosarcomas: Evidence
for a common pathogenesis. Genes Chromosomes Cancer. 53:779–787.
2014. View Article : Google Scholar : PubMed/NCBI
|
|
5
|
Nascimento AF and Fletcher CD: Spindle
cell rhabdomyosarcoma in adults. Am J Surg Pathol. 29:1106–1113.
2005.PubMed/NCBI
|
|
6
|
Hawkins DS, Gupta AA and Rudzinski ER:
What is new in the biology and treatment of pediatric
rhabdomyosarcoma? Curr Opin Pediatr. 26:50–56. 2014. View Article : Google Scholar :
|
|
7
|
Eichenmüller M, Hemmerlein B, von
Schweinitz D and Kappler R: Betulinic acid induces apoptosis and
inhibits hedgehog signalling in rhabdomyosarcoma. Br J Cancer.
103:43–51. 2010. View Article : Google Scholar : PubMed/NCBI
|
|
8
|
Petrova R and Joyner AL: Roles for
Hedgehog signaling in adult organ homeostasis and repair.
Development. 141:3445–3457. 2014. View Article : Google Scholar : PubMed/NCBI
|
|
9
|
Amakye D, Jagani Z and Dorsch M:
Unraveling the therapeutic potential of the Hedgehog pathway in
cancer. Nat Med. 19:1410–1422. 2013. View
Article : Google Scholar : PubMed/NCBI
|
|
10
|
Kelleher FC, Cain JE, Healy JM, Watkins DN
and Thomas DM: Prevailing importance of the hedgehog signaling
pathway and the potential for treatment advancement in sarcoma.
Pharmacol Ther. 136:153–168. 2012. View Article : Google Scholar : PubMed/NCBI
|
|
11
|
Nakamura S, Nagano S, Nagao H, Ishidou Y,
Yokouchi M, Abematsu M, Yamamoto T, Komiya S and Setoguchi T:
Arsenic trioxide prevents osteosarcoma growth by inhibition of GLI
transcription via DNA damage accumulation. PLoS One. 8:e694662013.
View Article : Google Scholar : PubMed/NCBI
|
|
12
|
Aberger F, Aberger F and Ruiz I Altaba A:
Context-dependent signal integration by the GLI code: The oncogenic
load, pathways, modifiers and implications for cancer therapy.
Semin Cell Dev Biol. 33:93–104. 2014. View Article : Google Scholar : PubMed/NCBI
|
|
13
|
Kasper M, Regl G, Frischauf AM and Aberger
F: GLI transcription factors: Mediators of oncogenic Hedgehog
signalling. Eur J Cancer. 42:437–445. 2006. View Article : Google Scholar : PubMed/NCBI
|
|
14
|
Roberts WM, Douglass EC, Peiper SC,
Houghton PJ and Look AT: Amplification of the gli gene in childhood
sarcomas. Cancer Res. 49:5407–5413. 1989.PubMed/NCBI
|
|
15
|
Lynn M, Shah N, Conroy J, Ennis S, Morris
T, Betts D and O'Sullivan M: A study of alveolar rhabdomyosarcoma
copy number alterations by single nucleotide polymorphism analysis.
Appl Immunohistochem Mol Morphol. 22:213–221. 2014. View Article : Google Scholar : PubMed/NCBI
|
|
16
|
Matsumoto T, Tabata K and Suzuki T: The
GANT61, a GLI inhibitor, induces caspase-independent apoptosis of
SK-N-LO cells. Biol Pharm Bull. 37:633–641. 2014. View Article : Google Scholar : PubMed/NCBI
|
|
17
|
Lin TL and Matsui W: Hedgehog pathway as a
drug target: Smoothened inhibitors in development. Onco Targets
Ther. 5:47–58. 2012. View Article : Google Scholar : PubMed/NCBI
|
|
18
|
Ruat M, Hoch L, Faure H and Rognan D:
Targeting of Smoothened for therapeutic gain. Trends Pharmacol Sci.
35:237–246. 2014. View Article : Google Scholar : PubMed/NCBI
|
|
19
|
Pan S, Wu X, Jiang J, Gao W, Wan Y, Cheng
D, Han D, Liu J, Englund NP, Wang Y, et al: Discovery of
NVP-LDE225, a Potent and Selective Smoothened Antagonist. ACS Med
Chem Lett. 1:130–134. 2010. View Article : Google Scholar : PubMed/NCBI
|
|
20
|
Kim J, Tang JY, Gong R, Kim J, Lee JJ,
Clemons KV, Chong CR, Chang KS, Fereshteh M, Gardner D, et al:
Itraconazole, a commonly used antifungal that inhibits Hedgehog
pathway activity and cancer growth. Cancer Cell. 17:388–399. 2010.
View Article : Google Scholar : PubMed/NCBI
|
|
21
|
Watts JM and Tallman MS: Acute
promyelocytic leukemia: What is the new standard of care? Blood
Rev. 28:205–212. 2014. View Article : Google Scholar : PubMed/NCBI
|
|
22
|
Kim J, Lee JJ, Kim J, Gardner D and Beachy
PA: Arsenic antagonizes the Hedgehog pathway by preventing ciliary
accumulation and reducing stability of the Gli2 transcriptional
effector. Proc Natl Acad Sci USA. 107:13432–13437. 2010. View Article : Google Scholar : PubMed/NCBI
|
|
23
|
Lauth M, Bergström A, Shimokawa T and
Toftgård R: Inhibition of GLI-mediated transcription and tumor cell
growth by small-molecule antagonists. Proc Natl Acad Sci USA.
104:8455–8460. 2007. View Article : Google Scholar : PubMed/NCBI
|
|
24
|
Laurendeau I, Ferrer M, Garrido D, D'Haene
N, Ciavarelli P, Basso A, Vidaud M, Bieche I, Salmon I and Szijan
I: Gene expression profiling of the hedgehog signaling pathway in
human meningiomas. Mol Med. 16:262–270. 2010. View Article : Google Scholar : PubMed/NCBI
|
|
25
|
Forus A, Florenes VA, Maelandsmo GM,
Meltzer PS, Fodstad O and Myklebost O: Mapping of amplification
units in the q13–14 region of chromosome 12 in human sarcomas: some
amplica do not include MDM2. Cell Growth Differ. 4:1065–1070.
1993.PubMed/NCBI
|
|
26
|
Prigent C and Dimitrov S: Phosphorylation
of serine 10 in histone H3, what for? J Cell Sci. 116:3677–3685.
2003. View Article : Google Scholar : PubMed/NCBI
|
|
27
|
Gu Y, Rosenblatt J and Morgan DO: Cell
cycle regulation of CDK2 activity by phosphorylation of Thr160 and
Tyr15. EMBO J. 11:3995–4005. 1992.PubMed/NCBI
|
|
28
|
Loughery J, Cox M, Smith LM and Meek DW:
Critical role for p53-serine 15 phosphorylation in stimulating
transactivation at p53-responsive promoters. Nucleic Acids Res.
42:7666–7680. 2014. View Article : Google Scholar : PubMed/NCBI
|
|
29
|
Soussi T and Béroud C: Significance of
TP53 mutations in human cancer: A critical analysis of mutations at
CpG dinucleotides. Hum Mutat. 21:192–200. 2003. View Article : Google Scholar : PubMed/NCBI
|
|
30
|
Burlacu A: Regulation of apoptosis by
Bcl-2 family proteins. J Cell Mol Med. 7:249–257. 2003. View Article : Google Scholar : PubMed/NCBI
|
|
31
|
Hyman JM, Firestone AJ, Heine VM, Zhao Y,
Ocasio CA, Han K, Sun M, Rack PG, Sinha S, Wu JJ, et al:
Small-molecule inhibitors reveal multiple strategies for Hedgehog
pathway blockade. Proc Natl Acad Sci USA. 106:14132–14137. 2009.
View Article : Google Scholar : PubMed/NCBI
|
|
32
|
Ragazzini P, Gamberi G, Pazzaglia L, Serra
M, Magagnoli G, Ponticelli F, Ferrari C, Ghinelli C, Alberghini M,
Bertoni F, et al: Amplification of CDK4, MDM2, SAS and GLI genes in
leiomyosarcoma, alveolar and embryonal rhabdomyosarcoma. Histol
Histopathol. 19:401–411. 2004.PubMed/NCBI
|
|
33
|
Graab U, Hahn H and Fulda S:
Identification of a novel synthetic lethality of combined
inhibition of hedgehog and PI3K signaling in rhabdomyosarcoma.
Oncotarget. 6:8722–8735. 2015. View Article : Google Scholar : PubMed/NCBI
|
|
34
|
Raju GP: Arsenic: A potentially useful
poison for Hedgehog-driven cancers. J Clin Invest. 121:14–16. 2011.
View Article : Google Scholar :
|
|
35
|
Kim J, Aftab BT, Tang JY, Kim D, Lee AH,
Rezaee M, Kim J, Chen B, King EM, Borodovsky A, et al: Itraconazole
and arsenic trioxide inhibit Hedgehog pathway activation and tumor
growth associated with acquired resistance to smoothened
antagonists. Cancer Cell. 23:23–34. 2013. View Article : Google Scholar : PubMed/NCBI
|
|
36
|
Au WY, Tam S, Fong BM and Kwong YL:
Determinants of cerebrospinal fluid arsenic concentration in
patients with acute promyelocytic leukemia on oral arsenic trioxide
therapy. Blood. 112:3587–3590. 2008. View Article : Google Scholar : PubMed/NCBI
|
|
37
|
Liu Q, Hilsenbeck S and Gazitt Y: Arsenic
trioxide-induced apoptosis in myeloma cells: p53-dependent G1 or
G2/M cell cycle arrest, activation of caspase-8 or caspase-9, and
synergy with APO2/TRAIL. Blood. 101:4078–4087. 2003. View Article : Google Scholar : PubMed/NCBI
|
|
38
|
Lunghi P, Tabilio A, Lo-Coco F, Pelicci PG
and Bonati A: Arsenic trioxide (ATO) and MEK1 inhibition synergize
to induce apoptosis in acute promyelocytic leukemia cells.
Leukemia. 19:234–244. 2005. View Article : Google Scholar
|
|
39
|
Downward J: How BAD phosphorylation is
good for survival. Nat Cell Biol. 1:E33–E35. 1999. View Article : Google Scholar : PubMed/NCBI
|
|
40
|
Zha J, Harada H, Yang E, Jockel J and
Korsmeyer SJ: Serine phosphorylation of death agonist BAD in
response to survival factor results in binding to 14-3-3 not
BCL-X(L). Cell. 87:619–628. 1996. View Article : Google Scholar : PubMed/NCBI
|
|
41
|
Han YH, Kim SZ, Kim SH and Park WH:
Arsenic trioxide inhibits the growth of Calu-6 cells via inducing a
G2 arrest of the cell cycle and apoptosis accompanied with the
depletion of GSH. Cancer Lett. 270:40–55. 2008. View Article : Google Scholar : PubMed/NCBI
|
|
42
|
Jiang L, Wang L, Chen L, Cai GH, Ren QY,
Chen JZ, Shi HJ and Xie YH: As2O3 induces
apoptosis in human hepatocellular carcinoma HepG2 cells through a
ROS-mediated mitochondrial pathway and activation of caspases. Int
J Clin Exp Med. 8:2190–2196. 2015.
|
|
43
|
Lu TH, Su CC, Chen YW, Yang CY, Wu CC,
Hung DZ, Chen CH, Cheng PW, Liu SH and Huang CF: Arsenic induces
pancreatic β-cell apoptosis via the oxidative stress-regulated
mitochondria-dependent and endoplasmic reticulum stress-triggered
signaling pathways. Toxicol Lett. 201:15–26. 2011. View Article : Google Scholar
|
|
44
|
Wu X, Shi J, Wu Y, Tao Y, Hou J, Meng X,
Hu X, Han Y, Jiang W, Tang S, et al: Arsenic trioxide-mediated
growth inhibition of myeloma cells is associated with an extrinsic
or intrinsic signaling pathway through activation of TRAIL or TRAIL
receptor 2. Cancer Biol Ther. 10:1201–1214. 2010. View Article : Google Scholar : PubMed/NCBI
|