Introduction
Nuclear factor of activated T cells (NFAT) c1 is an
NFAT family member. NFATs are unique signal transcription factors
in vertebrates and play pivotal roles in a variety of cellular
functions. NFATs induce various important cellular biological
processes, including the generation and activation of lymphocytes
and differentiation of myocardial cells (1,2). The
classical pathway involved in the functional activity of NFAT was
first described in the lymphocytes. Activated NFAT is released from
the endoplasmic reticulum system into the cytoplasm in a pattern
similar to the flow of Ca2+ through membrane
Ca2+ channels activated by an extracellular stimulus.
Subsequently, NFAT in the cytoplasm is highly phosphorylated. When
the cell releases the Ca2+ flow, triggered by a
stimulus, NFAT is dephosphorylated by calcineurin and translocates
into the nucleus, promoting gene transcription through synergistic
effects with other factors and activators. NFAT interacts with its
DNA targets in various forms. It can bind to DNA in the form of
single or heteromorphic spliceosomes, and the binding site strongly
attracts other transcription factors (3). An ideal example is that activator
protein (AP-1) (including Fos-Jun) binds to NFAT and DNA to form a
complex, generating a necessary initial transcription element for
the activation of T cells (4,5).
Moreover, NFATs are involved in cellular activities and
differentiation processes in combination with other transcription
factors, such as the zinc-finger transcription factor GATA-4, early
growth response gene (EGR), myocyte enhancer factor-2 (MEF2), and
forkhead box P3 (Foxp3), which plays an extremely important role in
malignant tumors (6).
The initial research on NFATs involved exploration
of their function in T cells. As an activatable nuclear factor,
NFAT binds to the interleukin (IL)-2 promoter during the activation
process of T cells (7). NFAT is
also an important contributor in immunotherapy. Cyclosporine A can
specifically down-regulate the classic NFAT signaling pathway and
has therefore been widely used to prevent the rejection of
transplanted organs in clinical settings. Two decades of research
has gradually revealed that NFAT transcription factors are
expressed not only in the lymphocytes but also in the cells of
other types of tissue, including epithelial cells. This response
explains the novel finding in a number of recent key studies that
NFATs have a very important function: they are closely associated
with the occurrence and progression of malignant tumors. Each
subtype of NFAT has a distinct function. The tumorigenic activity
of NFATc1 has been confirmed (8).
Previous studies found that the transformed phenotypes of
NFATc1-induced fibroblast NIH 3T3 cells are readily evident,
indicating that NFATc1 can sufficiently induce NIH 3T3 cells to
produce definitive transformation markers and thus verifying that
NFATc1 is a potential oncogene (9). As mentioned above, calcineurin is a
major regulator of NFATc1, and calcineurin activity is a necessary
basis for malignant tumor progression, suggesting a close
relationship between NFATc1 and tumorigenesis (10). In addition, studies have
demonstrated that NFATc1 expression is associated with other types
of malignant tumors; e.g., NFATc1 is a necessary key factor
involved in the occurrence and progression of colon and pancreatic
carcinomas (11,12).
Tumor angiogenesis is a key factor deciding the
occurrence and progression of solid human tumors. It can cause
proliferation of tumor cells and accelerate malignant behavior such
as tumor invasion, migration, and dissemination (13,14).
In addition, studies in recent years have shown that
lymphangiogenesis plays a similar role to angiogenesis in the
occurrence and progression of malignant epithelial tumors and that
it even occurs prior to angiogenesis in these tumors at a very
early stage. Therefore, exploration of angiogenesis and
lymphangiogenesis in malignant tumors is of great significance for
clarifying the mechanisms underlying disease occurrence and
progression and for identifying effective treatment target genes.
NFATc1 is a key factor involved in cardiovascular development
during embryo formation (15,16).
After birth, it can still regulate the growth, differentiation, and
life cycle of endothelial cells. An increasing amount of data have
demonstrated that NFATc1 regulates vasculogenic responses (17,18).
A study using vascular endothelial growth factor (VEGF) to induce
angiogenesis revealed that NFATc1 is a key component distributed at
the merge point of the VEGF-induced vasculogenic endothelial cell
escape pathway. NFATc1 is pivotal in the induction process of the
majority of genes by VEGF/IL-1. Within the upstream portion of the
NFATc1 signaling pathway, VEGF-A not only is a key factor in tumor
angiogenesis but also facilitates tumor lymphangiogenesis (19). In addition, combined with EGR-1,
NFATc1 can activate the tissue factor (TF, transcription of tissue
factor) gene (20). The TF gene is
an initiator of blood coagulation and angiogenesis. At the site of
TF initiation, NFATc1 binds tightly to NF-κB at the overlap point,
indicating that the complete transcription reaction of VEGF-A for
TF or other potential genes requires the involvement of NFATc1.
NFAHc1 also plays an important role in lymphangiogenesis. Its
expression has been detected in developing and mature lymphatic
vessels. Suppressing NFAHc1 activity by controlling the expression
of podoplanin and vascular endothelial growth factor receptor-3
(VEGFR-3) in lymphatic endothelial cells leads to a reduction of
VEGF-A-induced lymphangiogenesis in lung injury (21). Previous studies have shown that
NFATc1 can act as a downstream signaling molecule of VEGF-C to
interact with pro-lymphangiogenesis factors such as Prox1,
podoplanin, Foxc2 and VEGFR-3, thus affecting lymphangiogenesis,
particular in terms of spatial construction and channel shaping
(22). All of the above studies
demonstrated the important role and functions of NFATc1 in
angiogenesis and lymphangiogenesis. However, studies on the role of
NFATc1 in tumor vascular generation are scarce and have mainly
focused on its upstream gene VEGF. To the best of our knowledge, no
related studies on epithelial ovarian carcinoma have been reported.
Thus, in this study we explored the effect of NFATc1 on
angiogenesis and lymphangiogenesis in epithelial ovarian carcinoma
in vivo and in vitro as well as the relationships of
NFATc1 with ELR+ CXC chemokine IL-8, fibroblast growth factor-2
(FGF-2), and platelet-derived growth factor BB (PDGF BB) (these
three factors independently play important roles in tumor
angiogenesis and lymphangiogenesis). This study aimed to provide a
further explanation of the effect of NFATc1 on the malignant
behavior of epithelial ovarian carcinomas and to reveal the
molecular mechanisms underlying NFATc1 signal transduction and the
occurrence and progression of epithelial ovarian carcinoma, to gain
additional knowledge to provide a theoretical basis for further
research on tumor angiogenesis and lymphangiogenesis.
Materials and methods
The SKOV3 ovarian cancer cell line was from
Molecular Medicine and Cancer Center, Chongqing Medical University,
and the 4- to 8-week-old BALB/c athymic female nude mice from the
Animal Experimental Center, Chongqing Medical University.
The SKOV3 ovarian cancer cell line was studied in
the following groups: blank group; negative control group; small
interfering RNA (siRNA)1, siRNA-880; siRNA2, siRNA-1169; siRNA3,
siRNA-1307.
The 18 BALB/c athymic female nude mice, 4- to
8-week-old, were devided into 3 groups: blank group, mice were
given injections of SKOV3 cells without any interference. Negative
control group, mice were given injections of SKOV3 cells that
expressed other unrelated DNA oligos. siRNA group, mice were given
injections of SKOV3 cells that expressed NFATc1 siRNA with the
highest transfection efficiency.
NFATc1 rabbit polyclonal antibody (ab25916); CK
(BM0030); CD34 (SC-9095); IL-8 rabbit polyclonal antibody
(CSB-PA08327A0Rb); FGF-2 monoclonal antibodies (sc-365106); PDGF BB
rabbit polyclonal antibody (sc-7878) were used.
Cell culture and NFATc1 siRNA
The SKOV3 ovarian cancer cells were maintained in
media containing 10% fetal bovine serum, 2 mmol/l L-glutamine,
penicillin (100 U/ml), and streptomycin (100 μg/ml). Three DNA
oligos (siRNA-880 antisense, 5′-UUCCGGCACAGUCAAUGACGGCUCG-3′ and
sense, 5′-CGAGCCGUCAUUGACUGUGCCGGAA-3′; siRNA-1169 antisense,
5′-AGAGAAUUCGGCUUGCACAGGUCCC-3′ and sense,
5′-GGGACCUGUGCAAGCCGAAUUCUCU-3′; and siRNA-1307 antisense,
5′-AGACGUAGAAA CUGACGU GAACGGG-3′ and sense, 5′-CCCGUUCACGUCAGUUU
CUACGUCU-3′) were designed as green fluorescent siRNA against
NFATc1 mRNA to target the open reading frame of NFATc1 cDNA. These
DNA oligos were contained in Lipofectamine™ 2000 and were used to
infect SKOV3 cells; the highest transfection efficiency oligo was
selected by RT-PCR to use for interference.
Tumor formation in nude mice
To evaluate the ability of cells to form tumors, 4-
to 8-week-old BALB/c athymic female nude mice were given bilateral
injections of SKOV3 tumor cells, with a total of 18 mice used. All
mouse experiments were performed in accordance with institutional
guidelines approved by the Institutional Animal Care and Use
Committee. Each subcutaneous injection consisted of
5×10⁶ SKOV3 cells (0.2 ml). Control mice were injected
with SKOV3 cells that expressed NFATc1 siRNA. The mice were kept in
a specific pathogen-free environment and were checked every 2 days
for 30 days. After 30 days, the mice were sacrificed by exposure to
5% carbon monoxide. The tumor inhibition rate was calculated with
the use of the tumor weight: tumor inhibition rate (%) = (control
weight-experimental weight)/control weight ×100%. The tumor volume
was calculated with the use of the following formula: tumor volume
(in mm3) = 1–2× LW2 (L, length; W, weight).
All tumors for each group were excised, fixed in 10% formalin
overnight, and subjected to routine histologic examination and
immunostaining of NFATc1/CK/CD34 by investigators who were blinded
to the tumor status. The assay was repeated twice. RT-PCR, and
western blot analysis were performed to observe IL-8/FGF-2/PDGF BB
gene and protein expression.
Immunohistochemical (IHC) staining and
analysis
IHC staining for NFATc1 and cytokeratin were
performed using avidin-biotin-peroxidase methods. Briefly, tissue
slides were deparaffinized in xylene and rehydrated in a graded
series of ethanol, and the sections were subjected to antigen
retrieval by boiling in 0.01 mol/l sodium citrate buffer (pH 6.0)
in a microwave oven for 10 min. After blocking endogenous
peroxidase activity with 0.3% hydrogen peroxide and blocking
nonspecific protein binding with 1.5% normal goat serum, the
sections were incubated overnight with an antibody at 4°C in a
humidified chamber. Then, the sections were incubated with
biotinylated goat anti-mouse IgG for 30 min and detected with the
LSAB system (Dako). Sections were lightly counterstained with
hematoxylin. The primary antibody was replaced with 1X PBS as a
negative control. Entire tissue sections were evaluated by HScore
values, which are objective measurements of staining intensity, and
the percentage of tumor cells that stained positive. Five fields of
each slice were randomly selected with a magnification of ×400, and
the numbers of positive cells were counted per 100 cells/field.
Staining intensity was scored as negative (<5% of positive tumor
cells), 1+ (mild intensity), 2+ (moderate
intensity), or 3+ (intensity greater than that of the
positive control). The sections were evaluated by two pathologists
with a double-blind method to determine the immunohistochemistry
results. The formula was HScore = 3pi (i + 1), where i indicates
the intensity of staining, Pi is the percentage of cells with
positive staining/the total number of tested cells, and 1 is the
correction factor.
The blood vascular endothelium and lymphatic
vascular endothelium were labeled using CD34 and podoplanin as
markers, respectively, and then observed microscopically to
determine the numbers of positively stained endothelial cells in
the blood and lymphatic vessels and the morphology of microvessels
and microlymphatic vessels under an optical microscope. Counting of
vessels was conducted according to the following procedures: first,
the areas with a high density of stained cells in each section were
identified under a low magnification (x40). Next, under a high
magnification (×200 or ×400), the positively stained lymphatic
vessels were identified and counted. The density of microlymphatic
vessels in each section was obtained by dividing the mean number of
microlymphatic vessels in five high-magnification view fields (×200
or ×400) by the field area. Each section was read by two
pathologists using a double-blind method. The number of blood
microvessels was counted following procedures similar to those
described above.
RNA isolation and reverse transcriptase
polymerase chain reaction
RNA was isolated from SKOV3 cells (treated by siRNA
and control) using RNeasy mini kits (Qiagen, Santa Clarita, CA,
USA) according to the manufacturer's instructions. The RNA was
eluted with water, stored at −70°C and evaluated by agarose
electrophoresis. For complementary DNA (cDNA) synthesis, ~1 μg of
total RNA was transcribed with cDNA transcription reagents (PE
Biosystems, Foster City, CA, USA) using random hexamers, according
to the following conditions: 30°C for 10 min; 50°C for 20 min; 99°C
for 5 min; and 5°C for 5 min.
The PCR conditions were as follows: β-actin, 95°C, 5
min, 1 cycle; 95 and 59.5°C, 30 sec, 30 cycle; 72°C, 30 sec; 72°C,
10 min, 1 cycle. NFATc1 gene, 95°C, 5 min, 1 cycle; 95 and 56°C, 30
sec, 30 cycle; 72°C, 30 sec; 72°C, 10 min, 1 cycle. CXCR2 gene,
95°C, 5 min, 1 cycle; 95 and 57°C, 30 sec, 30 cycle; 72°C, 30 sec;
72°C, 10 min, 1 cycle. FGF-2 gene, 95°C, 5 min, 1 cycle; 95 and
58°C, 30 sec, 30 cycle; 72°C, 30 sec; 72°C, 10 min, 1 cycle. PDGF
BB gene, 95°C, 5 min, 1 cycle; 95 and 58°C, 30 sec, 30 cycle; 72°C,
30 sec; 72°C, 10 min, 1 cycle.
The PCR primer sequences were as follows: β-actin
[546 base pair (bp)], 5′-CTCGTCATACTCCTGCTTGCT-3′ and
5′-CGGGACCTGACTGACTACCTC-3′. NFATc1 (381 bp),
5′-CGATCCCGGGGTAGCAGCCT-3 and 5′-CACCGCCATA CTGGAGCCGC-3. IL-8 (222
bp), 5′-GCCCTGACAGCTCC CAAGCCT-3′ and 5′-ATGCGTCATGCCGCTTCCCAG-3′.
FGF-2 (298 bp), 5′-CAGTGAGTGCCGACCCGCTC-3′ and
5′-GCGGGAAGACAGCCAGTCCG-3′. PDGF BB (104 bp),
5′-CCCTGCTCCACAAAGGCGGG-3′ and 5′-CCTAGCCCG GTGCCTCGTCT-3′.
Polymerase chain reaction products were visualized
by ethidium bromide staining after 2% agarose gel electrophoresis.
Following PCR, 5 μl of the gene amplification product was subjected
to 1.5% agarose gel electrophoresis. The grayscale values of the
band sizes for NFATc1, IL-8, FGF-2, PDGF BB, and the internal
reference β-actin were analyzed using a Quantity One Gel Imaging
system. The optical density (OD) ratios of NFATc1/β-actin,
IL-8/β-actin, FGF-2/β-actin, and PDGF BB/β-actin were calculated
and compared among the intervention group, the negative control
group, and the blank control group.
Western blot analysis
Total protein extracts from SKOV3 cells and
transplanted tumor tissue were obtained using analysis buffer, and
equal amounts (30 μg/load) were analyzed by immunoblotting. The
antibody against β-actin was obtained from Sigma-Aldrich (A5441,
1:20,000). Antibodies against NFATc1 (ab25916, 1:1,000); against
IL-8 (CSB-PA08327A0Rb):1:800; FGF-2 (sc-365106):1:500; and PDGF BB
(sc-7878):1:800. The secondary antibodies were anti-rabbit
immunoglobulin horseradish peroxidase-linked F(ab)2 fragment from
donkey (Amersham Biosciences). Western blot reagents were from an
electrochemiluminescence kit (Amersham Biosciences).
Determination of protein concentrations: first, a
100 mg/ml bovine serum albumin (BSA) solution and a Coomassie
brilliant blue G250 solution were prepared, and the standard
protein sample was fully dissolved in the solution. Next, 10 μl of
the protein solution was diluted to 100 μl to reach a desired final
concentration of 0.5 mg/ml. Subsequently, 0, 1, 2, 4, 8, 12, 16 and
20 μl of the standard protein solution was added to the wells of a
96-well plate, and each well was brought to a final volume of 20 μl
by adding more of the solution used for dilution. Appropriate
amounts of the samples to be tested were then added to the sample
wells of the 96-well plate and brought to a final volume of 20 μl
with the same solution used for dilution. Finally, 200 μl of the
working solution for the bicinchoninic acid (BCA) assay was added
to all wells after being left to stand at 37°C for 30 min. OD
values at a wavelength of 562 nm (A562) (a wavelength range of
540–595 nm was considered acceptable) were detected. The protein
concentration was determined based on the standard curve.
Semi-quantitative analysis of the bands: the bands
obtained after electrophoresis were imaged using a ChemiDocXRS
chemiluminescence imaging system and analyzed using Quantity One
4.5.2 software. The areas and grayscale values of the bands were
semi-quantitated based on those of the first lane as a reference
and then compared.
Statistical analysis
Measurement data were expressed as the mean ±
standard deviation. Comparison of mean values among multiple
samples was conducted through analysis of variance (ANOVA), and
multiple comparisons among multiple samples were performed using
Student-Newman-Keuls (SNK)-q tests. All statistical analyses were
carried out with SPSS 16.0 software, and a P-value of <0.05
indicated that the difference was statistically significant.
Results
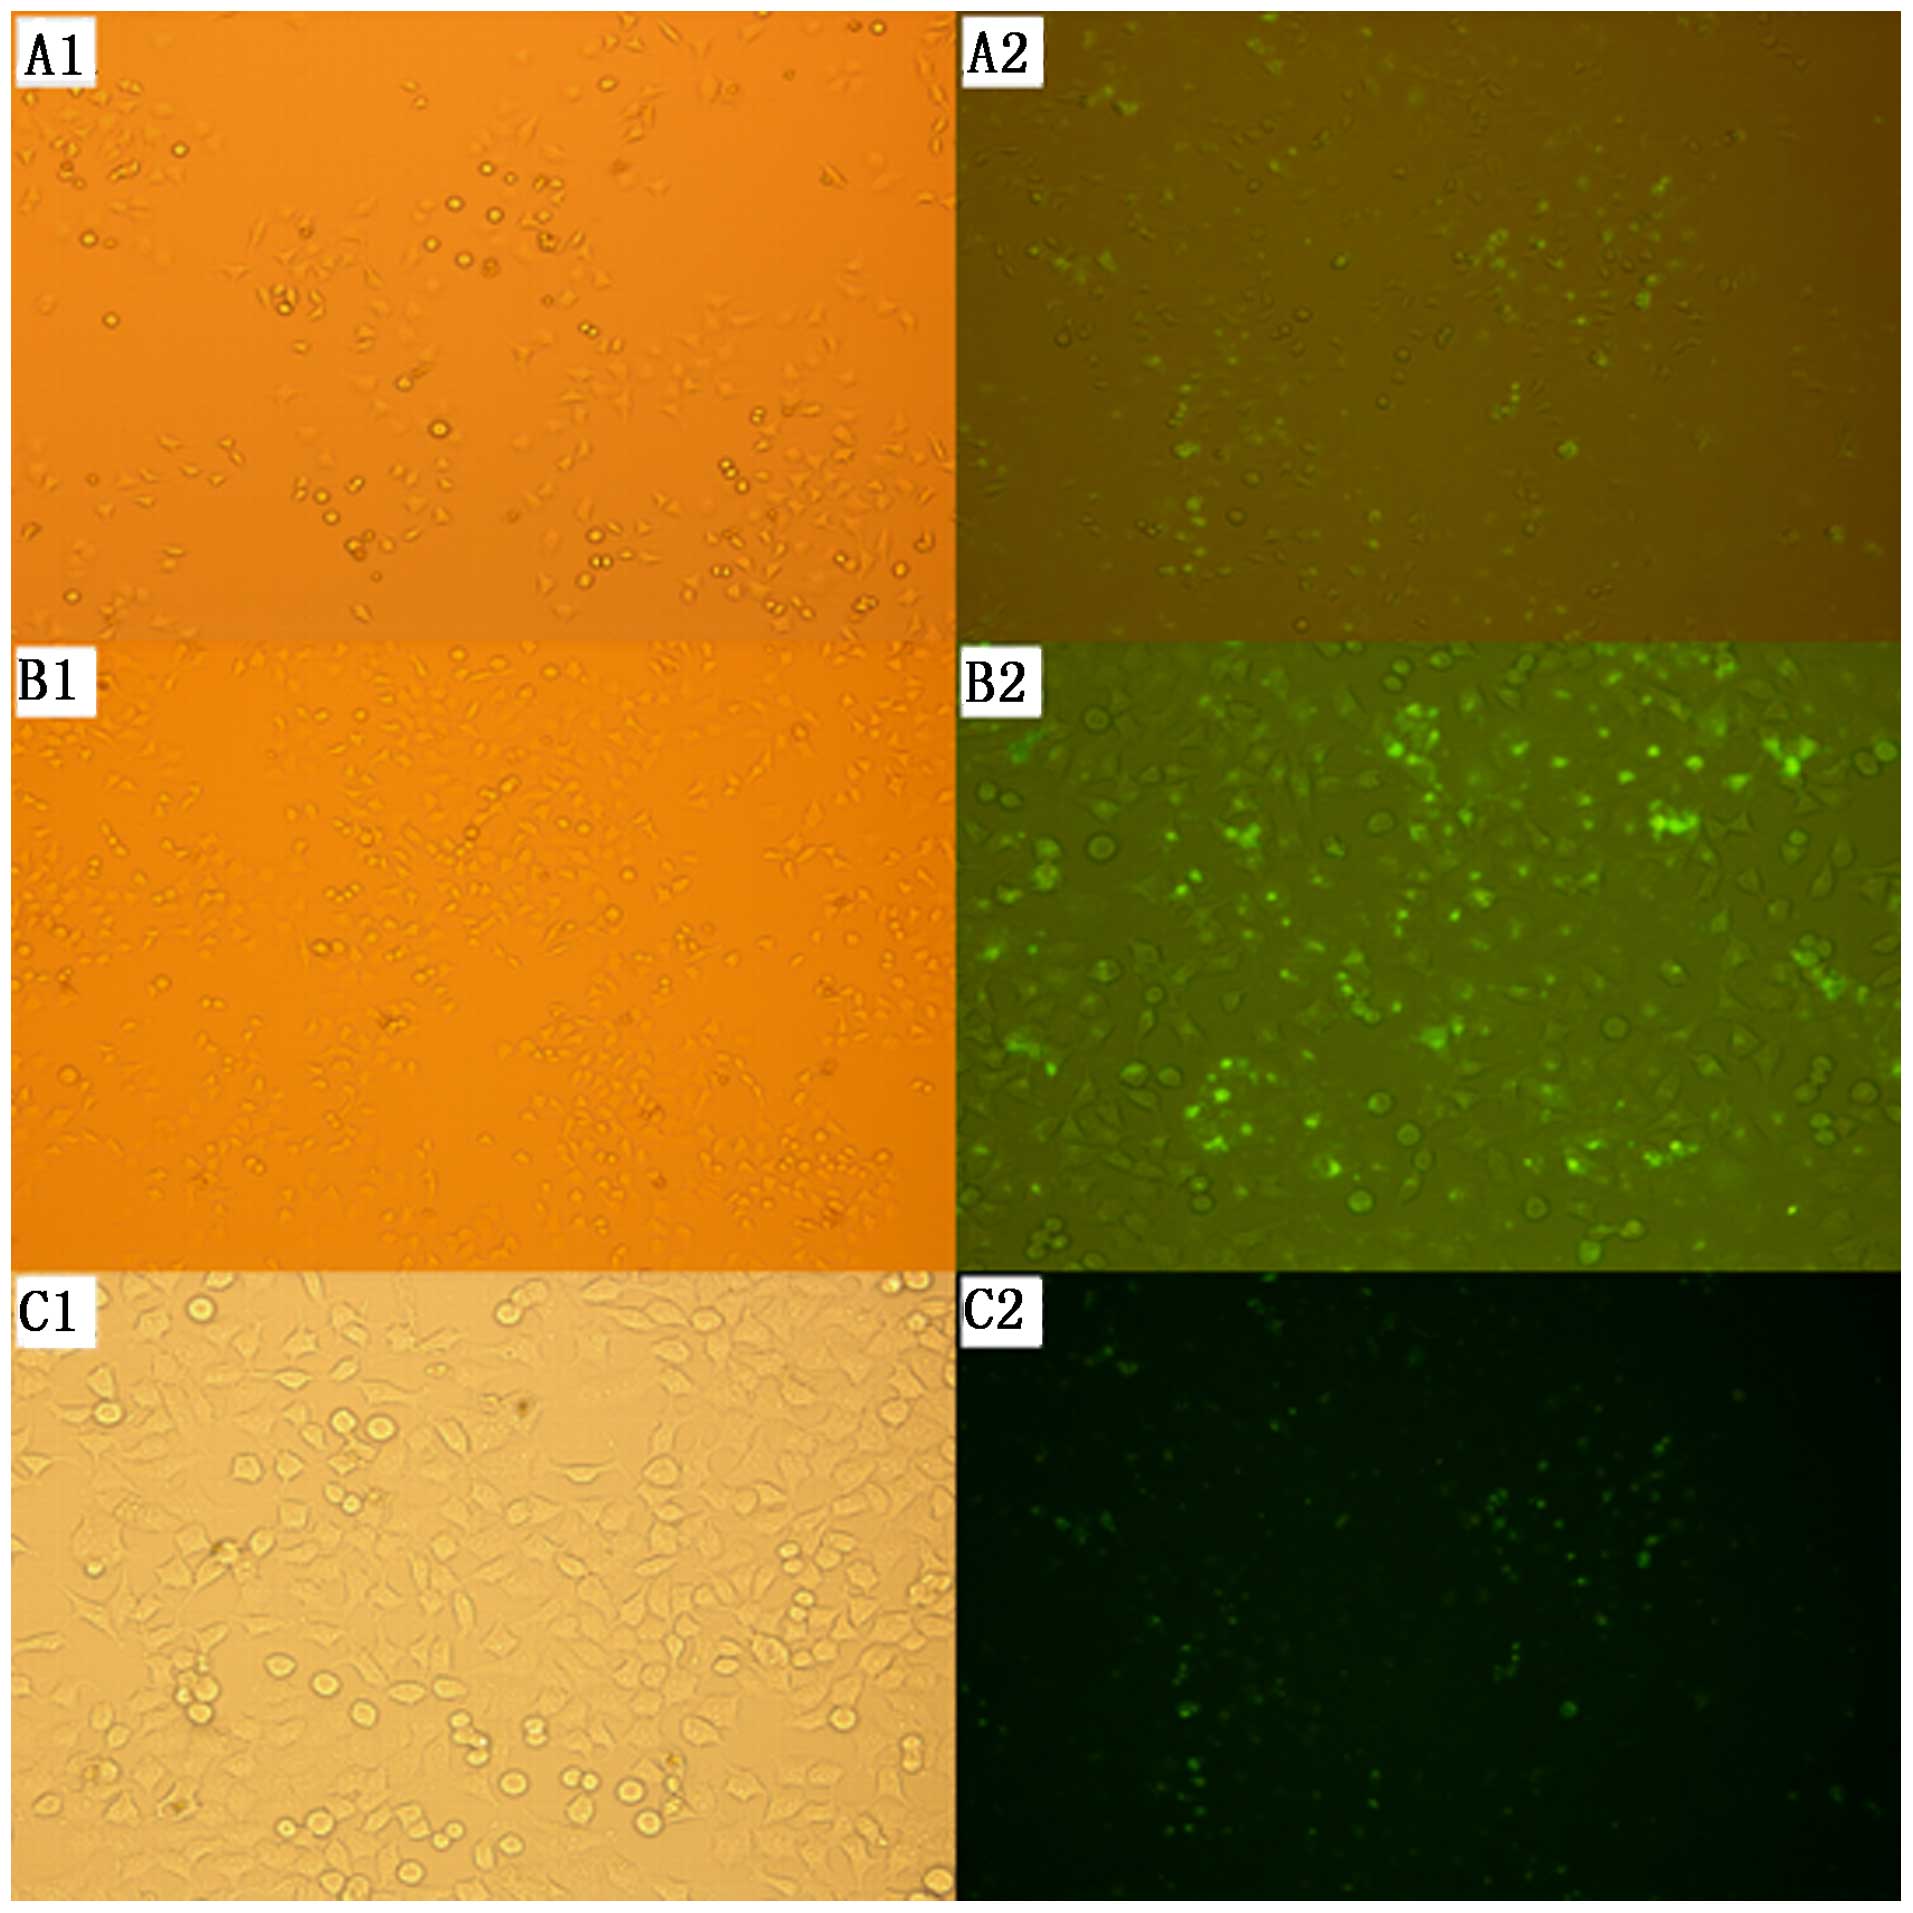
Transfection efficiency
The transfection efficiency of each group was
determined after 24 and 48 h of transfection using a fluorescence
microscope. Green fluorescent particles appeared in the SKOV3 cells
in all three groups, suggesting that siRNA had been successfully
transfected into the cells. The transfection rate at 48 h after
transfection was 59.1% for group A, 85.3% for group B, and 51.9%
for group C, which was higher than the rates at 24 h after
transfection in all groups. Group B showed the highest transfection
efficiency at 48 h post-transfection, presenting significant
differences compared with the other two groups (Fig. 1).
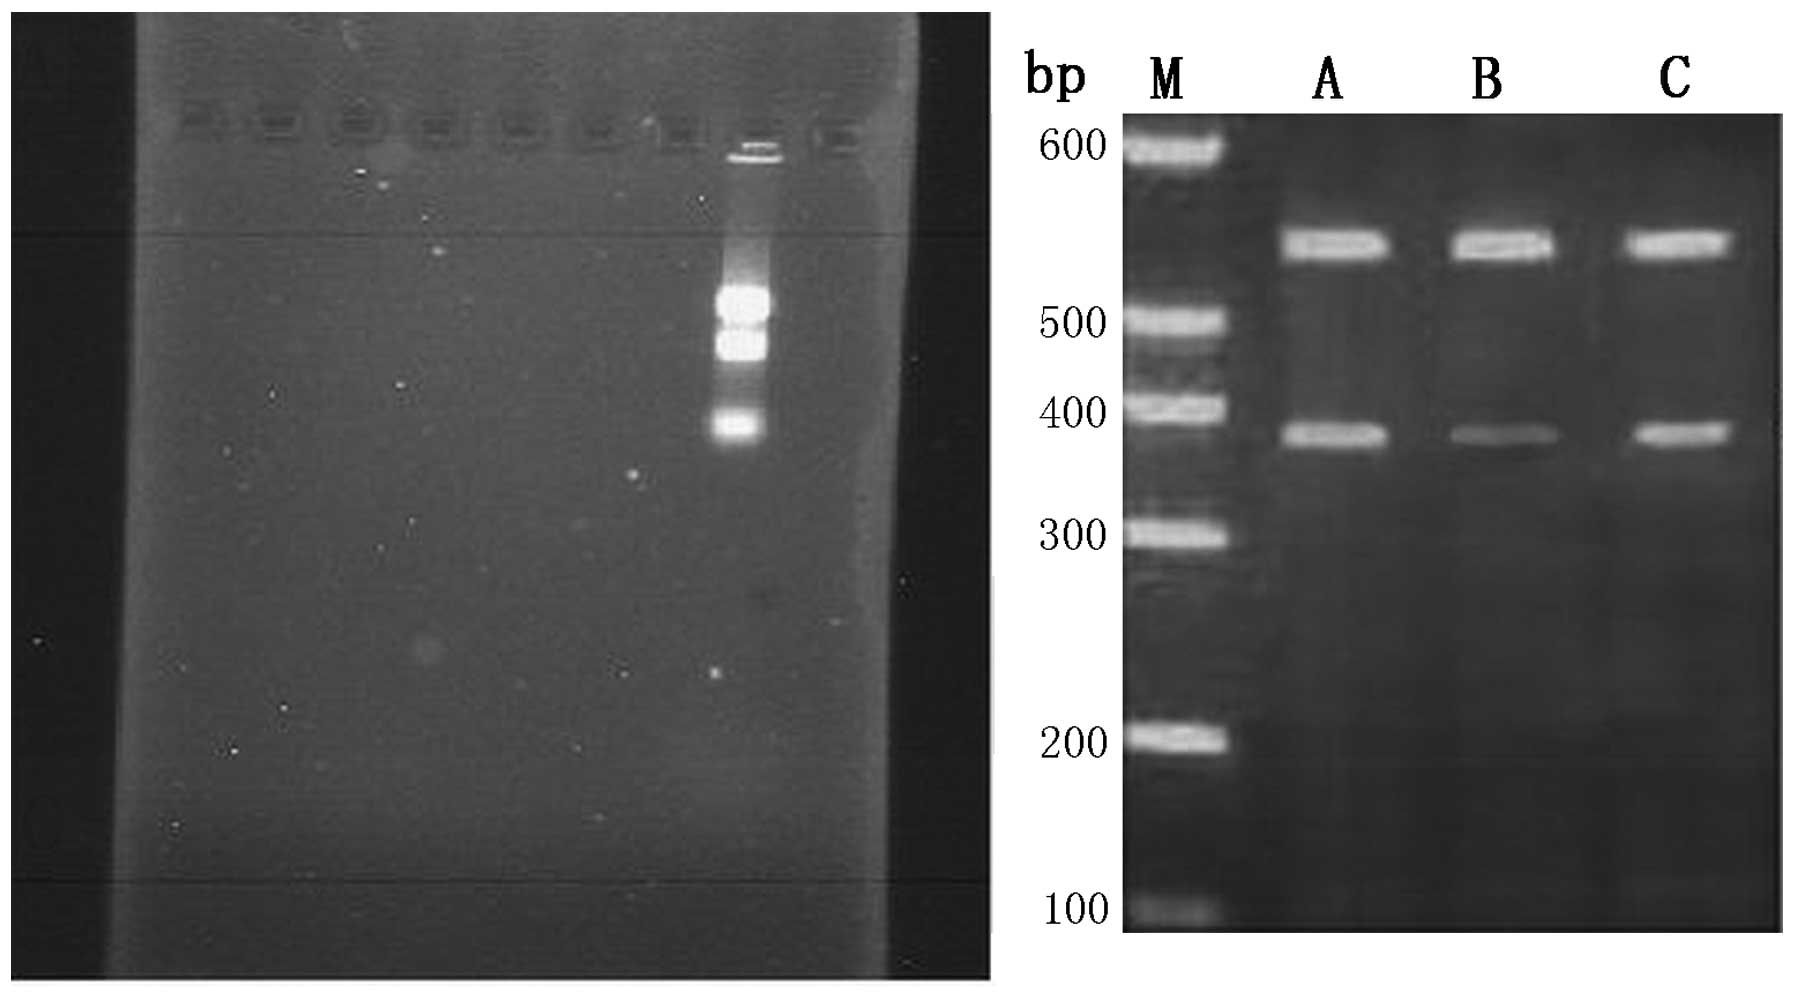
RT-PCR was used to determine the suppression level
of NFATc1 gene expression by siRNA in each group at 48 h
post-transfection. The results showed that the NFATc1 gene
expression levels in the cells of the three groups were
0.532±0.001, 0.278±0.001 and 0.498±0.003, respectively. Group B
presented the highest inhibition rate at 48 h post-transfection,
showing significant differences from the rates of the other two
groups (P<0.01), while no significant difference was observed
between group A and C (Fig. 2 and
Table I).
 | Table IStatistical analysis of NFATc1 mRNA in
each transfection group after treated with siRNA 48 h. |
Table I
Statistical analysis of NFATc1 mRNA in
each transfection group after treated with siRNA 48 h.
| Group | OD | P-value |
|---|
| siRNA1 | 0.532±0.001 | P1 |
| siRNA2 | 0.278±0.001 | P2 |
| siRNA3 | 0.498±0.003 | P3 |
Based on comparison of the results for the
transfection efficiency and inhibition rate among the three siRNA
sequences, siRNA-1169, which was used in group B and showed the
highest transfection efficiency, was chosen for subsequent
experiments. Three groups were set up in the subsequent
experiments: A, the blank group; B, the negative control group; and
C, the intervention group.
Suppression of NFATc1 activity results in
growth inhibition of xenografted tumors
To investigate whether NFATc1 downregulation is
associated with in vitro and in vivo tumor growth in
ovarian cancer cells, we investigated mouse xenograft tumor growth
after inoculation. The success rate of tumor xenografting in 18
nude mice reached 100%, with latent periods of ~6–8 days in the
blank control group and the negative control group and ~8–11 days
in the NFATc1 siRNA intervention group. The tumor grew expansively
at the xenografting site, and its volume gradually increased after
2–3 weeks. All of the tumor-bearing nude mice survived until the
end of experiments. Observations performed with the naked eye
revealed a smaller tumor size in the NFATc1 siRNA intervention
group compared with the other control groups. The mean weight,
volume, and inhibition rate of tumor growth in the three groups are
presented in the Table II. The
NFATc1 siRNA intervention group exhibited a growth inhibition rate
of 57.08% and a lower weight and volume than the two control
groups; these differences were significant (Table II).
| Table IIAnalysis of the transplanted tumor of
nude mouse (mean ± SD, n=18). |
Table II
Analysis of the transplanted tumor of
nude mouse (mean ± SD, n=18).
| Treatment | Weight (g) | Volume
(cm3) | Inhibitory rate
(%) |
|---|
| Blank control | 2.03±0.35 | 1.328±145 | 0 |
| Negative
control | 1.98±0.78 | 1.274±209 | 0 |
| siRNA | 0.87±0.32a | 0.512±087a | 57.08a |
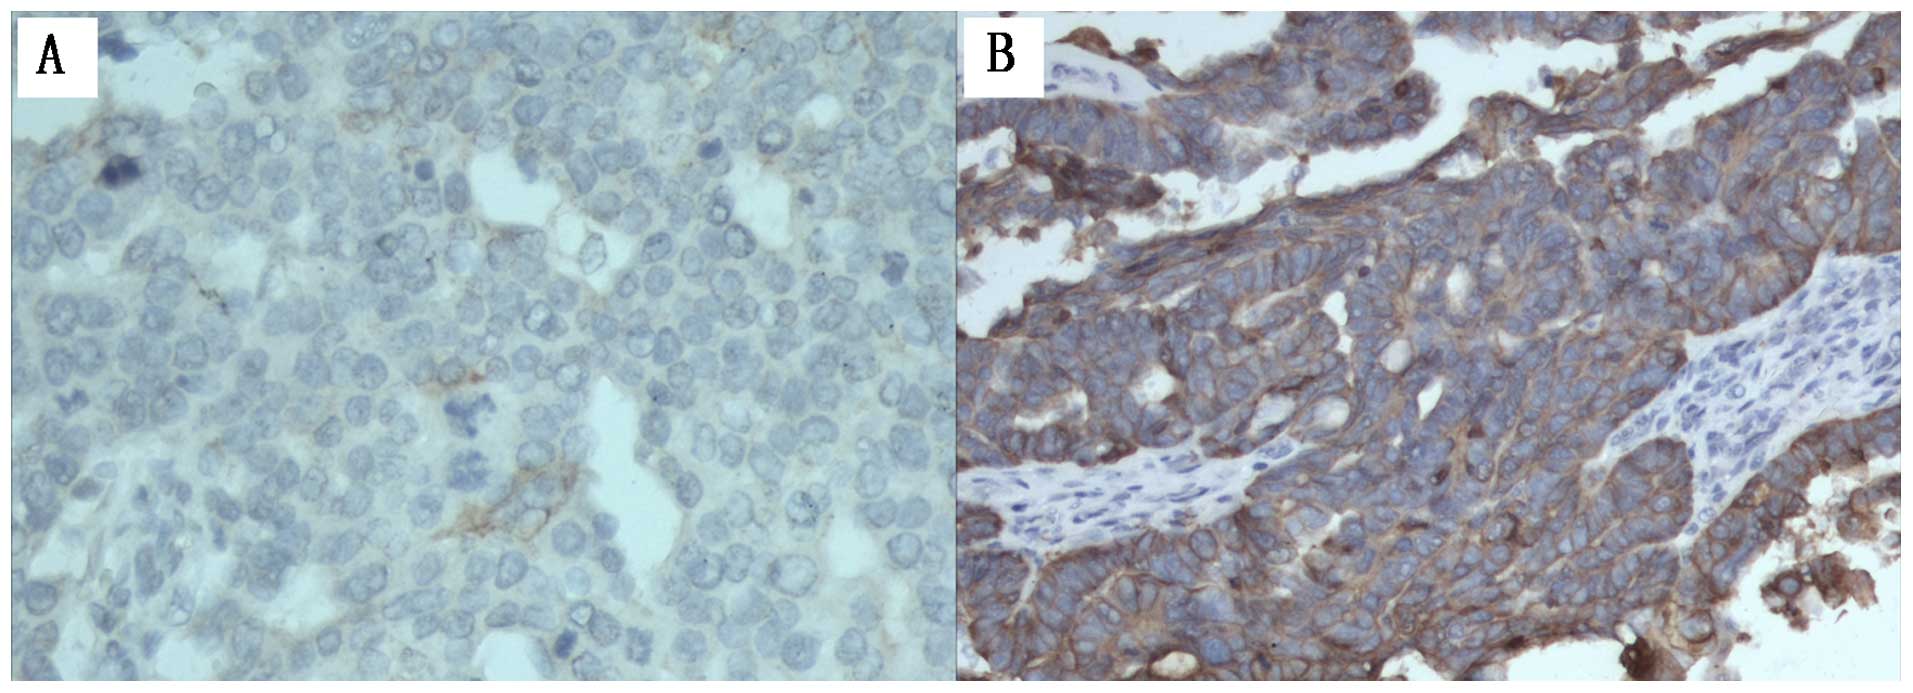
NFATc1 is highly expressed in the
xenograft tumor tissue
We examined NFATc1 expression in xenograft tumor
tissue by IHC staining. As shown in Fig. 3 and Table III, control group expressed high
levels of NFATc1 compared with siRNA group. Of the 30
samples/group. The mean NFATc1 HScore for control groups were 320
(range, 0–356), 336 (range, 0–356); the HScore of the siRNA samples
was 35 (range, 0–180). This finding was statistically significant
(P<0.05).
| Table IIIAnalysis of IHC, HScore, MVD and LMVD
in different groups (mean ± SD). |
Table III
Analysis of IHC, HScore, MVD and LMVD
in different groups (mean ± SD).
| Treatment | Positive rate | HScore | MVD | LMVD |
|---|
| Blank control | 100% | 320 (0–356) | 12.00±1.65 | 10.03±0.96 |
| Negative
control | 100% | 336 (0–356) | 11.47±0.32 | 9.95±1.12 |
| siRNA | 33.3%
(10/30)a | 35 (0–180)a | 5.36±0.34a | 4.67±0.26a |
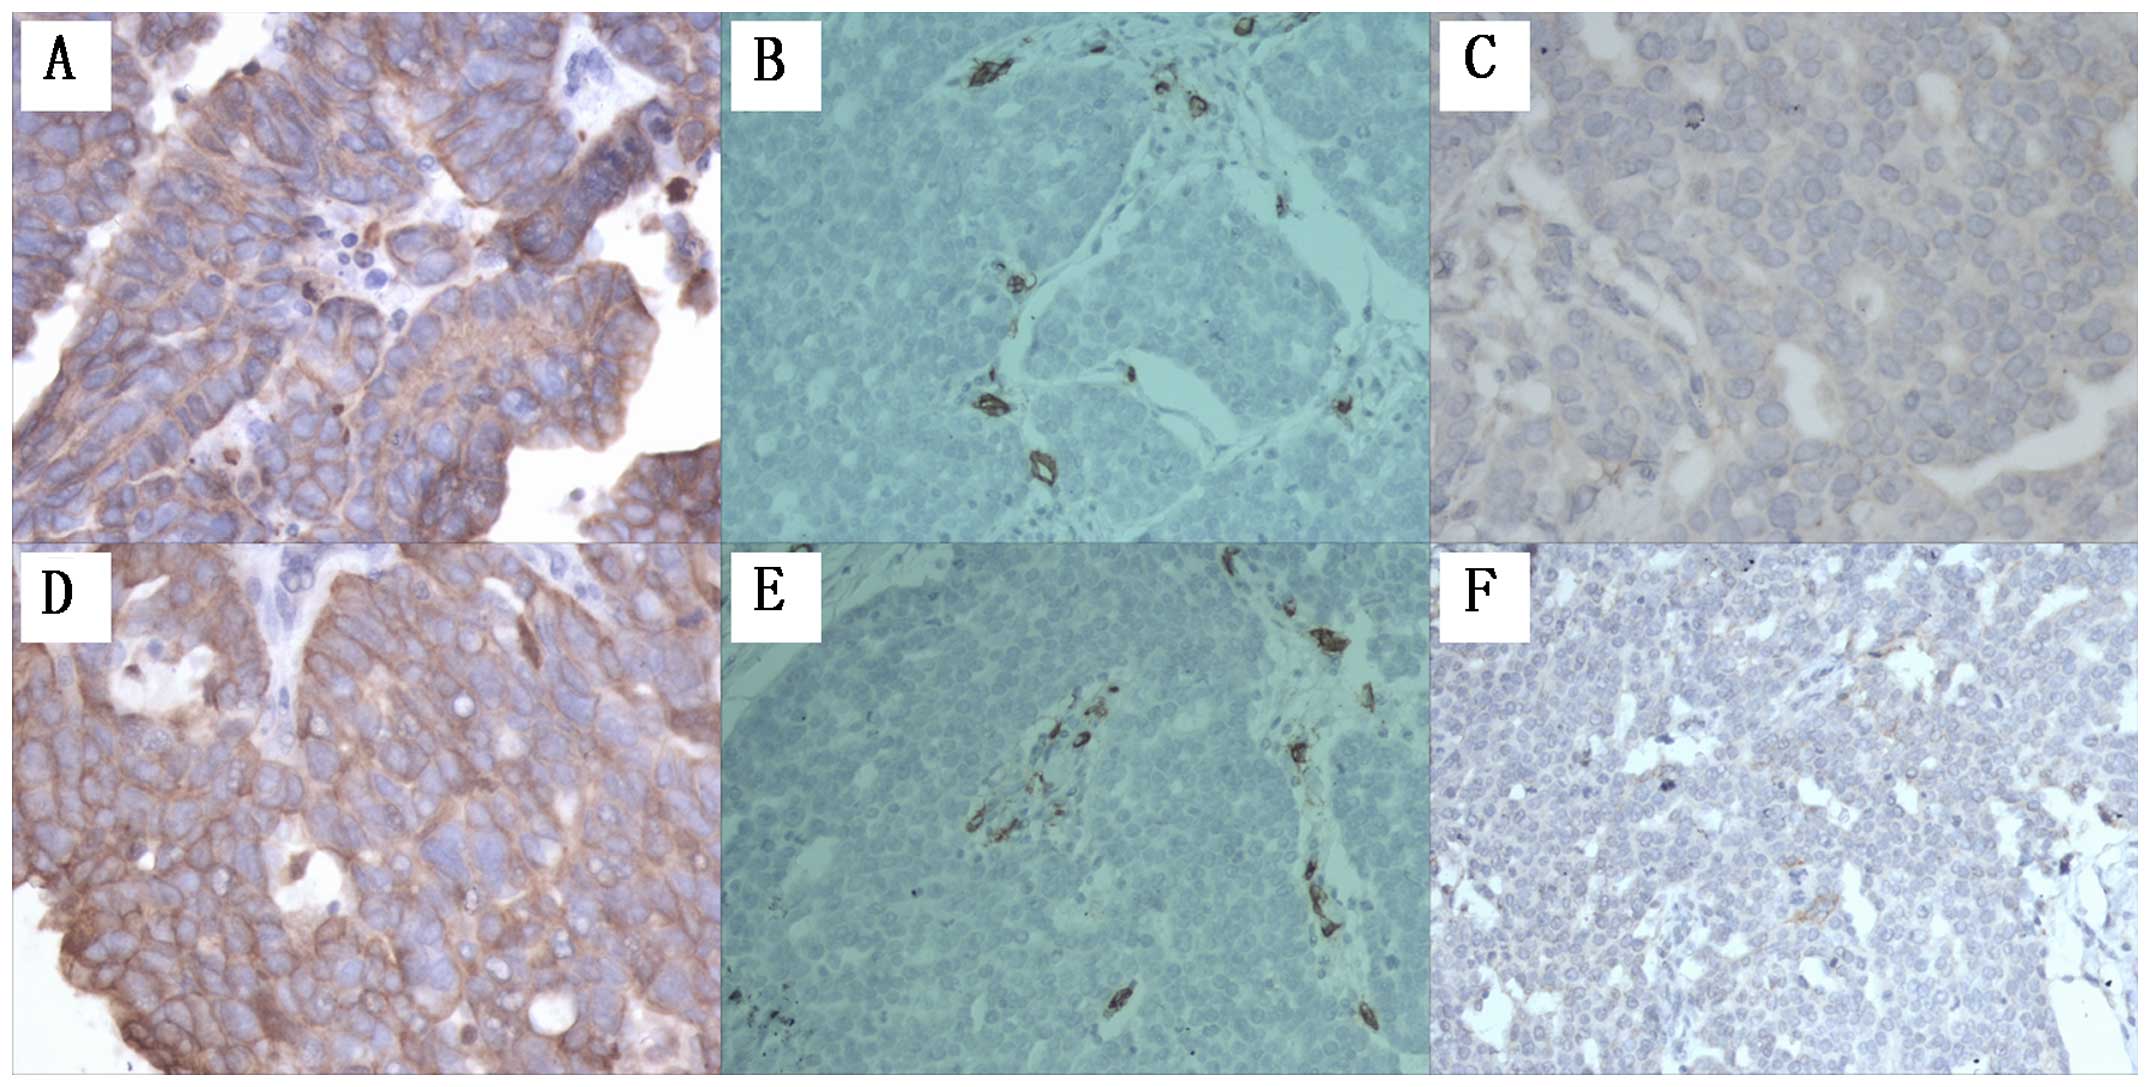
Suppressing NFATc1 activity leads to
inhibition of angiogenesis and lymphangiogenesis in epithelial
ovarian carcinoma tumor tissue in a xenograft nude mouse tumor
model
To confirm whether NFATc1 is associated with tumor
angiogenesis and lymphangiogenesis, we first examined the xenograft
mouse tumor tissues generated from animals injected with
SKOV3/NFATc1 siRNA-1169. The overall blood vessel density and lymph
vessels were decreased statistically in tissues expressing NFATc1
siRNA, as indicated by the reduced number of tissue microvessels
stained with CD34 and podoplanin (Fig.
4 and Table III). The
brown-yellowish-stained cytokeratin (CK) antigen appeared
specifically in the cytoplasm of epithelial cells in all tissue
sections of the xenografted tumors, confirming the epithelial
origin of the xenografted tumors. CD34 staining using an anti-CD34
antibody revealed the angiogenesis status in the tumor tissue of
each group: CD34 was specifically expressed in the cytoplasm of
endothelial cells in the capillaries of the xenografted tumors. The
labeled capillaries presented a brown-yellowish lumen, with either
the absence or presence of red blood cells in the lumen. The tumor
cells did not express CD34. After podoplanin staining, the
endothelial cells in the microlymphatic vessels appeared
brown-yellowish, and the microlymphatic vessels exhibited a
brown-yellowish-stained lumen. The lymphatic vessels had a thinner
wall and a larger lumen compared with the blood vessels, and the
lumen of the lymphatic vessels appeared collapsed with no red blood
cells. The closed or non-closed linear lumen formed by linking
individual brown-yellowish-stained endothelial cells or cell
clusters was an indicator used to determine the microvessel density
(MVD) and lymphatic microvessel density (LMVD) (Fig. 4). The results showed a markedly
higher MVD and LMVD in the control groups compared to the
intervention group, and these differences were significant
(Table III).
Suppression of NFATc1 activity results in
inhibition of IL-8, FGF-2 and PDGF BB mRNA expression in SKOV3
cells
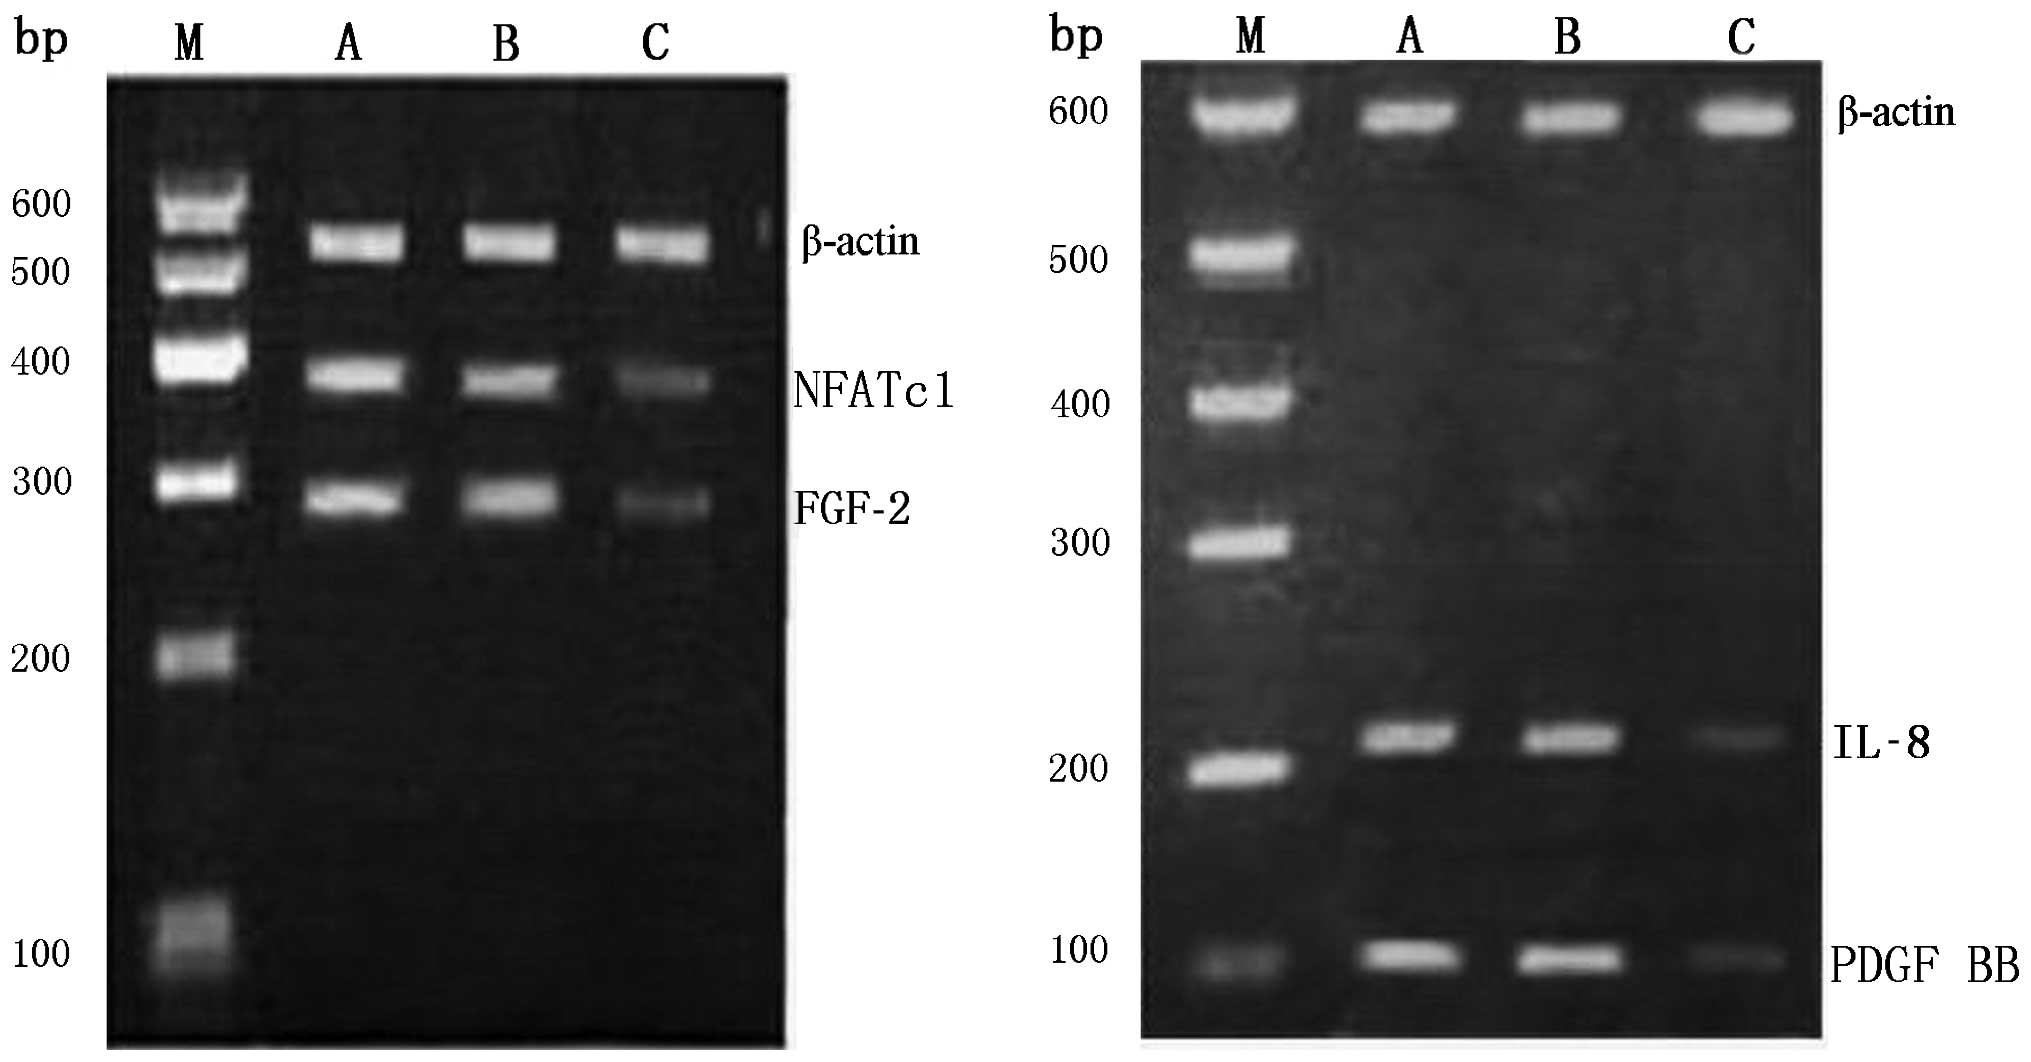
The expression of NFATc1/IL-8/FGF-2/PDGF BB
messenger RNA (mRNA) in control groups and siRNA group was assessed
by reverse transcriptase polymerase chain reaction. The final gel
electrophoresis pictures were analyzed with quantitative one image
analysis (Bio-Rad). The OD260/OD280 ratio of total RNA for all
samples was in the range of 1.8–2.0, indicating an acceptable
purity of the extracted total RNA. After agarose gel
electrophoresis of 5 μl of total RNA, three bands of 28S, 18S and
5.8S were clearly present, indicating that the RNA samples were not
degraded and could be used for subsequent RT-PCR assays. The
results of agarose gel electrophoresis demonstrated that the
intensities of the bands corresponding to the reference
intracellular β-actin gene fragments in each group were the same,
verifying that the amount of template used for RT-PCR was
consistent among the groups. The RT-PCR results, which revealed
significant differences in the band intensities of NFATc1, IL-8,
FGF-2 and PDGF BB genes among different groups. The intensities of
the amplification bands were higher in the blank group and the
negative control group and lower in the NFATc1 siRNA intervention
group. The grayscale values of NFATc1, IL-8, FGF-2, PDGF BB, and
the internal reference β-actin were obtained using the Quantity One
Gel Imaging system and employed to calculate the OD ratios.
Compared with the two control groups, the OD ratio in the
intervention group showed significant differences (P<0.05),
confirming that NFATc1 siRNA can markedly suppress the
transcription of the above four genes at the mRNA level (Fig. 5 and Table IV).
| Table IVStatistical analysis of NFATc1, IL-8,
FGF-2 and PDGF BB mRNA. |
Table IV
Statistical analysis of NFATc1, IL-8,
FGF-2 and PDGF BB mRNA.
| Group | NFATc1 | IL-8 | FGF-2 | PDGF BB | P-value |
|---|
| A | 0.912±0.001 | 0.908±0.003 | 0.895±0.005 | 0.913±0.005 | P1 |
| B | 0.896±0.001 | 0.872±0.005 | 0.893±0.001 | 0.873±0.001 | P2 |
| C | 0.265±0.003 | 0.325±0.001 | 0.296±0.001 | 0.218±0.003 | P3 |
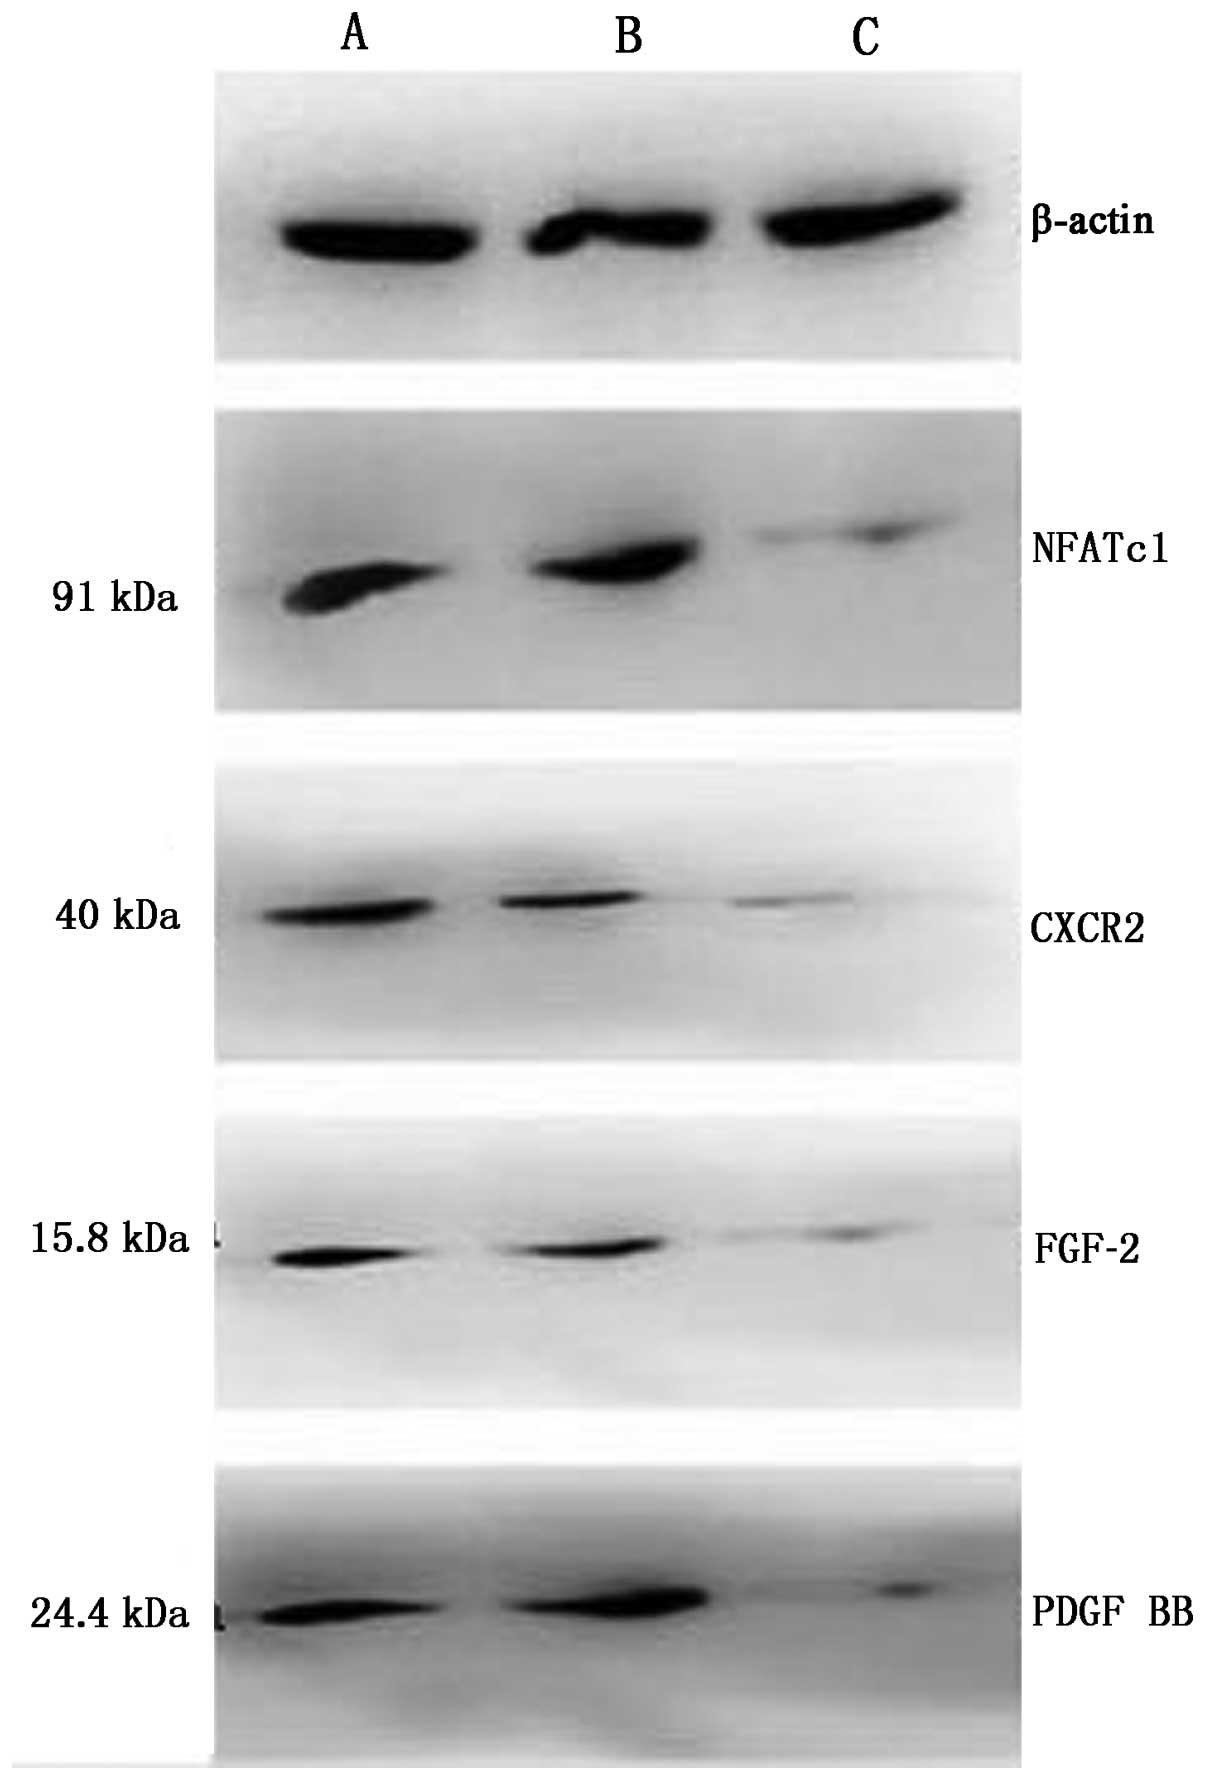
Regulation of NFATc1/IL-8/FGF-2/PDGF BB
protein by NFATc1 siRNA
The expression of NFATc1 (91 bp)/IL-8 (11 bp)/FGF-2
(15.8 bp)/PDGF BB (24.4 bp) proteins in control groups and siRNA
group was assessed by western blot analysis. The final protein
stripes size of β-actin (43 bp) was the same. The expression of
these proteins was higher in the control group compared to the
siRNA group (Fig. 6 and Table V), the expression level of
IL-8/FGF-2/PDGF BB decreased along with the expression of NFATc1,
suggesting that there was transcriptional activation of the
expression of these proteins in ovarian cancer cells, and NFATc1
siRNA inhibited the protein expression of IL-8/FGF-2/PDGF BB.
| Table VStatistical analysis of NFATc1, IL-8,
FGF-2 and PDGF BB protein. |
Table V
Statistical analysis of NFATc1, IL-8,
FGF-2 and PDGF BB protein.
| Group | NFATc1 | IL-8 | FGF-2 | PDGF BB | P-value |
|---|
| A | 0.907±0.001 | 0.923±0.001 | 0.865±0.005 | 0.931±0.003 | P1 |
| B | 0.827±0.005 | 0.926±0.003 | 0.907±0.001 | 0.893±0.005 | P2 |
| C | 0.295±0.003 | 0.376±0.005 | 0.396±0.001 | 0.318±0.003 | P3 |
Discussion
It has been reported that NFATc1 can induce the
proliferation of pulmonary arterial endothelia cells (23) and enhance the migration and
transition of human pulmonary arterial endothelia cells (24). NFATc1 is also a key factor involved
in the development of the central vessels during embryo formation.
Through synergistic effects with specific ligand cofactors [e.g.,
mitogen-activated protein kinase (MAPK)/extracellular
signal-regulated kinase (ERK) kinase I (MEK1)-ERK1/2 and c-Jun
N-terminal kinase (JNK)1/2], NFATc1 promotes regulation of the
development of embryonic vessels (25). The importance of the
VEGF/NFATc1/COX2 signaling pathway implies a pivotal role of NFATc1
in angiogenesis and lymphangiogenesis. However, studies on the
effect of NFATc1 in malignant tumors remain scarce, particularly in
relation to tumor angiogenesis. Therefore, study on the role of
NFATc1 in malignant tumor angiogenesis and the underlying
mechanisms is of great significance for the further exploration of
related molecular signaling pathways, tumor angiogenesis and
lymphangiogenesis and for the identification of effective target
genes for treatment.
After establishing a nude mouse model of human
ovarian carcinoma xenografts, xenografted tumor tissue was
collected and subjected to CD34 staining for microvessel labeling
and podoplanin staining for microlymphatic vessel labeling. IHC
technology was employed to detect vascular angiogenesis and
lymphangiogenesis before and after the NFATc1 siRNA intervention in
the xenografted tumor tissue. MVD and LMVD were 12.00±1.65 and
10.03±0.96, respectively, in the tumor tissue without NFATc1 siRNA
intervention, while these values were 5.36±0.34 and 4.67±0.26 in
the tumors subjected to the NFATc1 siRNA intervention. Inhibition
of NFATc1 expression significantly reduced vascular angiogenesis
and lymphangiogenesis in epithelial ovarian carcinomas, indicating
that NFATc1 can promote these two processes in epithelial ovarian
carcinomas and plays an important role in the angiogenesis of
epithelial ovarian carcinomas.
In subsequent experiments, the PCR results showed
that the expression levels of the NFATc1, IL-8, FGF-2 and PDGF BB
genes were 0.265±0.003, 0.325±0.001, 0.296±0.001 and 0.218±0.003,
respectively, in the intervention group, which was markedly lower
than the levels in the blank control group and the negative control
group (0.912±0.001, 0.908±0.003, 0.895±0.005 and 0.913±0.005;
0.896±0.001, 0.872±0.005, 0.893±0.001 and 0.873±0.001,
respectively), and significant inter-group differences were
observed. NFATc1 siRNA markedly suppressed the NFATc1 gene
expression level in SKOV3 cells, leading to an accompanying
reduction in IL-8, FGF-2, and PDGF BB expression. The western blot
results were consistent with the PCR results. NFATc1 siRNA caused a
notable decrease of the NFATc1 protein expression level in SKOV3
cells and an accompanying reduction of IL-8, FGF-2 and PDGF BB
protein expression. These differences were all significant. These
results suggested that NFATc1 siRNA can inhibit the gene and
protein expression of not only NFATc1 but also IL-8, FGF-2 and PDGF
BB in SKOV3 epithelial ovarian carcinoma cells.
IL-8, also known as C-X-C motif ligand 8 (CXCL8), is
a small soluble protein that belongs to the CXC chemokine family
(26). CXC chemokines can bind to
their receptors expressed in endothelial cells and exert extensive
effects on angiogenesis through several different mechanisms. The
CXC family is characterized by CXC chemokines that can be
distinguished based on the expression of a Glu-Leu-Arg (ELR)
sequence at the N2 terminus. ELR exerts potent physiological
effects on angiogenesis. In contrast to the ELR+ CXC
chemokines, which promote angiogenesis, all ELR-free chemokines are
essentially anti-angiogenic. One of the representative
ELR+ chemokine is CXCL8/IL8, which was discovered in
1992 and is a potent inducer of and factor underlying angiogenesis.
The key role of ELR+ CXC chemokines in angiogenesis
determines their fundamental position in the abnormal regulation of
angiogenesis during the development of malignant tumors. This
viewpoint is supported by a great number of studies (27–30).
In addition, IL-8 can act on various signaling pathways, such as
the phosphatidylinositol 3-kinase (PI3K)/protein kinase B (AKT),
nuclear factor (NF)-κB, MAPK and signal transducer and activator of
transcription-3 (Stat-3) pathways, to facilitate angiogenesis,
strongly demonstrating its key role in the occurrence and
development of malignant tumors.
It has been shown that the formation and shaping of
lymphatic vessels occur actively in malignant tumors, and
tumor-induced lymphangiogenesis is initiated by lymphangiogenic
factors, among which FGF-2 and PDGF BB are two important factors
(31,32). Previous studies have identified
FGF-2 as a pro-angiogenesis growth factor, potent mitogen and
chemoattractant (33). Studies
conducted in recent years confirmed the close relationship of FGF-2
with tumor lymphangiogenesis and lymphatic metastasis, and its
important role in tumor lymphangiogenesis is supported by the
observation that a low expression level of FGF-2 cannot induce
angiogenesis but can specifically induce tumor lymphangiogenesis
(34). Platelet-derived growth
factor BB is a member of the PDGF family. It was revealed that PDGF
BB can stimulate tumor lymphangiogenesis and lymphatic metastasis,
thus serving as an independent lymphangiogenic factor. One major
function of PDGF BB is to stabilize the vascular network; however,
recent studies revealed that PDGF can directly stimulate
lymphangiogenesis and lymphatic metastasis (35) and enhance lymphangiogenesis
independent of VEGFR-3 to promote tumor growth and metastasis.
Specifically targeting PDGF BB is a new strategy for the inhibition
of lymphangiogenesis. IHC experiments demonstrated that FGF-2 and
PDGF BB promoted lymphangiogenesis in inflammatory bowel disease.
Using an NFATc1 siRNA intervention technique, this study also
showed that NFATc1 could affect FGF-2 and PDGF BB, as demonstrated
by the finding that the expression levels of FGF-2 and PDGF BB
decreased with a decrease in NFATc1 expression, indicating that the
effect of NFATc1 on lymphangiogenesis in epithelial ovarian
carcinoma may be mediated by FGF-2 and PDGF BB regulation.
In addition, COX-2 activation during the promotion
of angiogenesis and tumor invasion can increase the expression
levels of PDGF and bFGF (36).
Moreover, PDGF activation by VEGF relies on COX2 overexpression
(37).
In addition, COX-2 activation during the promotion
of angiogenesis and tumor invasion can increase the expression
levels of PDGF and bFGF (33).
Moreover, PDGF activation by VEGF relies on COX2 overexpression
(34). In endothelial cells,
stimulation of FGF-2 can lead to hyperresponsiveness of PDGF BB,
which in turn results in augmentation of receptor expression in the
wall cells of lymphatic vessels and generates positive feedback to
the FGF-2 signal. Ultimately, the uncoordinated interactions
between these two proteins lead to unregulated formation and
shaping of primitive lymphatic vessels in the tumor
microenvironment, thus promoting tumor growth and metastasis.
As discussed above, based on the knowledge on the
VEGF/NFATc1/COX2 signaling pathway and our results, we can draw the
possible conclusion that NFATc1 plays a critical role in
angiogenesis in epithelial ovarian carcinoma. When activated by
VEGF-A or VEGF-C, NFATc1 acts on downstream IL-8 to promote
angiogenesis through regulating the expression of ELR+
CXC chemokines. Moreover, activated NFATc1 can affect the
expression of FGF-2 and PDGF BB through downstream COX2, thus
regulating tumor vascular angiogenesis and lymphangiogenesis. FGF-2
and PDGF BB can form a positive feedback loop through which the two
proteins interact with and affect each other, thus jointly
accelerating the occurrence and metastasis of tumors by promoting
tumor angiogenesis. The above signaling pathway may be a promising
target for the treatment of epithelial ovarian carcinoma.
Acknowledgements
This study was supported by the National Science
Foundation of China (no. 81402126).
References
|
1
|
Naito T, Tanaka H, Naoe Y and Taniuchi I:
Transcriptional control of T-cell development. Int Immunol.
23:661–668. 2011. View Article : Google Scholar : PubMed/NCBI
|
|
2
|
Chen L, Glover JN, Hogan PG, Rao A and
Harrison SC: Structure of the DNA-binding domains from NFAT, Fos
and Jun bound specifically to DNA. Nature. 392:42–48. 1998.
View Article : Google Scholar : PubMed/NCBI
|
|
3
|
Jain J, McCaffrey PG, Valge-Archer VE and
Rao A: Nuclear factor of activated T cells contains Fos and Jun.
Nature. 356:801–804. 1992. View
Article : Google Scholar : PubMed/NCBI
|
|
4
|
Bengsch B and Wherry EJ: The importance of
cooperation: partnerless NFAT induces T cell exhaustion. Immunity.
42:203–205. 2015. View Article : Google Scholar : PubMed/NCBI
|
|
5
|
Shaw JP, Utz PJ, Durand DB, Toole JJ,
Emmel EA and Crabtree GR: Identification of a putative regulator of
early T cell activation genes. Science. 241:202–205. 1988.
View Article : Google Scholar : PubMed/NCBI
|
|
6
|
Bai S and Kerppola TK: Opposing roles of
FoxP1 and Nfat3 in transcriptional control of cardiomyocyte
hypertrophy. Mol Cell Biol. 31:3068–3080. 2011. View Article : Google Scholar : PubMed/NCBI
|
|
7
|
Hanahan D and Weinberg RA: The hallmarks
of cancer. Cell. 100:57–70. 2000. View Article : Google Scholar : PubMed/NCBI
|
|
8
|
Chen NM, Singh G, Koenig A, Liou GY, Storz
P, Zhang JS, Regul L, Nagarajan S, Kühnemuth B, Johnsen SA, et al:
NFATc1 links EGFR signaling to induction of Sox9 transcription and
acinar-ductal transdifferentiation in the pancreas.
Gastroenterology. 148:1024–1034.e9. 2015. View Article : Google Scholar : PubMed/NCBI
|
|
9
|
Hashizume M, Hayakawa N and Mihara M: IL-6
trans-signalling directly induces RANKL on fibroblast-like synovial
cells and is involved in RANKL induction by TNF-alpha and IL-17.
Rheumatology (Oxford). 47:1635–1640. 2008. View Article : Google Scholar
|
|
10
|
Wang S, Kang X, Cao S, Cheng H, Wang D and
Geng J: Calcineurin/NFATc1 pathway contributes to cell
proliferation in hepatocellular carcinoma. Dig Dis Sci.
57:3184–3188. 2012. View Article : Google Scholar : PubMed/NCBI
|
|
11
|
Beals CR, Sheridan CM, Turck CW, Gardner P
and Crabtree GR: Nuclear export of NF-ATc enhanced by glycogen
synthase kinase-3. Science. 275:1930–1934. 1997. View Article : Google Scholar : PubMed/NCBI
|
|
12
|
Köenig A, Linhart T, Schlengemann K,
Reutlinger K, Wegele J, Adler G, Singh G, Hofmann L, Kunsch S, Büch
T, et al: NFAT-induced histone acetylation relay switch promotes
c-Myc-dependent growth in pancreatic cancer cells.
Gastroenterology. 138:1189–1199.e1-2. 2010. View Article : Google Scholar
|
|
13
|
Neal JW and Clipstone NA: A constitutively
active NFATc1 mutant induces a transformed phenotype in 3T3-L1
fibroblasts. J Biol Chem. 278:17246–17254. 2003. View Article : Google Scholar : PubMed/NCBI
|
|
14
|
Zhang SD, McCrudden CM, Meng C, Lin Y and
Kwok HF: The significance of combining VEGFA, FLT1, and KDR
expressions in colon cancer patient prognosis and predicting
response to bevacizumab. Onco Targets Ther. 8:835–843.
2015.PubMed/NCBI
|
|
15
|
Wu B, Baldwin HS and Zhou B: Nfatc1
directs the endocardial progenitor cells to make heart valve
primordium. Trends Cardiovasc Med. 23:294–300. 2013. View Article : Google Scholar : PubMed/NCBI
|
|
16
|
Wu B, Wang Y, Lui W, Langworthy M,
Tompkins KL, Hatzopoulos AK, Baldwin HS and Zhou B: Nfatc1
coordinates valve endocardial cell lineage development required for
heart valve formation. Circ Res. 109:183–192. 2011. View Article : Google Scholar : PubMed/NCBI
|
|
17
|
Adinolfi E, Raffaghello L, Giuliani AL,
Cavazzini L, Capece M, Chiozzi P, Bianchi G, Kroemer G, Pistoia V
and Di Virgilio F: Expression of P2X7 receptor increases in vivo
tumor growth. Cancer Res. 72:2957–2969. 2012. View Article : Google Scholar : PubMed/NCBI
|
|
18
|
Shoemaker LD, Fuentes LF, Santiago SM,
Allen BM, Cook DJ, Steinberg GK and Chang SD: Human brain
arteriovenous malformations express lymphatic-associated genes. Ann
Clin Transl Neurol. 1:982–995. 2014. View
Article : Google Scholar
|
|
19
|
Chen HM, Tsai CH and Hung WC: Foretinib
inhibits angiogenesis, lymphangiogenesis and tumor growth of
pancreatic cancer in vivo by decreasing VEGFR-2/3 and TIE-2
signaling. Oncotarget. 6:14940–14952. 2015. View Article : Google Scholar : PubMed/NCBI
|
|
20
|
Kähärä J and Lähdesmäki H: Evaluating a
linear k-mer model for protein-DNA interactions using
high-throughput SELEX data. BMC Bioinformatics. 14(Suppl 10):
S22013.
|
|
21
|
Kulkarni RM, Greenberg JM and Akeson AL:
NFATc1 regulates lymphatic endothelial development. Mech Dev.
126:350–365. 2009. View Article : Google Scholar : PubMed/NCBI
|
|
22
|
Norrmén C, Ivanov KI, Cheng J, Zangger N,
Delorenzi M, Jaquet M, Miura N, Puolakkainen P, Horsley V, Hu J, et
al: FOXC2 controls formation and maturation of lymphatic collecting
vessels through cooperation with NFATc1. J Cell Biol. 185:439–457.
2009. View Article : Google Scholar : PubMed/NCBI
|
|
23
|
Lee JH, Bhang DH, Beede A, Huang TL,
Stripp BR, Bloch KD, Wagers AJ, Tseng YH, Ryeom S and Kim CF: Lung
stem cell differentiation in mice directed by endothelial cells via
a BMP4-NFATc1-thrombospondin-1 axis. Cell. 156:440–455. 2014.
View Article : Google Scholar : PubMed/NCBI
|
|
24
|
Jang GH, Park IS, Yang JH, Bischoff J and
Lee YM: Differential function of genes regulated by VEGF-NFATc1
signaling pathway in migration of pulmonary valve endothelial
cells. FEBS Lett. 584:141–146. 2010. View Article : Google Scholar :
|
|
25
|
Combs MD and Yutzey KE: VEGF and RANKL
regulation of NFATc1 in heart valve development. Circ Res.
105:565–574. 2009. View Article : Google Scholar : PubMed/NCBI
|
|
26
|
Li WH, Qiu Y, Zhang HQ, Tian XX and Fang
WG: P2Y2 Receptor and EGFR cooperate to promote prostate cancer
cell invasion via ERK1/2 pathway. PLoS One. 10:e01331652015.
View Article : Google Scholar : PubMed/NCBI
|
|
27
|
Moldobaeva A, Baek A, Eldridge L and
Wagner EM: Differential activity of pro-angiogenic CXC chemokines.
Microvasc Res. 80:18–22. 2010. View Article : Google Scholar : PubMed/NCBI
|
|
28
|
Joimel U, Gest C, Soria J, Pritchard LL,
Alexandre J, Laurent M, Blot E, Cazin L, Vannier JP, Varin R, et
al: Stimulation of angiogenesis resulting from cooperation between
macrophages and MDA-MB-231 breast cancer cells: Proposed molecular
mechanism and effect of tetrathiomolybdate. BMC Cancer. 10:3752010.
View Article : Google Scholar : PubMed/NCBI
|
|
29
|
Sarmiento J, Shumate C, Suetomi K,
Ravindran A, Villegas L, Rajarathnam K and Navarro J: Diverging
mechanisms of activation of chemokine receptors revealed by novel
chemokine agonists. PLoS One. 6:e279672011. View Article : Google Scholar : PubMed/NCBI
|
|
30
|
Rabquer BJ, Tsou PS, Hou Y,
Thirunavukkarasu E, Haines GK III, Impens AJ, Phillips K, Kahaleh
B, Seibold JR and Koch AE: Dysregulated expression of MIG/CXCL9,
IP-10/CXCL10 and CXCL16 and their receptors in systemic sclerosis.
Arthritis Res Ther. 13:R182011. View
Article : Google Scholar : PubMed/NCBI
|
|
31
|
Caoa R, Jia H, Fenga N, et al:
Collaborative interplay between FGF-2 and VEGF-C promotes
lymphangiogenesis and metastasis. PNAS. 109:15894–15899. 2012.
View Article : Google Scholar
|
|
32
|
Cao R1, Björndahl MA, Religa P, et al:
PDGF-BB induces intratumoral lymphangiogenesis and promotes
lymphatic metastasis. Cancer Cell. 6:333–345. 2004. View Article : Google Scholar : PubMed/NCBI
|
|
33
|
Andrés G1, Leali D, Mitola S, et al: A
pro-inflammatory signature mediates FGF2-induced angiogenesis.
Molecular Medicine. 13:2083–2108. 2009.
|
|
34
|
Chang LK, Garcia-Cardeña G, Farnebo F,
Fannon M, Chen EJ, Butterfield C, Moses MA, Mulligan RC, Folkman J
and Kaipainen A: Dose-dependent response of FGF-2 for
lymhangiongenesis. Proc Natl Acad Sci USA. 101:11658–11663. 2004.
View Article : Google Scholar
|
|
35
|
Schoppmann SF, Alidzanovic L, Schultheis
A, Perkmann T, Brostjan C and Birner P: Thrombocytes correlate with
lymphangiogenesis in human esophageal cancer and mediate growth of
lymphatic endothelial cells in vitro. PLoS One. 8:e669412013.
View Article : Google Scholar :
|
|
36
|
Tung HC, Lee FY, Wang SS, Tsai MH, Lee JY,
Huo TI, Huang HC, Chuang CL, Lin HC and Lee SD: The beneficial
effects of P2X7 antagonism in rats with bile duct ligation-induced
cirrhosis. PLoS One. 10:e01246542015. View Article : Google Scholar : PubMed/NCBI
|
|
37
|
Zhao Y, Wang Y, Wang Q, Liu Z, Liu Q and
Deng X: Hepatic stellate cells produce vascular endothelial growth
factor via phospho-p44/42 mitogen-activated protein
kinase/cyclooxygenase-2 pathway. Mol Cell Biochem. 359:217–223.
2012. View Article : Google Scholar
|