Introduction
Thyroid carcinoma is an endocrine-related
malignancy. Among thyroid carcinoma, papillary thyroid cancer (PTC)
is the most common type and account for 80–90% of total thyroid
carcinoma cases (1,2). Although the clinical prognosis for
the majority of cases is satisfactory, 14% demonstrate early
recurrence and some present severe invasion, multiple lymph node
metastasis and distant metastasis (3–5).
Currently the progress in identification of biological markers that
are useful for the diagnosis and prognosis analysis of PTC is slow
(6). Thus, the correct molecular
characterization and identification of patients with thyroid cancer
is thought to be a key aspect for future study.
Slit refers to a family of related genes which
encode a corresponding set of secreted proteins, also collectively
referred to as Slit (7). The
classical function of Slit in proteins is to act as midline
repellents, preventing the crossing of longitudinal axons through
the midline of the central nervous system of most bilaterian animal
species. It also prevents the recrossing of commissural axons
(8). Its canonical receptor is
ROBO, and Slit/ROBO signaling is important in pioneer axon guidance
(9–11). In recent years, the role of Slit
family proteins in cancer has received much attention due to their
role in controlling cell migration, abnormalities or absence in the
expression in Slit proteins are associated with a variety of
cancers (12–14). Our previous study identified Slit2
as a diagnosis and prognosis marker in gastric cancer.
Mechanistically, it participates in gastric cancer oncogenesis and
metastasis through regulating the AKT/β-catenin pathway (15,16).
To the best of our knowledge, the expression pattern
of Slit2 and its correlation with clinicpathological parameters of
PTC has not been previously reported. In the present study, we
examined Slit2 expression in transcriptional and protein level, and
then analyzed the correlation between Slit2 expression and the
clinicopatholocical characteristics of PTC. Moreover, we sought to
elucidate the role of Slit2 in PTC through its association with
glucose metabolism, which is considered to influence life and death
decisions, because it provides cancer cells with building blocks
for macromolecule synthesis and energy supply.
Materials and methods
Immunohistochemistry (IHC)
Thyroid cancer tissues, confirmed by pathological
diagnosis, were obtained from 196 patients who underwent
thyroidectomy between 2003 and 2012 at the Department of Head and
Neck Surgery, Fudan University Shanghai Cancer Center. The
corresponding non-tumor thyroid tissues were obtained at least 1 cm
away from the tumor. All tissue samples were formalin-fixed and
paraffin-embedded. TNM staging was classified based on the criteria
of the American Joint Committee on Cancer (AJCC, 7th edition) for
thyroid cancer. The study was approved by the Human Ethics
Committee/Institutional Review Board of Fudan University Shanghai
Cancer Center. Written informed consent was obtained from all 196
patients. IHC staining was performed by using a highly sensitive
streptavidin-biotin-peroxidase detection system with thyroid cancer
tissue microarrays. Rabbit polyclonal anti-Slit-2 (working dilution
1:50) was purchased from Proteintech Group Inc. (Chicago, IL, USA)
and rabbit anti-HIF-1-α (working dilution 1:50) was purchased from
Abcam (Cambridge, MA, USA). Immunolabeling was conducted using Dako
EnVision + Rabbit Polymer (cat. no. K4003) from Dako (Carpinteria,
CA, USA). The slides were counterstained with hematoxylin and
coverslipped.
IHC scoring
The immunohistochemically stained tissue sections
were scored separately by two pathologists blinded to the clinical
parameters. The staining intensity was scored as 0 (negative), 1
(weak), 2 (medium) or 3 (strong). Extent of staining was scored as
(0, <5%; 1, 5–25%; 2, 26–50%; 3, 51–75%; and 4, >75%)
according to the percentages of the positive staining areas in
relation to the whole carcinoma area. Scores for staining intensity
and percentage positivity of cells were then multiplied to generate
the immunoreactivity score (IS) for each case. Tissues having a
final staining score of <4, 4, 6 and ≥8 were considered to be −,
+, ++ and +++, respectively.
Total RNA extraction, reverse
transcription and quantitative real-time PCR
Thyroid cancer tissues, confirmed by pathological
diagnosis, were obtained from 130 patients who underwent
thyroidectomy between 2012 and 2015 at the Department of Head and
Neck Surgery, Fudan University Shanghai Cancer Center. Total RNA
was extracted from tissues using TRIzol reagent (Invitrogen)
according to the manufacturer's instructions. A total of 1 μg RNA
was reverse-transcribed using a PrimeScript RT reagent kit (Takara
Bio, Dalian, China). For quantitative real-time PCR (qPCR), cDNA
was amplified using SYBR-Green Premix Ex Taq (Takara Bio) following
the manufacturer's instructions. Slit-2 expression was normalized
against β-actin mRNA expression in three independent experiments.
The primers used for amplifying Slit2 were
5′-AACTGCCTTCGGGTAGATGC-3′ (forward) and 5′-GAATGGCCCGAAGAGGTGAA-3′
(reverse). The primers used for amplifying β-actin were
5′-CTACGTCGCCCTGGACTTCGAGC-3′ (forward) and
5′-GATGGAGCCGCCGATCCACACGG-3′ (reverse). The results were analyzed
and calculated relative to cycle threshold values and then
converted into fold changes.
Cell culture
PTC cell line K1, was purchased from the Institute
of Biochemistry and Cell Biology at the Chinese Academy of Sciences
(Shanghai, China). The cells were cultured in RPMI-1640
supplemented with 10% fetal bovine serum, 2%
streptomycin/penicillin and 1% amphotericin B. K1 cells were
cultured as monolayer in 5% CO2 at 37°C.
Plasmids
pLKO.1 TRC cloning vector (Addgene plasmid 10878)
was used to generate shRNA-expression constructs. Targets (21 bp)
against Slit2 were CCTCACCTTAATTCTTAGTTA and CCTGGAGCTTTCTCACCATAT,
respectively. Scramble RNA (Addgene plasmid 1864) was used as
control vector. HRE-luciferase construct (Addgene plasmid 26731),
containing three hypoxia response elements from Pgk-1 gene, was
used to assess HIF1α transcriptional activity.
HRE luciferase assay
HIF1α transcriptional activity was evaluated by
using by using the Promega Dual-Luciferase® reporter
(DLR™) assay system. pRL-TK plasmid was used as control vector for
expression of Renilla luciferase.
Cell proliferation analysis
Cell proliferation was examined by using Cell
Counting kit-8 (CCK-8; Dojindo Molecular Technologies). In brief,
cells were seeded in 96-well plates (3×10³ cells/well),
10 μl CCK-8 solution were added to each well at 0, 24, 48 and 72 h,
and the plates were incubated at 37°C in 5% CO2 for 1 h.
The absorbance of each sample was measured at a wavelength of 450
nm using a microplate reader.
Colony formation assay
K1 cells were digested and 200 cells were seeded and
incubated in a fresh 6-well plate for 14 days to allow colonies to
form. Colonies were fixed in methanol, stained with 0.1% crystal
violet solution and counted.
Glycolysis analysis
Glucose uptake colorimetric assay kit (BioVision
Inc., Milpitas, CA, USA) and Lactate colorimetric assay kit
(BioVision) were purchased to examine the glycolysis process in K1
cells according to the manufacturer's protocol. To test expression
of glycolytic enzymes and HIF1α transcriptional activity, real-time
PCR was performed. In brief, total RNA was prepared using TRIzol
reagent (Invitrogen, Carlsbad, CA, USA), followed by reverse
transcription using Takara PrimeScript RT reagent to obtain cDNA.
The expression status was assessed by quantitative real-time PCR
(qRT-PCR) using ABI 7900HT Real-Time PCR system (Applied
Biosystems, Foster City, CA, USA). All reactions were run in
triplicate. Primer sets Glut1 F, 5′-CAGTTTGGCTACAACACTGGAG-3′ and
R, 5′-GCCCCCAACAGAAAAGATGG-3′; HK2: F, 5′-CAAAGTGACAGTGGGTGTGG-3′
and R, 5′-GCCAGGTCCTTCACTGTCTC-3′; LDHA F,
5′-CCCAGTTTCCACCATGATTAAGG-3′ and R, 5′-TTCTGTCCCAAAATGCAAGGAA-3′;
PKM2 F, 5′-CAAAGGACCTCAGCAGCCATGTC-3′ and R,
5′-GGGAAGCTGGGCCAATGGTACAGA-3′; β-actin F,
5′-AGAGCTACGAGCTGCCTGAC-3′ and R, 5′-AGCACTGTGTTGGCGTACAG-3′.
Western blot analysis and antibodies
Protein extracts were prepared and resolved on 10%
SDS-PAGE gels, transferred to nitrocellulose membranes (0.45 mm)
and immunoblotted with primary antibodies. Slit2, c-myc and HIF1α
antibodies were purchased from Abcam. β-actin antibody was used as
loading control antibody. Images were developed with ECL (GE
Healthcare, Pittsburgh, PA, USA).
Statistical analysis
All statistical analyses were performed using SPSS
16.0 software. Results were expressed as means ± standard
deviation. Two-tailed unpaired Student's t-tests and one-way
analysis of variance were used to evaluate the data. P-values
<0.05 were considered as statistically significant.
Results
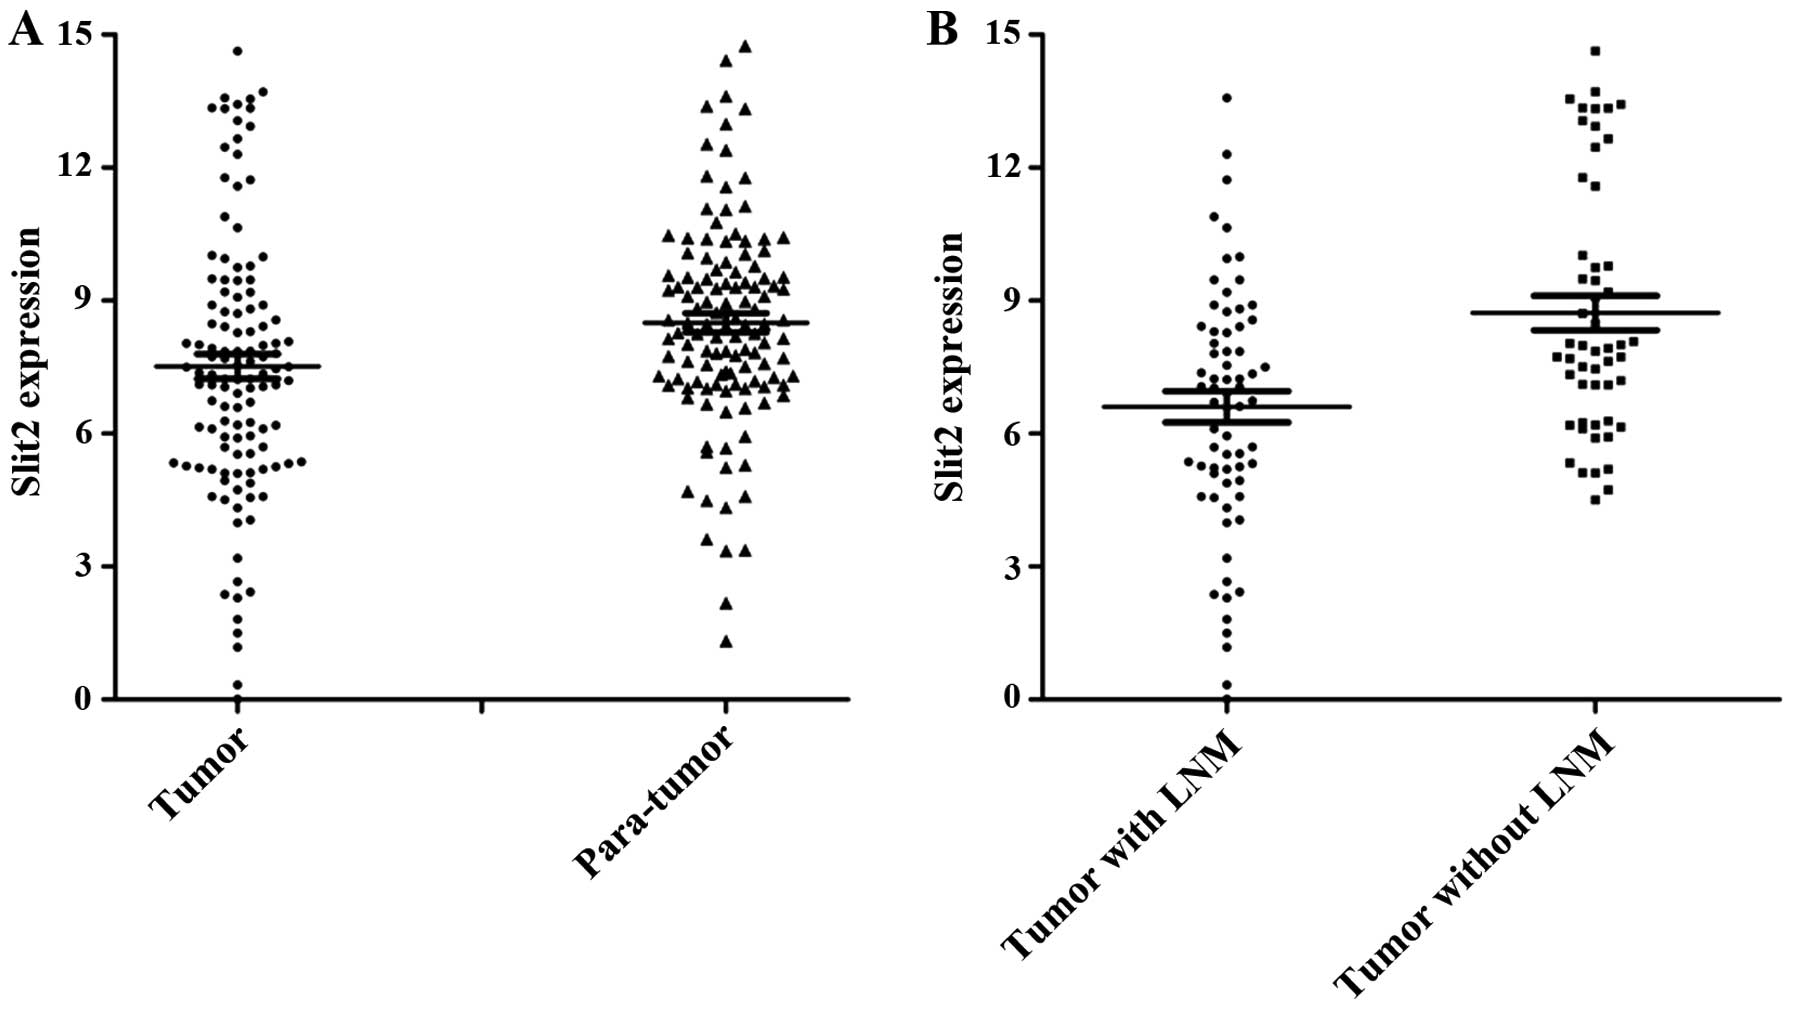
Slit2 mRNA expression in PTC
One hundred pairs of specimens were investigated by
qPCR to investigate the expression of Slit2. The average mRNA
expression levels of Slit2 were significantly lower in PTC tissues
compared with adjacent non-tumor thyroid tissues (Fig. 1A). Next, we examined Slit2 mRNA
expression in PTC samples with lymph node metastasis (LNM). The
results demonstrated that the lower Slit2 mRNA levels were
associated with lymph node metastasis at diagnosis (Fig. 1B).
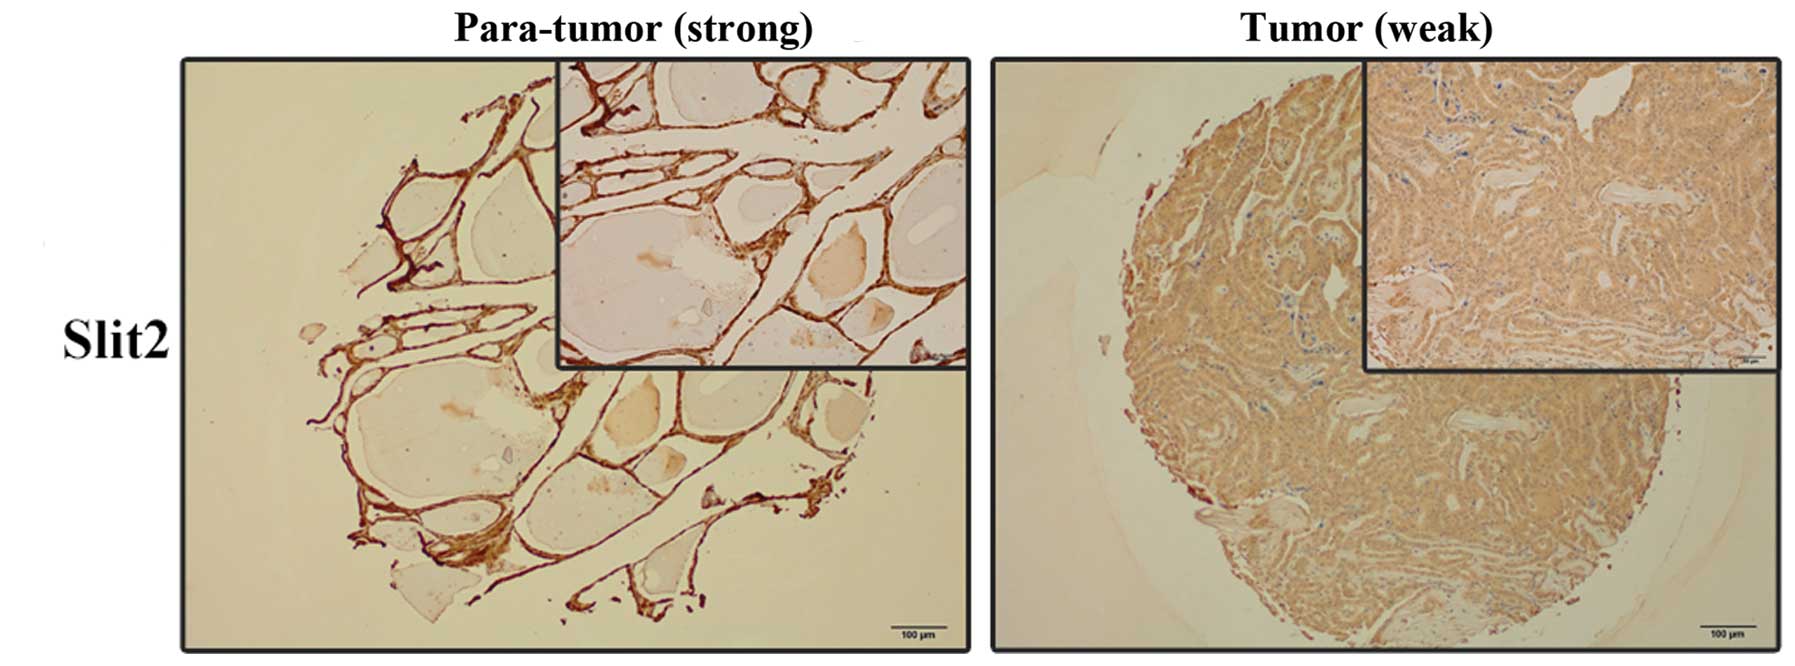
Slit2 protein staining indices by
IHC
The protein levels of Slit2 in PTC samples were
analyzed by IHC staining. Slit2 level was lower in PTC samples than
that in non-tumorous samples (Fig.
2). Furthermore, to test the role of Slit2 in LNM of PTC, we
examined the level of Slit2 in PTC tissue micro-array containing
196 patients samples. The clinicopathological features of the
patients are listed (Table I). In
addition, further analysis demonstrated that Slit2 is a negative
indicator for LNM at diagnosis (Table
II).
 | Table IBaseline characteristics in a
consecutive series of 196 papillary thyroid cancers. |
Table I
Baseline characteristics in a
consecutive series of 196 papillary thyroid cancers.
| Variables | Total (%) |
|---|
| Clinical factor |
| Gender |
| Male | 65 (33.2) |
| Female | 131 (66.8) |
| Age | 45.7±12.7
(14–80) |
| Pathological
factor |
| Maximal tumor size
(cm) | 2.0±1.4
(0.2–9.0) |
| Multifocality | 24 (12.2) |
| ETE | 45 (23.3) |
| HT | 41 (20.9) |
| LNM | 109 (55.6) |
| Outcome |
| Regional
recurrence | 19 (9.7) |
| Distant
metastasis | 2 (1.0) |
| Table IIThe associations between Slit2 in
tumor tissue according to immunohistochemistry (IHC) and patient
outcomes. |
Table II
The associations between Slit2 in
tumor tissue according to immunohistochemistry (IHC) and patient
outcomes.
| Tumor tissue | Regional lymph node
metastasisa | Recurrence (local or
distant)b |
|---|
|
|
|---|
| Negative | Positive | Negative | Positive |
|---|
| Slit2 |
| − | 20 (10.2) | 42 (21.4) | 39 (19.9) | 8 (4.1) |
| + | 32 (16.3) | 40 (20.4) | 69 (34.7) | 7 (3.6) |
| ++ | 35 (17.9) | 27 (13.8) | 70 (35.7) | 4 (2.0) |
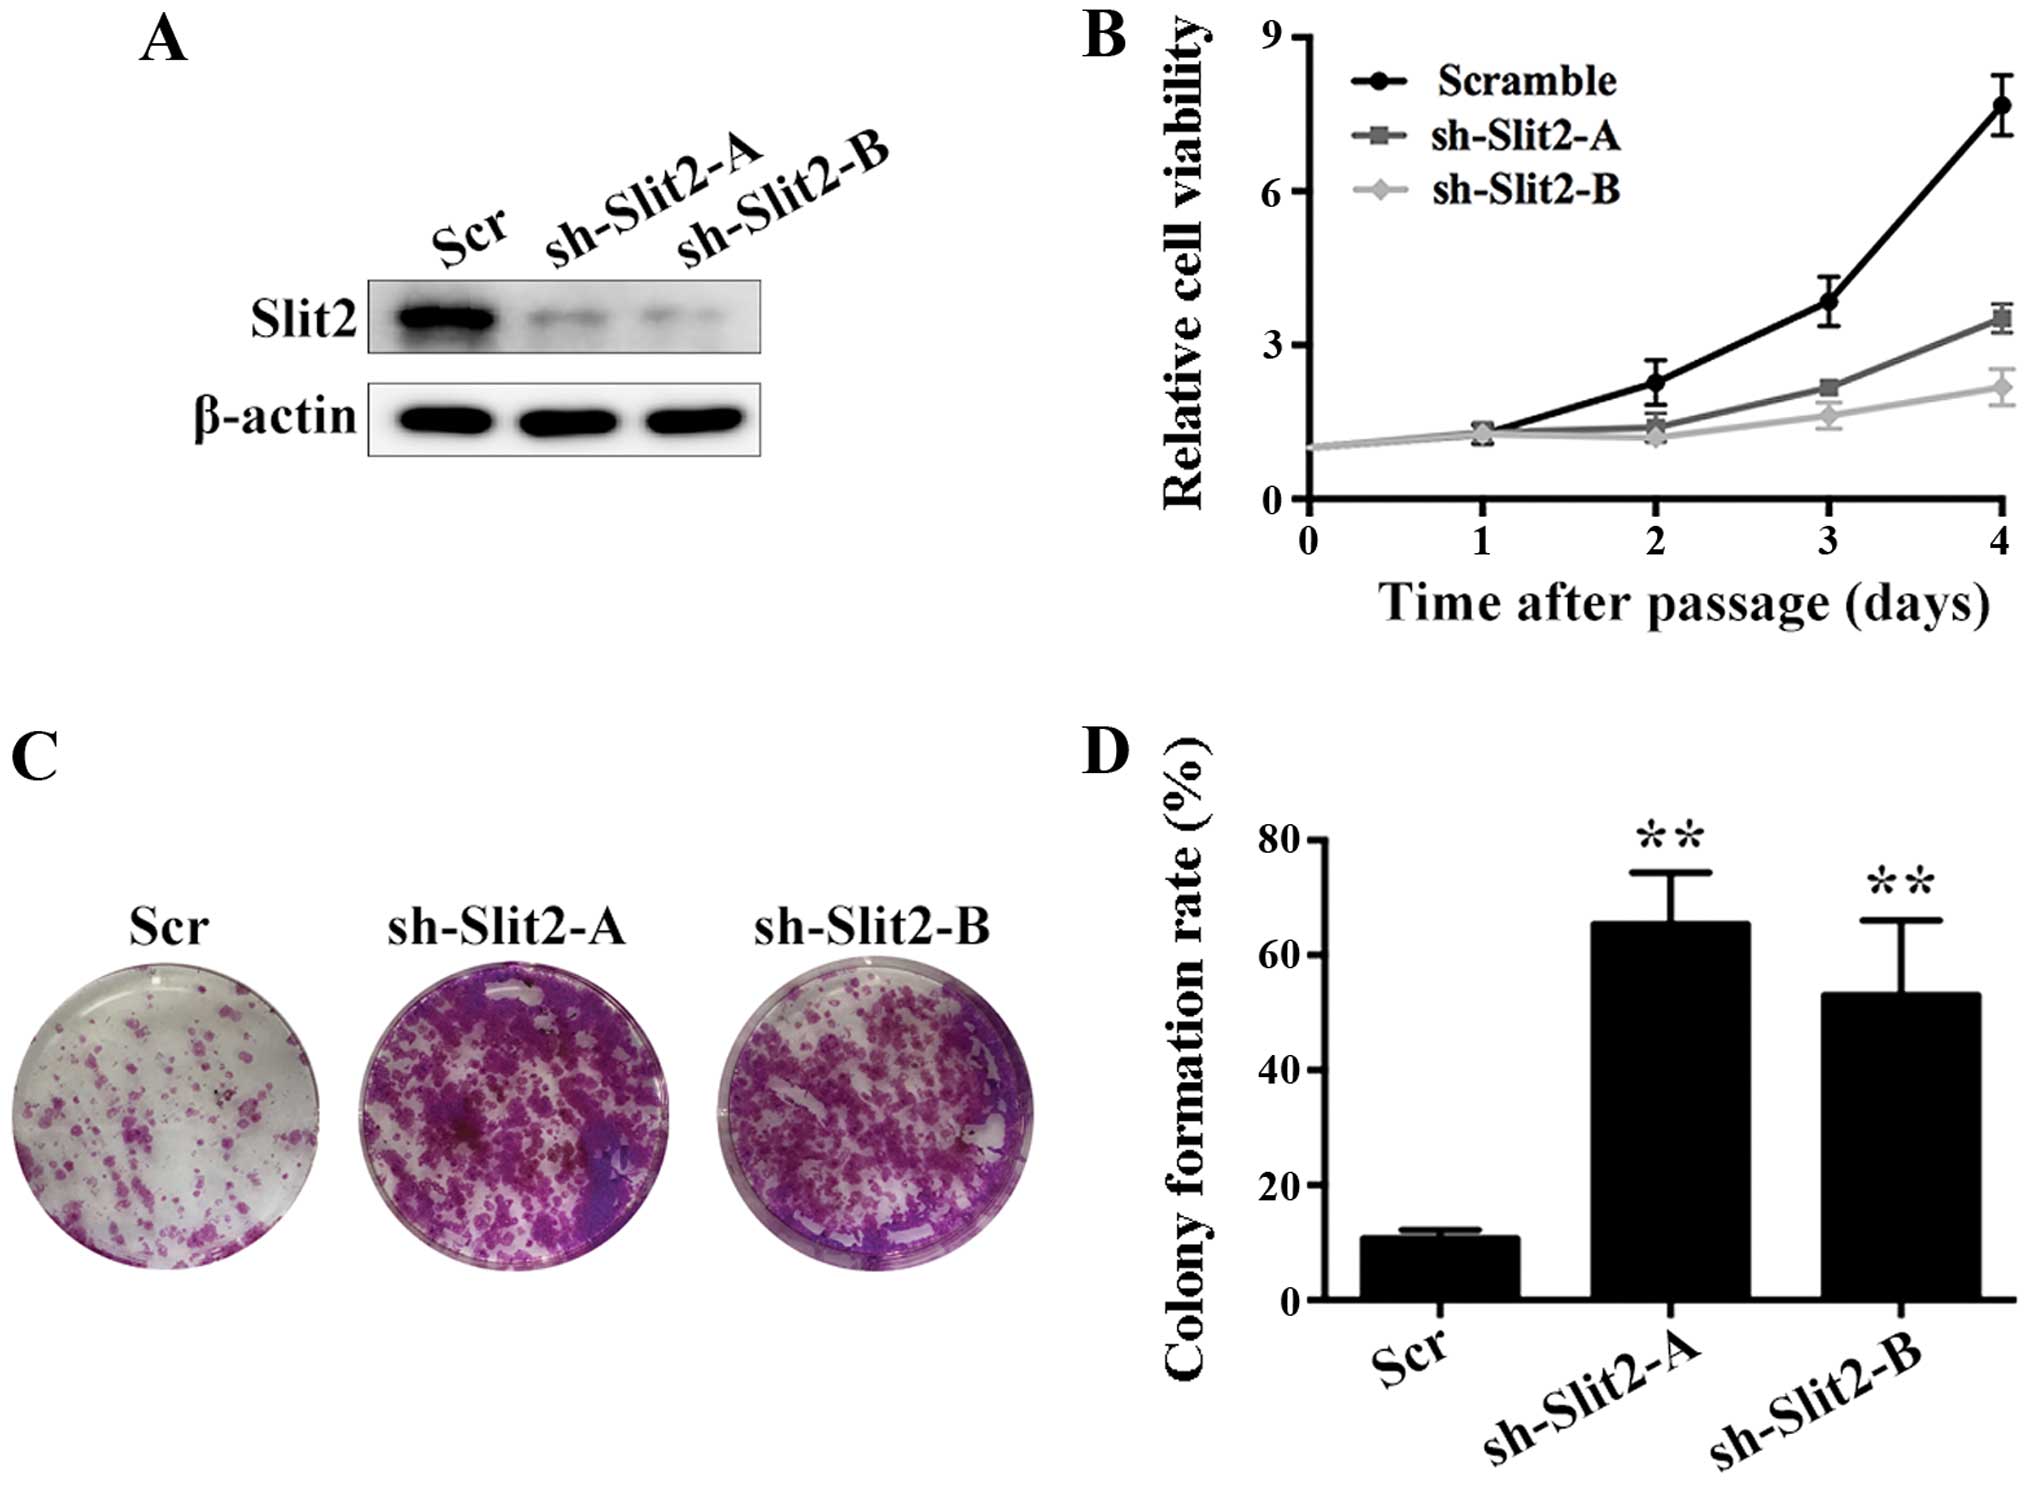
Silencing Slit2 enhances cell viability
of K1 cells
In order to examine the role of Slit2 in thyroid
cancer proliferation in vitro, we used shRNA mediated
silencing of Slit2 in K1 cells. Two shRNAs against Slit2
effectively decreased Slit2 expression (Fig. 3A). Then we examined the effect of
silencing Slit2 on cell viability by CCK-8 assay. A significant
increase in cell viability was observed upon Slit2 silencing
(Fig. 3B). Moreover, clone
formation assay also suggested that silencing Slit2 increased
cloning capacity of K1 cells, indicating that Slit2 is a negative
regulator of cell proliferation (Fig.
3C and D).
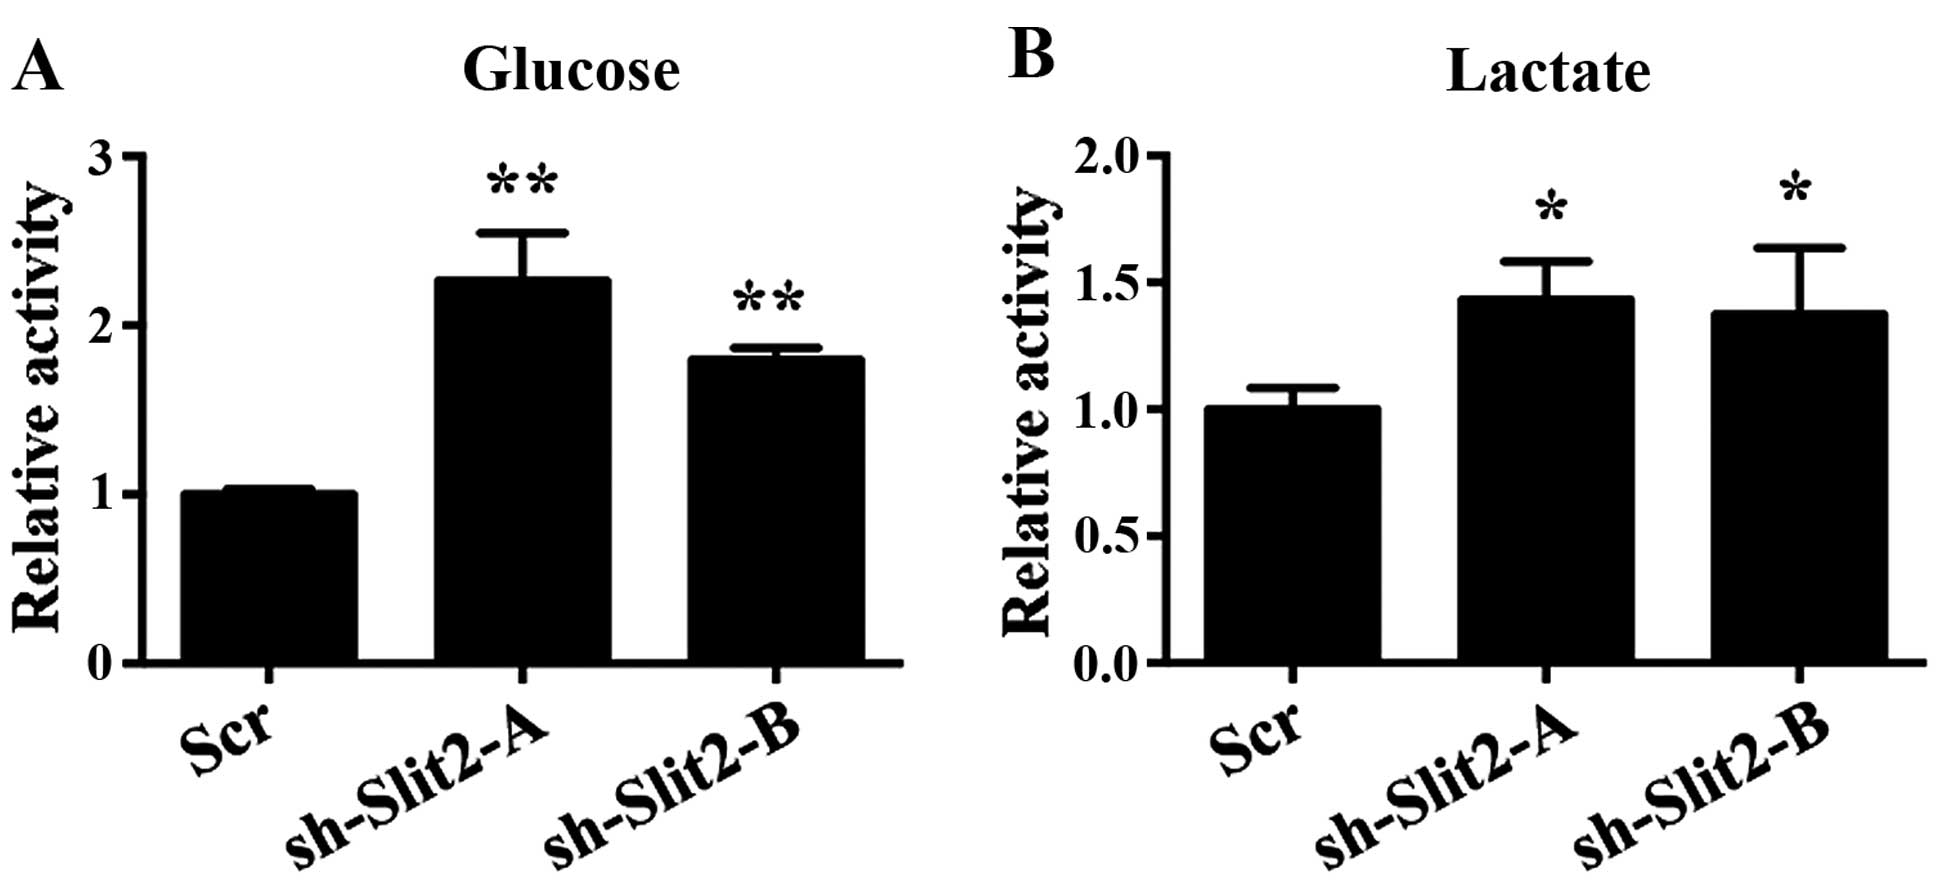
Slit2 is associated with Warburg effect
in K1 cells
It is well accepted that many cancer cells exhibit
elevated glucose uptake and lactate production, regardless of
oxygen availability, known as aerobic glycolysis or Warburg effect.
Enhanced glycolysis facilitates uncontrolled proliferation of
cancer cells by providing building blocks for macromolecule
synthesis and energy source. We next asked whether the effect of
Slit2 on cell proliferation was associated with glycolysis. In K1
cells, decreased Slit2 expression enhanced glucose uptake, which is
the first step for glucose metabolism (Fig. 4A). Lactate, the key product of the
Warburg effect, was not only used as a source for metabolism, but
also created an acidic environment that leads to destabilization of
extracellular matrix that facilitates metastasis of cancer cells.
Our results also demonstrated that decreased Slit2 expression
enhanced lactate production of K1 cells (Fig. 4B).
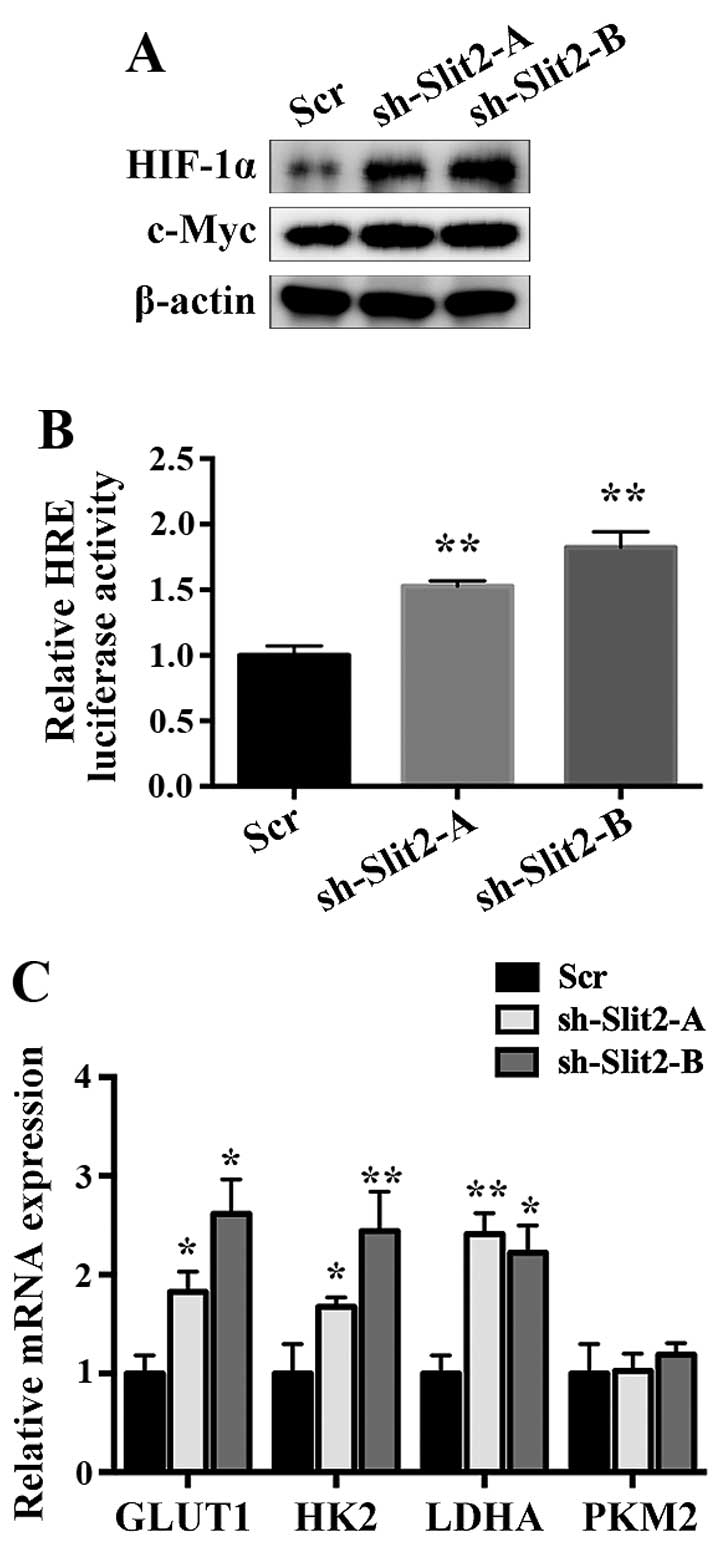
Slit2 regulates HIF1α and HIF1α
transcriptional activity
HIF1α is a transcription factor that mediated the
primary transcriptional response to hypoxic stress of transformed
cancer cells. In conjugation with c-myc, they are considered to be
key regulators of the Warburg effect. We speculated that Slit2
might regulate glycolysis in part through HIF1α and c-myc.
Consistent with this assumption, we observed an increase in HIF1α
and c-myc protein levels in Slit2 knock-down cells (Fig. 5A). In order to assess the role of
Slit2 on HIF1α transcriptional activity, we performed HRE
luciferase reporter assay. Silencing Slit2 increased HRE-luciferase
activity, supporting the result that Slit2 regulated HIF1α protein
level (Fig. 5B). As a
transcription factor, HIF1α regulates series of genes in glycolysis
process. GLUT1 (glucose transporter 1) is a membrane protein that
facilitates glucose transport across the cell membrane, which is
subsequently catalyzed to glucose 6-phosphate by HK2 (hexokinase
2). In the last step of glycolysis, L-lactate and NAD are converted
to pyruvate and NAHD by LDHA (lactate dehydrogenase A). PKM2
(pyruvate kinase isozyme M2) catalyzes the dephosphorylation of
phosphoenolpyruvate to pyruvate, and is responsible for net ATP
production. PKM2 is also a HIF1α target gene. To further confirm
the function of Slit2 on HIF1α transcriptional activity control, we
examined the expression of HIF1α targeted glycolysis genes upon
Slit2 downregulation, and observed that GLUT1, HK2 and LDHA were
significantly upregulated. However, the expression of PKM2 was
changed slightly, indicating that there may be other mechanisms for
PKM2 regulation in thyroid cancer (Fig. 5C).
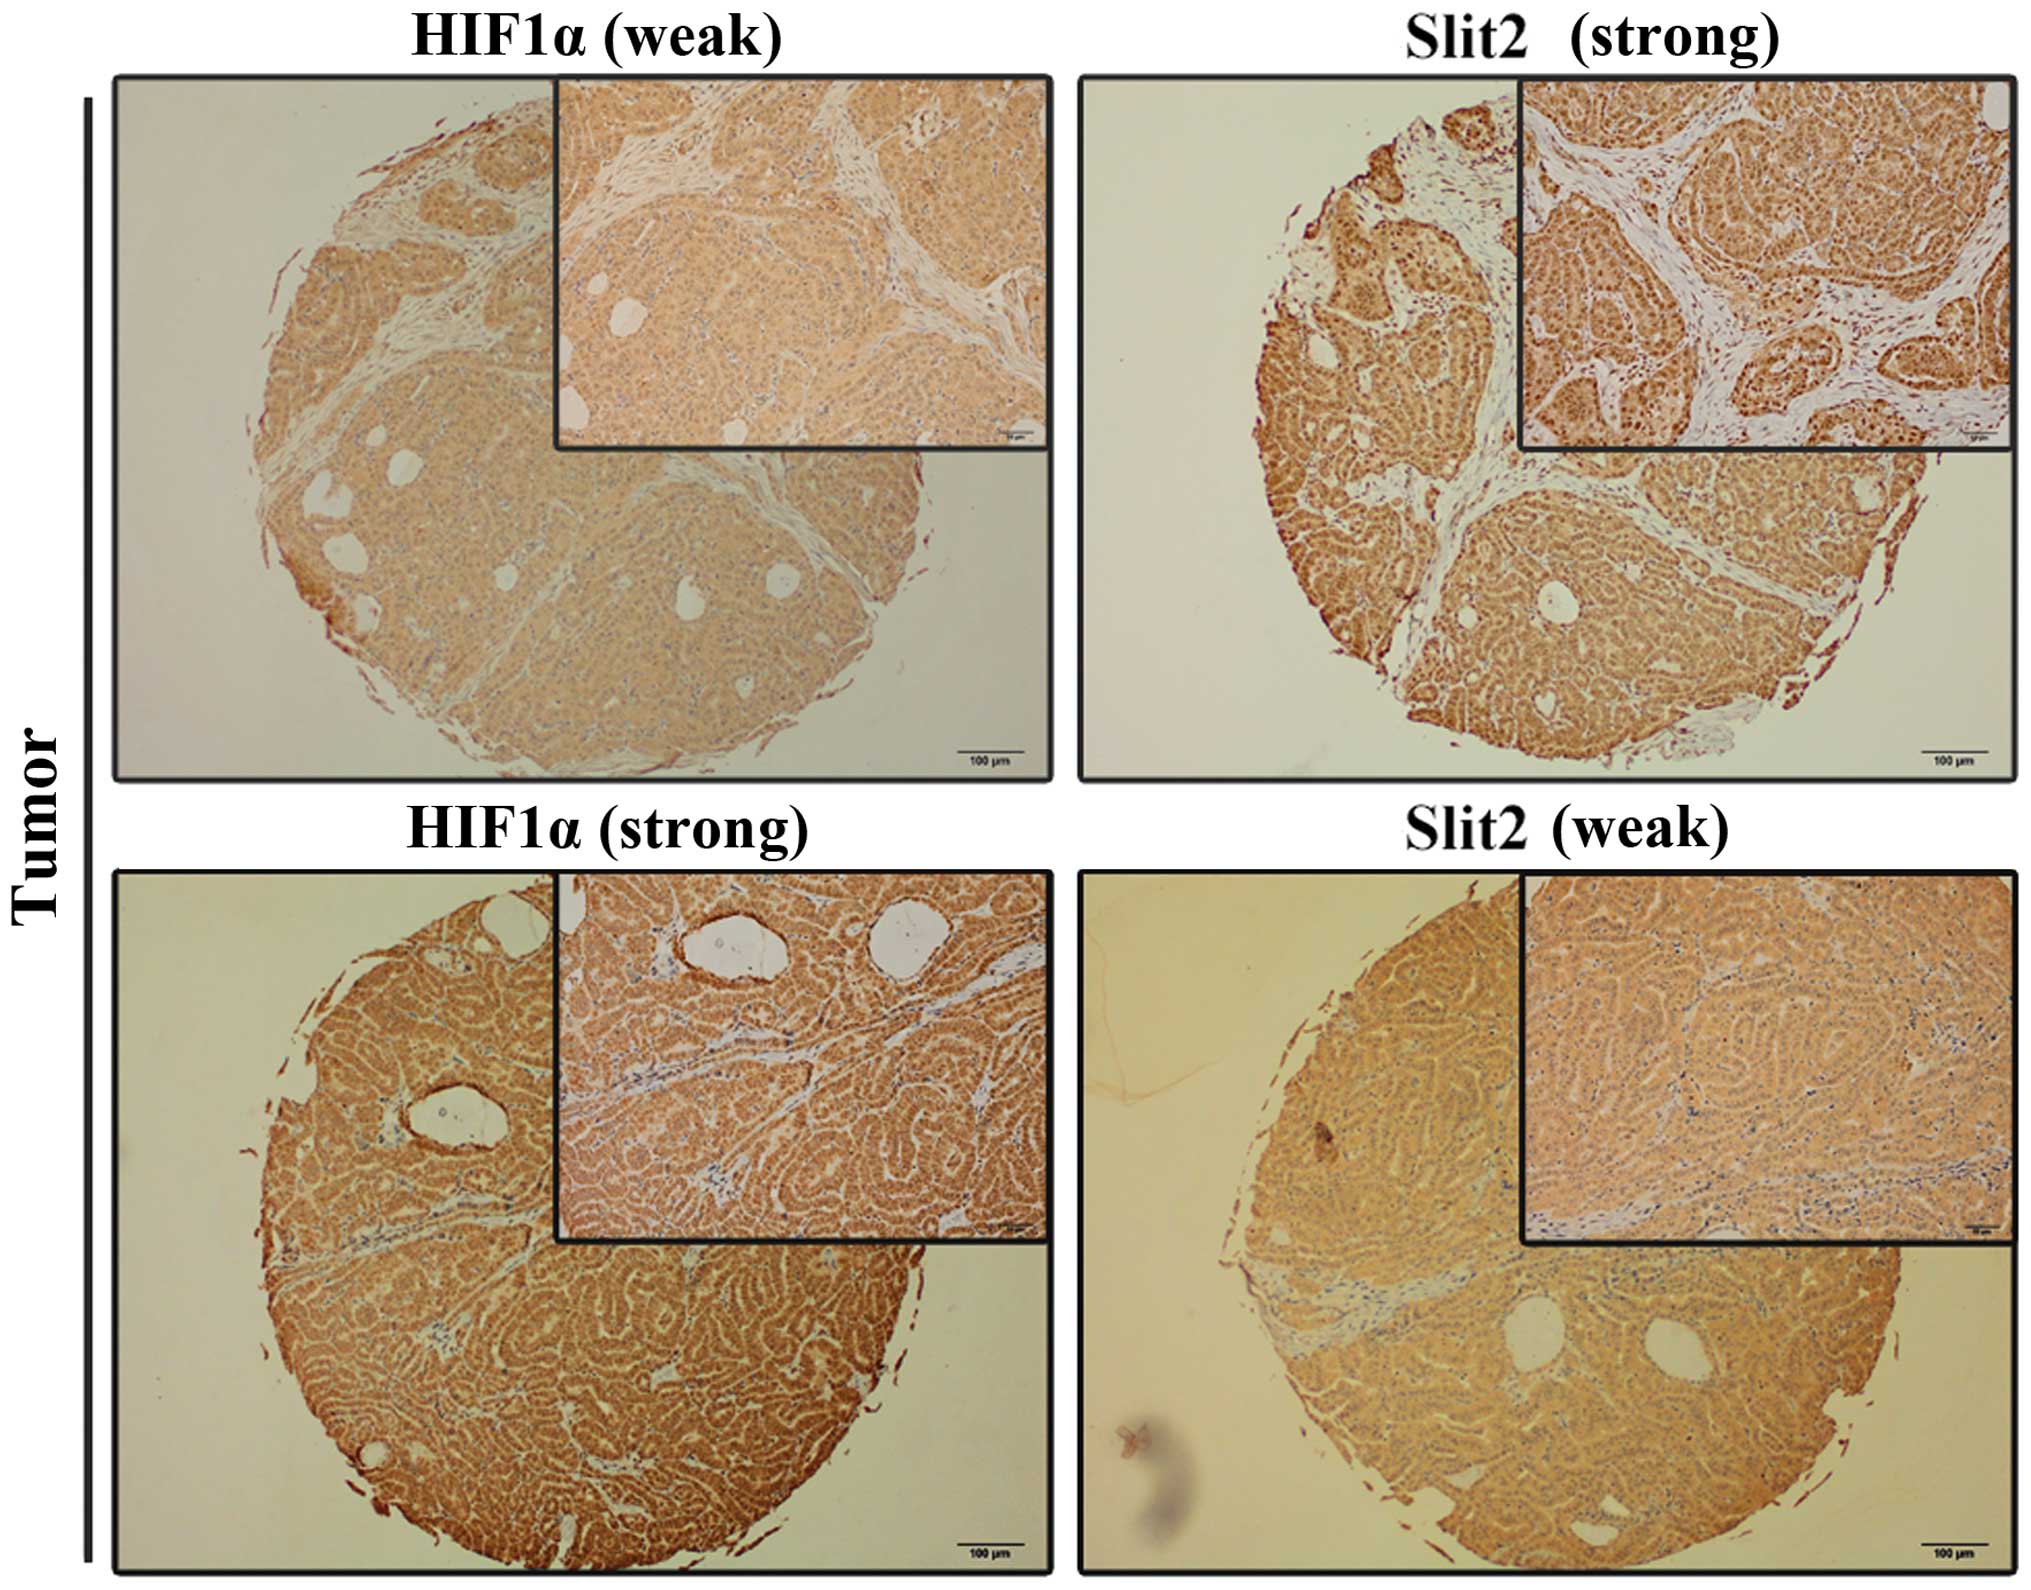
Slit2 negatively correlates with HIF1α
expression in PTC samples
Correlation between Slit2 and HIF1α was analyzed by
IHC staining. HIF1α level was low in Slit2 positive PTC samples
(Fig. 6). Statistical analysis
demonstrated that there is a negative association between Slit2 and
HIF1α in PTC tissue microarray (Table III).
| Table IIIThe negative association between
Slit2 and HIF1α in tumor tissue according to immunohistochemistry
(IHC). |
Table III
The negative association between
Slit2 and HIF1α in tumor tissue according to immunohistochemistry
(IHC).
| Tumor tissue | HIF1α |
|---|
|
|---|
| − | + | | ++ | +++ |
|---|
| Slit2 |
| − | 10 (5.1) | 30 (15.3) | 34 (17.3) | 0 (0) |
| + | 4 (2.0) | 24 (12.2) | 39 (19.9) | 8 (4.1) |
| ++ | 7 (3.6) | 35 (17.9) | 5 (2.6) | 0 (0) |
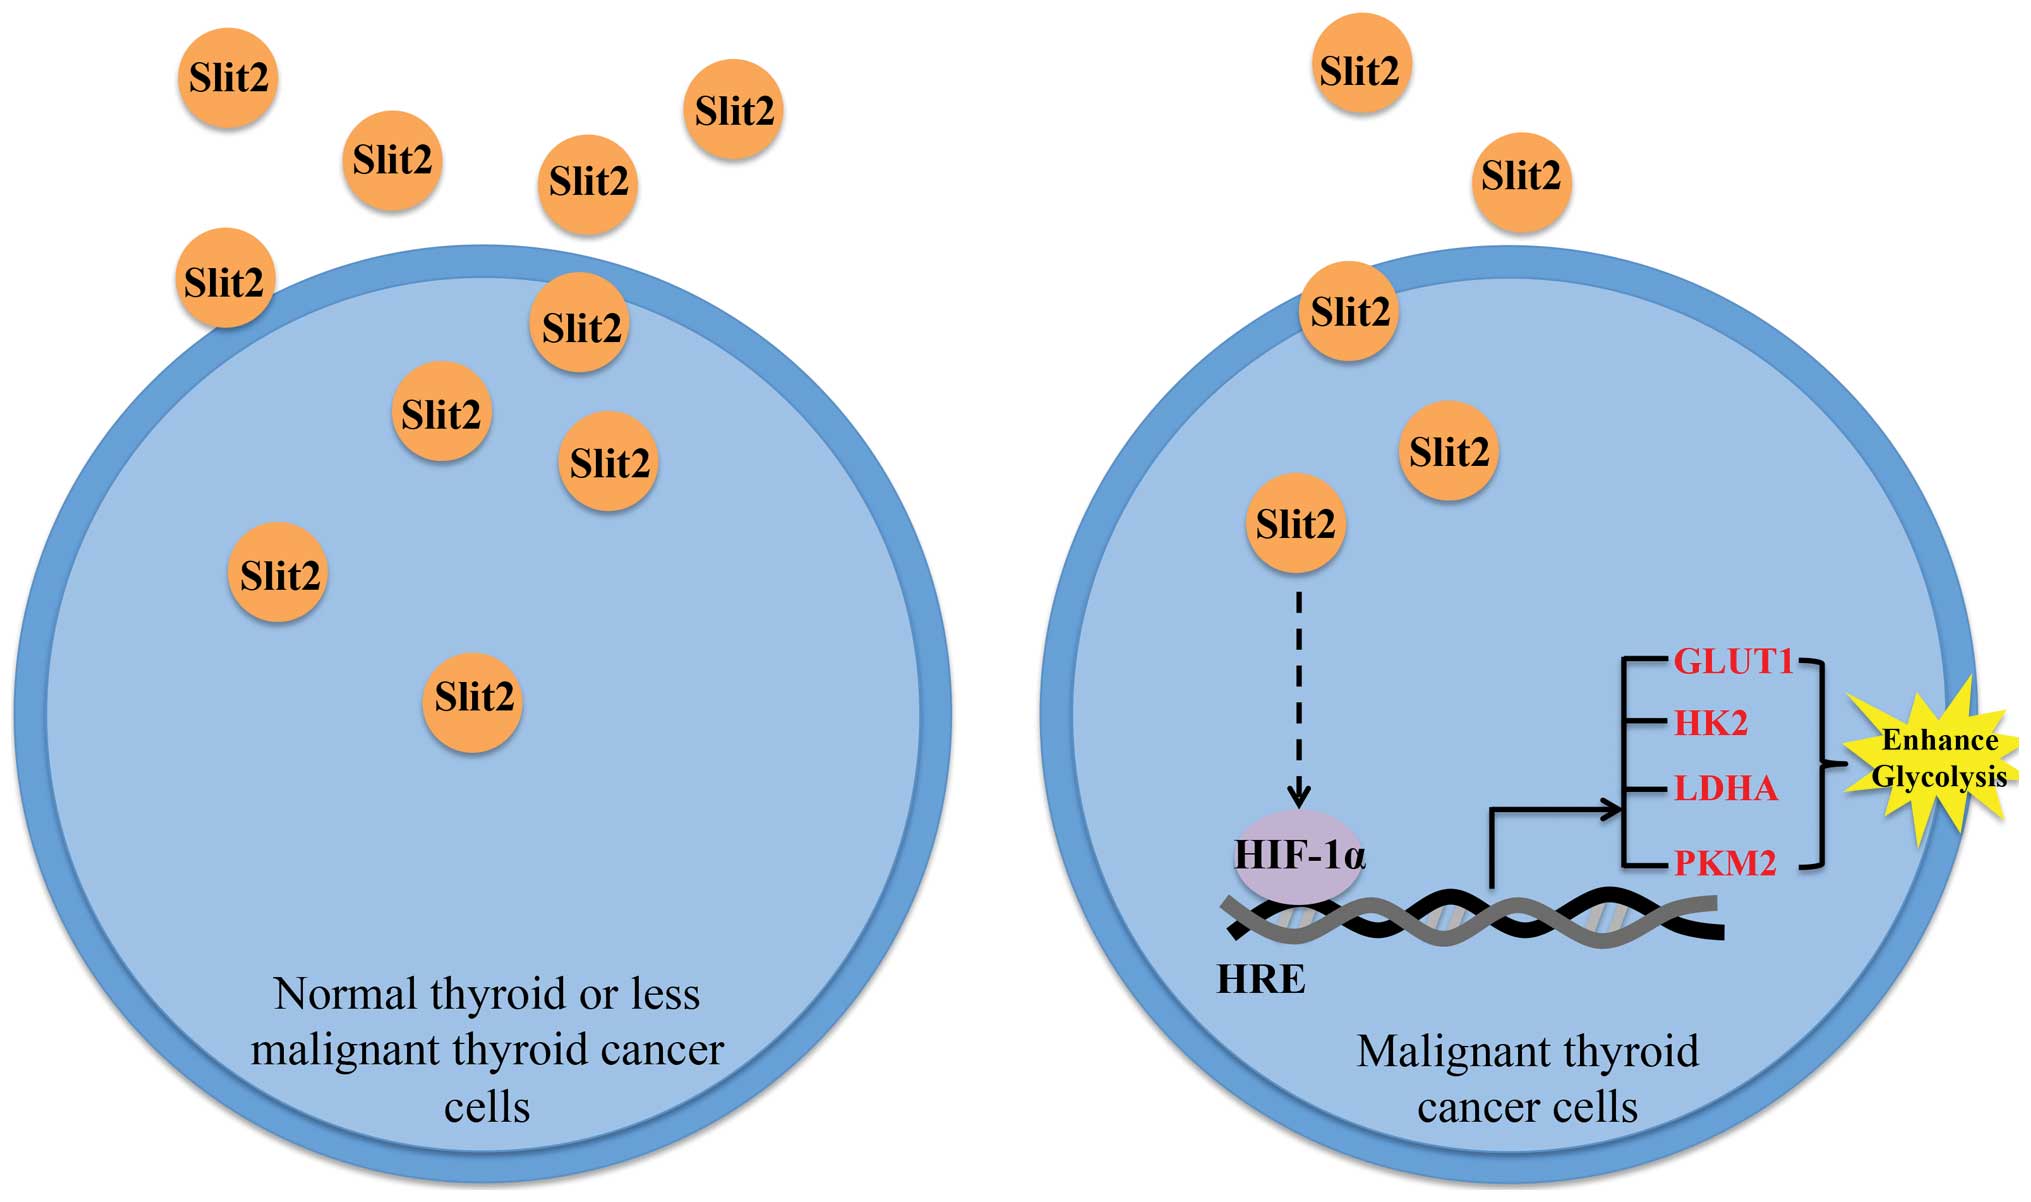
Schematic representation of the working
model
In conclusion, we found that decreased Slit2
expression in PTC sample renders a proliferation advantage to PTC
cells, the potential mechanism may involve the participation of
Slit2 in HIFα control (Fig.
7).
Discussion
Slit2 plays an important role in the regulation of
many signaling pathways such as cell cycle, apoptosis, migration
and invasion. In recent years, the role of Slit2 in cancer has
received much attention, though its role in cancer is
controversial. Slit2 inactivation by promoter hypermethylation of
allele loss in lung, breast, liver, and malignant glioma supported
the notion that Slit2 has antitumor function (17,18).
Slit2 can also inhibit metastasis of tumor cells through targeting
the AKT-GSK3β signaling pathway (19). On the contrary, exogeneous
expression of Slit2 induced epithelial-mesenchymal transition (EMT)
in colorectal cancer through E-cadherin degradation (20). Moreover, Slit2 could also activate
Rho GTPase family proteins such as Rac1 and Cdc42, which promotes
tumor cell migration, thus, making it a positive regulator of
metastasis (10). Thus, the role
of Slit2 in cancer is distinct depending on the cancer type. Our
previous studies (15,16) in gastric cancer indicated that
Slit2 is a tumor suppressor. The expression of Slit2 was higher in
gastric patients with less advanced clinicopathological features.
Mechanistically it regulates cell malignancy through the
Akt/β-catenin signaling pathway. However, its role in PTC has not
been reported.
In the present study, we examined the expression and
function of Slit2 in PTC. The mRNA and protein levels of Slit2 in
PTC patient samples were examined by qPCR and IHC. Out of 130
paired specimens investigated by qPCR, the expression levels of
Slit2 were significant higher in adjacent non-tumor thyroid tissues
compared with PTC tissues. Moreover, the expression level of Slit2
was decreased in tumors without LNM. Similarly, IHC analysis data
were consistent with mRNA expression results. Using tissue
microarray containing samples from 196 patients, we observed that
Slit2 protein level decreased in PTC samples and in LNM samples.
Taken together, these results indicated that Slit2 may be a tumor
suppressor in PTC. To further validate the role of Slit2 in PTC, we
silenced Slit2 expression in the PTC cell line K1. Results
indicated that silencing Slit2 expression promoted cell
proliferation. The above results supported the notion that Slit2 is
a tumor suppressor in PTC.
To explore the mechanism, we examine the role of
Slit2 on PTC cell glucose metabolism transformation. It is well
accepted that cellular metabolism influence life and death
decisions (21). An emerging theme
in cancer biology is that metabolic regulation is tightly and
intricately linked to cancer progression, which is due to the basic
fact that cell proliferation is tightly regulated by availability
of nutrients that provide cells with building blocks for
macromolecule synthesis and energy production (22,23).
The most characterized is the glucose metabolism transformation
(24). PTC is one kind of solid
tumors, and sites of the tumor are at a great distance from the
supporting blood vessels, thus suffering from hypoxia, acidosis and
increased interstitial fluid pressure. To survive under such
hypoxic hazardous conditions, cancer cells shift their metabolism
pattern, known as hypoxic adaptation to meet demands of sustainable
growth and metastasis (25). One
such adaptation is glycolysis, also known as Warburg effect, which
provides a benefit to the tumors (26,27).
Our results demonstrated that silencing Slit2 expression promoted
glucose uptake and lactate production in K1 cells. Increased
glucose uptake ensures increased demands for biomass accumulation
and ATP requirement (28). Lactate
produced by glycolysis is not only used by mitochondrion for
further metabolism but also created an acidic microenvironment,
which leads to extracellular matrix destabilization that
facilitates metastasis (29,30).
The transcription factor HIF1α is a master regulator
of glycolysis and has been implicated in regulating many of the
genes that are responsible for the metabolic difference (31,32).
Our results have shown that silencing Slit2 increased HIF1α protein
level and transcriptional activity. The transcription of a series
of glycolytic rate-limiting enzymes, such as Glut1, HK2 and LDHA,
was significantly upregulated. All these results supported the
assumption that Slit2 is a negative regulator of glycolysis and
HIF1α is an effector protein.
In conclusion, the present study shows that Slit2
mRNA and protein levels were significantly reduced in thyroid
cancer specimens and were associated with prognosis and disease
progression. Moreover, our results provide clinical and in
vitro evidence implicating Slit2 functions as a negative
regulator in the development and progression of PTC. Further
mechanism analysis indicated that Slit2 regulated PTC glycolysis
via HIF1α. Thus Slit2 could be used as a prognostic factor and
treatment target for PTC.
Acknowledgements
The present study was supported by funds from the
National Science Foundation of China (nos. 81572622 and 81272934 to
Q.H.J.) and the Shanghai Rising-Star Program (no. 15QA1401100 to
Y.L.W.).
References
|
1
|
Faam B, Ghaffari MA, Ghadiri A and Azizi
F: Epigenetic modifications in human thyroid cancer. Biomed Rep.
3:3–8. 2015.
|
|
2
|
Kondo T, Ezzat S and Asa SL: Pathogenetic
mechanisms in thyroid follicular-cell neoplasia. Nat Rev Cancer.
6:292–306. 2006. View
Article : Google Scholar : PubMed/NCBI
|
|
3
|
Patel KN and Shaha AR: Poorly
differentiated and anaplastic thyroid cancer. Cancer Control.
13:119–128. 2006.PubMed/NCBI
|
|
4
|
Chen AY, Jemal A and Ward EM: Increasing
incidence of differentiated thyroid cancer in the United States,
1988–2005. Cancer. 115:3801–3807. 2009. View Article : Google Scholar : PubMed/NCBI
|
|
5
|
Davies L and Welch HG: Increasing
incidence of thyroid cancer in the United States, 1973–2002. JAMA.
295:2164–2167. 2006. View Article : Google Scholar : PubMed/NCBI
|
|
6
|
Li Y, Nakamura M and Kakudo K: Targeting
of the BRAF gene in papillary thyroid carcinoma (Review). Oncol
Rep. 22:671–681. 2009.PubMed/NCBI
|
|
7
|
Liu D, Hou J, Hu X, Wang X, Xiao Y, Mou Y
and De Leon H: Neuronal chemorepellent Slit2 inhibits vascular
smooth muscle cell migration by suppressing small GTPase Rac1
activation. Circ Res. 98:480–489. 2006. View Article : Google Scholar : PubMed/NCBI
|
|
8
|
Wu W, Wong K, Chen J, Jiang Z, Dupuis S,
Wu JY and Rao Y: Directional guidance of neuronal migration in the
olfactory system by the protein Slit. Nature. 400:331–336. 1999.
View Article : Google Scholar : PubMed/NCBI
|
|
9
|
Xu Y, Li WL, Fu L, Gu F and Ma YJ:
Slit2/Robo1 signaling in glioma migration and invasion. Neurosci
Bull. 26:474–478. 2010. View Article : Google Scholar : PubMed/NCBI
|
|
10
|
Wong K, Ren XR, Huang YZ, Xie Y, Liu G,
Saito H, Tang H, Wen L, Brady-Kalnay SM, Mei L, et al: Signal
transduction in neuronal migration: Roles of GTPase activating
proteins and the small GTPase Cdc42 in the Slit-Robo pathway. Cell.
107:209–221. 2001. View Article : Google Scholar : PubMed/NCBI
|
|
11
|
Wong K, Park HT, Wu JY and Rao Y: Slit
proteins: Molecular guidance cues for cells ranging from neurons to
leukocytes. Curr Opin Genet Dev. 12:583–591. 2002. View Article : Google Scholar : PubMed/NCBI
|
|
12
|
Qiu H, Zhu J, Yu J, Pu H and Dong R: SLIT2
is epigenetically silenced in ovarian cancers and suppresses growth
when activated. Asian Pac J Cancer Prev. 12:791–795.
2011.PubMed/NCBI
|
|
13
|
Dallol A, Morton D, Maher ER and Latif F:
SLIT2 axon guidance molecule is frequently inactivated in
colorectal cancer and suppresses growth of colorectal carcinoma
cells. Cancer Res. 63:1054–1058. 2003.PubMed/NCBI
|
|
14
|
Dallol A, Da Silva NF, Viacava P, Minna
JD, Bieche I, Maher ER and Latif F: SLIT2, a human homologue of the
Drosophila Slit2 gene, has tumor suppressor activity and is
frequently inactivated in lung and breast cancers. Cancer Res.
62:5874–5880. 2002.PubMed/NCBI
|
|
15
|
Shi R, Yang Z, Liu W, Liu B, Xu Z and
Zhang Z: Knockdown of Slit2 promotes growth and motility in gastric
cancer cells via activation of AKT/β-catenin. Oncol Rep.
31:812–818. 2014.
|
|
16
|
Shi R, Liu W, Liu B, Xu Z, Chen L and
Zhang Z: Slit2 expression and its correlation with subcellular
localization of β-catenin in gastric cancer. Oncol Rep.
30:1883–1889. 2013.PubMed/NCBI
|
|
17
|
Dallol A, Krex D, Hesson L, Eng C, Maher
ER and Latif F: Frequent epigenetic inactivation of the SLIT2 gene
in gliomas. Oncogene. 22:4611–4616. 2003. View Article : Google Scholar : PubMed/NCBI
|
|
18
|
Jin J, You H, Yu B, Deng Y, Tang N, Yao G,
Shu H, Yang S and Qin W: Epigenetic inactivation of SLIT2 in human
hepatocellular carcinomas. Biochem Biophys Res Commun. 379:86–91.
2009. View Article : Google Scholar
|
|
19
|
Chang PH, Hwang-Verslues WW, Chang YC,
Chen CC, Hsiao M, Jeng YM, Chang KJ, Lee EY, Shew JY and Lee WH:
Activation of Robo1 signaling of breast cancer cells by Slit2 from
stromal fibroblast restrains tumorigenesis via blocking
PI3K/Akt/β-catenin pathway. Cancer Res. 72:4652–4661. 2012.
View Article : Google Scholar : PubMed/NCBI
|
|
20
|
Zhou WJ, Geng ZH, Chi S, Zhang W, Niu XF,
Lan SJ, Ma L, Yang X, Wang LJ, Ding YQ, et al: Slit-Robo signaling
induces malignant transformation through Hakai-mediated E-cadherin
degradation during colorectal epithelial cell carcinogenesis. Cell
Res. 21:609–626. 2011. View Article : Google Scholar : PubMed/NCBI
|
|
21
|
Muñoz-Pinedo C, El Mjiyad N and Ricci JE:
Cancer metabolism: Current perspectives and future directions. Cell
Death Dis. 3:e2482012. View Article : Google Scholar : PubMed/NCBI
|
|
22
|
Dang CV: Links between metabolism and
cancer. Genes Dev. 26:877–890. 2012. View Article : Google Scholar : PubMed/NCBI
|
|
23
|
Deberardinis RJ, Sayed N, Ditsworth D and
Thompson CB: Brick by brick: Metabolism and tumor cell growth. Curr
Opin Genet Dev. 18:54–61. 2008. View Article : Google Scholar : PubMed/NCBI
|
|
24
|
Cairns RA, Harris IS and Mak TW:
Regulation of cancer cell metabolism. Nat Rev Cancer. 11:85–95.
2011. View
Article : Google Scholar : PubMed/NCBI
|
|
25
|
Meijer TW, Kaanders JH, Span PN and
Bussink J: Targeting hypoxia, HIF-1, and tumor glucose metabolism
to improve radiotherapy efficacy. Clin Cancer Res. 18:5585–5594.
2012. View Article : Google Scholar : PubMed/NCBI
|
|
26
|
Denko NC: Hypoxia, HIF1 and glucose
metabolism in the solid tumour. Nat Rev Cancer. 8:705–713. 2008.
View Article : Google Scholar
|
|
27
|
Keith B, Johnson RS and Simon MC: HIF1α
and HIF2α: Sibling rivalry in hypoxic tumour growth and
progression. Nat Rev Cancer. 12:9–22. 2011.PubMed/NCBI
|
|
28
|
Pereira KM, Chaves FN, Viana TS, Carvalho
FS, Costa FW, Alves AP and Sousa FB: Oxygen metabolism in oral
cancer: HIF and GLUTs (Review). Oncol Lett. 6:311–316.
2013.PubMed/NCBI
|
|
29
|
Bertout JA, Patel SA and Simon MC: The
impact of O2 availability on human cancer. Nat Rev Cancer.
8:967–975. 2008. View
Article : Google Scholar : PubMed/NCBI
|
|
30
|
Le A, Cooper CR, Gouw AM, Dinavahi R,
Maitra A, Deck LM, Royer RE, Vander Jagt DL, Semenza GL and Dang
CV: Inhibition of lactate dehydrogenase A induces oxidative stress
and inhibits tumor progression. Proc Natl Acad Sci USA.
107:2037–2042. 2010. View Article : Google Scholar : PubMed/NCBI
|
|
31
|
Vaupel P, Mayer A and Höckel M: Tumor
hypoxia and malignant progression. Methods Enzymol. 381:335–354.
2004. View Article : Google Scholar : PubMed/NCBI
|
|
32
|
Semenza GL: Defining the role of
hypoxia-inducible factor 1 in cancer biology and therapeutics.
Oncogene. 29:625–634. 2010. View Article : Google Scholar :
|