Introduction
Esophageal cancer ranks as the sixth most common
cancer death in the whole world (1). This disease is usually classified
into EAC (esophagus adenous cancer) and ESCC (esophageal squamous
cell carcinoma) based on histological types. EAC maily occurs in
European and American countries, while ESCC has a high incidence of
in China, accounting for >90% of esophageal cancer. Despite
decline in mortality over the past ten years, the prognosis of ESCC
is still very poor and the mortality of esophageal carcinoma ranks
the fourth cancer death in China (2). The challenge ahead is that tiology
and pathogenesis of ESCC are not yet clearly understood. The
incidence varies significantly among different regions (1). Recent studies have found that genetic
abnormality is one of the major causes of ESCC indicating that the
occurrence of ESCC may be related to the environmental factors, as
well as genetic factors (3).
Therefore, to achieve early accurate diagnosis, better curative
effect and prognosis assessment of ESCC, we need to understand the
pathogenesis at genomic level (4).
It is known that single stranded small molecule
RNA-non-encoding RNAs (microRNAs), with a length of ~21–25 nt basic
group, play a negative regulatory function in post transcriptional
activity. A large number of studies have described the role of
microRNA in tumorigenesis, development and metastasis of cancer
(5–8). Additionally, non-encoding RNAs with
long chain (long non-coding RNAs, lncRNAs) are a branch of
non-encoding RNA transcript with >200 nucleotides in length and
account for 80% of non-encoding RNA or more (9–11).
LncRNAs mainly achieve the regulation of gene expression in three
levels, which are epigenetic regulation, transcriptional
regulation, and post-transcriptional regulation (12,13).
Considering the number, type, function and action mechanism of
lncRNAs are far more abundant than miRNA, and lncRNAs may be the
core of RNA world (14),
increasing number of studies show that lncRNAs have a great
potential to be served as biomarkers for tumorigenesis, metastasis
and prognosis (15–17), and they are likely to be a new
target for cancer therapy (18–20).
Therefore, we explored the potential roles of
lncRNAs involved in ESCC in this study. We performed a genome wide
profiling of lncRNA expression, and investigated the potential
function of these distinguishable lncRNAs, and predicted lncRNAs
target genes, and observed the relationship between expression
level of lncRNAs and clinicopathological features, prognosis in
patients with ESCC to find new bio-molecular markers.
Materials and methods
Patients and tissue samples
ESCC tissue samples and matched non-cancerous
tissues ≥2 cm away from the edge of tumor tissues used in this
research were from 76 ESCC patients who underwent surgical
operation from March 2012 to October 2012 in Department of Thoracic
Surgery, Taizhou People's Hospital Affiliated to Nantong and
Jiangsu University. All patients signed written consent before
esophagus resection. All specimens were stored at −80°C within 10
min of the resection. ESCC was confirmed by pathology, and clinical
data including age, sex, tumor size, T stage, N stage, M stage and
TNM stage were available for all the cases selected. We extracted 3
tissues for microarray assay, while the other 73 tissues were
examined by qRT-PCR for clinicopathologic analysis. The study was
conducted in compliance with Institutional Ethics Committee of
Taizhou People's Hospital Affiliated to Nantong and Jiangsu
University and the Helsinki Declaration.
RNA extraction
RNA was extracted from 76 pairs of frozen ESCC
tissues and matched adjacent non-cancerous tissues by TRIzol
reagent kit (Invitrogen, CA, USA). The primary procedures were
according to the manufacturer's protocol. The total RNA was
subpackaged separately and preserved at −80°C. The concentration
and purity of RNA was detected by UV spectrophotometer according to
the absorbance values at 260 and 280 nm of wavelength.
Microarray analysis
Agilent Human lncRNA Micro-array V2.0
(4*180K; Design ID, 062918; containing 46,506 lncRNAs)
was used to analyze the lncRNA expression profiling of tumor
tissues from ESCC patients. The lncRNA probes on gene chips were
based on the well-known lncRNAs from Agilent_ncRNA, lncRNAdb,
GencodeV13, H-invDB, NONCODEV3, RefSeq, ultra-conserved region
encoding lncRNAs (UCR), UCSC_lincRNAs Transcripts and Ensembl.
Three ESCC tissues and three matched non-cancerous tissues were
analyzed by microarray as follows: i) 200-ng of total RNA from each
specimen was applied to generate synthetic double stranded cDNA by
Quick Amp Labeling kit, One-Color (Agilent p/n 5190-2305); ii)
subsequently, the double stranded cDNA as a template was
transcribed into cRNA by RNeasy Mini kit (Qiagen p/n 74104) and
labeled with Cy3-dCTP; iii) labeled cRNAs were hybridized to the
gene microarray; iv) the microarrays were washed and scanned by an
Agilent G2505C Microarray Scanner; v) the raw data were analyzed
from array images by Feature Extraction software (version10.7.1.1,
Agilent Technologies). The standardized data analyses and
subsequent data processing were done by Genespring (version 12.5,
Agilent). The microarray hybridization was performed by Outdo
Biotech, Shanghai, China.
Quantitative real-time polymerase chain
reaction
In accordance to the manufacturer's protocol
(Takara, Dalian, China), 2 μg of the above total RNA
extracted from ESCC tissues and matched non-cancerous tissues was
reverse transcribed to cDNA, respectively. Additionally, then the
real-time PCR reactions were executed by SYBR PrimeScript (Takara)
and the ABI7900 (Applied Biosystems, CA, USA) as follows: i)
initial denaturation for 30 sec at 95°C; ii) 40 cycles for 5 sec at
95°C and for 30 sec at 59°C. Each sample was executed in
triplicate. GAPDH was used as reference. The expression levels of
lncRNAs were calculated by the 2−ΔΔCT method. The primer
sequences are summarized in Table
I.
 | Table IThe primer sequences used in
RT-PCR. |
Table I
The primer sequences used in
RT-PCR.
| Gene symbol | Forward primer | Reverse primer |
|---|
| TCONS_00017817 |
ACTCTCTGGGAGTTGAGAT |
TAGGAATTGGATGACTCACGA |
| NONHSAT142035 |
ATTTAAGACAAGTCTGGAAAGT |
ATGGAAATAAGTTCTTAGAGTT |
|
ENST00000480669 |
CAGGCGCGGAGAGGCGCT |
CTGCTCTGCTCACAGAAAC |
| NR_036468.1 |
GCTTGGTGGTACATGAAGT |
TGATGGACCAAATGGCTCTGA |
| XR_241594.1 |
TGTTGCTGCTTTGCATTT |
TGTGAGTTCTCACAGCAC |
| NONHSAT104436 |
GTCATCTGCCCTTCTGTC |
ACTGGCAAAGTCAGTAGAAT |
|
ENST00000539535 |
ACCAAGTCTTTCTTCCCATC |
AGCAGTCTATGTCCAAAGTT |
| NONHSAT066293 |
AAATCCTGGAACTGCTGAA |
CAGGGCTTGGAATGTGAG |
| NONHSAT147911 |
CGCTGATCCAGTGACAAT |
TTGTGGTTGGAGGAGCTT |
| XR_248864.1 |
GGAGTTATTAGGGTGCATCC |
TCTAGCTTAGAAGTCCTCGG |
| NONHSAT112918 |
GGTCCTACAGGGACTTGA |
ATTTCCTTATGTTGCTGCCA |
| NONHSAT126998 |
ATGACCAAACAAGGGTTAGT |
CATAGGTCAAGAGTGAGGAT |
| GAPDH |
GAGTCAACGGATTTGGTGGT |
TTGATTTTGGAGGGATCTCG |
LncRNA co-expression analysis
For each significant differentially expressed
lncRNA, we calculate the Pearson correlation coefficients (PCCs) of
its expression value with expression value of each mRNA. The
absolute PCCs value >0.8 was considered meaningful. The PCCs
value ≤0.8 indicated negative correlation, and the value >0.8
indicated positive correlation. The P-value <0.05 was considered
significant. DAVID (http://david.abcc.ncifcrf.gov/gene2gene.jsp)
functional annotation database was used to analyze these
correlative genes.
GO and KEGG analysis
The interrelated coding genes were reassigned to
functional groups by Gene Ontology (GO: http://www.geneontology.org) and Kyoto Encyclopedia of
Genes and Genomes (KEGG: http://www.genome.jp/kegg) analysis. A brief overview
of the process was as follows: firstly, we computed coexpressed
mRNAs with each differentially expressed lncRNA, and then made up
functional enrichment analysis for the set of coexpressed mRNAs.
The enriched functional terms were used to predict functional term
of appointed lncRNA. Ultimately, we applied hypergeometric
cumulative distribution function to compute the enrichment of
functional term in annotation of coexpressed mRNAs. The functional
enrichment prediction of lncRNAs was based on biological processes,
molecular function, cellular component and specific pathways.
Cis analysis
lncRNAs regulate the target gene expression by
cis or trans mechanism. For analysis of the
cis regulatory roles, the co-expressed lncRNAs-mRNAs were
transcribed from the same local chromatin. Therefore, cis
analysis could be an effective way to predict the target genes of
lncRNAs. The potential cis-regulated mRNAs of lncRNAs had to
meet the two following conditions: i) the mRNAs loci to be within
300 kbp windows of the given lncRNA; ii) the PCCs of lncRNAs-mRNAs
coexpression were statistically significant (PCCs >0.8 or PCCs
≤0.8; and P<0.05). The cis-regulation regions were
identified according to their location distributions by UCSC Genome
Browser.
Trans analysis
Target genes of lncRNAs also can be determined by
trans mechanism. Firstly, we worked out each differentially
expressed IncRNA co-expressing coding genes and transcription
factor in ENCODE (Encyclopedia of DNA Elements) (21), then we calculated the significance
of differential genes enrichment in each TF term via hypergeometric
distribution test method. A P-value enriched with significance will
be returned after calculation: a small P-value indicated that
differential genes incur enrichment in that TF item. Next, we
counted the intersection of co-expressing coding gene sets of
lncRNAs and target gene sets of transcription factor/
chromatin-regulated compounds, assessing the enrichment degree of
the intersection by hypergeometric distribution, and obtaining the
transcription factor obviously correlated to the IncRNAs to detect
the transcription factors/chromatin-regulated factors probably
jointly exerting regulating effect with IncRNAs. Finally, visible
network diagrams based on the analysis result of hypergeometric
distribution were drawn.
Statistical analysis
The paired sample t-test was used to compare the
expression level of lncRNAs. PCCs were calculated to evaluate the
correlations between the expression level of lncRNAs and mRNAs. A
2-tailed Student's t-test was applied to compare the data on
clinicopathological characteristics. The survival with log-rank
score to examine the statistical significance was assessed using
Kaplan-Meier analysis. The relative risk was evaluated using the
multivariate Cox regression model, and hazard ratios with 95%
confidence intervals were quantified to calculate the results. All
statistical tests were analyzed with SPSS 17.0 System (SPSS,
Chicago, IL, USA). P-value <0.05 was considered having
statistical significance.
Results
lncRNA expression profile of ESCC
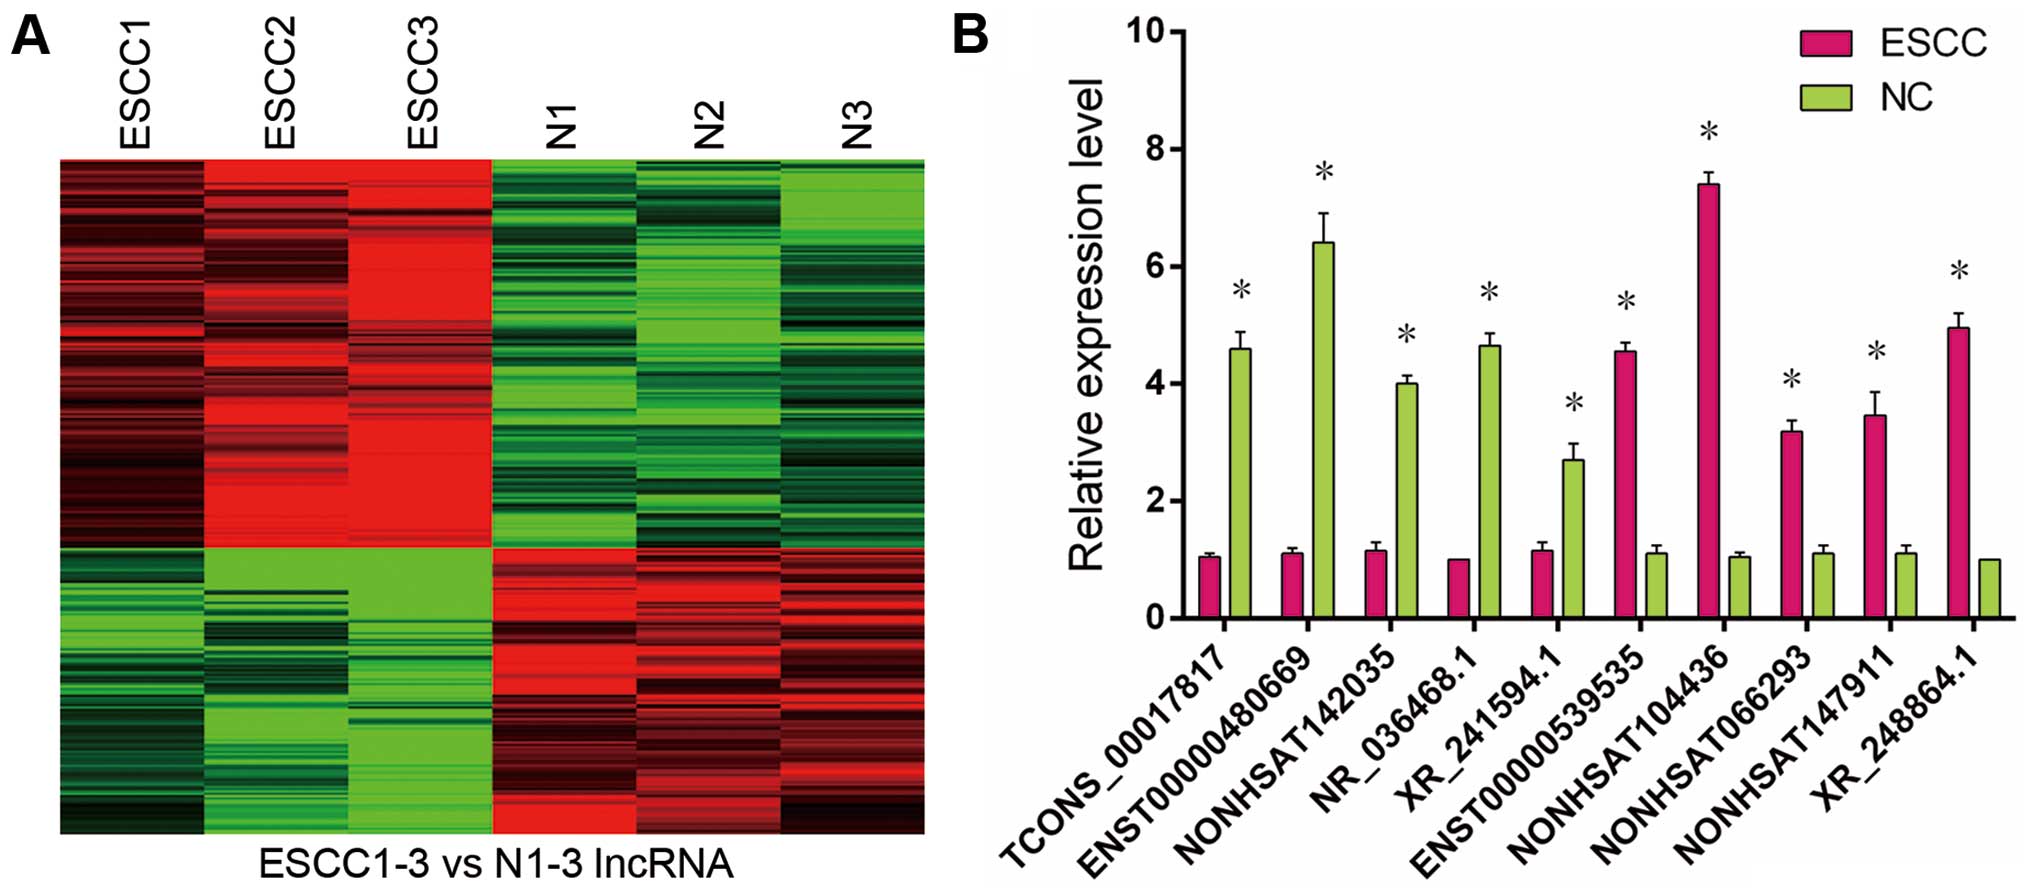
By comparing the lncRNA expression profiles in ESCC
tissues and paired non-cancerous tissues, we acquired hundreds of
differentially expressed lncRNAs from 3 patients with ESCC. The
criteria of significant differential lncRNAs expression were
defined as the absolute fold change (FC) value >2.0 and the
P-value <0.05. By the criteria mentioned above, the microarray
results displayed that 182 lncRNAs, 106 upregulated and 76
downregulated, were significantly changed in ESCC tissues compared
with paired non-cancerous tissues. The most upregulated lncRNAs
were NONHSAT104436, ENST00000539535, ENST00000589379, NONHSAT023881
and ENST00000598376, of which NONHSAT104436 showed the largest
upregulation (absolute FC, 27.25). The most downregulated lncRNAs
were ENST00000530190, NONHSAT047224, ENST00000480669, NONHSAT142201
and NONHSAT083762, of which ENST00000530190 showed the largest
downregulation (absolute FC, 17.88). The top 20 up- and
downregulated lncRNAs are listed in Table II. The hierarchical clustering of
the different expression lncRNAs among specimens were demonstrated
in the heat map (Fig. 1A). By
experimental experience, accurate and effective results of PCR
verification were more likely obtained for lncRNAs with absolute
value of FC >8. Therefore, we chose 10 significant
differentially expressed lncRNAs randomly from microarray results
(absolute FC >8) to validate using qRT-PCR (Fig. 1B). These data suggest that a range
of lncRNA expression abnormalities in ESCC could be involved in the
occurrence of ESCC.
| Table IIThe top 20 up- and downregulated
IncRNAs in ESCC compared with non-cancerous tissues. |
Table II
The top 20 up- and downregulated
IncRNAs in ESCC compared with non-cancerous tissues.
| Upregulated in
ESCC | Downregulated in
ESCC |
|---|
|
|
|---|
| lncRNA
(Database_ID) | Fold change | lncRNA
(Database_ID) | Fold change |
|---|
| NONHSAT104436 | 27.25 |
ENST00000530190 | 17.88 |
|
ENST00000539535 | 16.27 | NONHSAT047224 | 17.57 |
|
ENST00000589379 | 14.70 |
ENST00000480669 | 17.06 |
| NONHSAT023881 | 13.43 | NONHSAT142201 | 16.37 |
|
ENST00000598376 | 13.38 | NONHSAT083762 | 16.09 |
| NONHSAT092291 | 12.20 | NONHSAT081970 | 15.95 |
| NONHSAT132869 | 12.14 | NONHSAT066087 | 15.55 |
| NONHSAT115190 | 12.08 | NONHSAT067015 | 15.52 |
| NONHSAT126998 | 12.98 | NONHSAT142102 | 15.50 |
|
ENST00000418557 | 12.77 | NONHSAT131584 | 15.44 |
|
ENST00000563101 | 12.66 |
ENST00000434250 | 15.17 |
| NONHSAT091534 | 11.65 | NONHSAT075654 | 14.70 |
| NONHSAT015779 | 11.53 | NONHSAT083768 | 14.53 |
| NONHSAT112918 | 11.40 | NONHSAT145733 | 14.25 |
| NONHSAT103724 | 11.39 | NONHSAT059180 | 14.01 |
| NONHSAT114324 | 10.33 | NONHSAT083765 | 13.67 |
| NONHSAT119766 | 10.31 | NONHSAT146083 | 13.66 |
| NONHSAT121426 | 10.30 | NONHSAT003383 | 13.64 |
| NONHSAT056554 | 10.21 |
ENST00000605056 | 13.51 |
| NONHSAT015383 | 10.18 | NONHSAT015272 | 9.86 |
LncRNA-mRNA coexpression profiles and the
lncRNA function annotation
In order to investigate the function of lncRNAs with
significant differential expression in ESCC, we mapped the
lncRNA-mRNA coexpression pattern by calculating the PCCs of each
lncRNA and mRNA expression value. Each lncRNA was found to be
correlated with a set of mRNAs. As the file was too large, we
selected NONHSAT104436 from the 182 significantly differentially
expressed lncRNAs as a representative to explore the function of
lncRNAs. NONHSAT104436 showed the highest upregulated lncRNAs
(absolute FC, 27.25) among ESCC tissues versus paired non-carcinoma
tissues. As the standard of absolute PCCs value >0.8, a total of
1,969 genes (e.g., SOX2) were related to lncRNA NONHSAT104436. The
top 20 genes are listed in Table
III. Further, GO and KEGG pathways were applied to annotate the
lncRNA NONHSAT104436 co-expressed mRNA function. Altogether 370
enrichment GO terms were acquired. By the ranks of enrichment, the
top 20 reliably predicted terms from GO analysis are listed in
Table IV. It indicates that the
significantly enriched GO terms were involved in structural
constituent of ribosome, protein binding, angiotensin maturation,
regulation of cellular amino acid metabolic process and cytosolic
large ribosomal subunit. Moreover, the KEGG pathways analysis
results are listed in Table V,
including ribosome, proteasome, glyoxylate and dicarboxylate
metabolism, RNA degradation and arginine and proline
metabolism.
| Table IIIThe top 20 co-expressed genes of
lncRNA NONHSAT104436. |
Table III
The top 20 co-expressed genes of
lncRNA NONHSAT104436.
| Gene symbol | Corelation | P-value |
|---|
| SOX2 | −0.988169796 | 0.000209103 |
| LARP7 | 0.98941143 | 0.000167583 |
| PRMT2 | −0.988028411 | 0.000214121 |
| C1orf159 | 0.986012133 | 0.000292122 |
| GLIPR1 | 0.985335534 | 0.000320993 |
| TSSK2 | −0.98506196 | 0.000333051 |
| CATSPER3 | 0.984998918 | 0.000335861 |
| GULP1 | −0.98493821 | 0.000338578 |
| MS4A2 | −0.9847261 | 0.000348156 |
| SPTY2D1 | −0.98417941 | 0.000373457 |
| LOC390660 | 0.98307808 | 0.000427104 |
| RAB11B | −0.982256526 | 0.000469453 |
| SLC9A11 | −0.982017597 | 0.000482143 |
| SNX3 | −0.981356548 | 0.000518127 |
| FGL1 | 0.980857587 | 0.000546141 |
| ZNF773 | 0.980597985 | 0.000561005 |
| CD34 | −0.980127267 | 0.000588464 |
| SIRT2 | −0.979508095 | 0.000625575 |
| SLC25A26 | −0.978628587 | 0.000680225 |
| ATF4 | 0.978557598 | 0.000684736 |
| Table IVThe top 20 GO analysis enrichment
terms of lncRNA NONHSAT104436. |
Table IV
The top 20 GO analysis enrichment
terms of lncRNA NONHSAT104436.
| Enrichment
term | Description | List hits | P-value |
|---|
| GO:0003735 | Structural
constituent of ribosome | 27 | 0.000119393 |
| GO:0005515 | Protein
binding | 577 | 0.000184285 |
| GO:0002003 | Angiotensin
maturation | 6 | 0.000196547 |
| GO:0006521 | Regulation of
cellular amino acid metabolic process | 13 | 0.00020788 |
| GO:0022625 | Cytosolic large
ribosomal subunit | 13 | 0.000256284 |
| GO:0008083 | Growth factor
activity | 27 | 0.000353119 |
| GO:0006412 | Translation | 37 | 0.000372073 |
| GO:0001916 | Positive regulation
of T cell mediated cytotoxicity | 7 | 0.000383209 |
| GO:0005178 | Integrin
binding | 19 | 0.00046843 |
| GO:0012507 | ER to Golgi
transport vesicle membrane | 10 | 0.000528766 |
| GO:0031290 | Retinal ganglion
cell axon guidance | 7 | 0.000563342 |
| GO:0002486 | Antigen processing
and presentation of endogenous peptide antigen via MHC class I via
ER pathway, TAP-independent | 3 | 0.000576515 |
| GO:0046977 | TAP binding | 3 | 0.000576515 |
| GO:0061146 | Peyer's patch
morphogenesis | 3 | 0.000576515 |
| GO:0061574 | ASAP complex | 3 | 0.000576515 |
| GO:0072011 | Glomerular
endothelium development | 3 | 0.000576515 |
| GO:0060306 | Regulation of
membrane repolarization | 5 | 0.000702145 |
| GO:0060333 |
Interferon-γ-mediated signaling
pathway | 14 | 0.000776854 |
| GO:0016597 | Amino acid
binding | 7 | 0.000804767 |
| GO:0071353 | Cellular response
to interleukin-4 | 7 | 0.000804767 |
| Table VKEGG pathway analysis of lncRNA
NONHSAT104436 co-expressed genes. |
Table V
KEGG pathway analysis of lncRNA
NONHSAT104436 co-expressed genes.
| Enrichment
term | Description | List hits | P-value |
|---|
| path:hsa03010 | Ribosome | 25 | 0.0003345 |
| path:hsa03050 | Proteasome | 12 | 0.000374178 |
| path:hsa00630 | Glyoxylate and
dicarboxylate metabolism | 7 | 0.00537185 |
| path:hsa03018 | RNA
degradation | 14 | 0.005778636 |
| path:hsa00330 | Arginine and
proline metabolism | 12 | 0.00747148 |
| path:hsa00640 | Propanoate
metabolism | 7 | 0.010434297 |
| path:hsa03013 | RNA transport | 24 | 0.011041138 |
| path:hsa00250 | Alanine, aspartate
and glutamate metabolism | 8 | 0.011102205 |
| path:hsa04614 | Renin-angiotensin
system | 5 | 0.014622776 |
| path:hsa00380 | Tryptophan
metabolism | 8 | 0.024354511 |
| path:hsa03015 | mRNA surveillance
pathway | 14 | 0.032809394 |
| path:hsa05216 | Thyroid cancer | 6 | 0.041797251 |
| path:hsa00471 | D-glutamine and
D-glutamate metabolism | 2 | 0.043217651 |
| path:hsa04144 | Endocytosis | 27 | 0.043796016 |
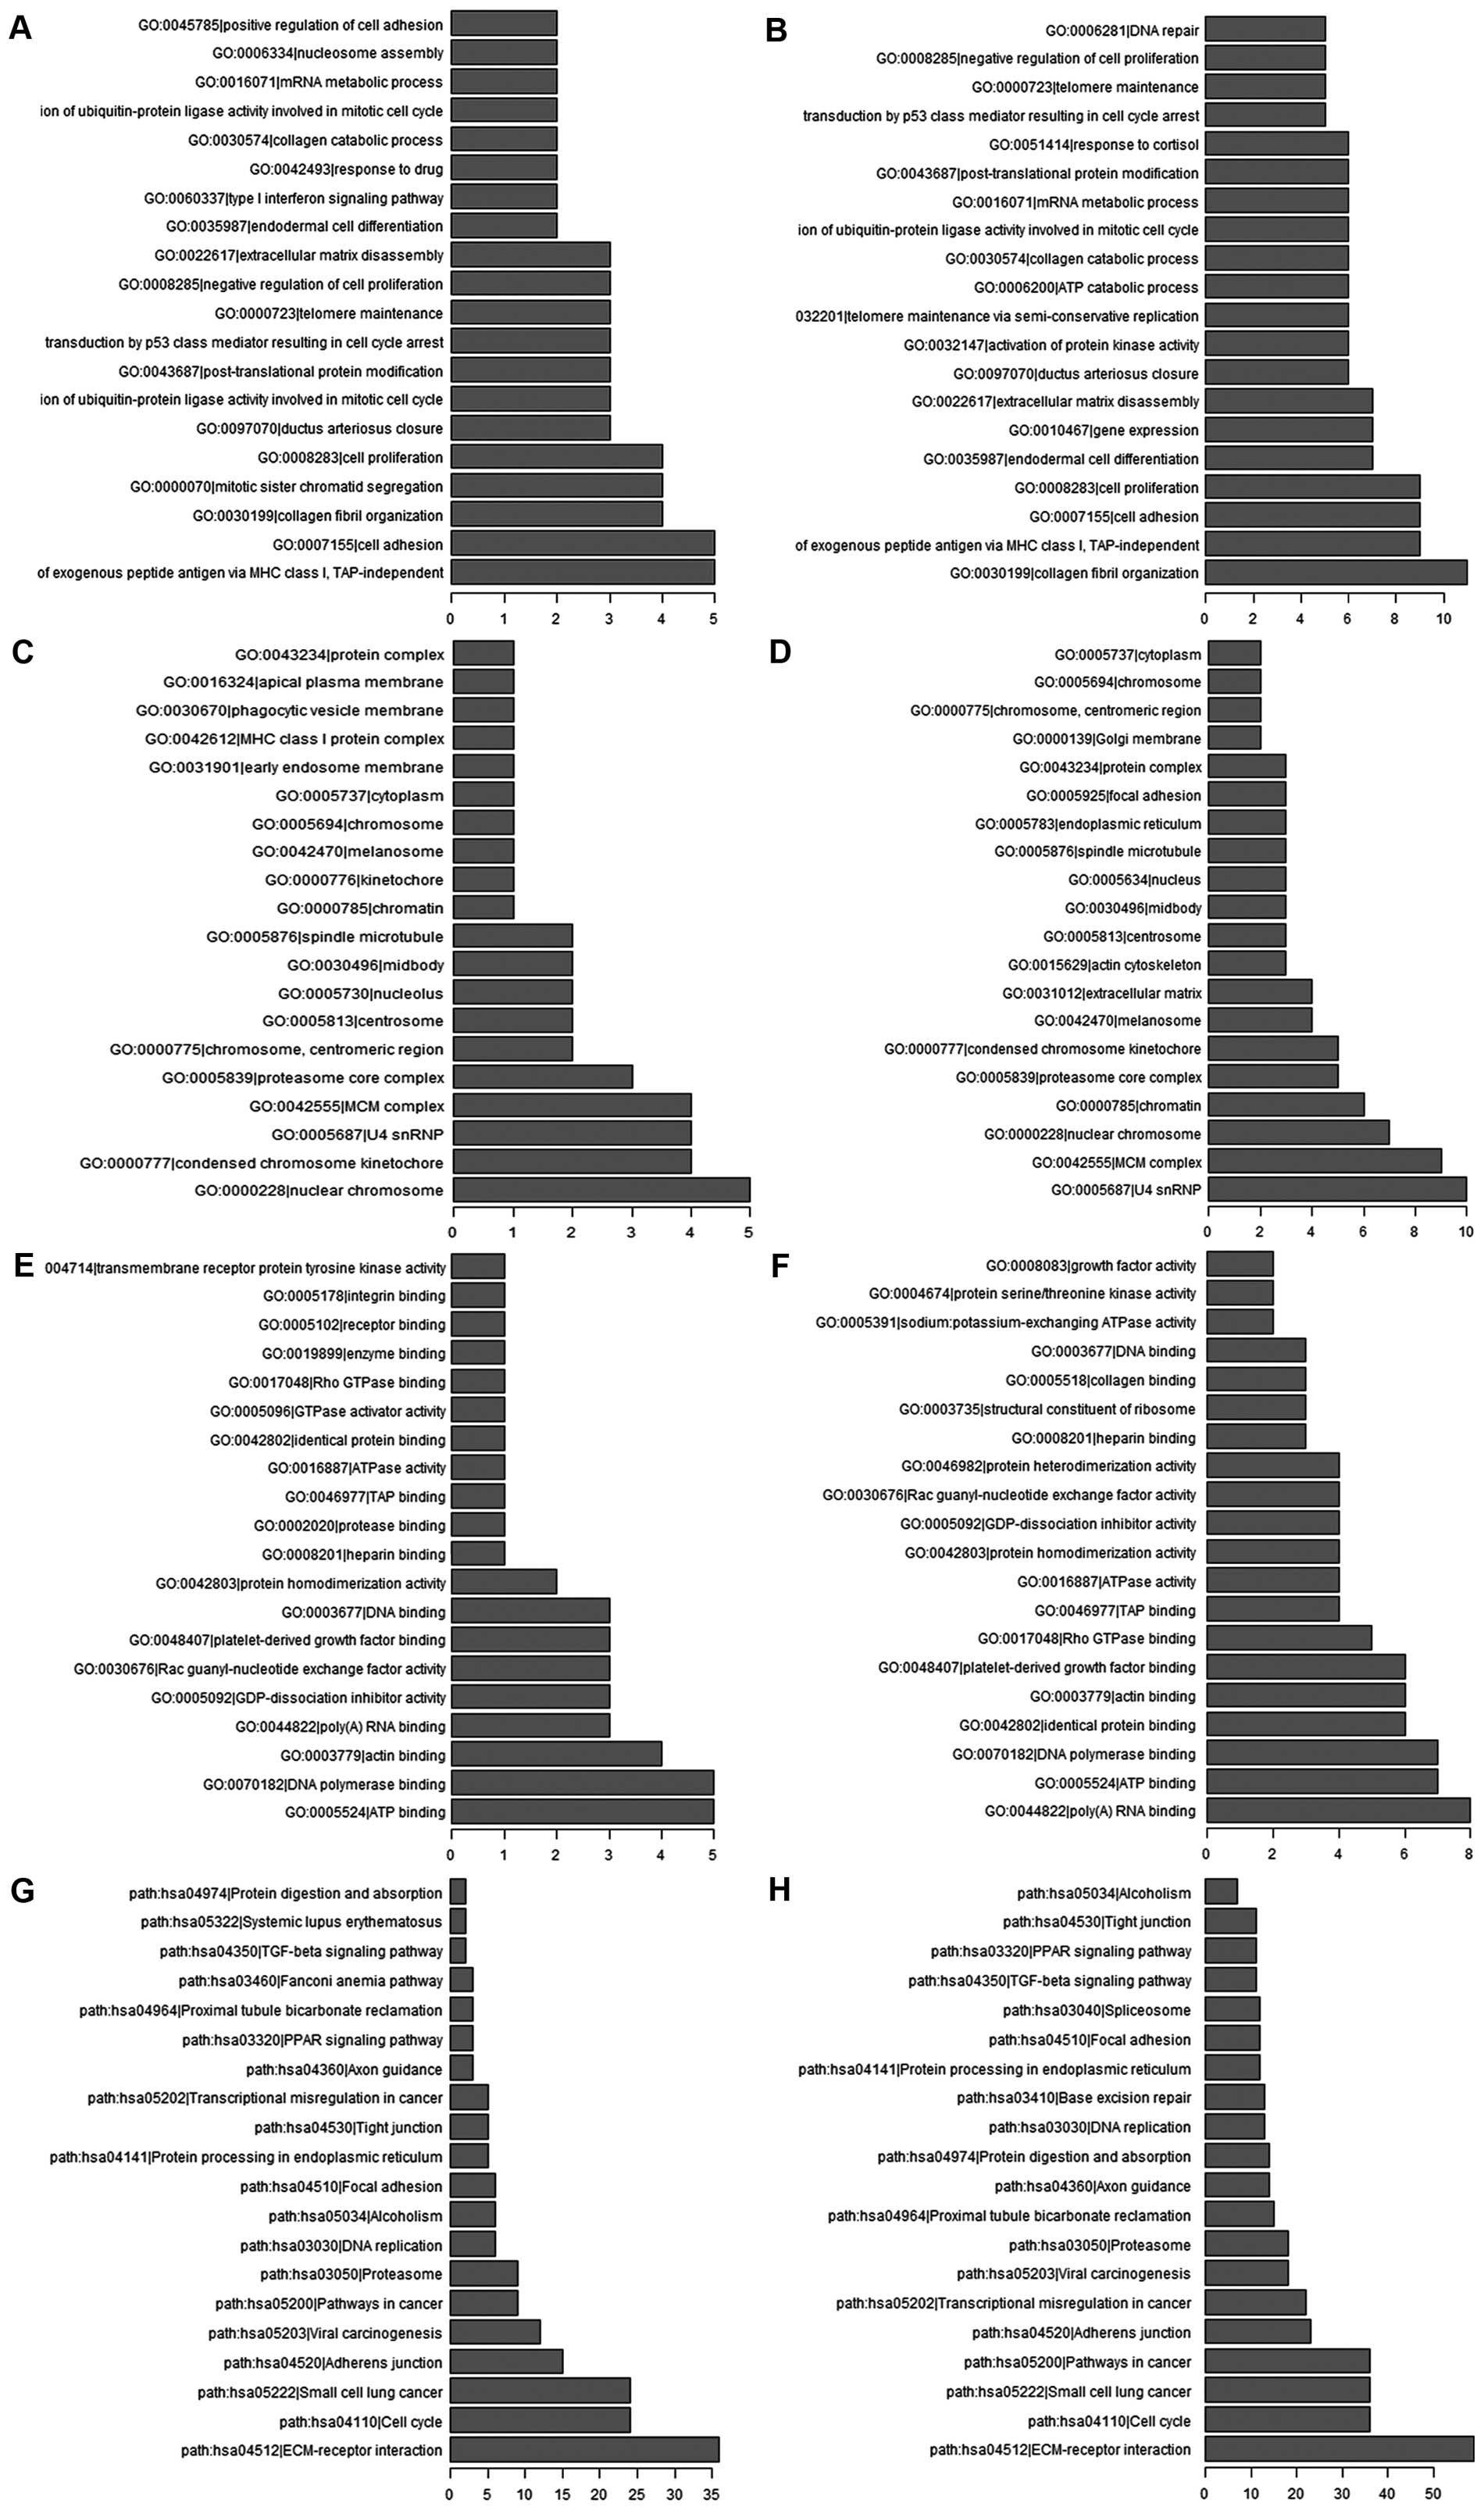
Then, the whole set of significantly differentially
expressed lncRNA co-expression mRNAs were also annotated by
applying GO and KEGG pathway analysis. Based on enrichment ranks,
the top 200 and 500 reliably predicted terms from GO and KEGG
pathway analysis were selected, respectively (Fig. 2). In our survey (Fig. 2A and B), the GO analysis showed
that the enrichment terms in biological process mainly included
TAP-independent, cell differentiation, collagen fibril
organization, cell proliferation and cell adhesion. With respect to
cellular components (Fig. 2C and
D), the significant enrichment terms connect with
differentially expressed lncRNAs mainly included nuclear
chromosome, condensed chromosome kinetochore, U4 snRNP, MCM complex
and proteasome core complex. Finally, ATP binding, DNA polymerase
binding, actin binding, poly(A)RNA binding and platelet-derived
growth factor binding were involved in the significant enriched
molecular function (Fig. 2E and
F). Likewise, the KEGG pathway analysis showed that the top
five enrichment terms (Fig. 2G and
H) were ECM-receptor interaction, cell cycle, small cell lung
cancer, viral carcinogenesis, pathway in cancer.
Analysis of cis regulatory mRNAs of the
aberrant lncRNAs
In order to predict the potential
‘cis-regulated mRNAs’ of lncRNAs, we identified the same
locus co-expressed genes within 300 kbp windows of the
significantly differentially expressed lncRNAs. Based on the
absolute PCCs value >0.8 and P-value <0.05, the results of
the cis prediction analysis are listed in Table VI. It included 50 significantly
differently expressed lncRNAs and 67 different mRNAs. Because some
genes had two or even more transcripts, the 50 lncRNAs had 85
cis genes (Table VI).
Among these, lncRNA TCONS_00012018 had 5 cis genes, and two
lncRNAs (NONHSAT119511 and TCONS_00017817) had 3 cis genes.
VEGFA and WISP1 were the cis genes of the aberrantly
expressed lncRNAs NONHSAT112918 and NR_037944.1, respectively.
| Table VILncRNAs and their cis genes in
the chromosome. |
Table VI
LncRNAs and their cis genes in
the chromosome.
| Target ID | Fold change | Gene symbol | Corelation |
|---|
|
ENST00000434250 | 15.17 | PHYHD1 | 0.847491793 |
|
ENST00000434250 | 2.31 | DOLPP1 | −0.844775134 |
|
ENST00000480669 | 17.06 | MYNN | −0.922763789 |
|
ENST00000480669 | 3.66 | MYNN | −0.853609445 |
| FR331033 | 2.09 | EFNB1 | 0.986834594 |
| NONHSAG001208 | 2.03 | PPCS | 0.91715456 |
| NONHSAG008446 | 2.65 | TMEM132A | 0.94221026 |
| NONHSAG008446 | 2.65 | MS4A18 | −0.839282644 |
| NONHSAG008447 | 2.22 | TMEM132A | 0.977419933 |
| NONHSAG008447 | 2.22 | TMEM109 | −0.873421131 |
| NONHSAG024488 | 5.19 | NFIC | 0.839314642 |
| NONHSAG024488 | 5.19 | TJP3 | 0.826013387 |
| NONHSAG024488 | 5.19 | FZR1 | −0.818436791 |
| NONHSAG030248 | 2.15 | STRADB | 0.945685017 |
| NONHSAG030248 | 2.15 | STRADB | 0.891826712 |
| NONHSAG047728 | 2.24 | LOC100506447 | 0.853688706 |
| NONHSAG052739 | 2.35 | CTSL1 | 0.936597756 |
| NONHSAT003287 | 2.11 | PODN | 0.983466994 |
| NONHSAT003383 | 10.18 | ACOT11 | 0.987214284 |
| NONHSAT003383 | 6.11 | ACOT11 | 0.851851246 |
| NONHSAT003383 | 6.11 | C1orf177 | 0.830504414 |
| NONHSAT010549 | 7.02 | KMO | 0.879006256 |
| NONHSAT013915 | 2.11 | DDIT4 | 0.935602917 |
| NONHSAT015779 | 11.53 | ENTPD1 | 0.936369963 |
| NONHSAT016005 | 2.3 | FAM178A | 0.898055251 |
| NONHSAT018044 | 2.05 | MICAL2 | 0.934861434 |
| NONHSAT023402 | 3.03 | ANKRD42 | 0.931194591 |
| NONHSAT023402 | 3.03 | ANKRD42 | 0.871767285 |
| NONHSAT028105 | 2.14 | SPATS2 | 0.92440566 |
| NONHSAT028105 | 2.14 | TROAP | 0.833886125 |
| NONHSAT028874 | 2.16 | NAB2 | 0.985654077 |
| NONHSAT037520 | 4.532 | GALNTL1 | 0.898048372 |
| NONHSAT042059 | 2.18 | CCNDBP1 | 0.991255862 |
| NONHSAT042059 | 2.18 | ADAL | 0.853427049 |
| NONHSAT042059 | 2.18 | TUBGCP4 | −0.826893233 |
| NONHSAT042184 | 7.01 | B2M | 0.981064031 |
| NONHSAT051867 | 2.30 | RAB11FIP3 | 0.828468513 |
| NONHSAT051867 | 2.30 | PIGQ | 0.821774805 |
| NONHSAT066040 | 2.12 | ZNF568 | −0.82107802 |
| NONHSAT066087 | 15.55 | ZNF570 | 0.938002312 |
| NONHSAT066293 | 8.76 | PLEKHG2 | 0.988420647 |
| NONHSAT066293 | 8.76 | PLEKHG2 | 0.988089203 |
| NONHSAT066293 | 8.76 | NCCRP1 | −0.83203032 |
| NONHSAT066293 | 8.76 | DLL3 | 0.81520705 |
| NONHSAT076108 | 2.08 | GLS | 0.978591053 |
| NONHSAT076120 | 2.36 | MYO1B | 0.942125167 |
| NONHSAT081970 | 15.95 | DOPEY2 | 0.890012356 |
| NONHSAT081970 | 2.70 | CBR3 | 0.842388559 |
| NONHSAT083006 | 2.19 | COL6A1 | 0.876584355 |
| NONHSAT083006 | 2.19 | COL6A2 | 0.876358371 |
| NONHSAT090846 | 2.19 | COL8A1 | 0.873385734 |
| NONHSAT112918 | 11.40 | VEGFA | 0.91993667 |
| NONHSAT115190 | 12.08 | TNFAIP3 | 0.959731249 |
| NONHSAT119551 | 4.70 | C7orf46 | 0.971787358 |
| NONHSAT119551 | 4.70 | C7orf46 | 0.95260555 |
| NONHSAT119551 | 4.70 | C7orf46 | 0.937119124 |
| NONHSAT119766 | 10.31 | CREB5 | 0.909097249 |
| NONHSAT130117 | 2.23 | MLANA | 0.890075793 |
| NONHSAT132869 | 12.14 | CTSL1 | 0.985462012 |
| NONHSAT143438 | 2.23 | IL34 | 0.973354259 |
| NONHSAT147911 | 9.79 | TNFRSF12A | 0.989875868 |
| NONHSAT147911 | 9.79 | THOC6 | 0.967139208 |
| NONHSAT147911 | 9.79 | IL32 | 0.9631379 |
| NONHSAT147911 | 9.79 | PAQR4 | 0.918730586 |
| NONHSAT147911 | 9.79 | KREMEN2 | 0.816564421 |
| NR_024341.1 | 2.21 | CACNA1B | 0.915462971 |
| NR_024341.1 | 2.21 | CACNA1B | −0.845942556 |
| NR_036468.1 | 9.52 | CIDEA | 0.948597107 |
| NR_036468.1 | 9.52 | SLMO1 | −0.942484643 |
| NR_036468.1 | 9.52 | IMPA2 | 0.832340155 |
| NR_036468.1 | 9.52 | IMPA2 | 0.825982055 |
| NR_037944.1 | 3.77 | WISP1 | 0.975128047 |
| NR_073516.1 | 2.49 | CPNE7 | 0.849947236 |
| TCONS_00006172 | 7.43 | P39195 | 0.881950723 |
| TCONS_00012018 | 2.67 | MLLT4 | 0.916817949 |
| TCONS_00012018 | 2.67 | MLLT4 | 0.916084696 |
| TCONS_00012018 | 2.67 | MLLT4 | 0.853744868 |
| TCONS_00012018 | 2.67 | MLLT4 | 0.842280628 |
| TCONS_00012018 | 2.67 | MLLT4 | 0.826596987 |
| TCONS_00014231 | 2.06 | ZNF862 | −0.818149074 |
| TCONS_00017817 | 8.09 | BMS1 | 0.95552454 |
| TCONS_00017817 | 8.09 | BMS1 | 0.948137275 |
| TCONS_00017817 | 8.09 | BMS1 | 0.88226429 |
| TCONS_00024250 | 8.95 | LOC729264 | 0.859340357 |
|
TCONS_l2_00008392 | 2.18 | LOC642311 | 0.948471492 |
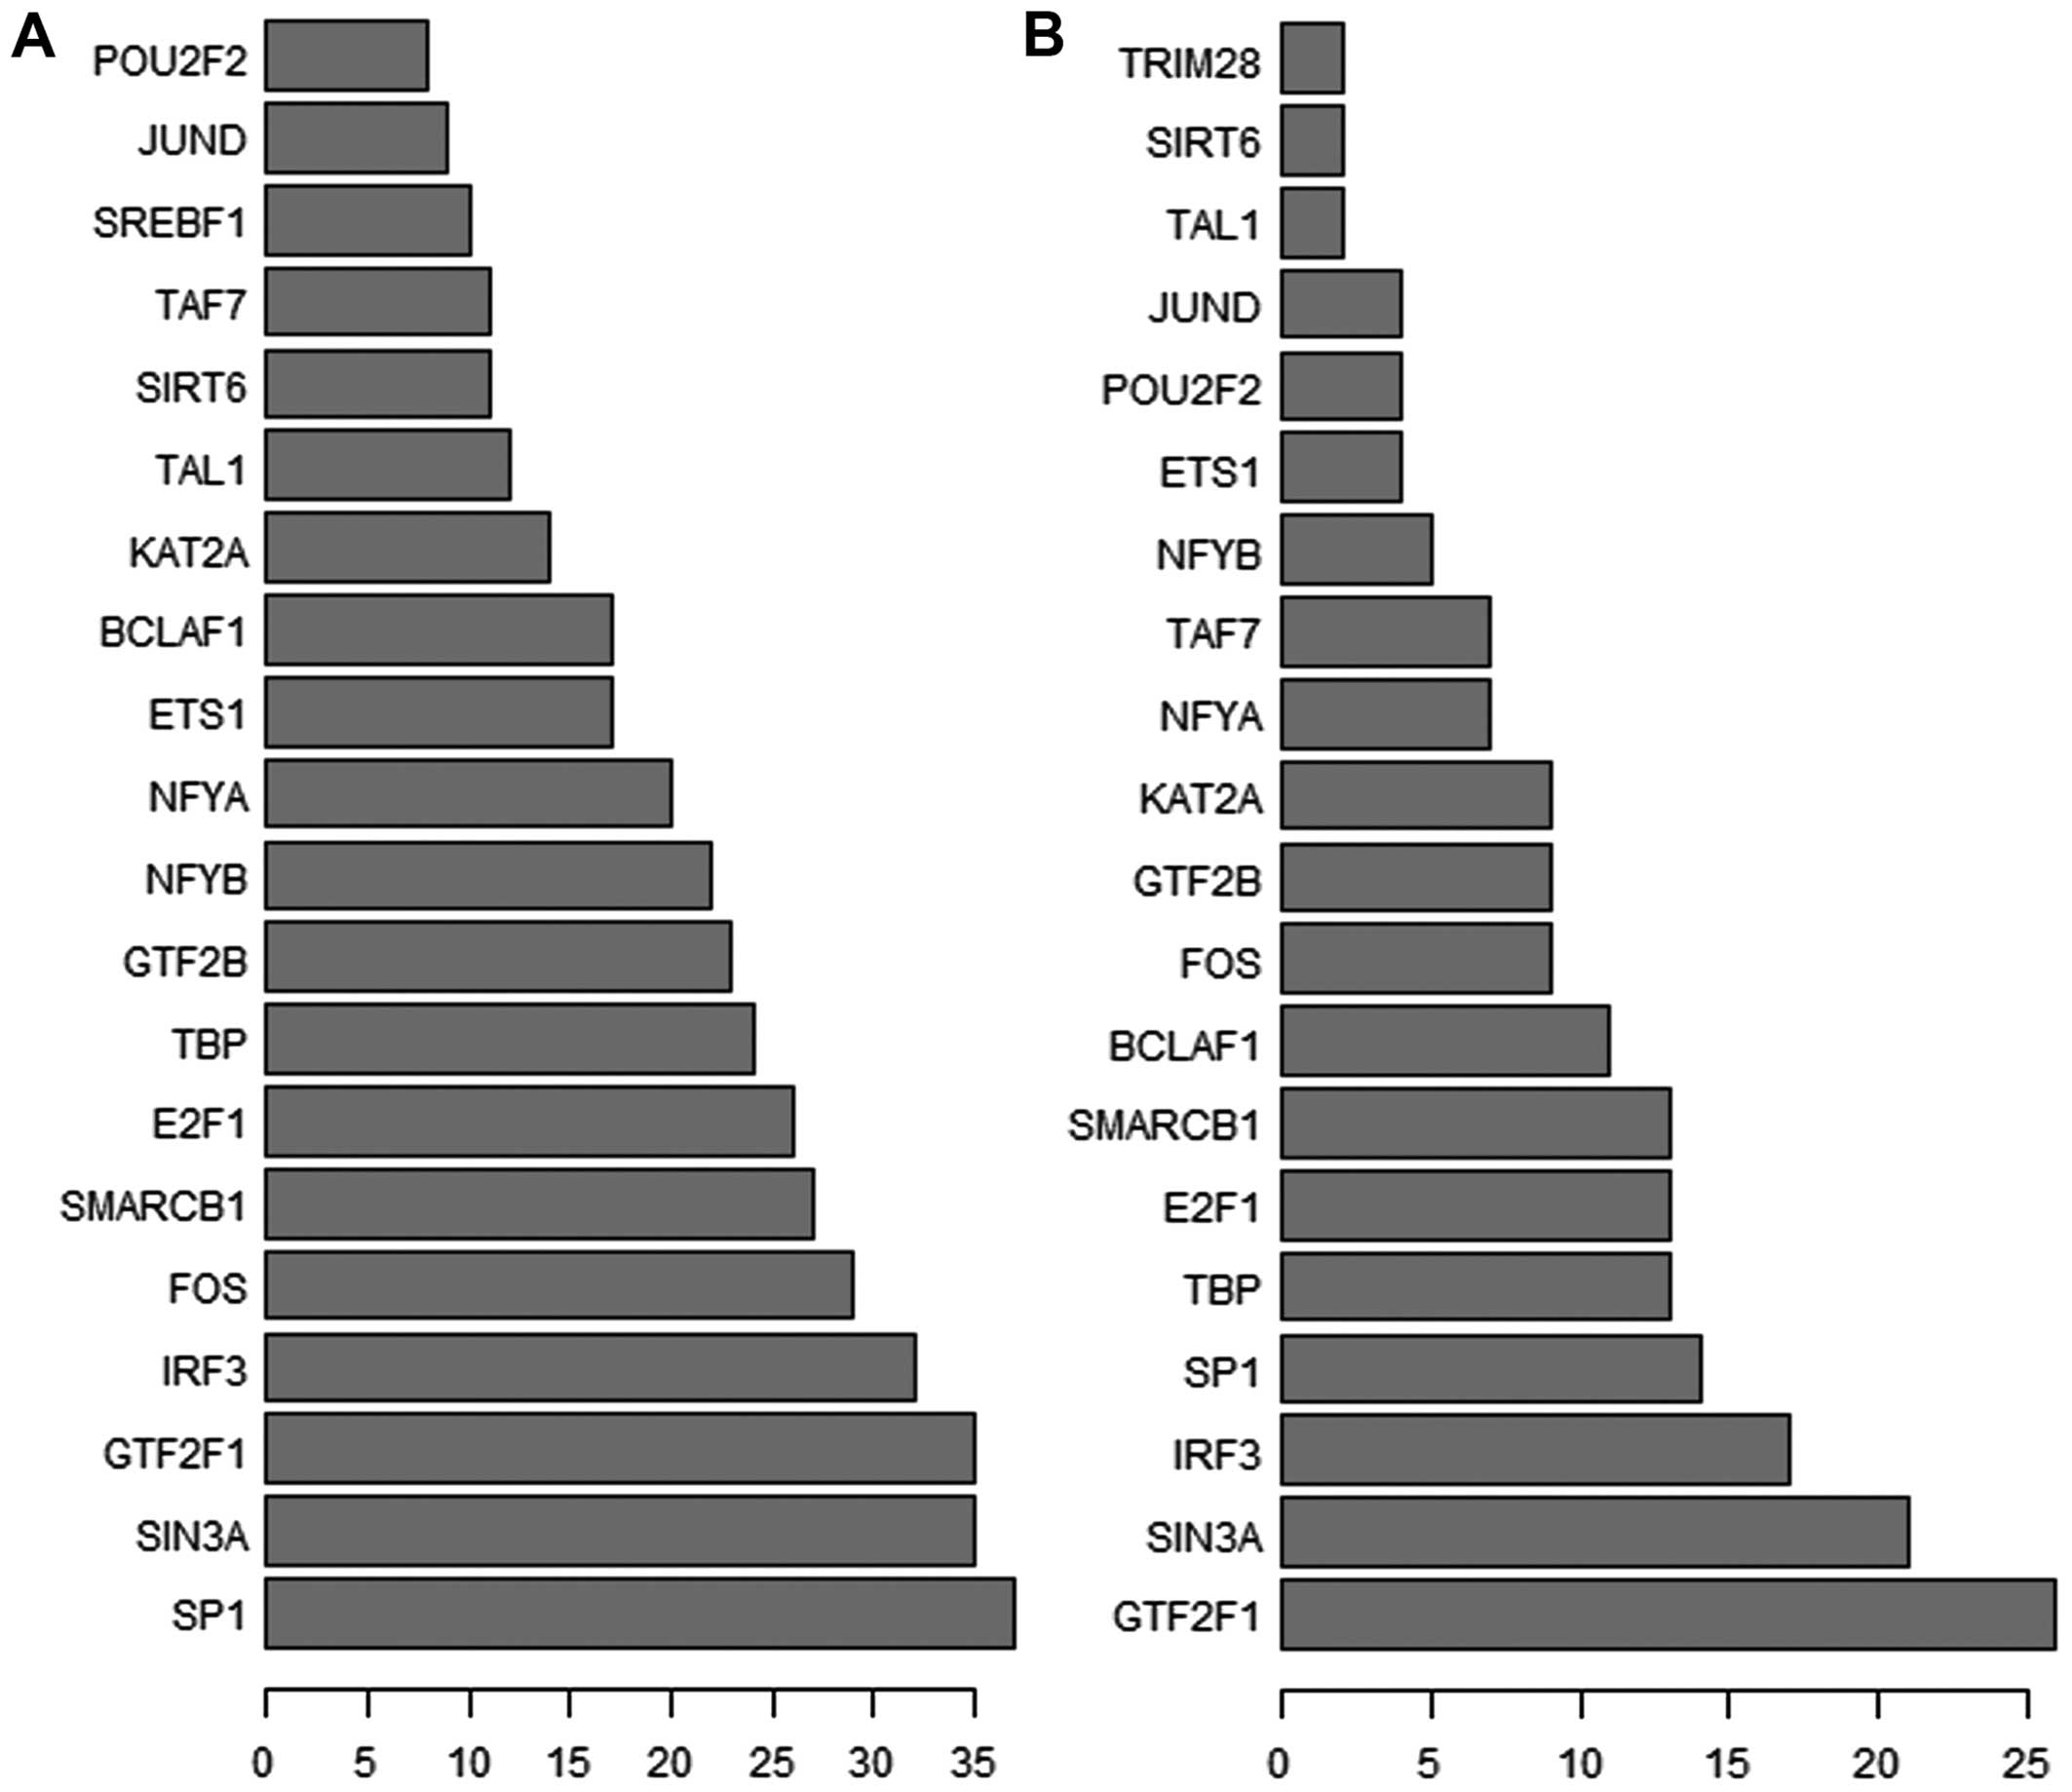
Analysis of trans regulatory mRNAs of the
aberrant lncRNAs
Transcription factors could mediate chromatin
regulation and transcription, which interact with many lncRNAs.
Therefore, trans regulatory mechanism could be another
useful indicator to predict lncRNA-target genes. In this study,
differentially expressed IncRNAs co-expressed coding genes
enrichment in TFs terms demonstrated that a total of 168 lncRNAs
were regulated by 95 TFs. Next, we selected the top 200 and top 500
according to predicted reliability rank in previously mentioned
relation of ‘IncRNA-TF’, recording the frequency of each TF and
summarizing those TFs with a great number of functional annotations
to reflect the overall function distribution of the differentially
expressed IncRNAs (Fig. 3). As
demonstrated in Fig. 3, these
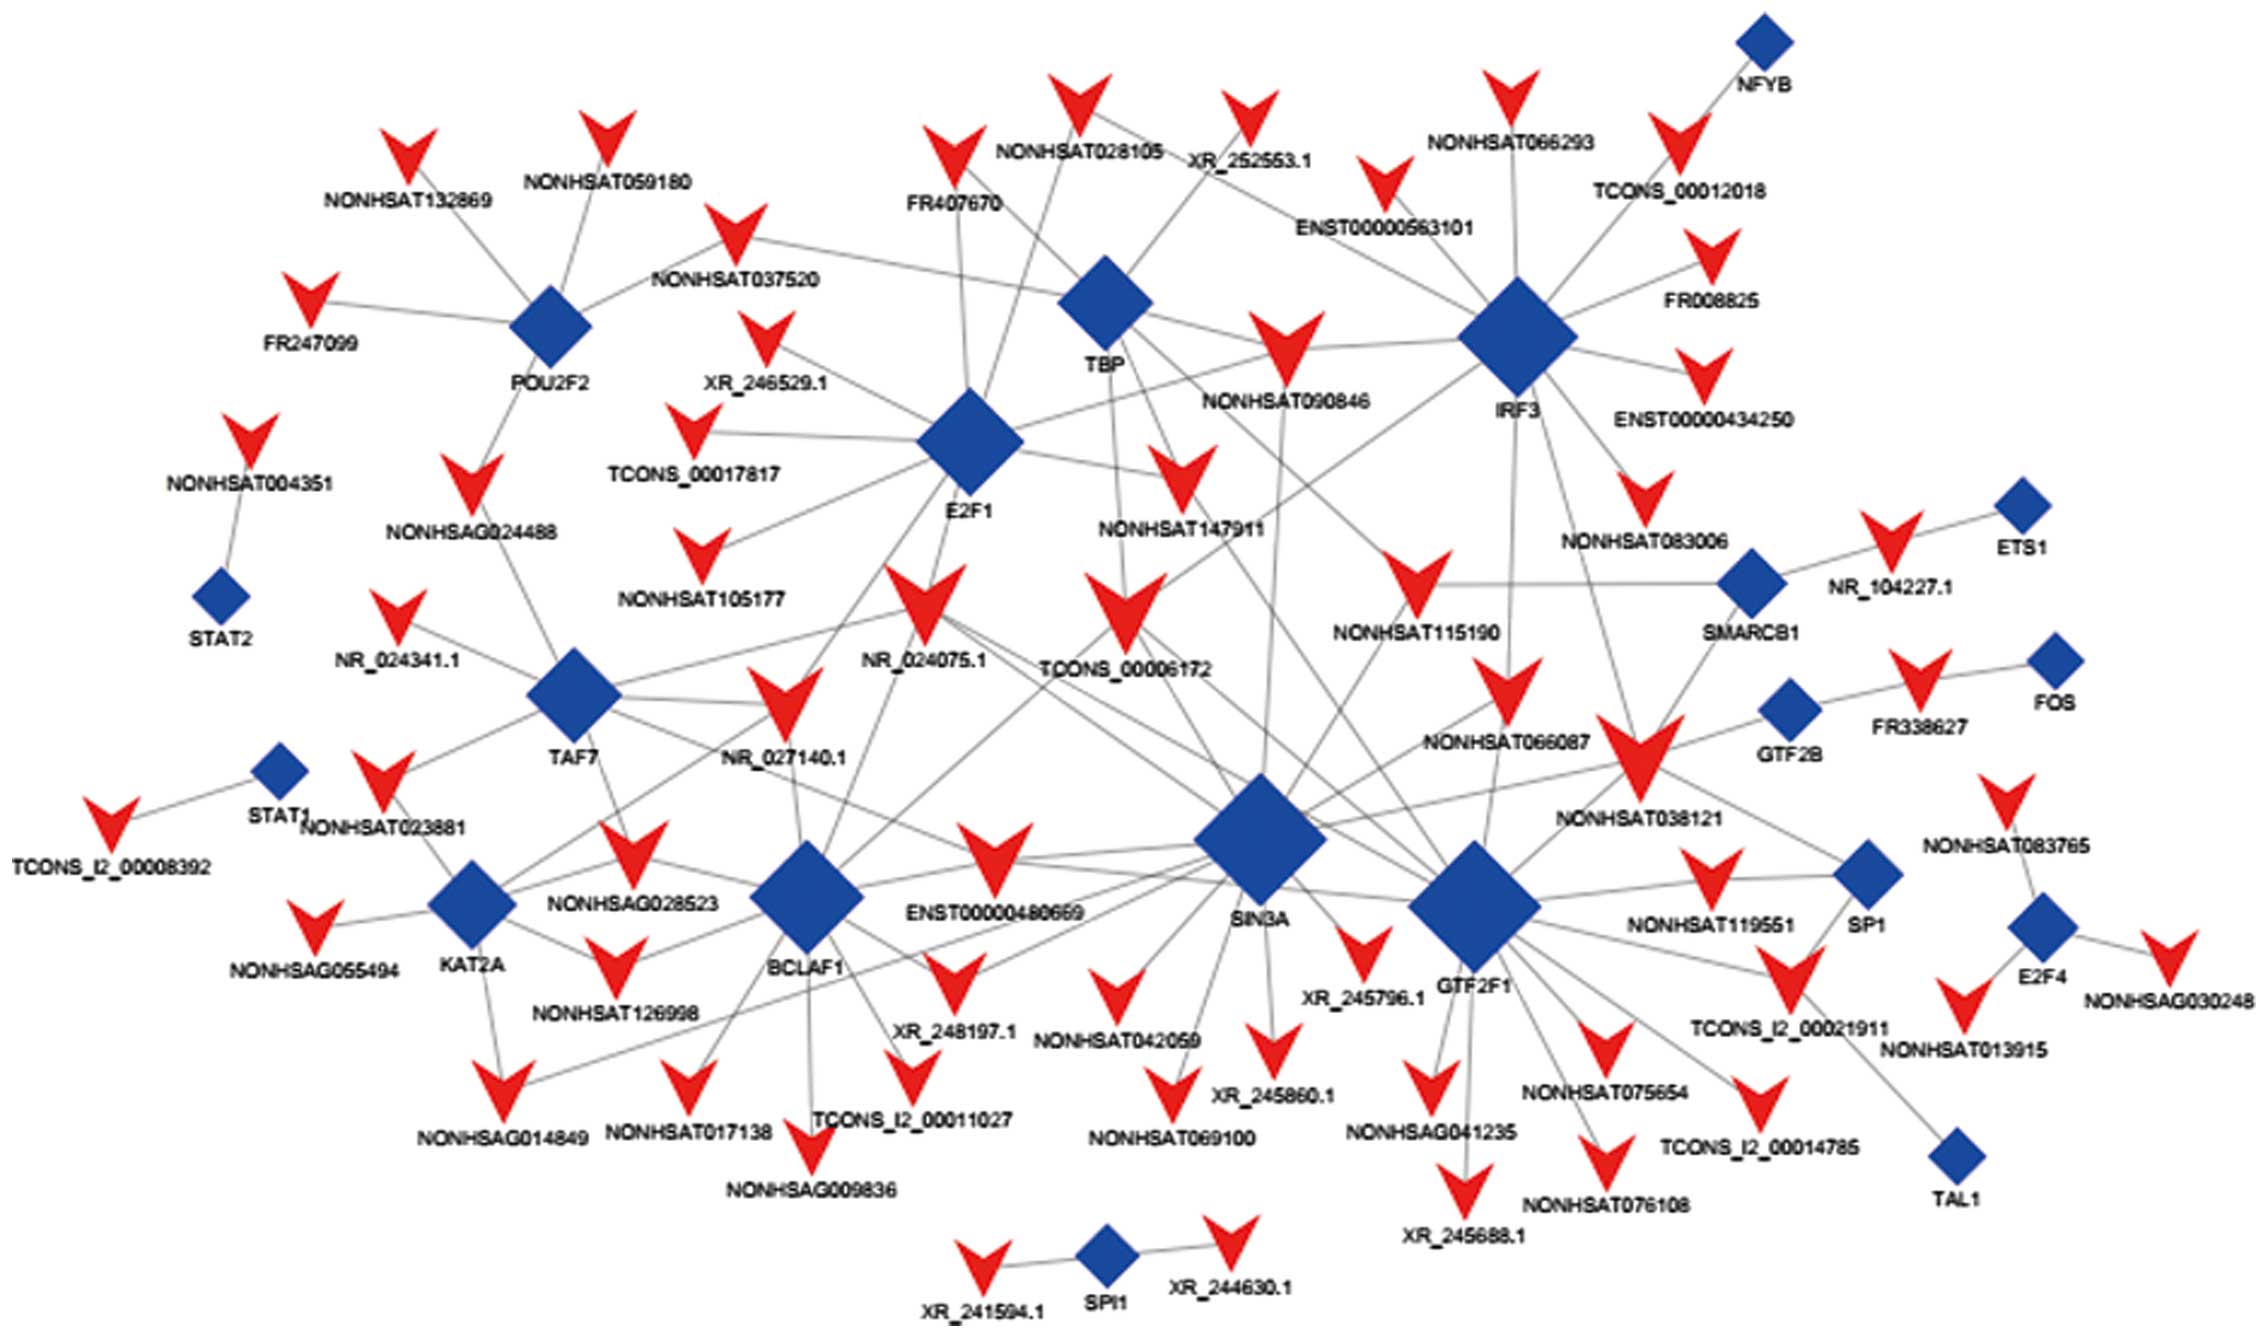
lncRNAs may be mostly regulated by the 20 TFs. As each lncRNA could
secure one to many TF-lncRNA relation groups, the network of
TF-lncRNA is too large. Therefore, we took the top 100 regulating
relations based on P-value to draw binary-relation network diagrams
using Cytoscape software (Fig. 4).
In Fig. 4, 56 lncRNAs and 20 TFs
were involved, and the transcription factors GTF2F1, SIN3A and IRF3
were the most invloved, which modulate 13, 13, and 11 lncRNAs,
respectively. Considering IncRNA-TF was derived from the enrichment
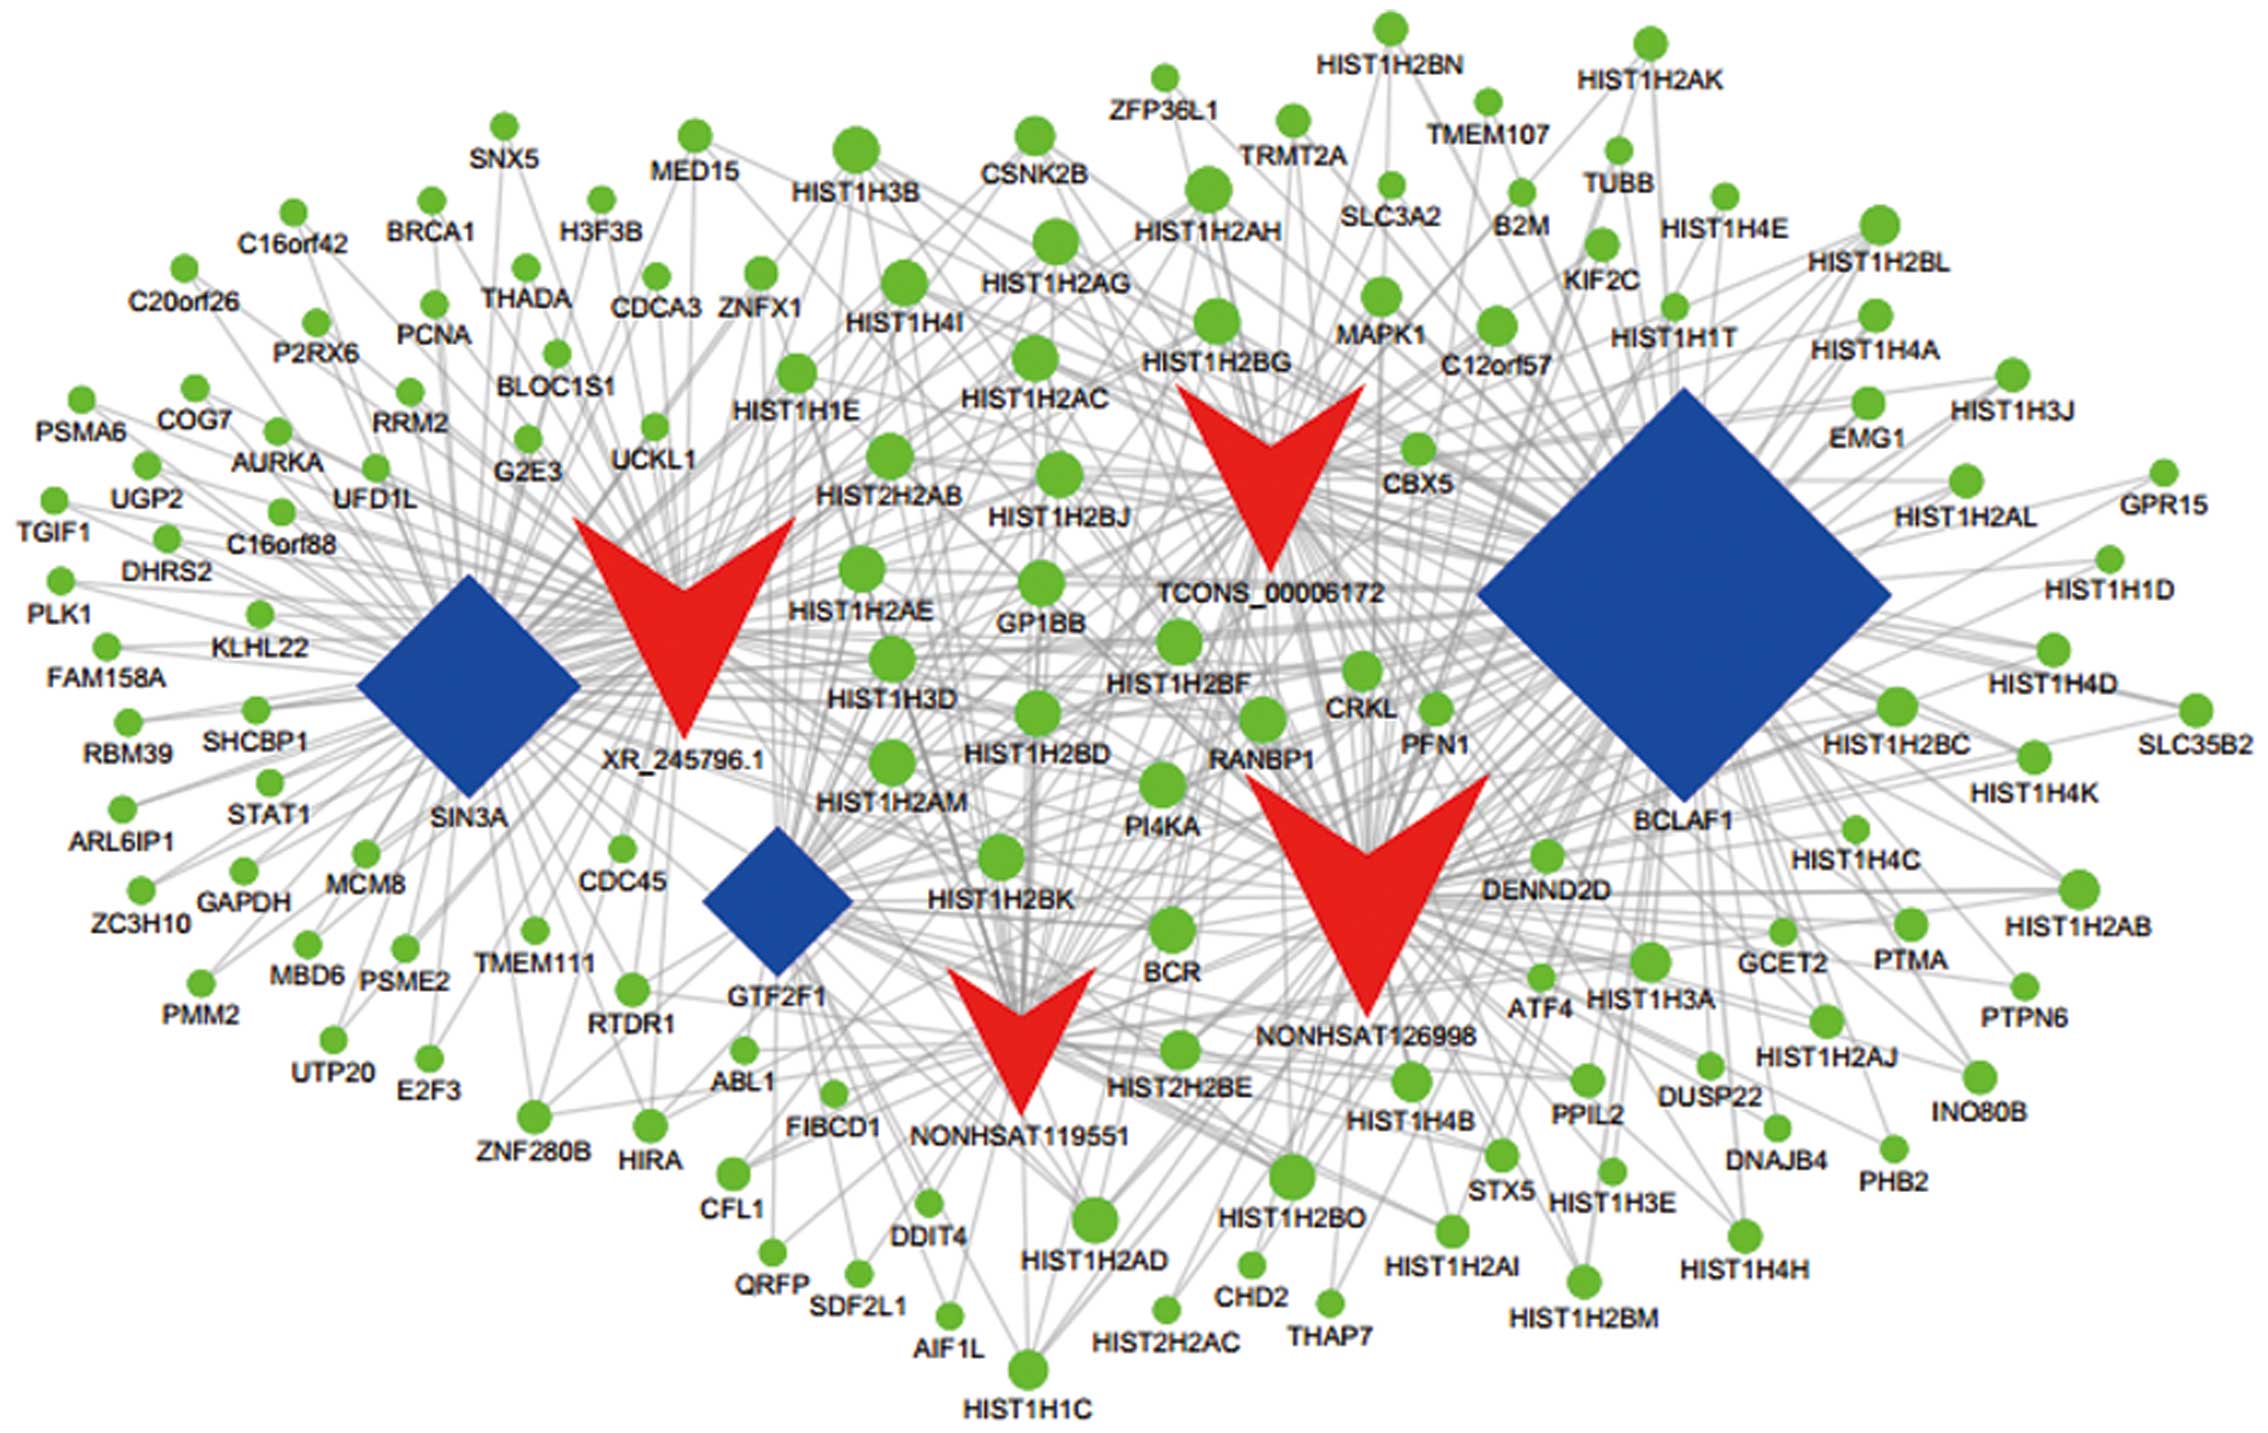
of various genes, we drew ternary-relation network diagrams on
account of the top 300 IncRNA-genes and TF-genes relation groups to
reflect the relationship of TFs, lncRNAs and target genes (Fig. 5). It includes 3 upregulated lncRNAs
(NONHSAT126998, TCONS_00006172 and XR_245796.1) and 1 downregulated
lncRNA (XR_245796.1), 3 TFs (BCLAF1, GTF2F1 and SIN3A) and 124
target genes in this map.
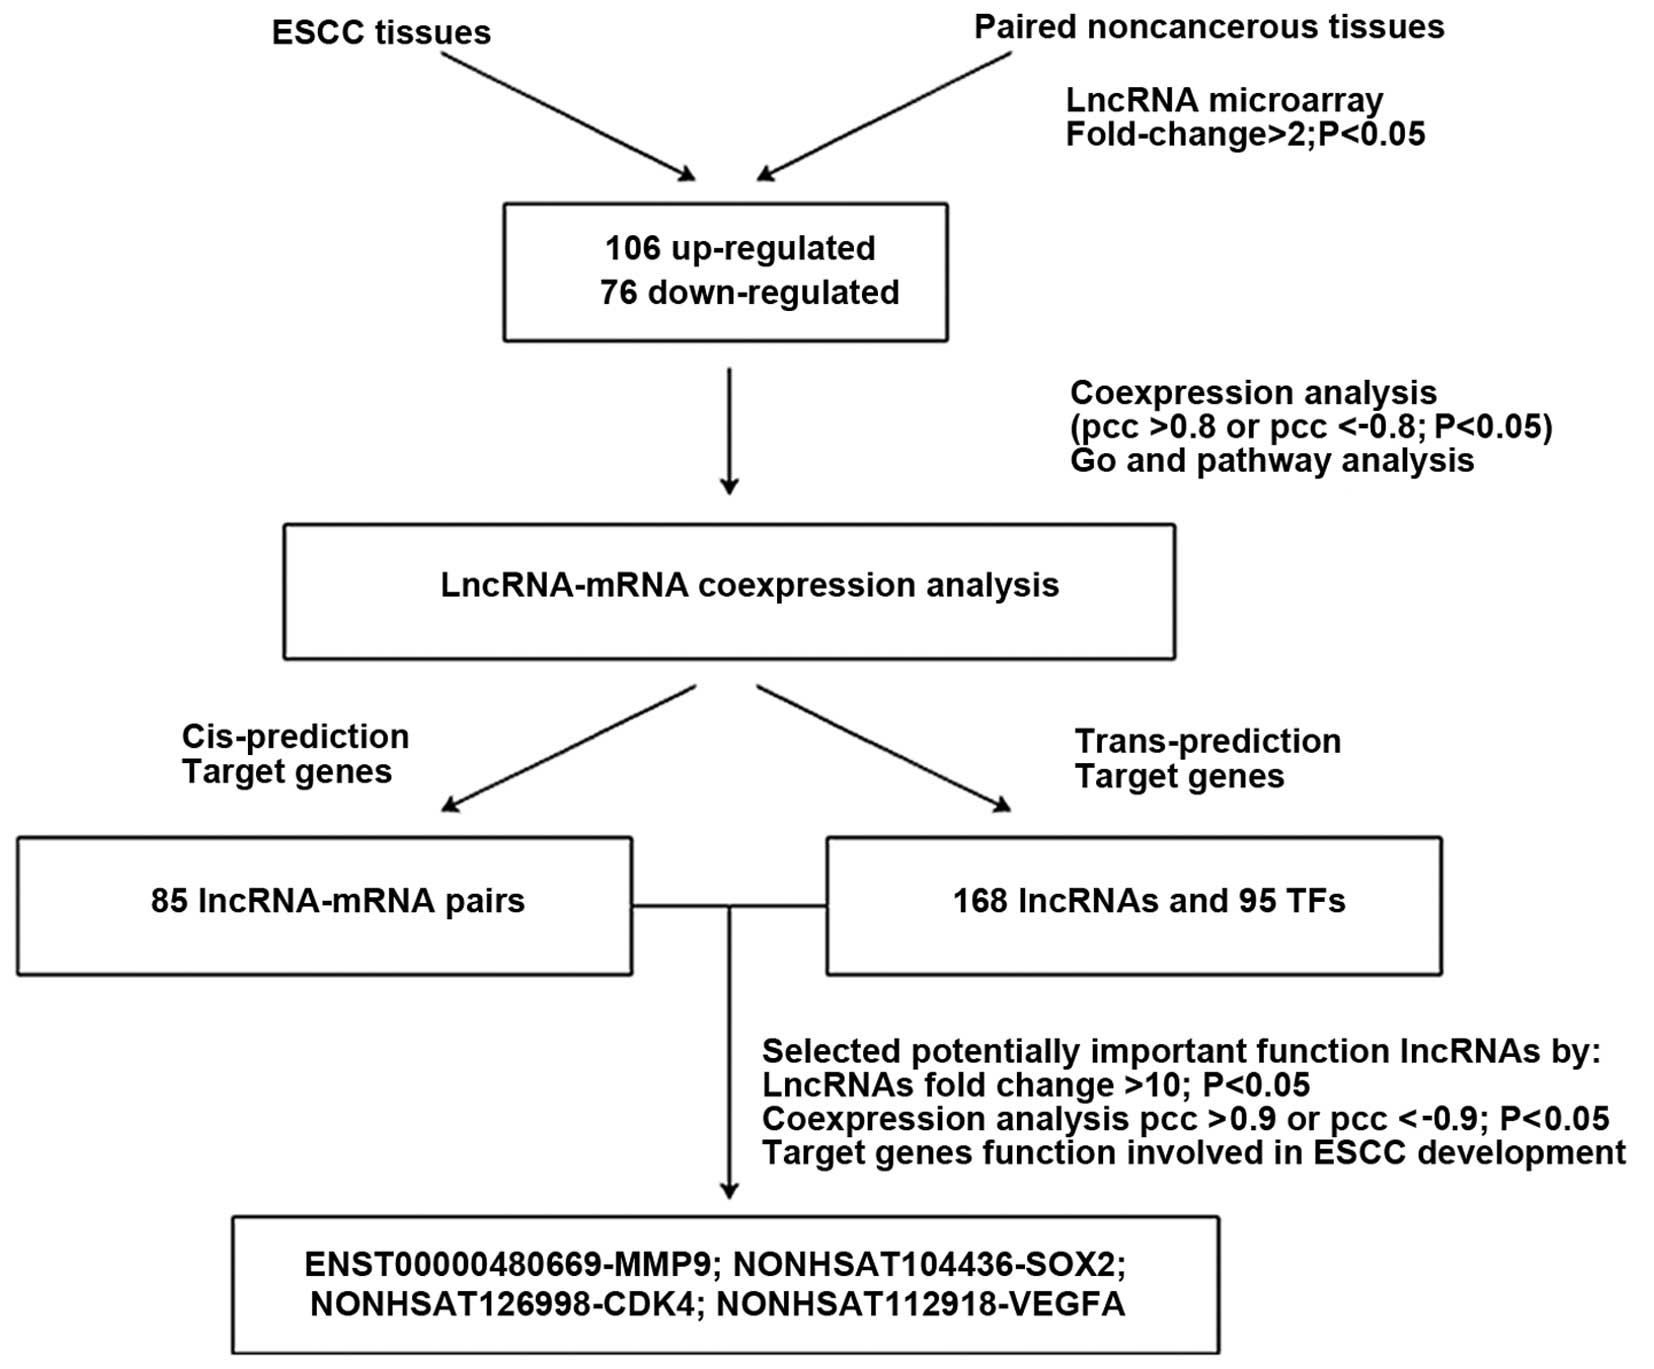
Target gene predictions
The regulatory roles of lncRNA on target genes were
mediated by cis- and trans-regulatory mechanisms
(22,23). In this study, the cis
analysis indicated 50 lncRNAs regulated 85 mRNAs (Table VI). Among these target genes,
biological function of VEGFA and WISP1 have been reported in ESCC,
and their paired lncRNAs were NONHSAT112918 and NR_037944.1,
respectively. Considering the trans-regulatory mechanisms,
differentially expressed IncRNAs co-expressed mRNA enrichment in
TFs terms indicated that lncRNAs may be mostly regulated by the 20
TFs (Fig. 3). It has been reported
in the literature that these TFs SP1, E2F1 and BCLAF1 were related
with ESCC development (24–26).
Analyzing the relationship between lncRNAs and TFs, we found that
the three TFs closely related to 22 lncRNAs, and which indicated
that they may have important function in ESCC. To further explore
potential biological roles of lncRNAs in ESCC, we selected lncRNAs
based on FC value >10 and lncRNA-mRNA co-expression analysis
PCCs >0.90. The co-expressed coding genes should accord with GO
and KEGG terms enrichment such as cell differentiation,
ECM-receptor interaction, cell proliferation, pathway in cancer.
Their target genes biological functions had been reported in ESCC
in numerous cases. Ultimately, we selected four lncRNAs
ENST00000480669, NONHSAT104436, NONHSAT126998 and NONHSAT112918,
and the target genes were MMP9, SOX2, CDK4, and VEGFA,
respectively. The screening process was as showed in Fig. 6.
Association analysis of lncRNAs with
clinicopathological characteristics
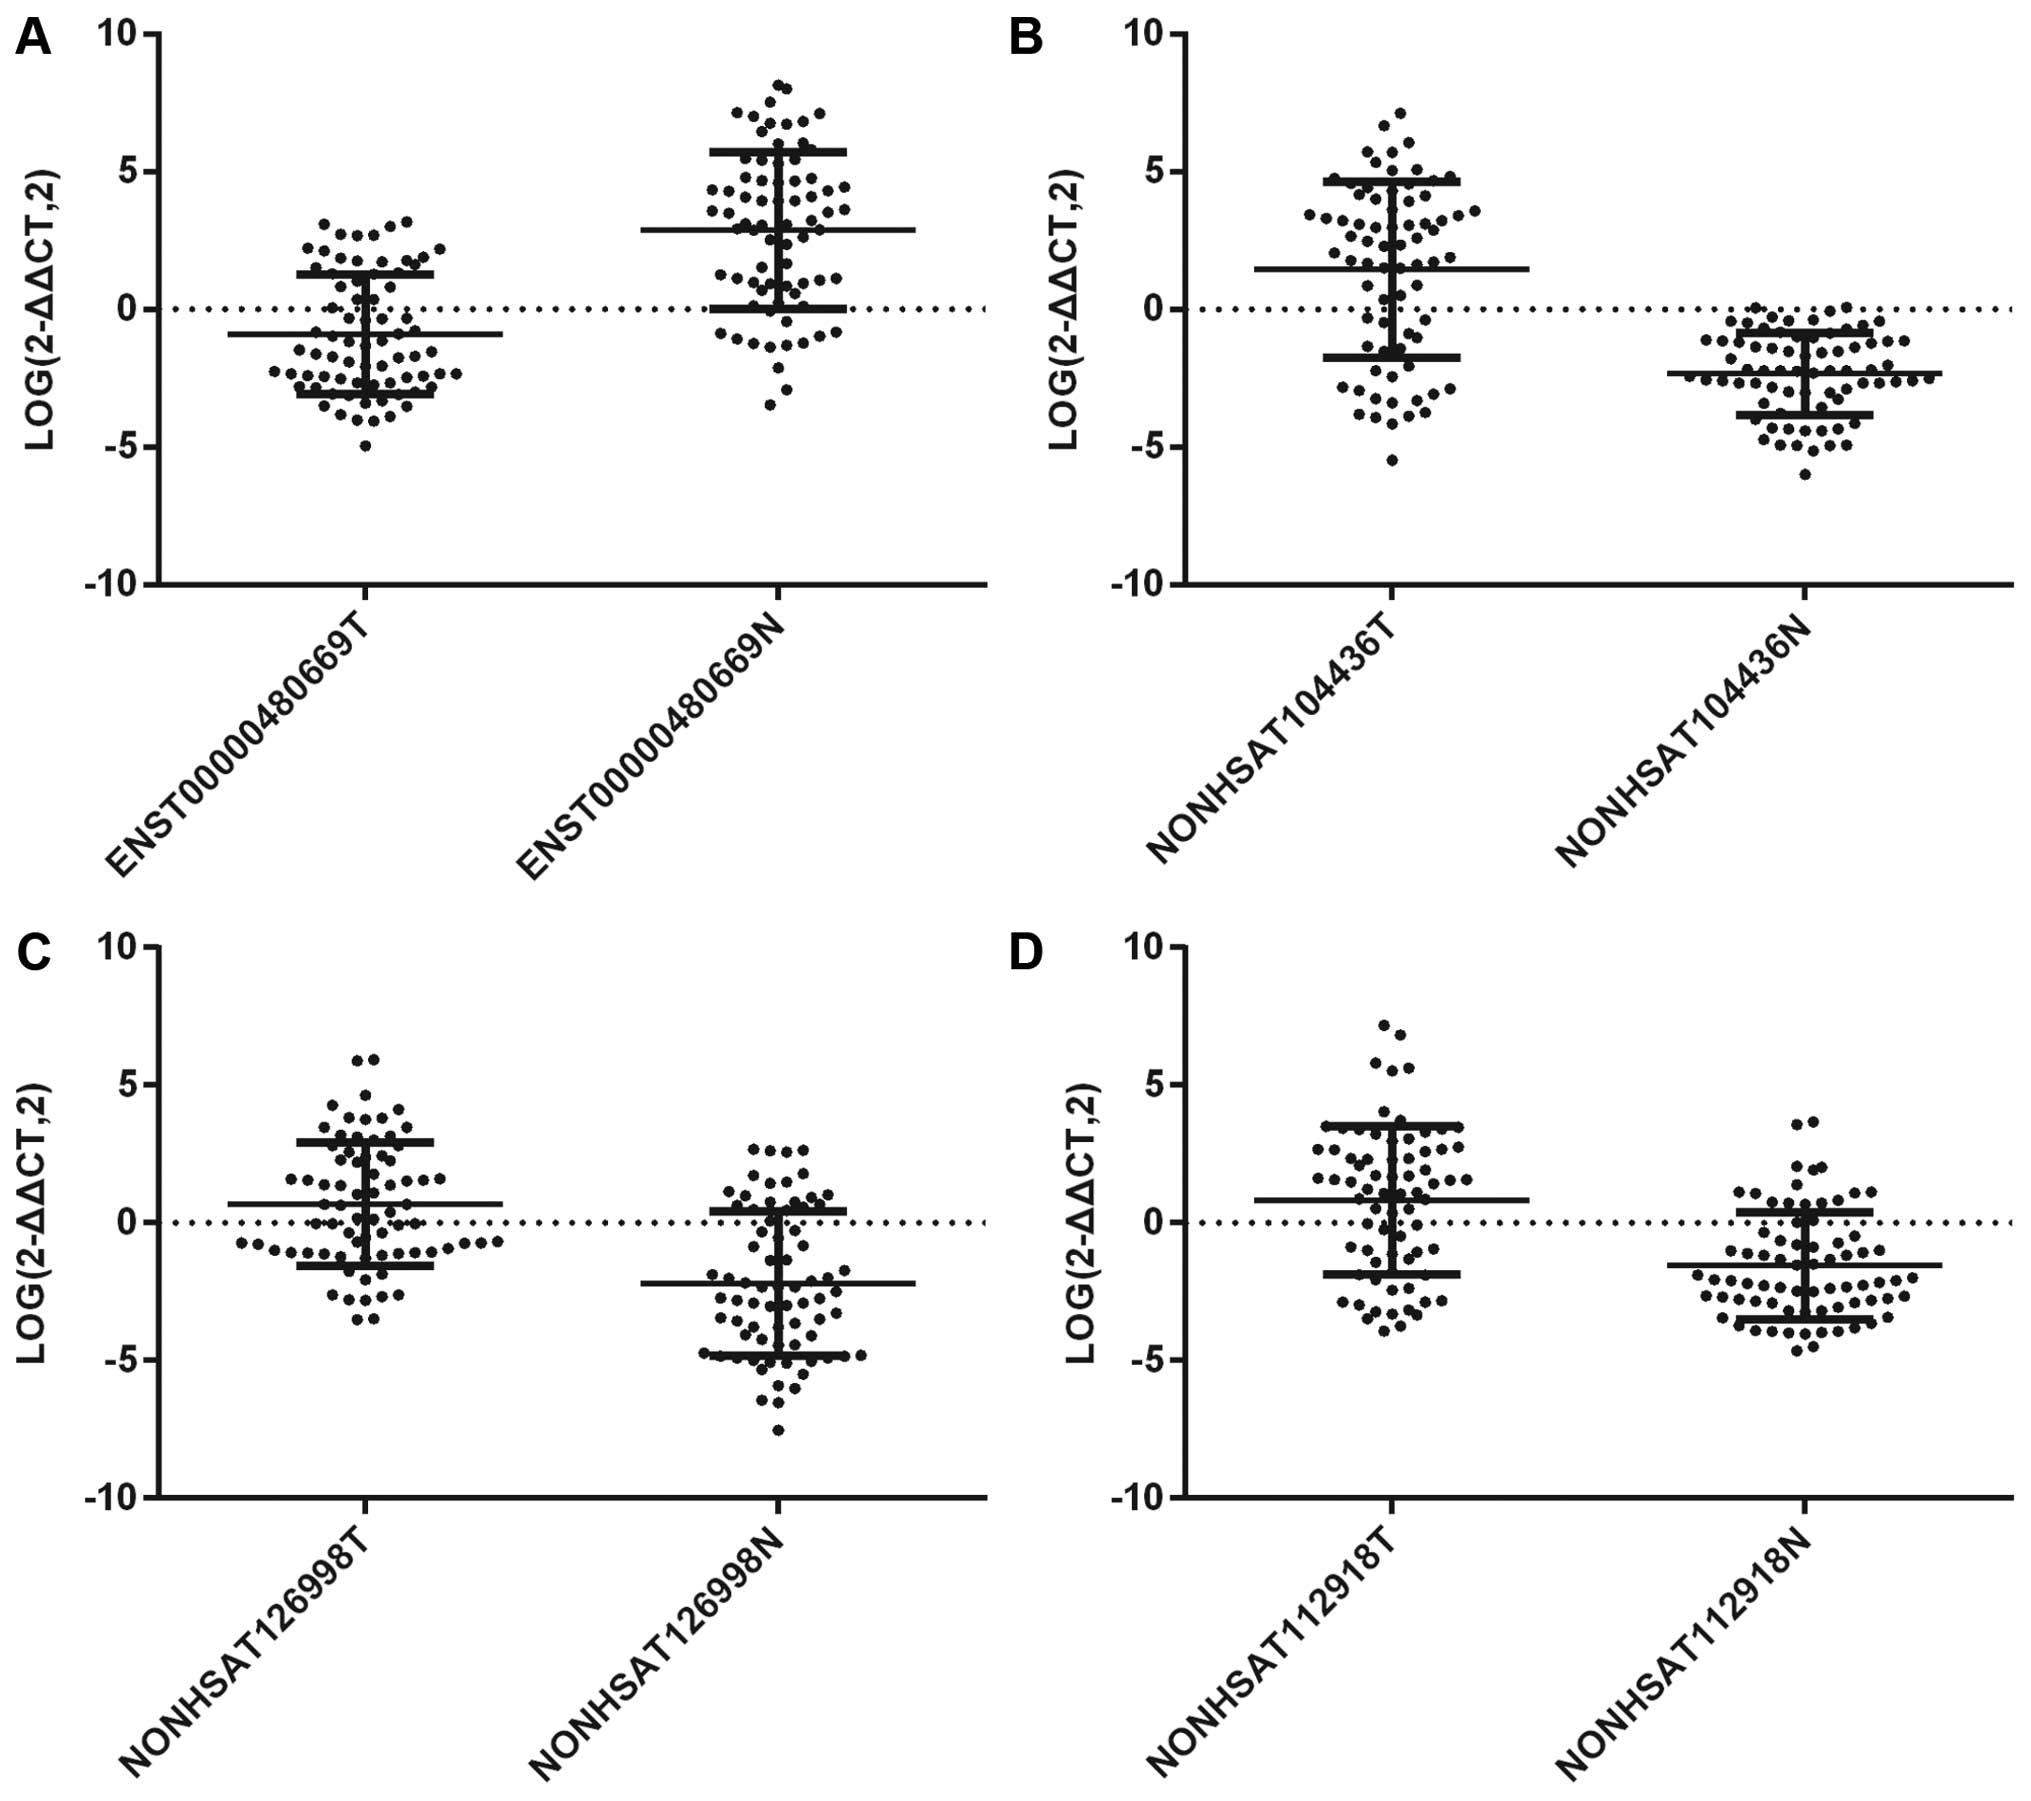
To better understand the roles of lncRNAs in ESCC,
we first checked the expression levels of the 4 lncRNAs
(ENST00000480669, NONHSAT104436, NONHSAT126998 and NONHSAT112918).
The expression of lncRNAs were quantified via RT-PCR converting the
2−ΔΔCt to log (2−ΔΔCt) values in ESCC tissues
and matched non-cancerous tissues (Fig. 7). The data demonstrated that the
expression pattern of the four selected lncRNAs analyzed by
microarray was consistent with that done by RT-PCR. We next
compared the expression levels of these genes with some specific
clinicopathological characteristics. The results are listed in
Tables VII and VIII. ENST00000480669 was significantly
related to lymph node metastasis (P=0.026). NONHSAT104436 was
significantly related to distant metastasis (P=0.008).
NONHSAT126998 was significantly related to lymph node metastasis
(P=0.010) and TNM stage (P=0.019). In addition, NONHSAT112918 was
significantly related to tumor infiltrating stage (P=0.034).
| Table VIIThe relationship between clinical
features and the expression level of lncRNA ENST00000480669 and
NONHSAT104436 in 73 patients with ESCC. |
Table VII
The relationship between clinical
features and the expression level of lncRNA ENST00000480669 and
NONHSAT104436 in 73 patients with ESCC.
| |
ENST00000480669 | NONHSAT104436 |
|---|
| |
|
|
|---|
| Variable | N | Mean ± SD | P-value | Mean ± SD | P-value |
|---|
| Age (years) | | | | | |
| ≥60 | 43 | −0.94±2.15 | 0.863 | 1.51±3.05 | 0.815 |
| <60 | 30 | −0.85±2.25 | | 1.33±3.42 | |
| Gender | | | | | |
| Male | 55 | −0.81±2.14 | 0.506 | 1.74±3.03 | 0.156 |
| Female | 18 | −1.20±2.31 | | 0.51±3.53 | |
| Tumor size
(cm) | | | | | |
| ≤5 | 47 | −0.89±2.28 | 0.953 | 1.38±3.34 | 0.837 |
| >5 | 26 | −0.93±2.01 | | 1.54±2.93 | |
| T stage | | | | | |
| T1–2 | 24 | −0.54±2.40 | 0.318 | 0.51±3.12 | 0.081 |
| T3–4 | 49 | −1.08±2.06 | | 1.89±3.14 | |
| N stage | | | | | |
| N0 | 38 | −0.37±2.36 | 0.026 | 0.91±3.24 | 0.141 |
| N1 | 35 | −1.48±1.81 | | 2.01±3.06 | |
| M stage | | | | | |
| M0 | 62 | −0.80±2.26 | 0.221 | 1.03±3.12 | 0.008 |
| M1 | 11 | −1.50±1.56 | | 3.76±2.56 | |
| TNM stage | | | | | |
| I–II | 39 | −0.50±2.37 | 0.086 | 0.75±3.22 | 0.046 |
| III–IV | 34 | −1.37±1.86 | | 2.23±2.99 | |
| Table VIIIThe relationship between clinical
features and the expression level of lncRNA NONHSAT126998 and
NONHSAT112918 in 73 patients with ESCC. |
Table VIII
The relationship between clinical
features and the expression level of lncRNA NONHSAT126998 and
NONHSAT112918 in 73 patients with ESCC.
| | NONHSAT126998 | NONHSAT112918 |
|---|
| |
|
|
|---|
| Variable | N | Mean ± SD | P-value | Mean ± SD | P-value |
|---|
| Age (years) | | | | | |
| ≥60 | 43 | 0.85±2.73 | 0.918 | 0.95±2.38 | 0.229 |
| <60 | 30 | 0.79±2.68 | | 0.31±2.01 | |
| Gender | | | | | |
| Male | 55 | 0.98±2.66 | 0.384 | 0.68±2.37 | 0.992 |
| Female | 18 | 0.34±2.81 | | 0.69±1.84 | |
| Tumor size
(cm) | | | | | |
| ≤5 | 47 | 0.80±2.82 | 0.894 | 0.51±1.96 | 0.423 |
| >5 | 26 | 0.88±2.50 | | 1.00±2.69 | |
| T stage | | | | | |
| T1–2 | 24 | 0.27±3.01 | 0.221 | 0.13±2.12 | 0.034 |
| T3–4 | 49 | 1.10±2.51 | | 1.36±2.27 | |
| N stage | | | | | |
| N0 | 38 | 0.06±2.69 | 0.010 | 0.87±2.04 | 0.462 |
| N1 | 35 | 1.66±2.47 | | 0.48±2.45 | |
| M stage | | | | | |
| M0 | 62 | 0.71±2.78 | 0.387 | 0.73±2.22 | 0.713 |
| M1 | 11 | 1.48±2.08 | | 0.45±2.47 | |
| TNM stage | | | | | |
| I–II | 39 | 0.15±2.66 | 0.019 | 0.72±2.07 | 0.880 |
| III–IV | 34 | 1.61±2.55 | | 0.64±2.45 | |
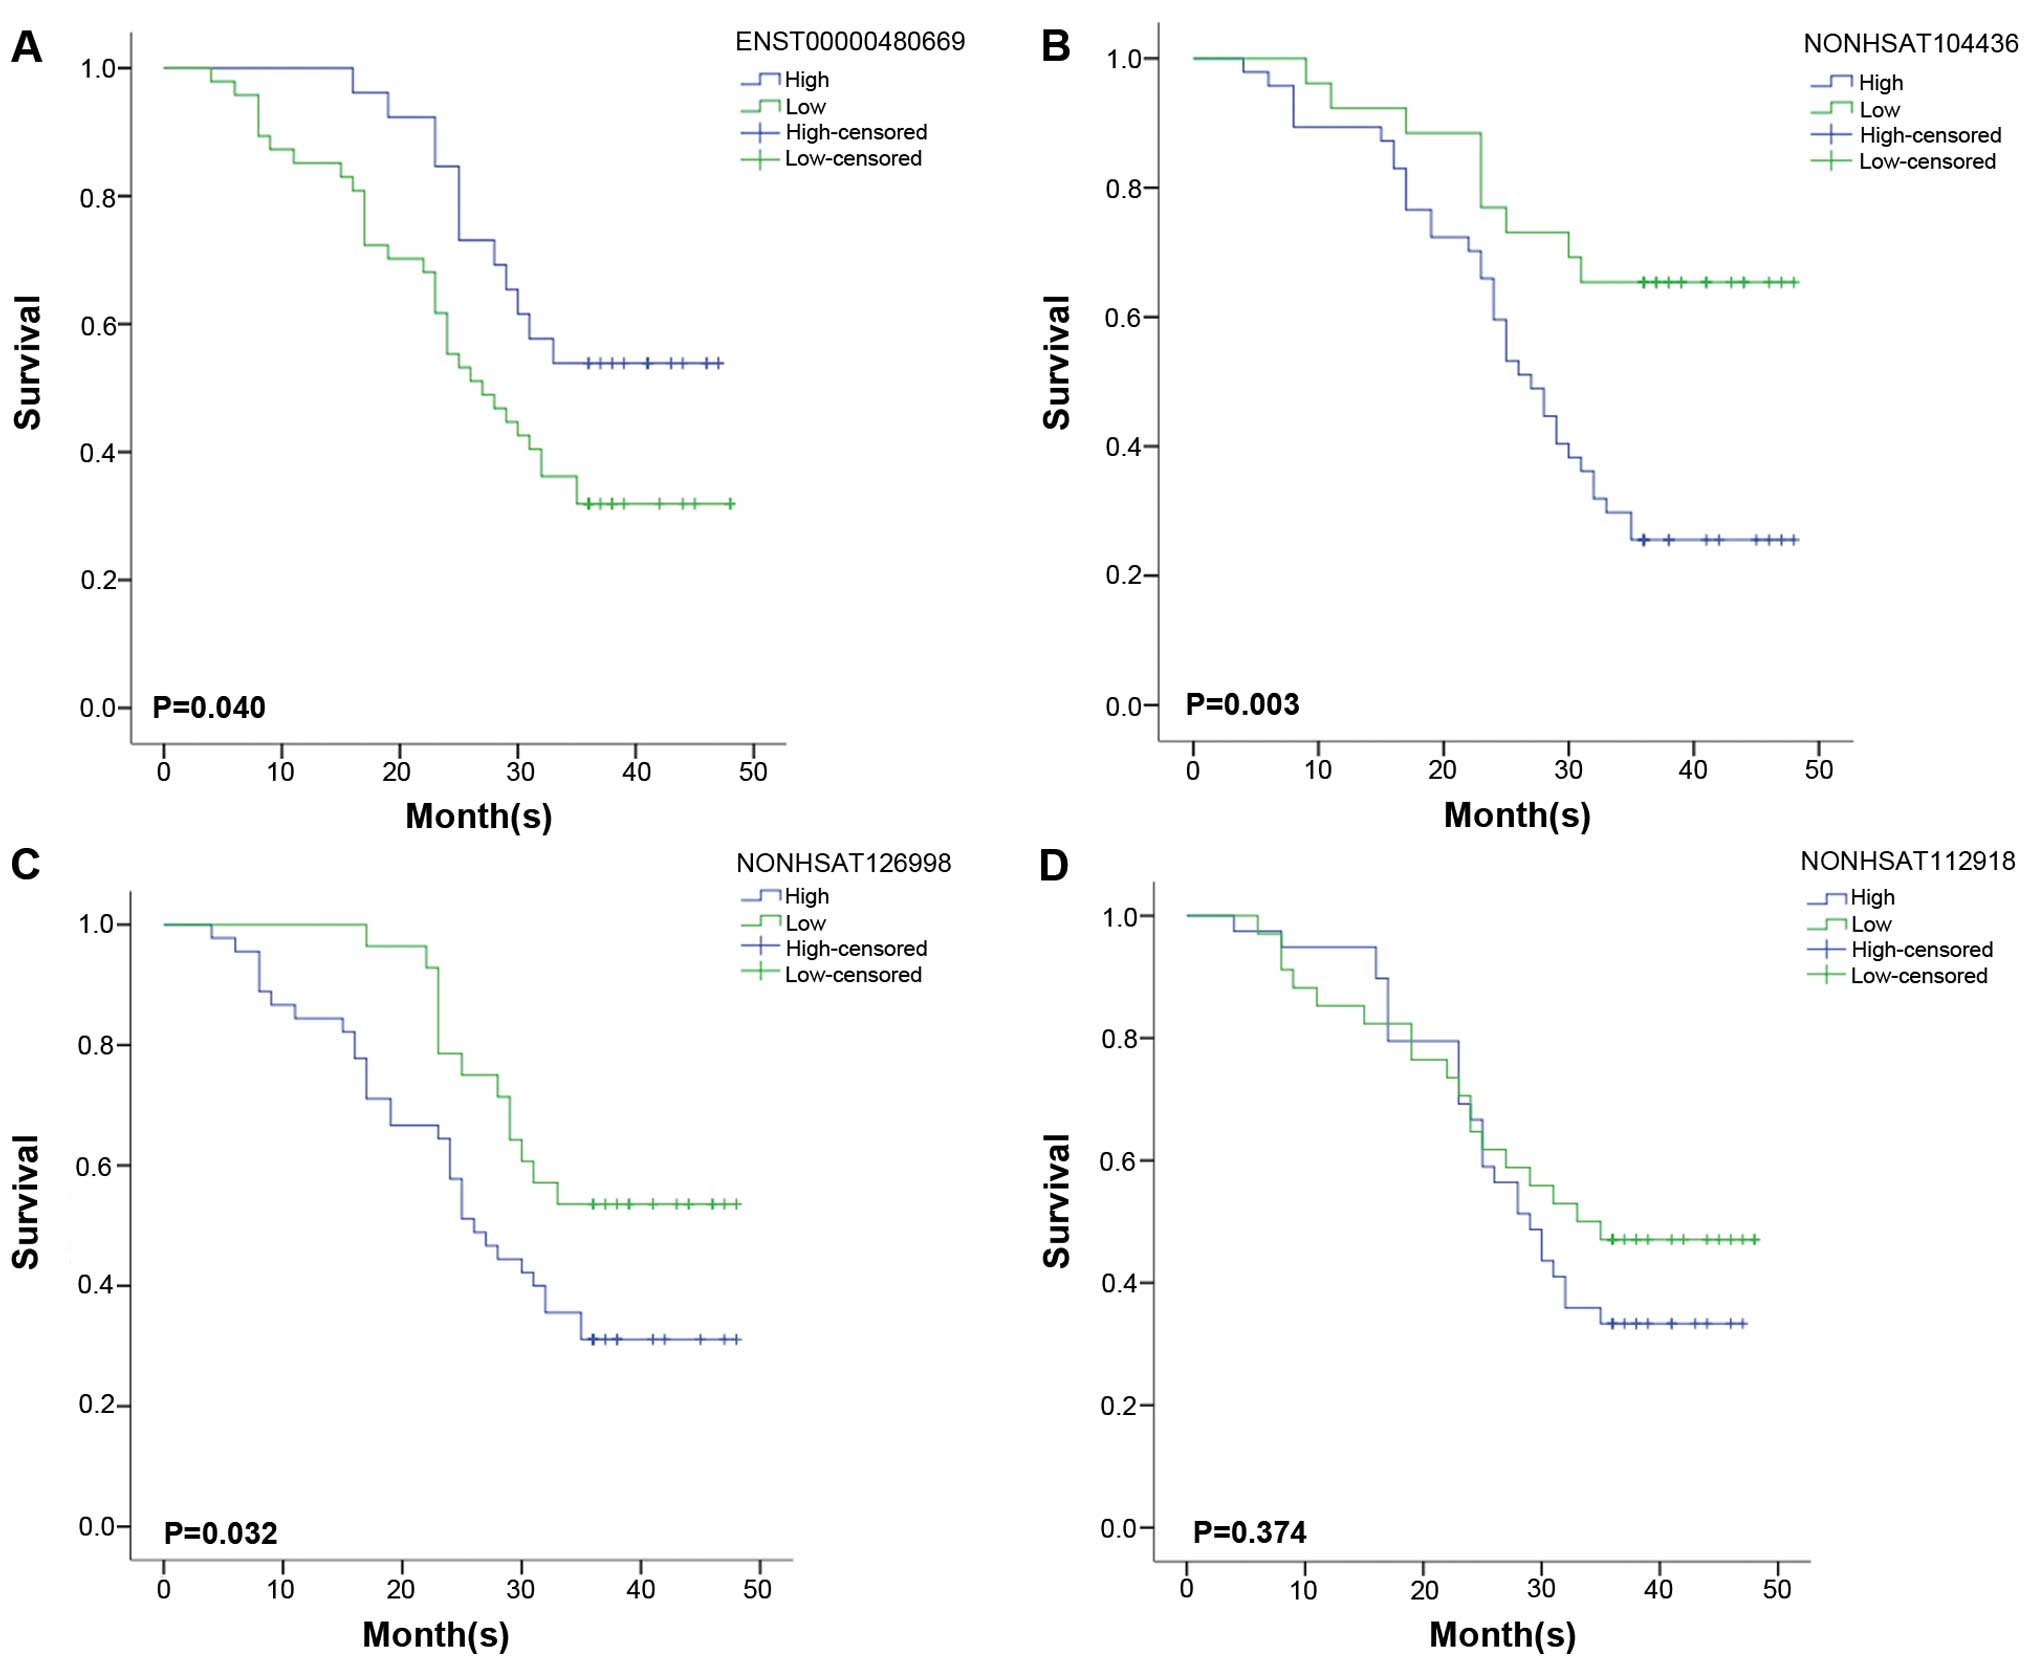
Correlations between lncRNA expression
and ESCC prognosis
Univariate survival analysis was used to evaluate
the relationship between the lncRNA expression level and cancer
prognosis. There were no samples excluded from the univariate
survival analysis during the three years of follow-up. The 3-year
overall survival rate of 73 patients was 39.7%. The outcome of
statistical analysis showed that the cumulative overall survival
rate was poor with high expression of NONHSAT104436 and
NONHSAT126998. The 3-year survival rate for ESCC patients with high
expression of NONHSAT104436 was 25.5%, whereas, the patients with
NONHSAT104436 low expression had a 3-year survival rate of 65.4%
(P=0.003, Fig. 8). The results of
NONHSAT126998 were similar to that of NONHSAT104436. The patients
with high expression of NONHSAT126998 had a poorer 3-year survival
rate (31.1.0%) than the patients with low expression of
NONHSAT126998 (53.6%; P=0.032, Fig.
8). On the contrary, the findings of ENST00000480669 were
different from NONHSAT104436 and NONHSAT126998, i.e., patients with
high expression of ENST00000480669 gained a relatively higher
3-year survival rate (53.8%) than patients with low expression of
ENST00000480669 (31.9%; P=0.040, Fig.
8). There was no statistical significance for the overall
survival rate between high expression and low expression of
NONHSAT112918 (P=0.374). Three-year survival rate for high and low
expression was 33.3 and 41.7%, respectively (Fig. 8). From the multivariate Cox
regression analysis, only NONHSAT104436 was an independent
prognostic factor (P=0.017; 95% CI, 1.226–8.123; Table IX).
| Table IXMultivariate Cox regression analysis
for ENST00000480669, NONHSAT104436, NONHSAT126998 and
NONHSAT112918. |
Table IX
Multivariate Cox regression analysis
for ENST00000480669, NONHSAT104436, NONHSAT126998 and
NONHSAT112918.
| | | | | | 95% CI for
Exp(B) |
|---|
| | | | | |
|
|---|
| B | SE | Wald | Sig. | Exp(B) | Lower | Upper |
|---|
|
ENST00000480669 | −0.597 | 0.377 | 2.513 | 0.113 | 0.550 | 0.263 | 1.152 |
| NONHSAT104436 | 1.149 | 0.482 | 5.675 | 0.017 | 3.156 | 1.226 | 8.123 |
| NONHSAT126998 | −0.279 | 0.460 | 0.367 | 0.545 | 0.757 | 0.773 | 2.598 |
| NONHSAT112918 | 0.349 | 0.309 | 1.273 | 0.259 | 1.417 | 0.307 | 1.865 |
Discussion
Recently, lncRNAs were reported to be involved in
numerous biological process and be connected with various diseases,
such as cancer (27–29), and many lncRNAs play critical roles
in regulating gene expression (30,31).
Since AFAP1-AS1 (an lncRNA transcript) was demonstrated
differentially expressed in esophageal adenocarcinoma, an
increasing number of aberrant expression of lncRNAs have been
reported in esophageal cancer (32). However, the understanding of the
genome-wide expression patterns and functions of lncRNAs in ESCC is
still limited.
In this study, we examined the profiles of lncRNA
expression in ESCC tissues and matched non-cancerous tissues by
microarray assay and identified 182 lncRNAs with statistically
significant different expression patterns. Then, we performed an
integrated analysis of these lncRNAs, concentrating on lncRNA
co-expressed gene analyses, gene ontology and pathway analyses,
target gene prediction analyses to explore their potential function
and target genes in ESCC. Finally, we selected four dysregulated
lncRNAs (ENST00000480669, NONHSAT104436, NONHSAT126998 and
NONHSAT112918) to validate their expression patterns in patients
with ESCC by qRT-PCR. The four lncRNAs showed significant
correlation to certain clinicopathological features, including
lymph node metastasis, tumor infiltrating stage, distant metastasis
and TNM stage. ENST00000480669, NONHSAT104436 and NONHSAT126998
were related to the prognosis of ESCC in cancer patients. Among the
four aberrant lncRNAs, only NONHSAT104436 was an independent
prognostic factor.
It is known that the expression of a single lncRNA
could be correlated with hundreds of coding genes. Therefore, it is
a big challenge to decipher the functions of lncRNAs. Compelling
evidence has shown that similar expression patterns of genes
potentially shared related functions or were involved in the same
biological pathways (33,34). The GO concept used a common
vocabulary to query and retrieve gene and gene product based on
their core biological functions through a dynamic and flexible way
in multiple organisms (35). Here,
we constructed coexpression of coding-non-coding genes and used GO
and pathway analysis to predict the lncRNA functions in ESCC. Based
on our data, the main enriched biological processes in predicting
differently expressed lncRNAs were closely tied up to ESCC
development and progression, such as ‘extracellular matrix’,
‘immune responses’, ‘cell differentiation’, ‘cell proliferation’.
In the above main enriched terms from GO analysis, the most
significant GO term in biological processes was ‘extracellular
matrix’, indicating that dysregulated lncRNAs could play the
leading role in regulating extracellular matrix expression. While
the extracellular matrix is the first barrier to hold back the
metastasis of tumor, based on the significant KEGG pathways
analyses, the most correlated pathways were ‘cell cycle’,
‘ECM-receptor interaction’, ‘pathways in cancer’, ‘TGF-β signaling
pathway’ and ‘transcriptional misregulation in cancer’, which also
proved that the aberrant lncRNAs may play an crucial role in ESCC
development and progression. In these lncRNAs, NONHSAT104436 drew
our attention, as it was the most upregulated in the 182
significantly differently expressed lncRNAs, and it was
significantly associated with SOX2 (PCC, −0.99), whose function has
been confirmed in ESCC and was consistent with GO and pathway
analysis.
Because of the diverse and complex functions of the
lncRNAs, the molecular regulatory mechanisms of lncRNAs remain
unknown. The function of lncRNAs has been reported to regulate
their own transcriptions or their neighboring coding genes by
cis-regulatory mechanisms (36,37),
which was regarded as an lncRNA intrinsic capacity (38). The cis-regulatory mechanism
was reported to be used as one of the methods to predict the lncRNA
target genes (23). In this study,
there are 50 significantly different expressed lncRNAs that
regulate 85 mRNAs by cis regulatory mechanisms. With regard
to their expression changes, 74 pairs demonstrated positive
correlation, and 11 pairs have negative correlation. Among these
genes, VEGFA was the cis gene of lncRNA NONHSAT112918, and
its biological function has been confirmed in ESCC by a large
number of scientific studies. As the target genes were regulated by
each corresponding lncRNA, expression change of lncRNAs in ESCC
tissue may influence the expression of the target genes, and these
lncRNAs may affect ESCC development and progression. Through
analyzing the cis, we may gain the target genes of lncRNAs
and more information about their regulatory mechanisms in ESCC.
However, the lncRNA co-expressed encoding genes
mostly lie in different regions of the same chromosome, or even in
different chromosomes. So it is not enough to predict the target
gene of lncRNAs by using the cis regulation mechanism only.
The trans regulation mechanism of lncRNAs can regulate the
expression of target genes on a different locus. It was reported
that many lncRNAs interact with transcription factors, and
increasing evidence proves the trans mechanism in lncRNAs.
Jiang et al and Yang et al developed web-based tools
to provide integrated views for common transcription factors and
lncRNA genes based on ChIP-Seq data (39,40).
Lopez-Pajares et al constructed an lncRNA-TF network for
epidermal differentiation (41).
Based on trans-regulatory mechanism, this study demonstrated
168 lncRNAs were regulated by 95 TFs. Through cluster analysis, we
found most of the aberrant IncRNAs co-expressed mRNAs enriched in
20 TFs, which may play an important role in regulating lncRNA
expression in ESCC. Three TFs E2F1, BCLAF1 and SP1 of the above 20
TFs have been reported in ESCC (24–26).
The biological meaning of the elevated expression of TFs GTF2F1,
SIN3A and IRF3 in ESCC remain to be validated. We explored the
relationship of lncRNA-TFs and lncRNA-TFs-target genes. The results
showed lncRNAs ENST00000480669 and NONHSAT126998 were significantly
associated with E2F1 and BCLAF1, which indicated that they may have
important function in ESCC.
Aberrant lncRNAs have been reported to be involved
in tumorigenesis, invasion and metastasis (15–17).
Investigating differential expression of lncRNAs in various tumor
tissues may provide new understanding for cancer diagnosis,
prognosis and targeted therapy. For instance, the lncRNA HOTAIR
expression was elevated in primary and metastasizing breast tumors,
and the expression level of HOTAIR in primary tumors was a strong
predictor of final metastasis and prognosis (29). Li et al suggested that a
three-lncRNA signature containing lncRNAs XLOC_013014,
ENST00000435885.1 and ENST00000547963.1 was a novel biomarker for
the prognosis of ESCC (42).
High-throughput cancer genome sequencing also have identified
valuable biomarkers in ESCC (4,43).
In this study, we first reported four lncRNAs whose coding genes
had been proved positively correlated with ESCC and the
relationship among those four lncRNAs and clinical
clinicopathological features, prognosis were analyzed in 73
patients with ESCC. We discovered all the four were significantly
related with one or more clinicopathological features. More
importantly, the ESCC patients with high expression of
NONHSAT104436 were vulnerable to cancer metastasis. Further
univariate survival analysis demonstrated that ESCC patients with
low expression of ENST00000480669 had a markedly decreased survival
rate in a 3-year survey. In addition, ESCC patients with low
expression of NONHSAT126998 or NONHSAT104436 had a better
prognosis. These results indicate that ENST00000480669,
NONHSAT104436 and NONHSAT126998 were worth exploring in predicting
prognosis for ESCC patients. Significantly, in the multivariate
analysis, the retrospective study of 73 ESCC patients indicated
that NONHSAT104436 was the only independent prognostic factor in
ESCC. This result provides that NONHSAT104436 may be a promising
biomarker for diagnosis and prognosis of ESCC.
Acknowledgements
This study was supported by the Health Foundation
(grant no. H201260) of Jiangsu Province, China, the Social
Development Foundation (Grant no. TS029) of Taizhou municipal
government, China. The authors are grateful to Dr Xueliang Han, for
his assistance with the manuscript preparation.
References
|
1
|
Jemal A, Bray F, Center MM, Ferlay J, Ward
E and Forman D: Global cancer statistics. CA Cancer J Clin.
61:69–90. 2011. View Article : Google Scholar : PubMed/NCBI
|
|
2
|
Chen W, Zheng R, Zeng H, Zhang S and He J:
Annual report on status of cancer in China, 2011. Chin J Cancer
Res. 27:2–12. 2015. View Article : Google Scholar : PubMed/NCBI
|
|
3
|
Gao Y, Hu N, Han X, Giffen C, Ding T,
Goldstein A and Taylor P: Family history of cancer and risk for
esophageal and gastric cancer in Shanxi, China. BMC Cancer.
9:2692009. View Article : Google Scholar : PubMed/NCBI
|
|
4
|
Song Y, Li L, Ou Y, Gao Z, Li E, Li X,
Zhang W, Wang J, Xu L, Zhou Y, et al: Identification of genomic
alterations in oesophageal squamous cell cancer. Nature. 509:91–95.
2014. View Article : Google Scholar : PubMed/NCBI
|
|
5
|
Bartel DP: MicroRNAs: Genomics,
biogenesis, mechanism, and function. Cell. 116:281–297. 2004.
View Article : Google Scholar : PubMed/NCBI
|
|
6
|
Lewis BP, Burge CB and Bartel DP:
Conserved seed pairing, often flanked by adenosines, indicates that
thousands of human genes are microRNA targets. Cell. 120:15–20.
2005. View Article : Google Scholar : PubMed/NCBI
|
|
7
|
Png KJ, Halberg N, Yoshida M and Tavazoie
SF: A microRNA regulon that mediates endothelial recruitment and
metastasis by cancer cells. Nature. 481:190–194. 2011. View Article : Google Scholar : PubMed/NCBI
|
|
8
|
Isozaki Y, Hoshino I, Akutsu Y, Hanari N,
Mori M, Nishimori T, Murakami K, Akanuma N, Takeshita N, Maruyama
T, et al: Usefulness of microRNA-375 as a prognostic and
therapeutic tool in esophageal squamous cell carcinoma. Int J
Oncol. 46:1059–1066. 2015.
|
|
9
|
Spizzo R, A1meida MI, Colombatti A and
Calin GA: Long non-coding RNAs and cancer: A new frontier of
translational research? Oncogene. 3 l:4577–4587. 2012. View Article : Google Scholar
|
|
10
|
Necsulea A, Soumillon M, Warnefors M,
Liechti A, Daish T, Zeller U, Baker JC, Grützner F and Kaessmann H:
The evolution of lncRNA repertoires and expression patterns in
tetrapods. Nature. 505:635–640. 2014. View Article : Google Scholar : PubMed/NCBI
|
|
11
|
Yang L, Duff MO, Graveley BR, Carmichael
GG and Chen LL: Genome-wide characterization of non-polyadenylated
RNAs. Genome Biol. 12:R162011. View Article : Google Scholar
|
|
12
|
Caley DP, Pink RC, Trujillano D and Carter
DR: Long non-coding RNAs, chromatin, and development. Sci World J.
10:90–102. 2010. View Article : Google Scholar
|
|
13
|
Mercer TR, Dinger ME and Mattick JS: Long
non-coding RNAs: Insights into functions. Nat Rev Genet.
10:155–159. 2009. View
Article : Google Scholar : PubMed/NCBI
|
|
14
|
Guttman M, Amit I, Garber M, French C, Lin
MF, Feldser D, Huarte M, Zuk O, Carey BW, Cassady JP, et al:
Chromatin signature reveals over a thousand highly conserved large
non-coding RNAs in mammals. Nature. 458:223–227. 2009. View Article : Google Scholar : PubMed/NCBI
|
|
15
|
Yuan JH, Yang F, Wang F, Ma JZ, Guo YJ,
Tao QF, Liu F, Pan W, Wang TT, Zhou CC, et al: A long non-coding
RNA activated by TGF-β promotes the invasion-metastasis cascade in
hepatocellular carcinoma. Cancer Cell. 25:666–681. 2014. View Article : Google Scholar : PubMed/NCBI
|
|
16
|
Gupta RA, Shah N, Wang KC, Kim J, Horlings
HM, Wong DJ, Tsai MC, Hung T, Argani P, Rinn JL, et al: Long
non-coding RNA HOTAIR reprograms chromatin state to promote cancer
metastasis. Nature. 464:1071–1076. 2010. View Article : Google Scholar : PubMed/NCBI
|
|
17
|
Qiu JJ, Lin YY, Ding JX, Feng WW, Jin HY
and Hua KQ: Long non-coding RNA ANRIL predicts poor prognosis and
promotes invasion/metastasis in serous ovarian cancer. Int J Oncol.
46:2497–2505. 2015.PubMed/NCBI
|
|
18
|
Yang H, Liu Z, Yuan C, Zhao Y, Wang L, Hu
J, Xie D, Wang L and Chen D: Elevated JMJD1A is a novel predictor
for prognosis and a potential therapeutic target for gastric
cancer. Int J Clin Exp Pathol. 8:11092–11099. 2015.PubMed/NCBI
|
|
19
|
Kim K, Jutooru I, Chadalapaka G, Johnson
G, Frank J, Burghardt R, Kim S and Safe S: HOTAIR is a negative
prognostic factor and exhibits pro-oncogenic activity in pancreatic
cancer. Oncogene. 32:1616–1625. 2013. View Article : Google Scholar
|
|
20
|
Martínez-Fernández M, Rubio C, Segovia C,
López-Calderón FF, Dueñas M and Paramio JM: EZH2 in Bladder Cancer,
a Promising Therapeutic Target. Int J Mol Sci. 16:27107–27132.
2015. View Article : Google Scholar : PubMed/NCBI
|
|
21
|
Gerstein MB, Kundaje A, Hariharan M, Landt
SG, Yan KK, Cheng C, Mu XJ, Khurana E, Rozowsky J, Alexander R, et
al: Architecture of the human regulatory network derived from
ENCODE data. Nature. 489:91–100. 2012. View Article : Google Scholar : PubMed/NCBI
|
|
22
|
Guttman M and Rinn JL: Modular regulatory
principles of large non-coding RNAs. Nature. 482:339–346. 2012.
View Article : Google Scholar : PubMed/NCBI
|
|
23
|
Wang J, Xie H, Ling Q, et al:
Coding-non-coding gene expression in intrahepatic
cholangiocarcinoma. Transl Res. 168:107–121. 2016. View Article : Google Scholar
|
|
24
|
Lu XF, Li EM, Du ZP, Xie JJ, Guo ZY, Gao
SY, Liao LD, Shen ZY, Xie D and Xu LY: Specificity protein 1
regulates fascin expression in esophageal squamous cell carcinoma
as the result of the epidermal growth factor/extracellular
signal-regulated kinase signaling pathway activation. Cell Mol Life
Sci. 67:3313–3329. 2010. View Article : Google Scholar : PubMed/NCBI
|
|
25
|
Yeo SY, Ha SY, Yu EJ, Lee KW, Kim JH and
Kim SH: ZNF282 (Zinc finger protein 282), a novel E2F1
co-activator, promotes esophageal squamous cell carcinoma.
Oncotarget. 5:12260–12272. 2014. View Article : Google Scholar : PubMed/NCBI
|
|
26
|
Chen Y, Wang Y, Song H, Wang J, Yang H,
Xia Y, Xue J, Li S, Chen M and Lu Y: Expression profile of
apoptosis-related genes potentially explains early recurrence after
definitive chemoradiation in esophageal squamous cell carcinoma.
Tumour Biol. 35:4339–4346. 2014. View Article : Google Scholar : PubMed/NCBI
|
|
27
|
Rinn JL and Chang HY: Genome regulation by
long non-coding RNAs. Annu Rev Biochem. 81:145–166. 2012.
View Article : Google Scholar
|
|
28
|
Chen G, Wang Z, Wang D, Qiu C, Liu M, Chen
X, Zhang Q, Yan G and Cui Q: LncRNADisease: A database for
long-non-coding RNA-associated diseases. Nucleic Acids Res.
41D:D983–D986. 2013. View Article : Google Scholar
|
|
29
|
Gutschner T and Diederichs S: The
hallmarks of cancer: A long non-coding RNA point of view. RNA Biol.
9:703–719. 2012. View Article : Google Scholar : PubMed/NCBI
|
|
30
|
Huarte M: LncRNAs have a say in protein
translation. Cell Res. 23:449–451. 2013. View Article : Google Scholar :
|
|
31
|
Nagano T and Fraser P: No-nonsense
functions for long non-coding RNAs. Cell. 145:178–181. 2011.
View Article : Google Scholar : PubMed/NCBI
|
|
32
|
Hao Y, Wu W, Shi F, Dalmolin RJ, Yan M,
Tian F, Chen X, Chen G and Cao W: Prediction of long non-coding RNA
functions with co-expression network in esophageal squamous cell
carcinoma. BMC Cancer. 15:1682015. View Article : Google Scholar
|
|
33
|
Lee HK, Hsu AK, Sajdak J, Qin J and
Pavlidis P: Coexpression analysis of human genes across many
microarray data sets. Genome Res. 14:1085–1094. 2004. View Article : Google Scholar : PubMed/NCBI
|
|
34
|
Eisen MB, Spellman PT, Brown PO and
Botstein D: Cluster analysis and display of genome-wide expression
patterns. Proc Natl Acad Sci USA. 95:14863–14868. 1998. View Article : Google Scholar : PubMed/NCBI
|
|
35
|
Ashburner M, Ball CA, Blake JA, Botstein
D, Butler H, Cherry JM, Davis AP, Dolinski K, Dwight SS, Eppig JT,
et al: The Gene Ontology Consortium: Gene ontology: Tool for the
unification of biology. Nat Genet. 25:25–29. 2000. View Article : Google Scholar : PubMed/NCBI
|
|
36
|
Wang KC, Yang YW, Liu B, Sanyal A,
Corces-Zimmerman R, Chen Y, Lajoie BR, Protacio A, Flynn RA, Gupta
RA, et al: A long non-coding RNA maintains active chromatin to
coordinate homeotic gene expression. Nature. 472:120–124. 2011.
View Article : Google Scholar : PubMed/NCBI
|
|
37
|
Guenzl PM and Barlow DP: Macro lncRNAs: A
new layer of cis-regulatory information in the mammalian genome.
RNA Biol. 9:731–741. 2012. View Article : Google Scholar : PubMed/NCBI
|
|
38
|
Lee JT: Lessons from X-chromosome
inactivation: Long ncRNA as guides and tethers to the epigenome.
Genes Dev. 23:1831–1842. 2009. View Article : Google Scholar : PubMed/NCBI
|
|
39
|
Jiang Q, Wang J, Wang Y, Ma R, Wu X and Li
Y: TF2LncRNA: Identifying common transcription factors for a list
of lncRNA genes from ChIP-Seq data. BioMed Res Int.
2014:3176422014. View Article : Google Scholar : PubMed/NCBI
|
|
40
|
Yang JH, Li JH, Jiang S, Zhou H and Qu LH:
ChIPBase: A database for decoding the transcriptional regulation of
long non-coding RNA and microRNA genes from ChIP-Seq data. Nucleic
Acids Res. 41(D1): D177–D187. 2013. View Article : Google Scholar :
|
|
41
|
Lopez-Pajares V, Qu K, Zhang J, Webster
DE, Barajas BC, Siprashvili Z, Zarnegar BJ, Boxer LD, Rios EJ, Tao
S, et al: A LncRNA-MAF:MAFB transcription factor network regulates
epidermal differentiation. Dev Cell. 32:693–706. 2015. View Article : Google Scholar : PubMed/NCBI
|
|
42
|
Li J, Chen Z, Tian L, Zhou C, He MY, Gao
Y, Wang S, Zhou F, Shi S, Feng X, et al: LncRNA profile study
reveals a three-lncRNA signature associated with the survival of
patients with oesophageal squamous cell carcinoma. Gut.
63:1700–1710. 2014. View Article : Google Scholar : PubMed/NCBI
|
|
43
|
Dulak AM, Stojanov P, Peng S, Lawrence MS,
Fox C, Stewart C, Bandla S, Imamura Y, Schumacher SE, Shefler E, et
al: Exome and whole-genome sequencing of esophageal adenocarcinoma
identifies recurrent driver events and mutational complexity. Nat
Genet. 45:478–486. 2013. View Article : Google Scholar : PubMed/NCBI
|